Spatio-Temporal Variability of Soil Water Content under Different Crop Covers in Irrigation Districts of Northwest China

1
Center for Agricultural Water Research in China, China Agricultural University, Beijing 100083, China
2
Department of Biological & Agricultural Engineering, and Zachry Department of Civil Engineering, Texas A & M University, College Station, TX 77843-2117, USA
*
Author to whom correspondence should be addressed.
Entropy 2017, 19(8), 410; https://doi.org/10.3390/e19080410
Submission received: 25 April 2017
/
Revised: 3 August 2017
/
Accepted: 4 August 2017
/
Published: 18 August 2017
(This article belongs to the Special Issue Entropy Applications in Environmental and Water Engineering)
Abstract
:The relationship between soil water content (SWC) and vegetation, topography, and climatic conditions is critical for developing effective agricultural water management practices and improving agricultural water use efficiency in arid areas. The purpose of this study was to determine how crop cover influenced spatial and temporal variation of soil water. During a study, SWC was measured under maize and wheat for two years in northwest China. Statistical methods and entropy analysis were applied to investigate the spatio-temporal variability of SWC and the interaction between SWC and its influencing factors. The SWC variability changed within the field plot, with the standard deviation reaching a maximum value under intermediate mean SWC in different layers under various conditions (climatic conditions, soil conditions, crop type conditions). The spatial-temporal-distribution of the SWC reflects the variability of precipitation and potential evapotranspiration (ET0) under different crop covers. The mutual entropy values between SWC and precipitation were similar in two years under wheat cover but were different under maize cover. However, the mutual entropy values at different depths were different under different crop covers. The entropy values changed with SWC following an exponential trend. The informational correlation coefficient (R0) between the SWC and the precipitation was higher than that between SWC and other factors at different soil depths. Precipitation was the dominant factor controlling the SWC variability, and the crop efficient was the second dominant factor. This study highlights the precipitation is a paramount factor for investigating the spatio-temporal variability of soil water content in Northwest China.
1. Introduction
Soil water content (SWC) varies both spatially and temporally. Characterizing the spatio-temporal variability of SWC is important for water management in agricultural irrigation [1]. The spatio-temporal variability of SWC is related to a number of factors, such as certain soil properties, topography, vegetation, and climate. The interactions among these factors control the spatio-temporal evolution of soil water content at different scales, including gully scale [2], plot scale [3,4,5], hillslope scale [6,7,8], catchment scale [9,10] and regional scale [11,12,13]. The factors that determine SWC depend on the environment of the area of study and the presence or absence of vegetative canopy [14] and the spatio-temporal variability of SWC affect vegetation coverage and density [15]. Investigations on agricultural watersheds have shown that topography, rainfall, and soil texture have mixed effects on SWC at the watershed and regional scales, and that land cover influences runoff, interception and evapotranspiration processes, and in turn, the soil water dynamics [5,16,17,18,19]. The spatial-temporal pattern of SWC can be obtained from measurements carried out in different experimental plots [3,4]. Differences in SWC can be small or significant at different soil depths [20,21].
Because of practical limitations, measurements of SWC for deep soil profiles are time consuming and costly [22]. Hence, only the near surface soil moisture has been investigated [3,4,16,23]. Examining the SWC variability in the upper 30 cm of the soil on a Mediterranean abandoned terrace in north-east Spain [24] showed that the spatial variability of SWC followed a bimodal pattern with increasing soil water content. Only a few studies have taken into account the SWC variability at different soil depths [23,25,26] and develop new high throughput approaches to measure soil water content in the field [27]. Soil water contents vary with depth due to the heterogeneity of environmental factors, such as water and energy input, soil texture [28] and genetic control of root architecture [29].
For investigating the spatio-temporal variability of SWC, both statistical and geostatistical methods have been applied using ground-based and remote sensing data [17,19,24,26]. A few studies have applied the entropy theory to investigate the spatio-temporal variability of SWC and dominant factors [30]. Singh developed an entropy theory for describing the one-dimensional movement of soil moisture in unsaturated soils, and tested the theory using experimental observations reported in the hydrologic literature [31]. Gaur and Mohanty used the Shannon entropy to assess the effect of different physical controls on the spatial mean and variability of soil moisture in Oklahoma and Iowa and found that for most soil moisture conditions [30], soil texture as opposed to vegetation and topography is the dominant physical control at both the point and airborne scales. There is little information on the relationship between SWC and climate conditions or vegetation types in crop growing seasons in arid and semi-arid agricultural areas. This relationship can provide a basis for improving agricultural water use efficiency in arid regions.
Maize (being a C4 plant) and wheat (being a C3 plant) are the predominant crops grown in northwest China, where population density and exploitation of water resources are high [32]. How SWC is controlled in the maize and wheat fields is important for agricultural water management in arid regions in northwest China. To address this question, a field scale experiment was conducted to measure soil water content over canopies in northwest China in 2013 and 2014. The objectives of this study therefore were to: (1) determine how environmental variables alter the spatial and temporal variability of SWC; (2) determine the effect of crop growth stage on SWC at different depths; and (3) quantify the environmental control on the variation of SWC using entropy.
2. Materials and Methods
2.1. Experimental Site and Design
A two-year experiment was conducted in two fields at the Shiyanghe Experimental Station for Water-Saving in Agriculture and Ecology of China Agricultural University, located in Wuwei (Gansu Province of Northwest China, 37°52′ N, 102°50′ E, altitude 1581 m) during the crop growing seasons in 2013 and 2014 (Figure 1). The experimental site is located in a typical continental temperate climate zone, where the mean annual temperature is 8 °C, the annual accumulated temperature (>0 °C) is 3550 °C d−1, the annual precipitation is 164.4 mm, the mean annual pan evaporation is about 2000 mm, the aridity index (the ratio of mean annual evaporation to precipitation) is 15–25, the average annual sunshine duration is 3000 h and frost-free days number 150 d. The groundwater table is below 40–50 m [33].
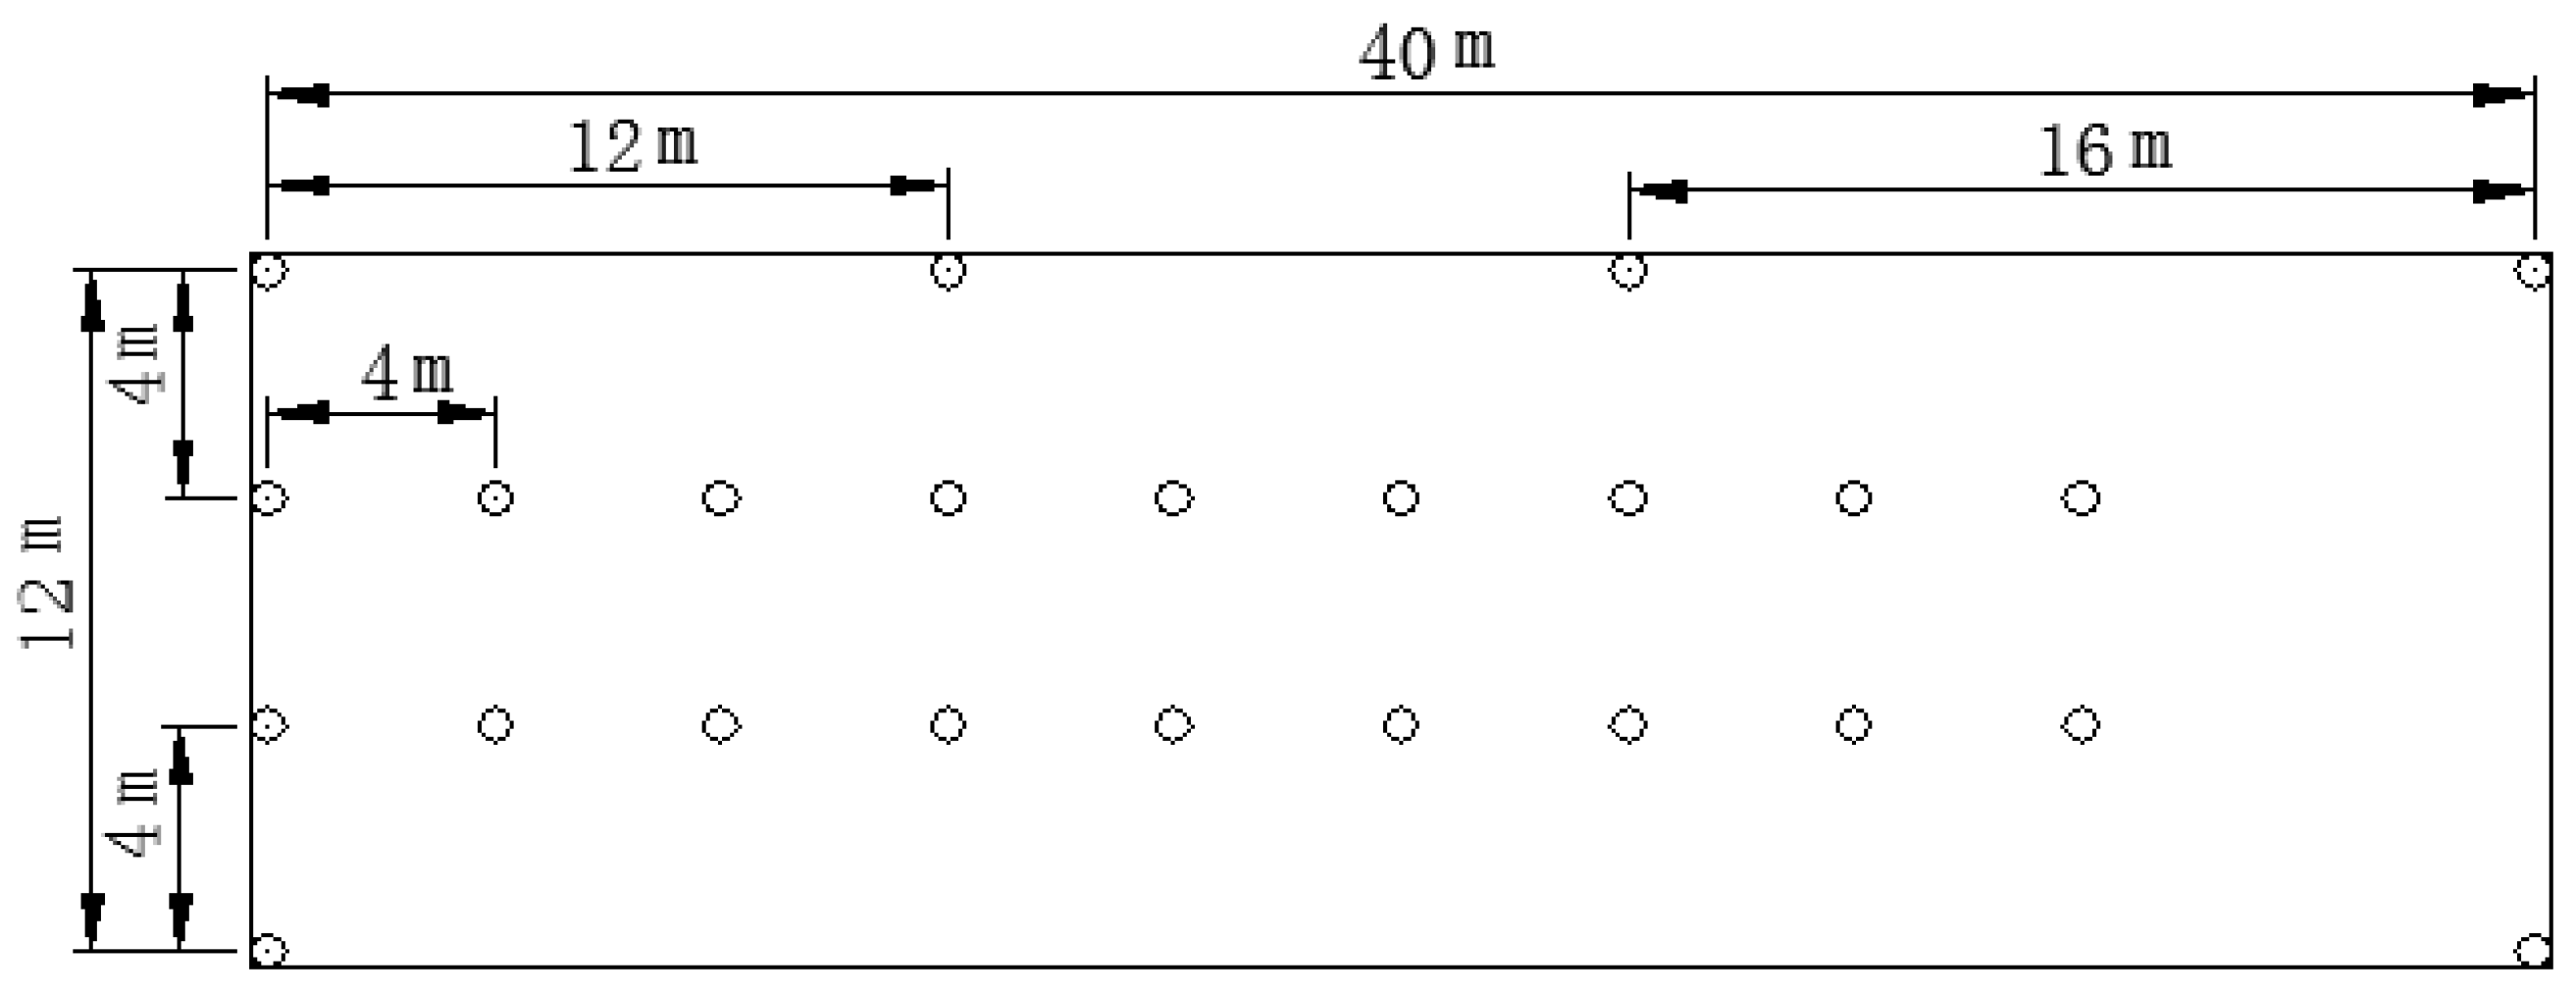
The two study sites (field I and field II) have a similar area of about 40 m long and 12 m wide. The SWC (%cm3cm−3) was monitored under two different crops at an interval of 10 cm providing estimates covering 0 to 120 cm depth. A total of 46 sample points for the study site in 2013 (Figure 2) and 24 sample points in 2014 (Figure 3) were monitored.
Spring maize and spring wheat were used in crop rotation, that is, the plot on which wheat was planted in 2013 was planted with maize in 2014. Maize seed was sown through 5.0 cm diameter holes, with a row spacing of 50 cm and a plant spacing of 23.8 cm. Spring wheat was sown in holes of 3.0 cm diameter, with a row spacing of 15 cm and a plant spacing of 10 cm for the two years using a hole sowing machine. Spring wheat was sown with 10–15 seeds in each hole. During each growing season, weeds were removed manually as required. The observation periods for maize were from 14 May to 17 September in 2013 and 28 April to 18 September in 2014; and those for wheat were from 12 May to 27 July in 2013 and 7 April to 23 July in 2014. Precipitation, solar radiation, air temperature, relative humidity and wind speed were measured with a standard automatic weather station at a height of 2.0 m above the ground at the experimental site. A portable Diviner 2000 device (Sentek Pty Ltd., Stepney, Australia) was used to measure SWC at an interval of 3–5 days. Soil samples were collected before and after irrigation events and after rainfall and the probes were calibrated against gravimetric samples for the observation sites. Table 1 lists the physical properties of the soil profile.
2.2.1. Statistical Analysis
For each soil depth the coefficient of variation (CVi) was used for spatial analysis, and temporal standard deviation (STDVi) for temporal analysis. The CVi and the STDVi were calculated as:
where Si is mean squared error. is the average soil water content for the each soil depth, i represents the soil depth. Heterogeneity was considered weak when CV ≤ 10%, moderate when 10% < CV < 100%, and strong when CV ≥ 100% [34]. Descriptive statistics of soil water content under different crop covers based on 10 cm-steps are given in Table 2 and Table 3. The temporal average versus the standard deviation of SWC in different soil layers under maize and wheat cover in 2013 and 2014 are shown in Figure 4 and Figure 5, respectively.
2.2.2. Entropy
In this study, the Shannon entropy [35,36] was used to investigate the spatial variability and dominant controls on the variability of SWC during the crop growing period. Entropy has an advantage in that it is capable of incorporating the effect of dependent or independent factors on the SWC spatial distribution, and can be used for short or long data sets. Entropy (H) is a statistical quantity representing a measure of information that may be extracted from a system or analogously the uncertainty that the system comprises. For a probability distribution , where are the probabilities of N outcomes (xi, I = 1, 2, …, N) of a random variable X or a random experiment, Shannon defined a measure H as a function of probabilities as [35]:
According to the frequency histograms of SWC for each soil depth constructed with empirical frequencies, a probability pi is assigned to each bin and calculated. We substituted pi in Equation (3) to find out the marginal entropies.
For two or more independent random variables X and Y, their respective entropy values may be added. However, if there is dependence between the random variables, then the dependence can be accounted for through mutual information T(X,Y), which is the amount of information common to both the random variables. Consider two simultaneous experiments whose outcomes are represented by X and Y. The mutual entropy of X and Y, denoted as T (X, Y), defines the amount of uncertainty reduced in X when Y is known. It equals the difference between the sum of two marginal entropies and the total entropy:
T(X,Y) = H(X) + H(Y) − H(X,Y)
Mutual information has an advantage over other measures of information, as it can provide a quantitative measure of a description of the relationship among variables based on their information transmission characteristics. Larger values of T correspond to greater amounts of information transferred. Mutual information is superior to the Pearson correlation coefficient, since it captures both linear and nonlinear dependence, whereas the Pearson correlation coefficient is only suitable for linear relationships, or more generally, for spherical and elliptical dependence structures [37,38,39]. In reality, the spatial patterns of SWC may be non-stationary and the related processes may be nonlinear [22].
2.2.3. Calculation of Marginal Entropy and Mutual Entropy for Soil Water Content
In this study, the random variables under consideration are the SWC, crop coefficients (KC), reference crop evapotranspiration (ET0), and precipitation (P). The highest mutual entropy between soil water content and other factors can be considered to be the most dominant factor that influences the SWC variability.
We arranged SWC values SWCi,d,n, where i represents the soil depth, d represents the days (1, 2, …, d), and n represents the number of soil water content values (1, 2, …, n), P is daily precipitation, and ET0 is the reference crop evapotranspiration. In this study, ET0 was calculated according to the FAO (Food and Agriculture Organization) Penman–Monteith method using daily observed climate data [40,41]. KC is the daily crop coefficients and was calculated by the single crop coefficient method Equation (5) [40,42,43,44,45] as:
where ETC is the crop evapotranspiration. ETC was calculated according to the FAO Penman–Monteith method [46].
The frequency histograms of SWCi,d,n were constructed with empirical frequencies obtained from observed the data with no zero counts [47], and hence the Shannon entropy H of the random variable SWCi,d from the corresponding observed counts SWCi,d,n. The marginal entropy of SWC at different soil depths was computed from Equation (2). The mutual entropy between SWCi,d and ET0, SWCi,d and KC, SWCi,d and P were calculated using Equation (3).
2.2.4. Informational Correlation Coefficient
The informational correlation coefficient R0 is a measure of transferable information between random variables X and Y and measures their mutual dependence and does not assume any type of relationship between them. It is expressed in terms of transinformation as:
where T0 is the transinformation or mutual information representing the upper limit of transferable information between two variables [38]. In this study, three groups were identified: SWCi,d and ET0, SWCi,d and KC, SWCi,d and P. From results one can infer the main dominating factors for the SWC variability.
3. Results and Discussion
3.1. Temporal Variation of Soil Water Content under Different Crops
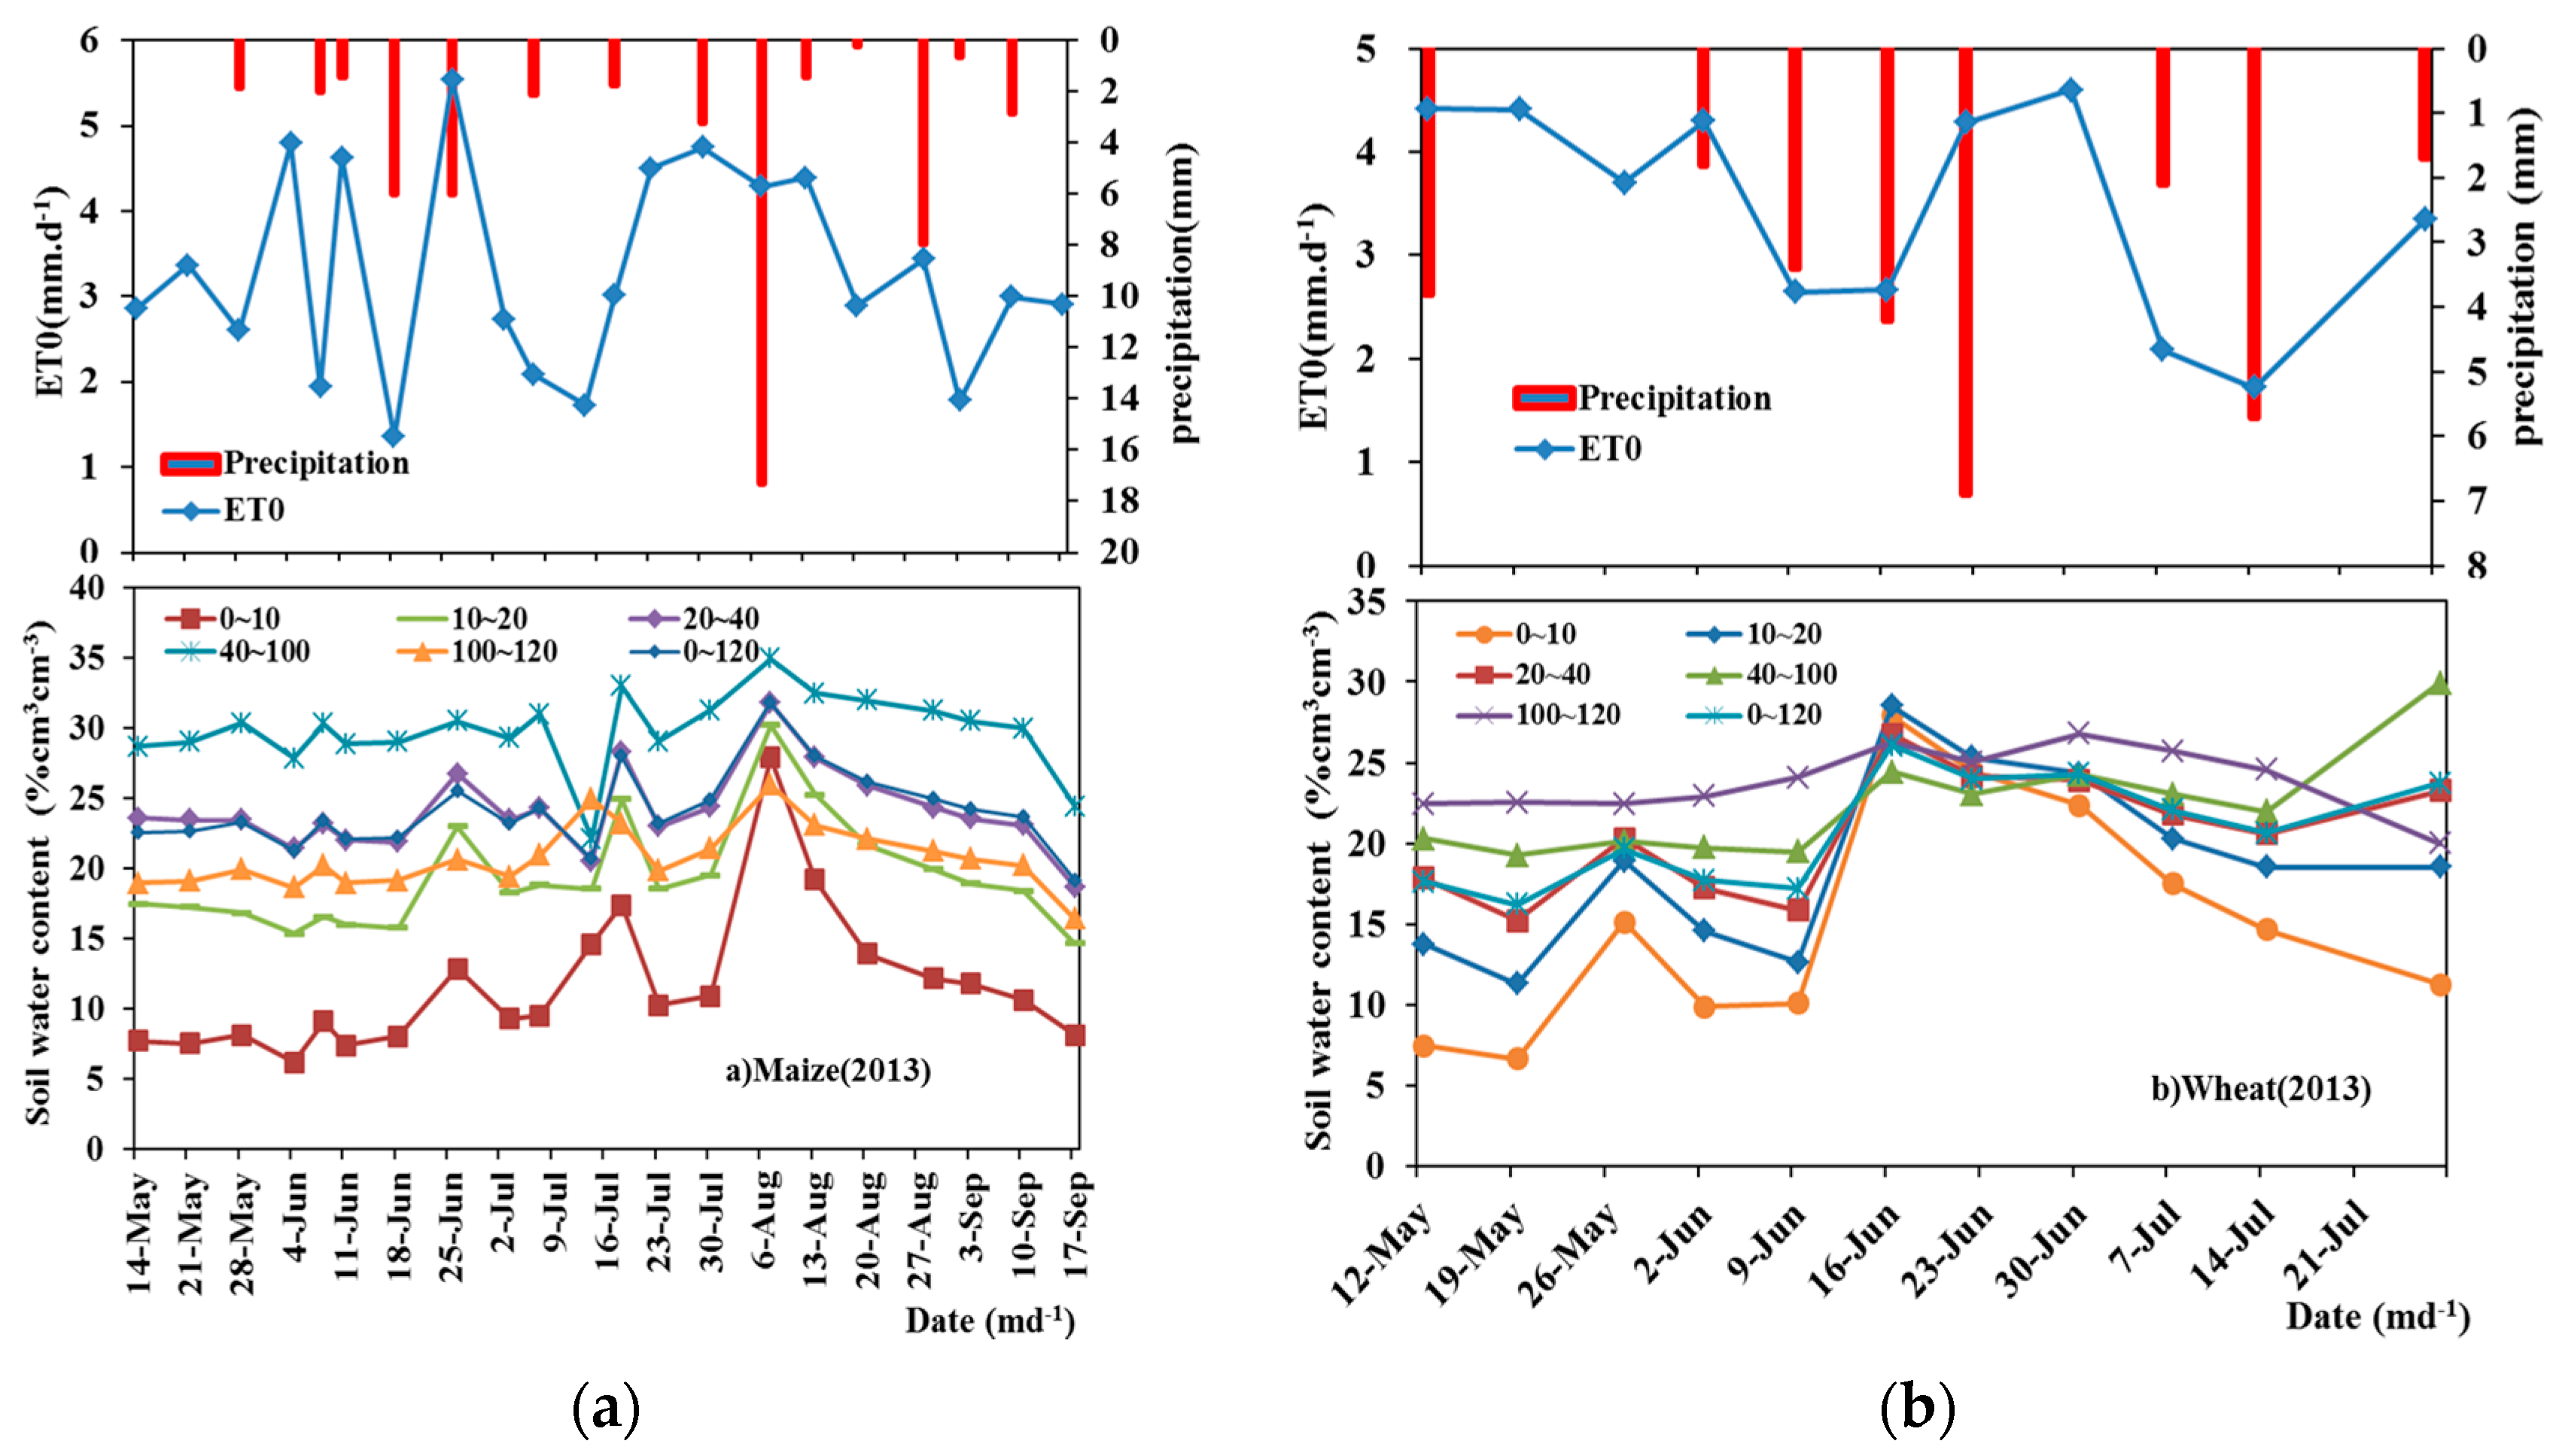
The two-year sampling in this study can be considered as representative of the usual conditions in Northwest China. The accumulated rainfall during the maize growing period was 54.4 mm in 2013 and 196.6 mm in 2014, respectively, and the accumulated rainfall during the wheat growing period was 29.6 mm in 2013 and 128.8 mm in 2014, respectively. Due to the meteorological forcing (precipitation and ET0), the SWC observed during the study period showed a succession of increases and decreases in response to the succession of precipitation events (Figure 6a and Figure 7a). This led to a steady increase in SWC at different soil depths from June to mid-July for the maize cover. The mean SWC at different depths increased when precipitation took place. The SWC of layer (20–40 cm) can represent the average soil water content (0–120 cm) under different crop covers. During the growing seasons, the SWC changed only slightly during the early growing period (April to mid-May) under different crop covers (Figure 6 and Figure 7) due to little water demand during this stage. The SWC in the 0–120 cm layer varied greatly over the crop growing period. The temporal variability of SWC changed slightly with the increase of soil depth in the two years. Table 2 and Table 3 show that the SWC at different soil depths changed typically with crop and soil conditions.
During the observation growing period of maize (from May to late September) in 2013 (dry year) (Table 2). The minimum SWC varied from 0.62%cm3cm−3 to 8.65%cm3cm−3 and the maximum SWC varied from 30%cm3cm−3 to 41.84%cm3cm−3 for different soil depths. Corresponding to the same soil depths, the ranges were 31.57%cm3cm−3, 30.41%cm3cm−3, 32.76%cm3cm−3, 33.19%cm3cm−3 and 27.42%cm3cm−3, respectively. During the observation period, the range for the 40–100 cm was greater due to the soil texture, where the fraction of sand particles soil in the 40–100 cm layer range from 0.443 to 0.931 (Table 1).
For wheat growing period (from April to late July), The minimum SWC varied from 2.13%cm3cm−3 to 12.86%cm3cm−3 and the maximum SWC varied from 30%cm3cm−3 to 37.79%cm3cm−3 for different soil depths. Corresponding to the same soil depths, the ranges were 30.34%cm3cm−3, 29.44%cm3cm−3, 22.58%cm3cm−3, 21.45%cm3cm−3 and 27.41%cm3cm−3, respectively. The range of SWC under wheat cover was greater for the 0–10 cm soil layer (Table 2). During the growing period of maize in 2014 (wet year), the minimum SWC varied from 4.46%cm3cm−3 to 8.51%cm3cm−3 and the maximum SWC varied from 30%cm3cm−3 to 38.6%cm3cm−3 for different soil depths. Corresponding to the same soil depths, the ranges were 26.83%cm3cm−3, 23.43%cm3cm−3, 31.25%cm3cm−3, 28.7%cm3cm−3 and 33.82%cm3cm−3, respectively. The range of SWC under maize cover was greater for the 100–120 cm soil layer. In this year, maize was arranged in field II. Table 1 shows that the fraction of sand particles in 100–120 cm layer ranged from 0.507 to 0.706. Two years of results of SWC under maize cover showed that soil texture had a direct influence on the SWC variability.
During the observation period under wheat cover, the minimum SWC ranged from 6.46%cm3cm−3 to 13.72%cm3cm−3 and the maximum SWC ranged from 29.09%cm3cm−3 to 35.89%cm3cm−3 for different soil depths. Corresponding to the same soil depths, the ranges were 22.63%cm3cm−3, 20.72%cm3cm−3, 20.9%cm3cm−3, 22.17%cm3cm−3 and 22.53%cm3cm−3, respectively. The range of SWC under wheat cover was greater for the 0–10 cm soil layer. The result was the same as that of 2013 in spite of the field plot in two years. Table 1 shows that the soil texture of 0–10 cm in field I was similar to that in field II. The fraction of sand particles in the 0–10 cm layer was 0.6291 in field I, and 0.62 in field II.
The temporal variability of SWC in different layers under different crop covers displayed the same trends. It can be seen that the range under wheat cover in different field plots in the growing seasons in the surface layer was higher than in other layers, because the top layer was more sensitive to the environment. The fluctuation of the upper soil layer (0–10 cm) under wheat was greater in the observation period in 2013 and 2014. This result is similar to what found by Odhiambo and Bomke (2007) with no differences in soil water content in depths 20–40 and 40–60 cm among cropping treatments in south coastal British Columbia. However, the range of deep soil layer (≥40 cm) under maize was greater in the two year study period due to different soil textures. The fraction of sand particles above 40 cm layer was from 0.443 to 0.931 in field I, and 0.482 to 0.706 in field II.
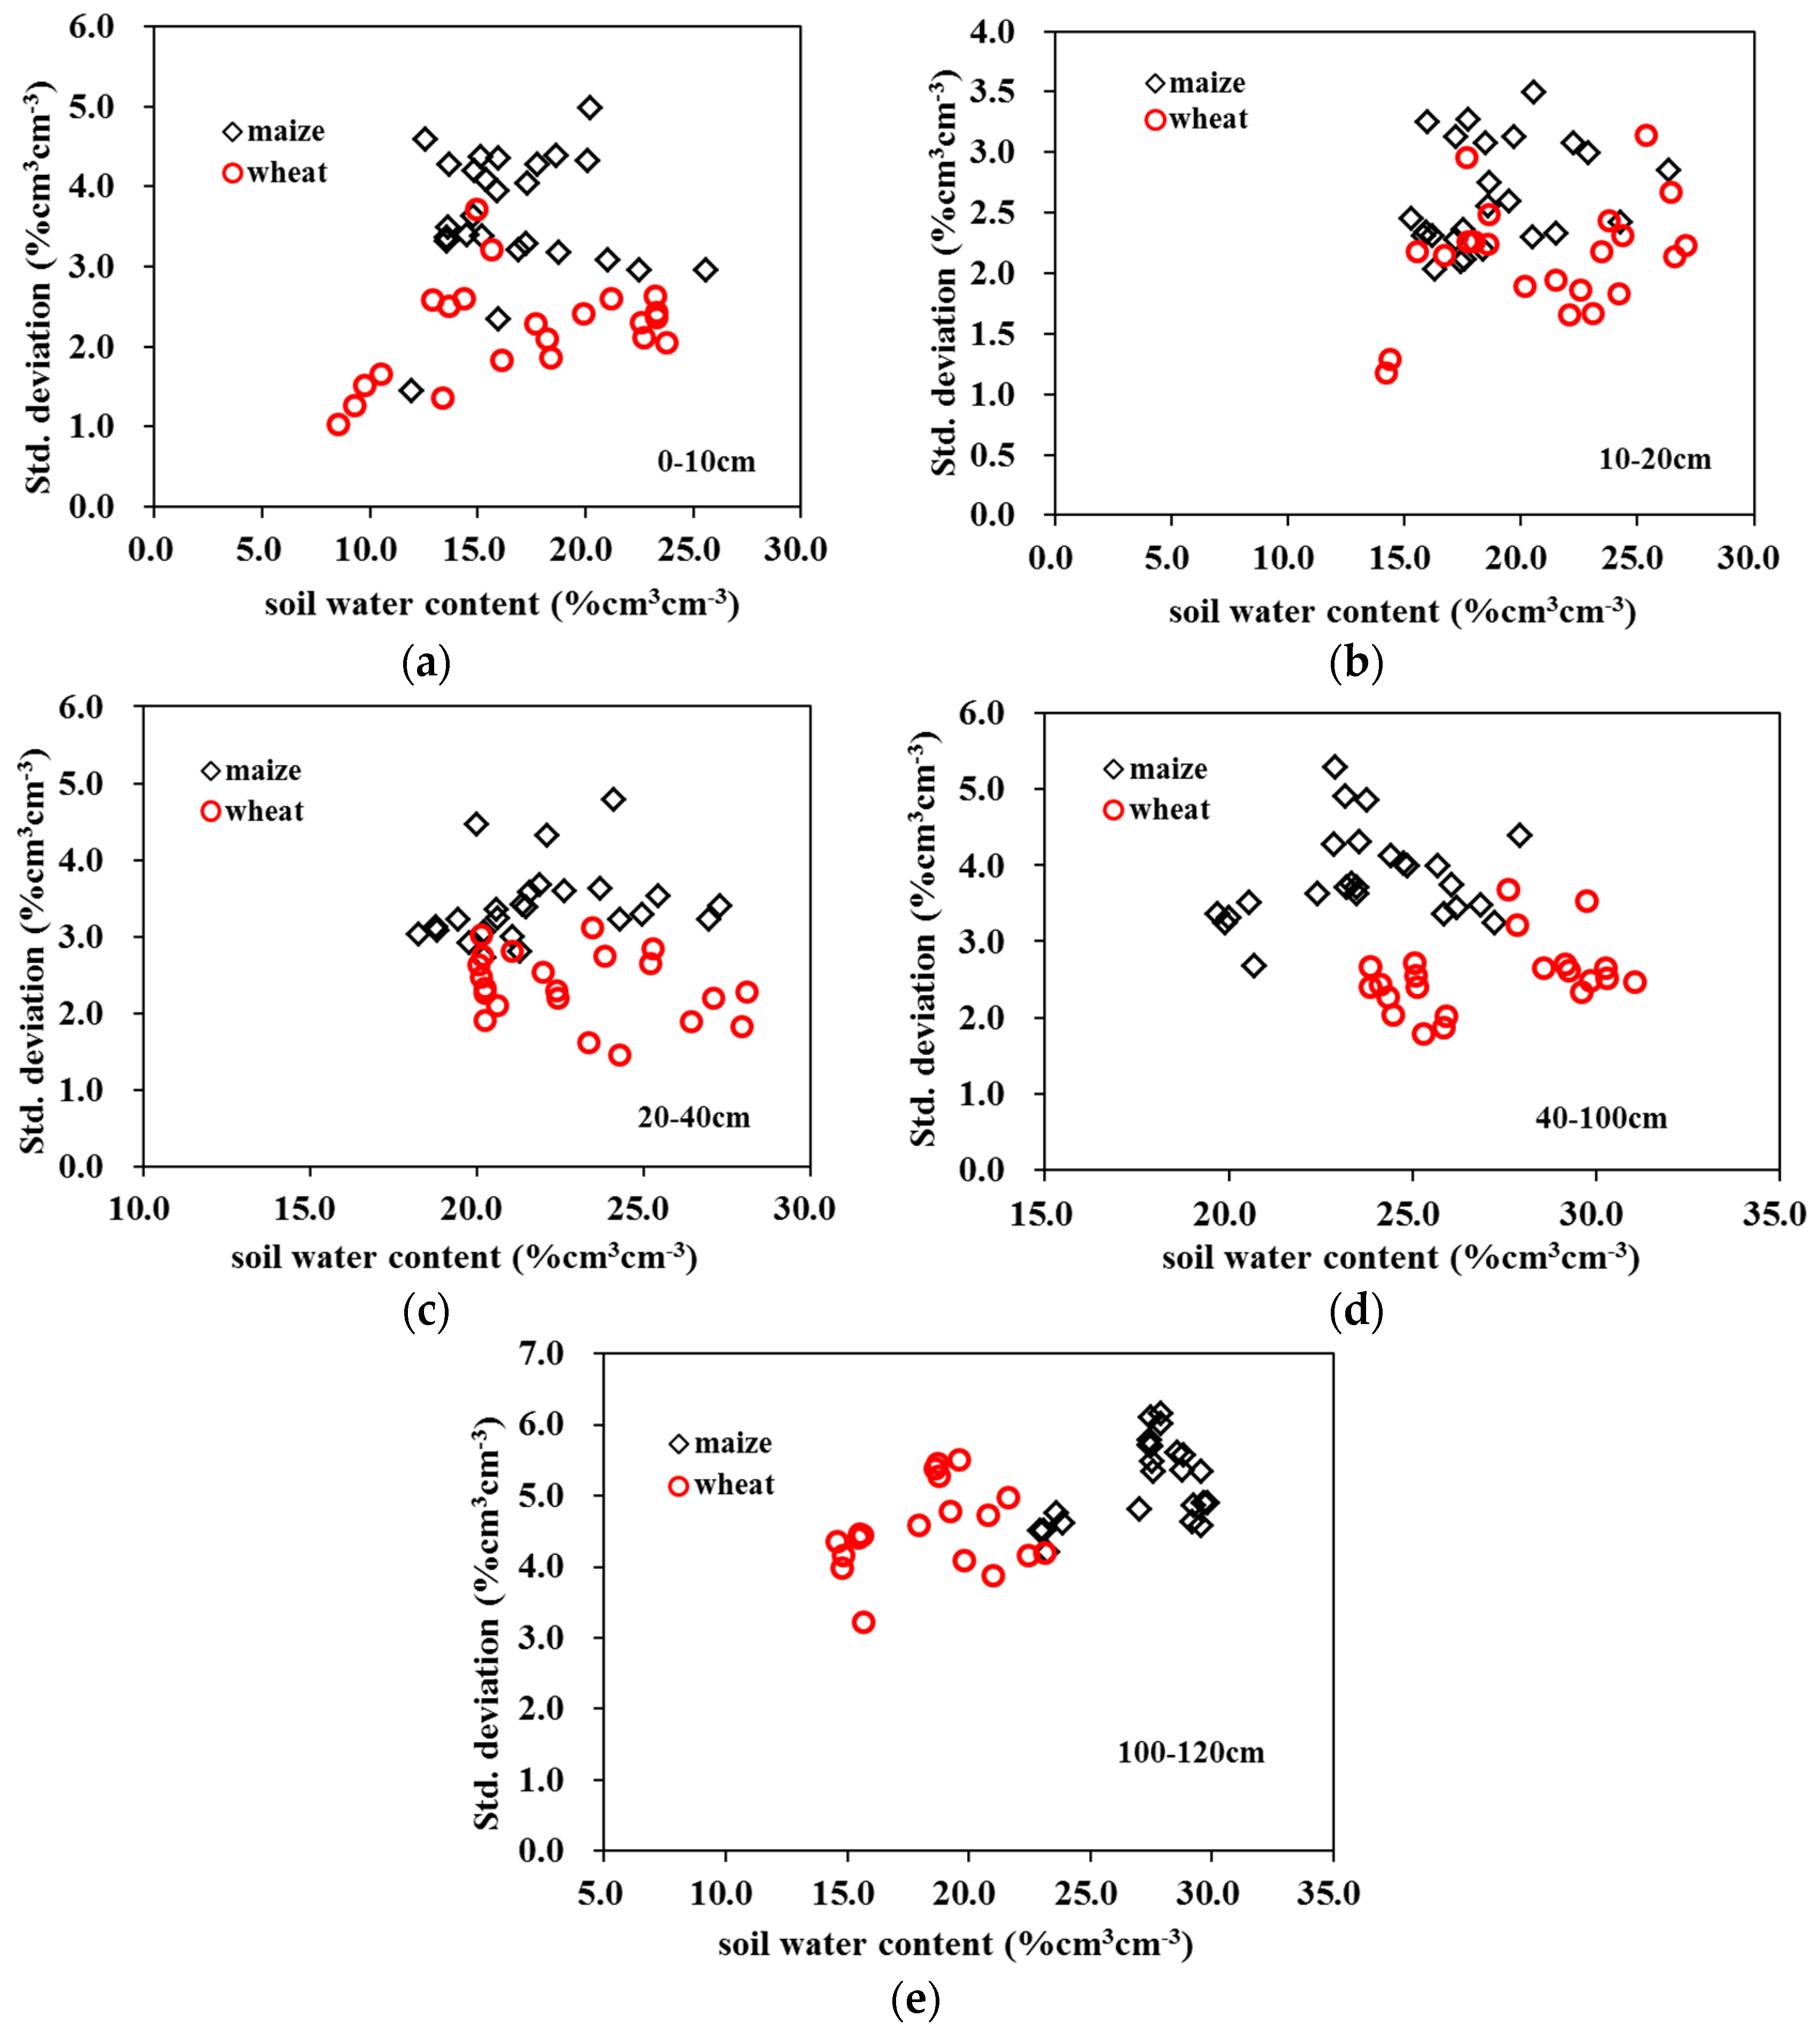
Figure 4 and Figure 5 show the temporal average versus the temporal standard deviation of soil water content of maize and wheat in 2013 and in 2014. In contrast with the top layers, a higher STDV was generally found for the deeper layers under two crops. The STDV for deep layers changed from 2.5%cm3cm−3 to 6.5%cm3cm−3 in two years. The temporal standard deviation (STDV) of SWC increased with increasing depth. In the 20–40 cm layer, the value of wheat was smaller than that of maize. This implies that roots in this depth had a significant effect. Temporally averaged values in deeper layers (40–100 cm and 100–120 cm) had higher standard deviations. The result is similar to that of [48] that SWC in crop covered deep layer (80–100 cm) exhibited a large degree of change, which was affected by crop root water uptake in the same region.
3.2. Spatial Variation of Soil Water Content under Different Crops
3.2.1. Soil Water Content Analysis Based on Coefficient of Variation
For SWC measurements during crop growth, the coefficient of variation (CV) was used to evaluate the spatial variation in soil water content in the experimental fields. Table 2 and Table 3 show the CV of the spatial distribution of SWC in different layers during the crop growing period in 2013 and 2014. Table 2 shows the CV of soil water content under the maize cover varied from 18.10% to 44.65% for different soil depths in 2013. The CV was between 10% and 100%, so that SWC was considered to exhibit moderate heterogeneity. The CV of SWC was the highest in the top layer due to the SWC in the top layer was strongly spatially influenced by precipitation and evapotranspiration, whereas for deeper soil layers, SWC was steady. The CV of SWC under wheat cover varied from 19.75% to 58.70% for different soil depths. The spatial heterogeneity of soil water content under wheat cover was moderate and the CV for the 0–10 cm layer was the highest.
From Table 3, it can be seen that CV of SWC under maize cover changed from 15.80% to 30.05%, for different soil layers. SWC was considered to have moderate heterogeneity due to CV was between 10% and 100%. The extent of heterogeneity was less compared to that in 2013. The CV of SWC was the highest in the top layer, because SWC in the top layer was strongly spatially influenced by precipitation and evapotranspiration during the growing period, whereas for deeper layers, SWC changed more slowly. The CV of SWC under wheat cover varied from 15.24% to 31.99% for different soil layers. It can be seen that the CV range was similar to that under maize. The spatial heterogeneity of SWC under wheat cover was moderate and CV for the 0–10 cm layer was the highest.
Table 2 showed that the CV (from 18.10% to 44.65%) of the spatial distribution of SWC in different layers under maize cover was less than that (from 19.75% to 58.70%) under wheat cover during 2013. In 2014, it can be seen from Table 3 that CV (from 15.80% to 30.05%) of the spatial distribution of SWC in different layers under maize cover was similar to that (from 15.24% to 31.99%) under wheat cover. From Figure 8, it can be seen that CV of spatial SWC decreased with increasing mean SWC under different crop covers, because the evapotranspiration rate decreased with decreasing soil water content (Figure 5). Results for CV of the spatial SWC can be found in other studies [3,23], and the SWC varied with depth due to the heterogeneity of environmental factors [28,48].
3.2.2. Soil Water Content Analysis Using Entropy
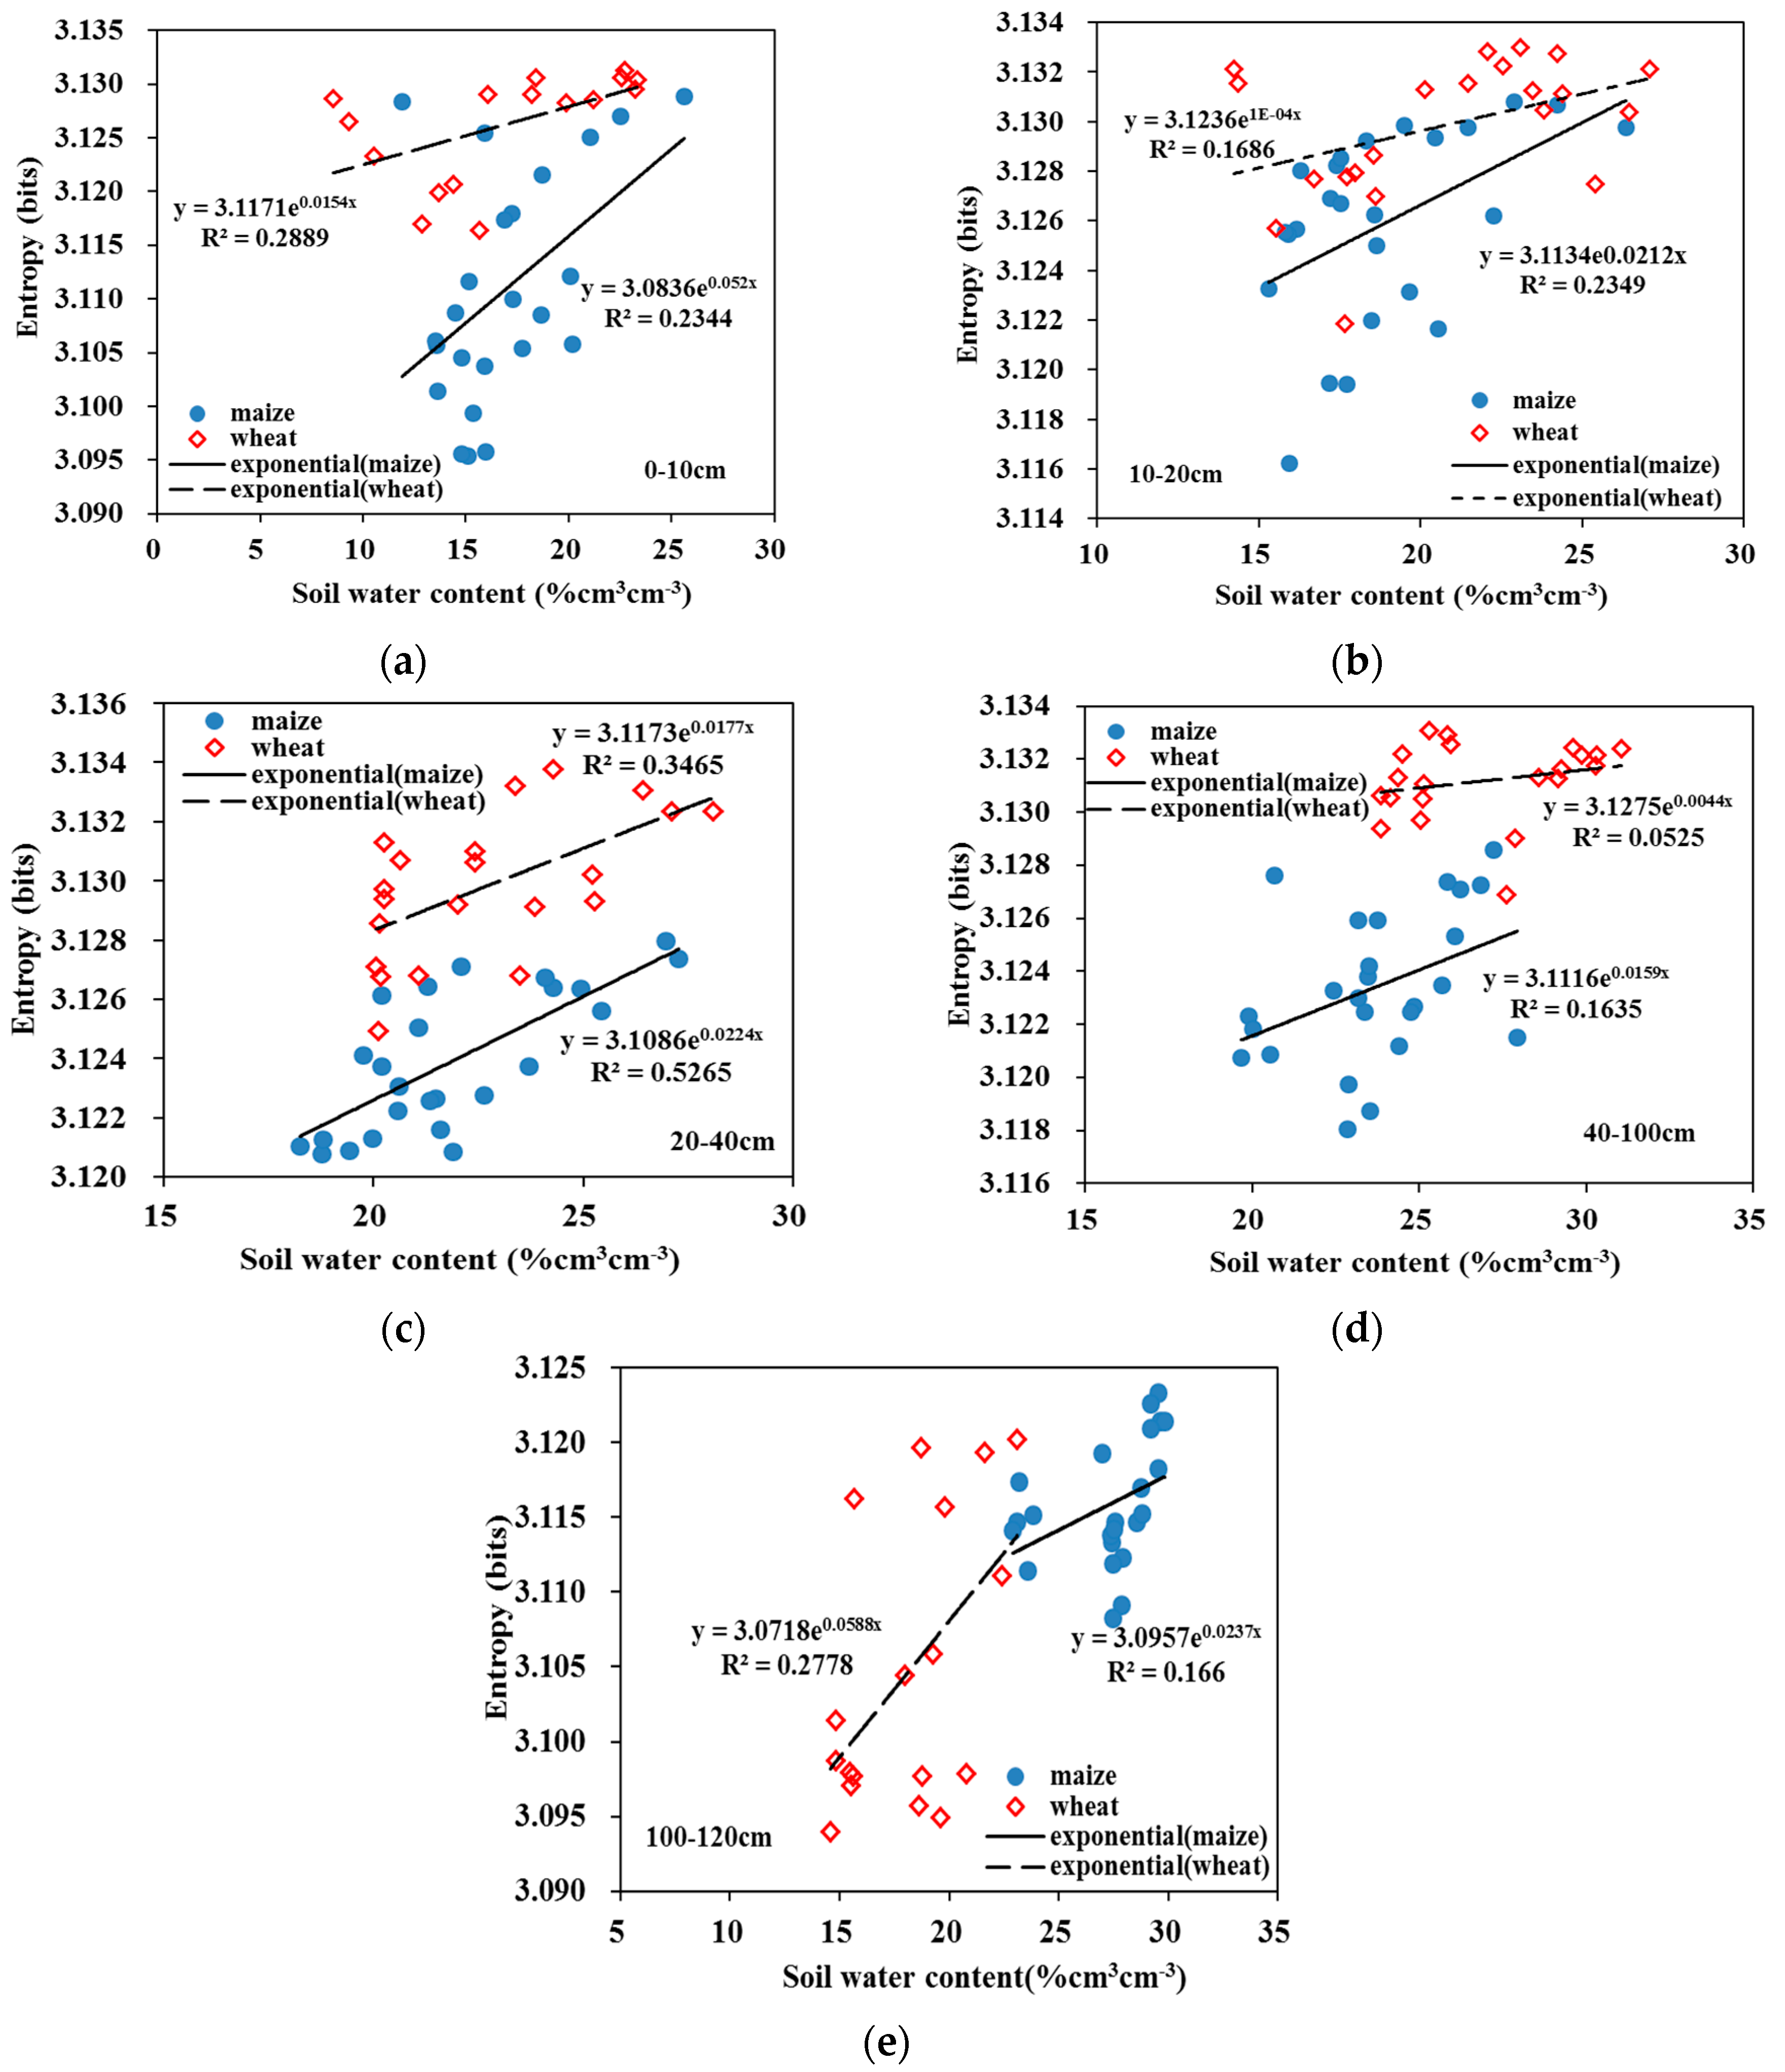
The marginal entropy values of daily soil water content were plotted against the daily mean soil water content for different soil depths under different crop covers in 2013 (Figure 9) and 2014 (Figure 10). Figure 9 shows that entropy was maximum when SWC was the maximum value, and entropy was distributed in the intermediate range under the maize cover in field I in 2013. In the upper soil layer (0–10 cm and 10–20 cm), entropy changed widely during the maize growing period. Entropy was the maximum in the intermediate range under wheat cover for field II in 2013. In the upper soil layer (0–10 cm and 10–20 cm), entropy changed widely during the maize growing period, but the entropy value for the deeper layer changed not so much. The soil texture and crop growth patterns led to the difference under the same weather conditions [49]. In different layers under different crop covers, the marginal entropy of spatial variability and range increased with increasing SWC. In this study, data of marginal entropy and mean SWC were fitted with an exponential model separately for the 0 to 10, 10–20, 20–40, 40–100 and 100–120 cm soil layers, and the results of fitting are shown in Figure 9 and Figure 10.
With all data points included in the analysis, the relationship between marginal entropy and mean SWC apparently was different for different soil layers under the maize cover and the wheat cover in 2013–2014. Entropy changed with soil water content as an exponential model, in which the model parameters indicated the magnitude of the proportional effect on the variability and the dependence of variability on the mean SWC, respectively. Figure 9 and Figure 10 show that the absolute values of both parameters for different soil layers under wheat cover were larger than those of the soil layers under maize cover in 2013–2014. It seems that the soil layer had a relatively greater overall spatial variability under wheat cover and entropy increased relatively faster for the soil layers with increasing SWC.
3.3. Calculation of Mutual Entropy for Influencing Factors of Soil Water Content
From Figure 11, it can be seen that a larger value of mutual entropy corresponds to a greater amount of information transferred because the value of mutual entropy represents the amount of information transmitted. In 2013 and 2014, the mutual entropy value of SWC and precipitation was much higher than that of ET0 and SWC, SWC and KC under different field plots, which is consistent with previous studies [50]. Crop type was the second contributor that affects the soil water content. Under wheat cover, it was observed that even though the marginal entropy values in 2013 were higher than those in year 2014 (Figure 9 and Figure 10), the mutual entropy values between SWC and precipitation were similar to the value in 2014 (Figure 11). The results reflect that the influence of precipitation to SWC is consistent in spite of the amount. The results reflects the entropy theory dose well in communicating with nature, it helps better understand soil water content and its influence factors in natural systems. The mutual entropy values for different layers were different under wheat cover in different years. For the top soil layers (0–10 cm and 10–20 cm) and observed deepest layer (100–120 cm), the value of mutual entropy between SWC and precipitation (Figure 11b) in dry year (2013) was much higher than that (Figure 11c) in wet year (2014); results were similar to the value between SWC and ET0.
Figure 9 and Figure 10 show that the marginal entropy values in 2013 were higher than those in 2014 under maize cover. The mutual entropy values between SWC and precipitation were from 0.055 to 0.091 in 2013 (Figure 11a), which were also bit higher than those (0.045 to 0.067) in 2014 (Figure 11d). The mutual entropy values for different layers were different under wheat cover in the two year period. For the top soil layers (0–10 cm and 10–20 cm), the value of mutual entropy between SWC and precipitation (Figure 11a) in the dry year (2013) was much higher than that (Figure 11d) in the wet year (2014). The value between SWC and ET0 in 2013 was similar to that in 2014. This result is different from that under wheat cover. The difference resulted from the crop types, wheat (being a C3 plant) extracts more water than maize (being a C4 plant).
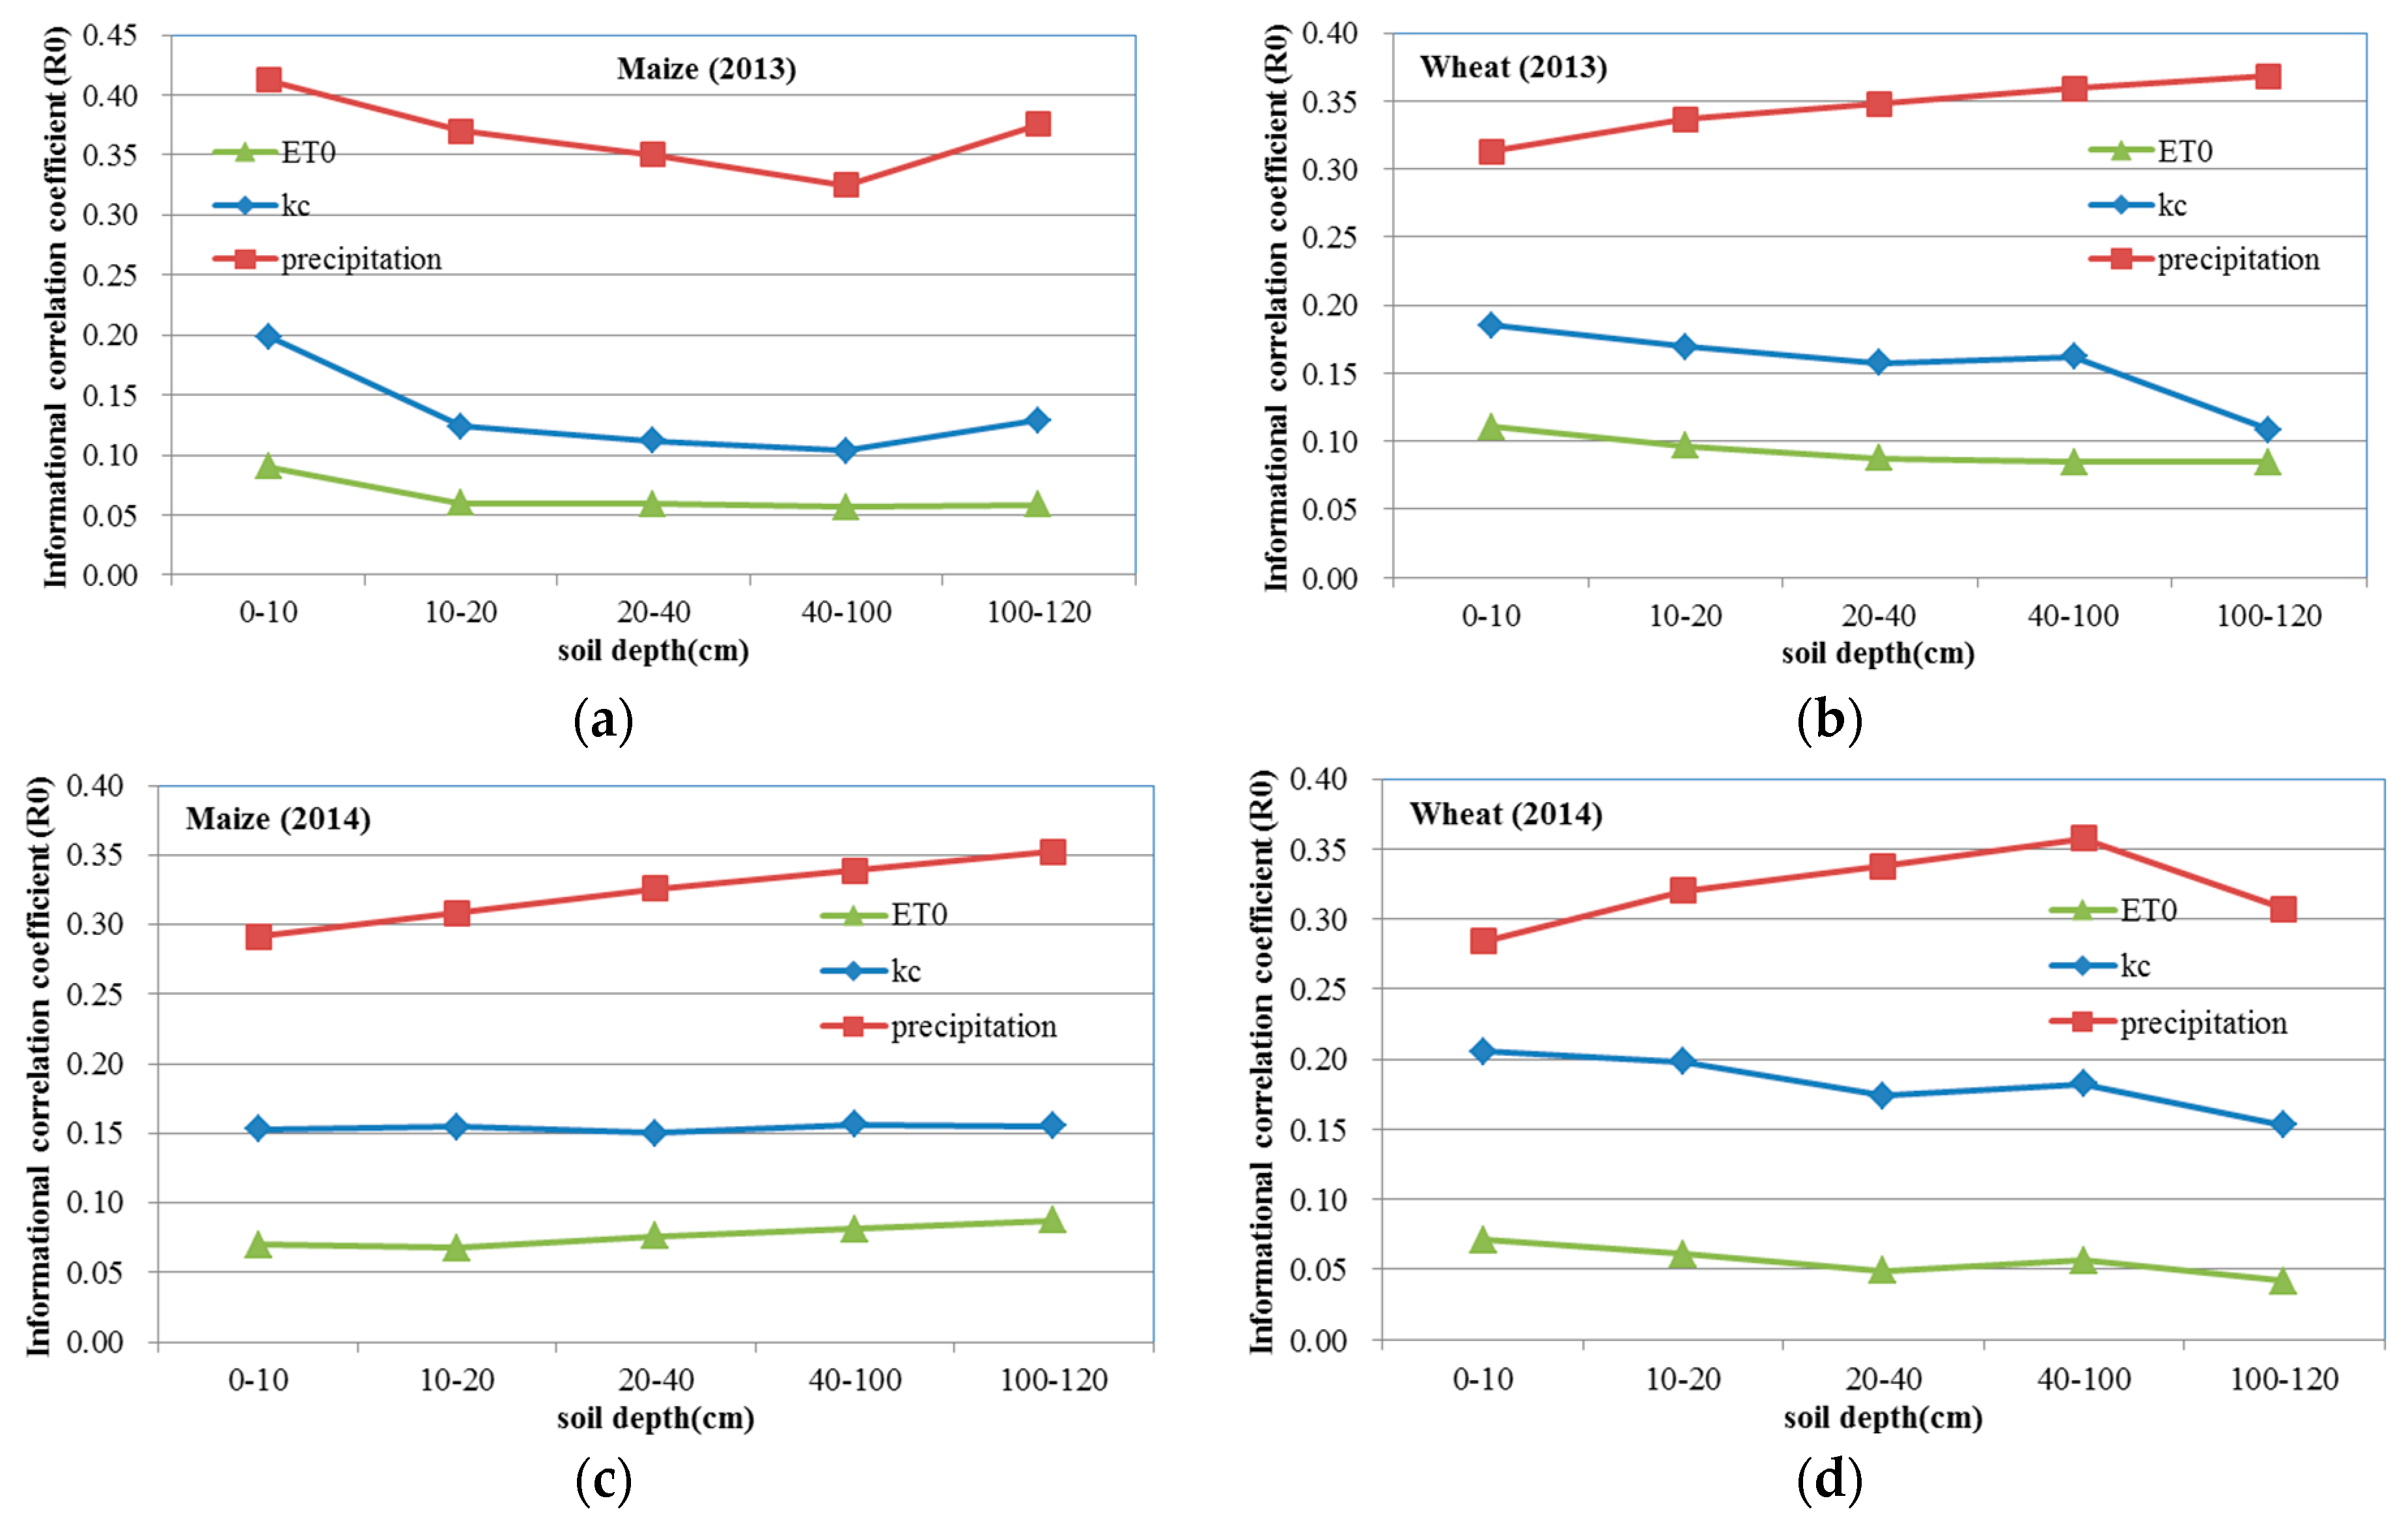
Figure 12 shows that informational correlation coefficient (R0) between SWC and other factors for different soil layers. The value of R0 between SWC and precipitation was from 0.35 to 0.41 under maize cover (Figure 12a) and from 0.31 to 0.37 under wheat cover (Figure 12b) in 2013. The R0 value between SWC and precipitation was from 0.29 to 0.36 under maize cover (Figure 12c) and from 0.28 to 0.36 under wheat cover (Figure 12d) in 2014. For the 0–10 cm soil layer, the R0 value between SWC and precipitation under maize cover was 0.41 and 0.29 in 2013 and 2014, respectively, which was bit higher than the value (0.31 in 2013, 0.28 in 2014) under wheat cover. For the 10–20 cm soil layer, the R0 value between SWC and precipitation under maize cover was 0.37 and 0.31 in 2013 and 2014, respectively, and the value under wheat cover was 0.34 and 0.32 in 2013 and 2014, respectively. The result was similar to that for the 0–10 cm soil layer.
From Figure 12, it can be seen that the transferable information of precipitation for SWC was more than ET0 and KC. The value between SWC and KC was the smallest for different soil layers. The R0 value was similar under different crop covers in the two years. The influence of KC on SWC in different layers was steady under different cover crops in the two years. The R0 value between SWC and KC under maize cover was from 0.10 to 0.19 in 2013 and from 0.152 to 0.156 in 2014. For wheat cover, the R0 value between SWC and KC was from 0.09 to 0.11 and from 0.04 to 0.06 in 2013 and 2014, respectively. In spite of crop type, climate was the dominant factor that affected the SWC. In northwest China, the precipitation is prior to ET0. So, the irrigation forecast can be according to the surface soil water content and weather conditions for the certain crop cover.
4. Conclusions
In this study, entropy was employed, which was proved as an efficient tool for analyzing the spatio-temporal patterns of SWC and the related environmental conditions. In order to examine the spatial-temporal variability of SWC over the growing season in relation to the environmental variables and to analyze how the influence of these factors vary with the crop growth in different soil depths, both statistical and entropy methods were used to quantify the environmental control on the seasonal variation of SWC based on two-year observations in a field site of Shiyang River basin in Northwest China.
From the distribution of SWC in time, it was found that the temporal variability of SWC in different layers under different cover crops displays the same change trends. The temporal variability of SWC changed slightly with increase of soil depth in the two years. The CV of spatial SWC decreased with increasing mean SWC under different covers. The marginal entropy of spatial variability and range increased with increasing SWC for different layers under different crop covers. Entropy changed with SWC following an exponential model.
Mutual entropy results showed that precipitation is the dominant factor on SWC regardless of the crop type. The crop coefficient (KC) is the second dominant factors for SWC in the two years. So the crop type is the second contributor that affects the SWC variability in different soil layers. The results implied that changing crop type is a necessary adaptation to regional water scarcity exacerbated by climate change in arid and semi-arid areas.
The mutual entropy values between SWC and precipitation are similar in different years under wheat cover, but the marginal entropy values for different layers are different. The value of mutual entropy of SWC with precipitation and that with ET0 for the top soil layer and observed deepest layer are much higher in 2013 (dry year). This work opens a new avenue for further research to use entropy theory for better understanding the variability of soil water contents and its influencing factors.
Acknowledgments
This work was financially supported by the national key Research and Development Plan (2016YFC0400207), the Chinese National Natural Science Fund (91425302, 51439006, 51109211) and the Special Fund for Agro-scientific Research in the Public Interest (201503125). We are grateful for Zhongyi Liu, Xin Liu and Congcong Peng’s help with field data collection. We would also like to thank Nandita Gaur and Zhenlei Yang for valuable discussions. We thank the anonymous reviewers for their constructive comments which helped improve this paper.
Author Contributions
Sufen Wang conceived and designed the experiments; Sufen Wang performed the experiments; Sufen Wang analyzed the data; Sufen Wang and Vijay P. Singh contributed reagents/materials/analysis tools; Sufen Wang and Vijay P. Singh wrote the paper. Both authors have read and approved the final manuscript.
Conflicts of Interest
The authors declare no conflict of interest.
References
- Vereecken, H.; Huisman, J.A.; Bogena, H.; Vanderborght, J.; Vrugt, J.A.; Hopmans, J.W. On the value of soil moisture measurements in vadose zone hydrology: A review. Water Resour. Res. 2008, 44, W00D06. [Google Scholar] [CrossRef]
- Gao, X.; Wu, P.; Zhao, X.; Zhang, B.; Wang, J.; Shi, Y. Estimating the spatial means and variability of root-zone soil moisture in gullies using measurements from nearby uplands. J. Hydrol. 2013, 476, 28–41. [Google Scholar] [CrossRef]
- Brocca, L.; Morbidelli, R.; Melone, F.; Moramarco, T. Soil moisture spatial variability in experimental areas of central Italy. J. Hydrol. 2007, 333, 356–373. [Google Scholar] [CrossRef]
- Brocca, L.; Melone, F.; Moramarco, T.; Morbidelli, R. Soil moisture temporal stability over experimental areas in Central Italy. Geoderma 2009, 148, 364–374. [Google Scholar] [CrossRef]
- Wijewardana, Y.G.N.S.; Galagedara, L.W. Estimation of spatio-temporal variability of soil water content in agricultural fields with ground penetrating radar. J. Hydrol. 2010, 391, 24–33. [Google Scholar] [CrossRef]
- Famiglietti, J.S.; Rudnick, J.W.; Rodelli, M. Variability in surface moisture content along a hillslope transect: Rattlesnake Hill, Texas. J. Hydrol. 1998, 210, 259–281. [Google Scholar] [CrossRef]
- Famiglietti, J.; Devereaux, J.; Laymon, C.A.; Tsegaye, T.; Houser, P.R.; Jackson, T.J.; Graham, S.T.; Rodell, M.; van Oevelen, P.J. Ground-based investigation of soil moisture variability within remote sensing footprints during the Southern Great Plains 1997 (SGP 97) Hydrology Experiment. Water Resour. Res. 1999, 35, 1839–1851. [Google Scholar] [CrossRef]
- Penna, D.; Borga, M.; Norbiato, D.; Dalla, F.G. Hillslope scale soil moisture variability in a steep alpine terrain. J. Hydrol. 2009, 364, 311–327. [Google Scholar] [CrossRef]
- Liang, W.L.; Hung, F.X.; Chan, M.C.; Lu, T.H. Spatial structure of surface soil water content in a natural forested headwater catchment with a subtropical monsoon climate. J. Hydrol. 2014, 516, 210–221. [Google Scholar] [CrossRef]
- Brocca, L.; Tullo, T.; Melone, F.; Moramarco, T.; Morbidelli, R. Catchment scale soil moisture spatial-temporal variability. J. Hydrol. 2012, 422, 63–75. [Google Scholar] [CrossRef]
- Joshi, C.; Mohanty, B.P.; Jacobs, J.M.; Ines, A.V. Spatiotemporal analyses of soil moisture from point to footprint scale in two different hydroclimatic regions. Water Resour. Res. 2011, 47, W01508. [Google Scholar] [CrossRef]
- Rosenbaum, U.; Bogena, H.R.; Herbst, M.; Huisman, J.A.; Peterson, T.J.; Weuthen, A. Seasonal and event dynamics of spatial soil moisture patterns at the small catchment scale. Water Resour. Res. 2012, 48, W10544. [Google Scholar] [CrossRef]
- Joshi, C. Understanding Spatio-Temporal Variability and Associated Physical Controls of Near-Surface Soil Moisture in Different Hydro-Climates. Ph.D. Thesis, Texas A&M University, College Station, TX, USA, 2013. [Google Scholar]
- Gómez-Plaza, A.; Mart Nez-Mena, M.; lbaladejo, J.; Castillo, V.M. Factors regulating spatial distribution of soil water content in small semiarid catchments. J. Hydrol. 2001, 253, 211–226. [Google Scholar] [CrossRef]
- Li, H.; Shen, W.; Zou, C.; Jiang, J.; Fu, L.; She, G. Spatio-temporal variability of soil moisture and its effect on vegetation in a desertified aeolian riparian ecotone on the Tibetan Plateau, China. J. Hydrol. 2013, 479, 215–225. [Google Scholar] [CrossRef]
- Baroni, G.; Ortuani, B.; Facchi, A.; Gandolfi, C. The role of vegetation and soil properties on the spatio-temporal variability of the surface soil moisture in a maize-cropped field. J. Hydrol. 2013, 489, 148–159. [Google Scholar] [CrossRef]
- Joshi, C.; Mohanty, B.P. Physical controls of near surface soil moisture across varying spatial scales in an agricultural landscape during SMEX02. Water Resour. Res. 2010, 46, W12503. [Google Scholar] [CrossRef]
- Mohanty, B.P.; Skaggs, T.H. Spatio-temporal evolution and time-stable characteristics of soil moisture within remote sensing footprints with varying soil, slope, and vegetation. Adv. Water Resour. 2001, 24, 1051–1067. [Google Scholar] [CrossRef]
- Zhou, J.; Fu, B.; Gao, G.; Lü, N.; Lü, Y.; Wang, S. Temporal stability of surface soil moisture of different vegetation types in the Loess Plateau of China. CATENA 2015, 128, 1–15. [Google Scholar] [CrossRef]
- Song, X.Y.; Kang, S.Z.; Shen, B. Dynamic Regularity of Soil Moisture in Farmland with Different Planting on Loess Hilly and Gully Region in North-West of China. J. Soil Water Conserv. 2003, 2, 130–133. [Google Scholar]
- Odhiambo, J.J.O.; Bomke, A.A. Cover crop effects on spring soil water content and the implications for cover crop management in south coastal British Columbia. Agric. Water Manag. 2007, 88, 92–98. [Google Scholar] [CrossRef]
- Hu, W.; Si, B.C. Revealing the relative influence of soil and topographic properties on soil water content distribution at the watershed scale in two sites. J. Hydrol. 2014, 516, 107–118. [Google Scholar] [CrossRef]
- Li, T.; Hao, X.M.; Kang, S.Z. Spatiotemporal variability of soil moisture as affected by soil properties during irrigation cycles. Soil Sci. Soc. Am. J. 2014, 598–608. [Google Scholar] [CrossRef]
- Molina, A.J.; Latron, J.; Rubio, C.M.; Gallart, F.; Llorens, P. Spatio-temporal variability of soil water content on the local scale in a Mediterranean mountain area (Vallcebre, North Eastern Spain). How different spatio-temporal scales reflect mean soil water content. J. Hydrol. 2014, 516, 182–192. [Google Scholar] [CrossRef]
- Bogena, H.R.; Herbst, M.; Huisman, J.A.; Rosenbaum, U.; Weuthen, A.; Vereecken, H. Potential of wireless sensor networks for measuring soil water content variability. Vadose Zone J. 2010, 9, 1002–1013. [Google Scholar] [CrossRef]
- Hu, W.; Si, B.C. Soil water prediction based on its scale-specific control using multivariate empirical mode decomposition. Geoderma 2013, 193, 180–188. [Google Scholar] [CrossRef]
- Whalley, W.R.; Binley, A.; Watts, C.W.; Shanahan, P.; Dodd, L.C.; Ober, E.S.; Ashton, R.W.; Webster, C.P.; White, R.P.; Hawkesford, M.J. Methods to estimate changes in soil water for phenotyping root activity in the field. Plant Soil 2017, 415, 407–422. [Google Scholar] [CrossRef]
- Wang, Y.Q.; Shao, M.A.; Liu, Z.P. Vertical distribution and influencing factors of soil water content within 21-m profile on the Chinese Loess Plateau. Geoderma 2013, 193, 300–310. [Google Scholar] [CrossRef]
- Dodd, I.C.; Whalley, W.R.; Obe, R.E.S.; Parry, M.A.J. Genetic and management approaches to boost UK wheat yields by ameliorating water deficits. J. Exp. Bot. 2011, 62, 5241–5248. [Google Scholar] [CrossRef] [PubMed]
- Gaur, N.; Mohanty, B.P. Evolution of physical controls for soil moisture in humid and subhumid watersheds. Water Resour. Res. 2013, 9, 1244–1258. [Google Scholar] [CrossRef]
- Singh, V.P. Entropy theory for movement of moisture in soils. Water Resour. Res. 2010, 46, W03516. [Google Scholar] [CrossRef]
- Kang, S.Z.; Su, X.L.; Tong, L.; Zhang, J.H.; Zhang, L.; Davies, W.J. A warning from an ancient oasis: Intensive human activities are leading to potential ecological and social catastrophe. Int. J. Sustain. Dev. World 2008, 15, 440–447. [Google Scholar] [CrossRef]
- Li, S.; Kang, S.Z.; Zhang, L.; Ortega-Farias, S.; Li, F.; Du, T.; Tong, L.; Wang, S.; Ingman, M.; Guo, W. Measuring and modeling maize evapotranspiration under plastic film-mulching condition. J. Hydrol. 2013, 503, 153–168. [Google Scholar] [CrossRef]
- Warrick, A.W.; Nielsen, D.R. Spatial Variability of Soil Physical Properties in the Field; Academic Press: New York, NY, USA, 1980; pp. 319–344. [Google Scholar]
- Shannon, C.E. A mathematical theory of communication. Bell Syst. Tech. J. 1948, 27, 623–656. [Google Scholar] [CrossRef]
- Shannon, C.E. A mathematical theory of communication. ACM SIGMOBILE Mob. Comput. Commun. Rev. 2001, 5, 3–55. [Google Scholar] [CrossRef]
- Li, C.; Singh, V.P.; Mishra, A.K. Entropy theory-based criterion for hydrometric network evaluation and design: Maximum information minimum redundancy. Water Resour. Res. 2012, 48, W05521. [Google Scholar] [CrossRef]
- Singh, V.P. Entropy Theory and Its Application in Environmental and Water Engineering; Wiley: Hoboken, NJ, USA, 2013. [Google Scholar]
- Singh, V.P. Entropy Theory in Hydrologic Science and Engineering; McGraw-Hill: New York, NY, USA, 2015. [Google Scholar]
- Kang, S.Z.; Gu, B.J.; Du, T.S.; Zhang, J.H. Crop coefficient and ratio of transpiration to evapotranspiration of winter wheat and maize in a semi-humid region. Agric. Water Manag. 2003, 59, 239–254. [Google Scholar] [CrossRef]
- Utset, A.; Farre, I.; Martinez-Cob, A.; Cavero, J. Comparing Penman–Monteith and Priestley–Taylor approaches as reference-evapotranspiration inputs for modeling maize water-use under Mediterranean conditions. Agric. Water Manag. 2004, 66, 205–219. [Google Scholar] [CrossRef]
- Ding, R.S.; Kang, S.Z.; Li, F.S.; Zhang, Y.Q.; Tong, L.; Sun, Q.Y. Evaluating eddy covariance method by large-scale weighing lysimeter in a maize field of north-west China. Agric. Water Manag. 2010, 98, 87–95. [Google Scholar] [CrossRef]
- Ding, R.S. Mechanism of Water and Heat Transfer and Evaportranspitation Modeling over Maize Field in an Arid Inland Region. Ph.D. Thesis, China Agricultrual University, Beijing, China, 2012. [Google Scholar]
- Ding, R.S.; Kang, S.Z.; Li, F.S.; Zhang, Y.Q.; Tong, L. Evapotranspiration measurement and estimation using modified Priestley–Taylor model in an irrigated maize field with mulching. Agric. For. Meteorol. 2013, 168, 140–148. [Google Scholar] [CrossRef]
- Lian, C.Y.; Ma, Z.M.; Lu, X.D.; Cao, S.Y. Research on main crops water requirement and crop Coefficient in Oasis irrigation Region. J. Irrig. Drain. 2012, 31, 136–139. (In Chinese) [Google Scholar]
- Allen, R.G.; Pereira, L.S.; Raes, D.; Smith, M. Crop Evapotranspiration: Guidelines for Computing Crop Water Requirements; Irrigation and Drainage Paper No.56; FAO: Rome, Italy, 1998. [Google Scholar]
- Hausser, J.; Strimmer, K. Entropy inference and the James-Stein estimator, with application to nonlinear gene association networks. J. Mach. Learn. Res. 2009, 10, 1469–1484. [Google Scholar]
- Wang, L. Evaluation of Effectiveness of Soil Moisture in Shiyang River Basin Farmland and Its Dynamic Simulation. Ph.D. Thesis, Northwest A&F University, Xianyang, China, 2014. [Google Scholar]
- Henning, H.; Olga, T.; Heinz-Josef, K.; Bernward, M. Subsoil properties and cereal growth as affected by a single pass of heavy machinery and two tillage systemson a Luvisol. J. Plant Nutr. Soil Sci. 2008, 171, 580–590. [Google Scholar]
- Ryu, D.; Famiglietti, J.S. Multi-scale spatial correlation and scaling behavior of surface soil moisture. Geophys. Res. Lett. 2006, 33, L08404. [Google Scholar] [CrossRef]
Figure 1.
Location of the study area.
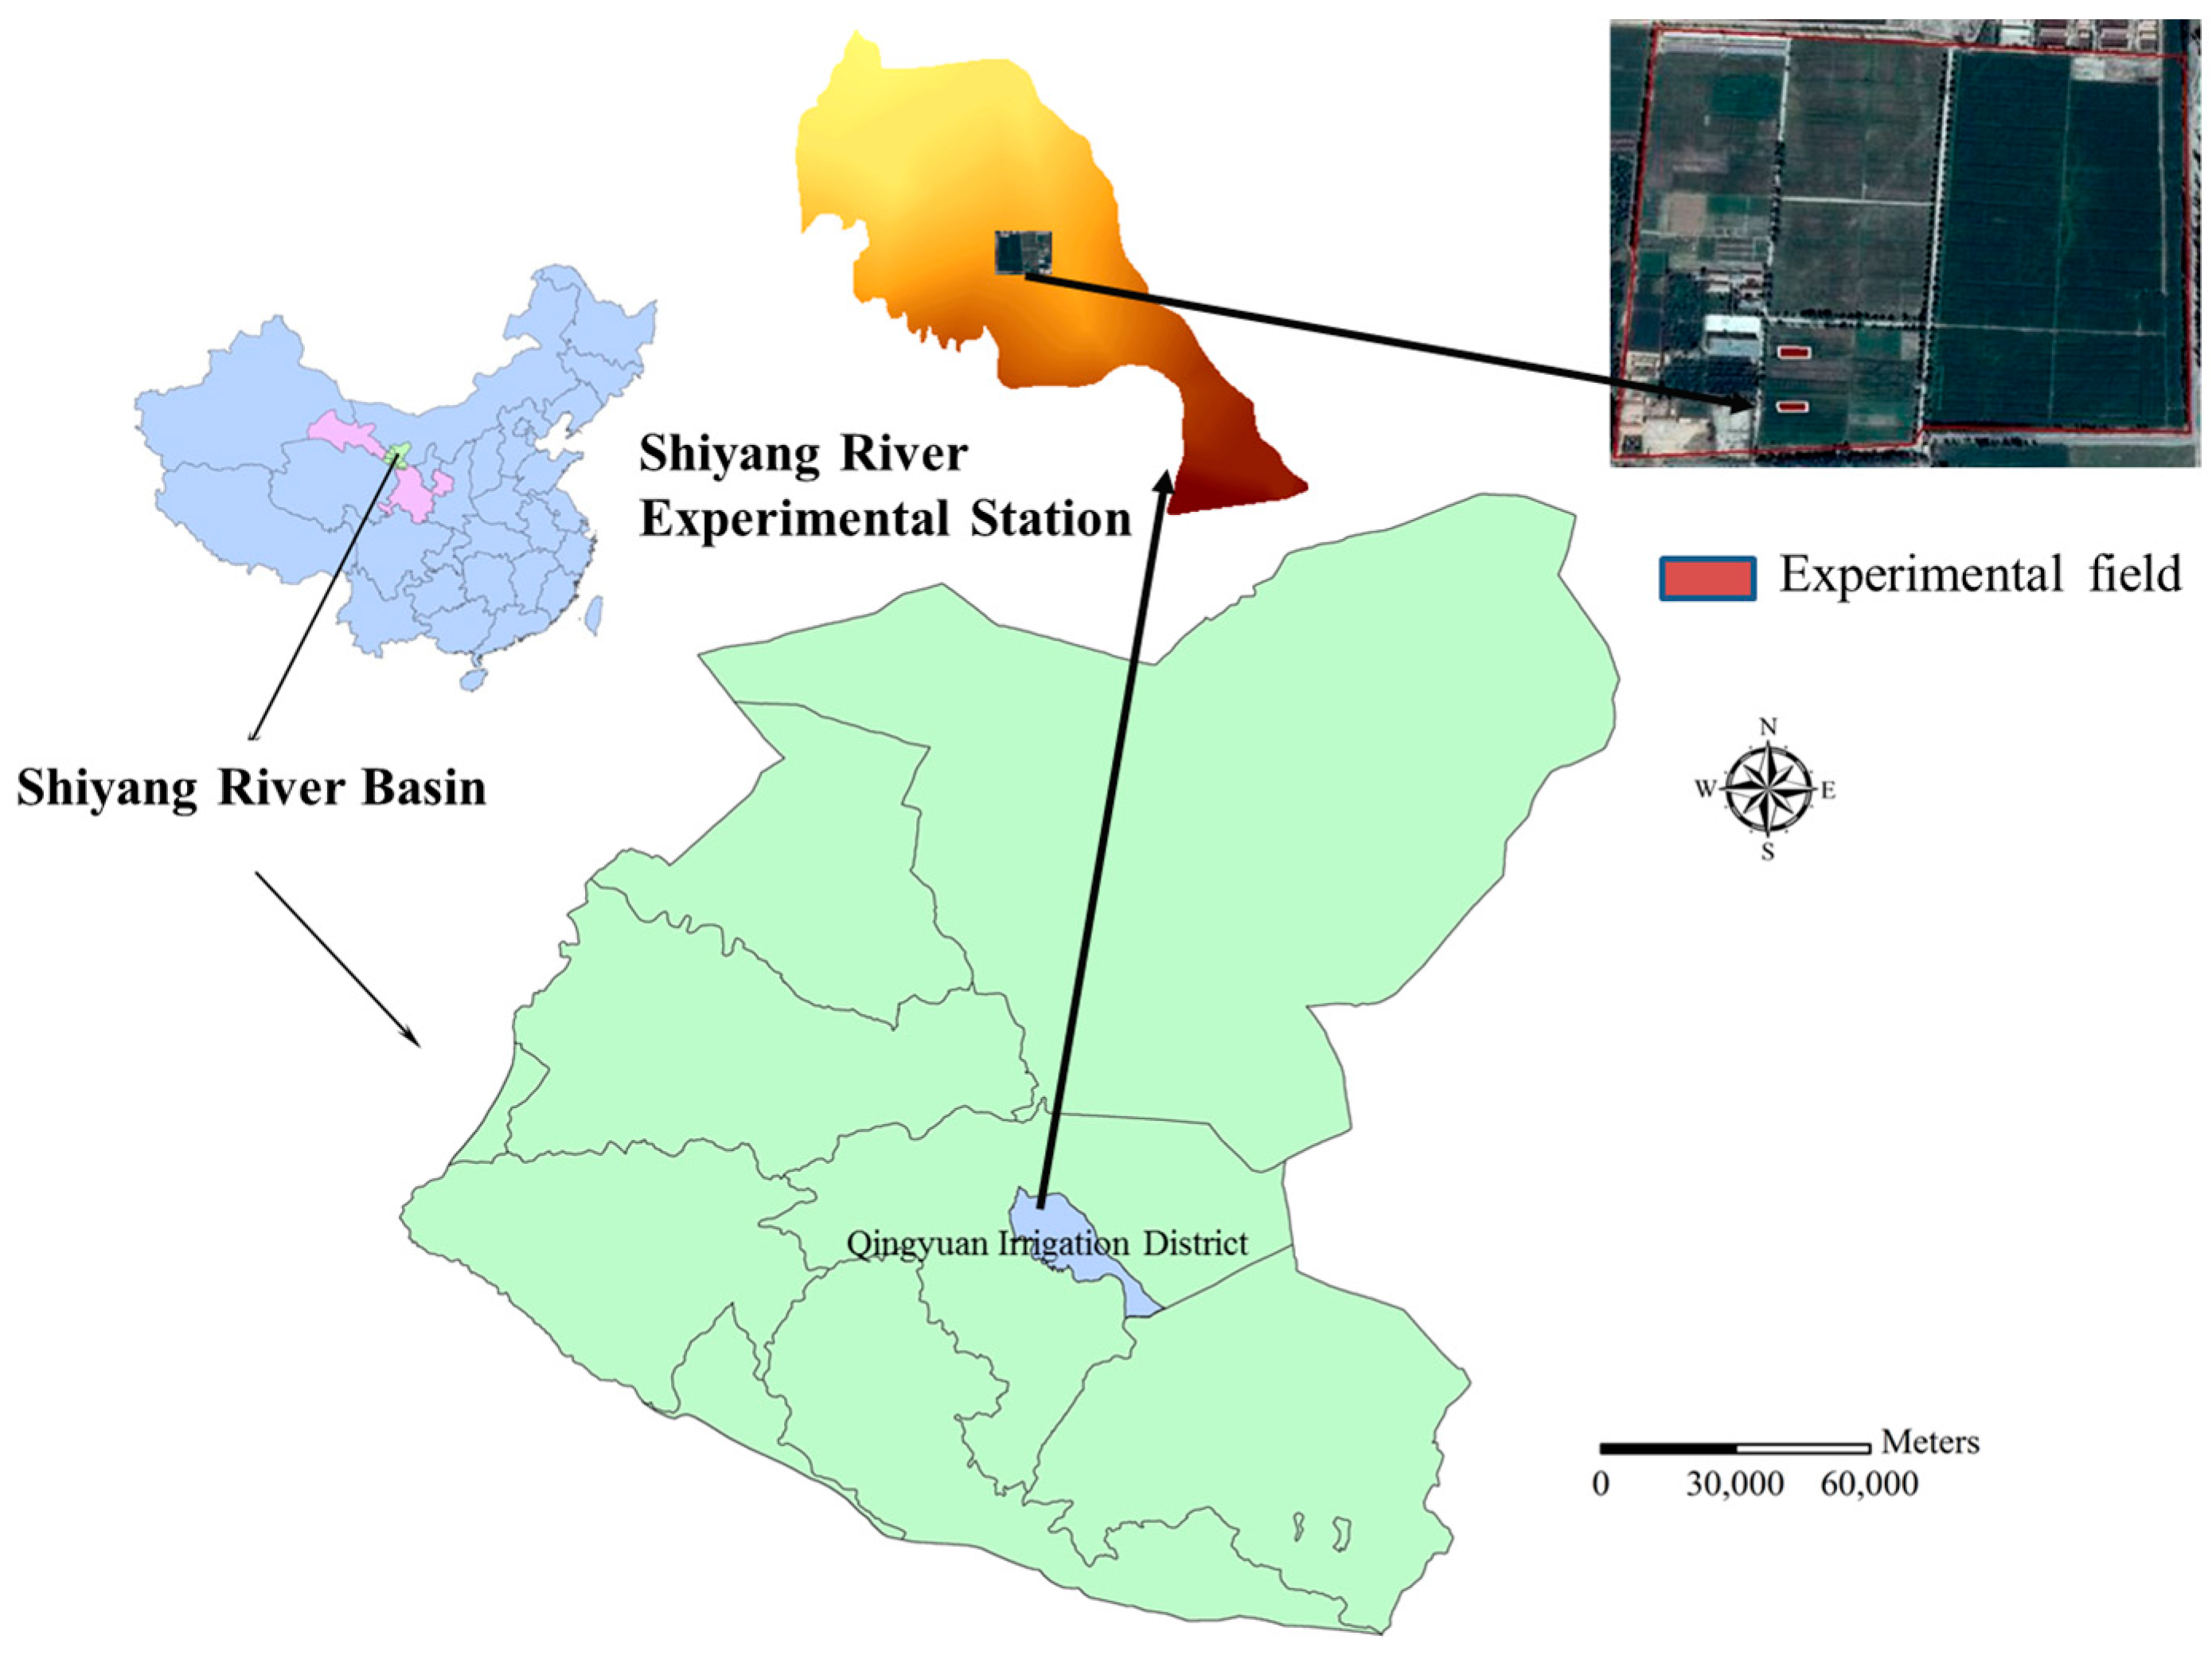
Figure 2.
Layout of soil water content measuring probes in the experiment field under maize and wheat covers in 2013.
Figure 2.
Layout of soil water content measuring probes in the experiment field under maize and wheat covers in 2013.
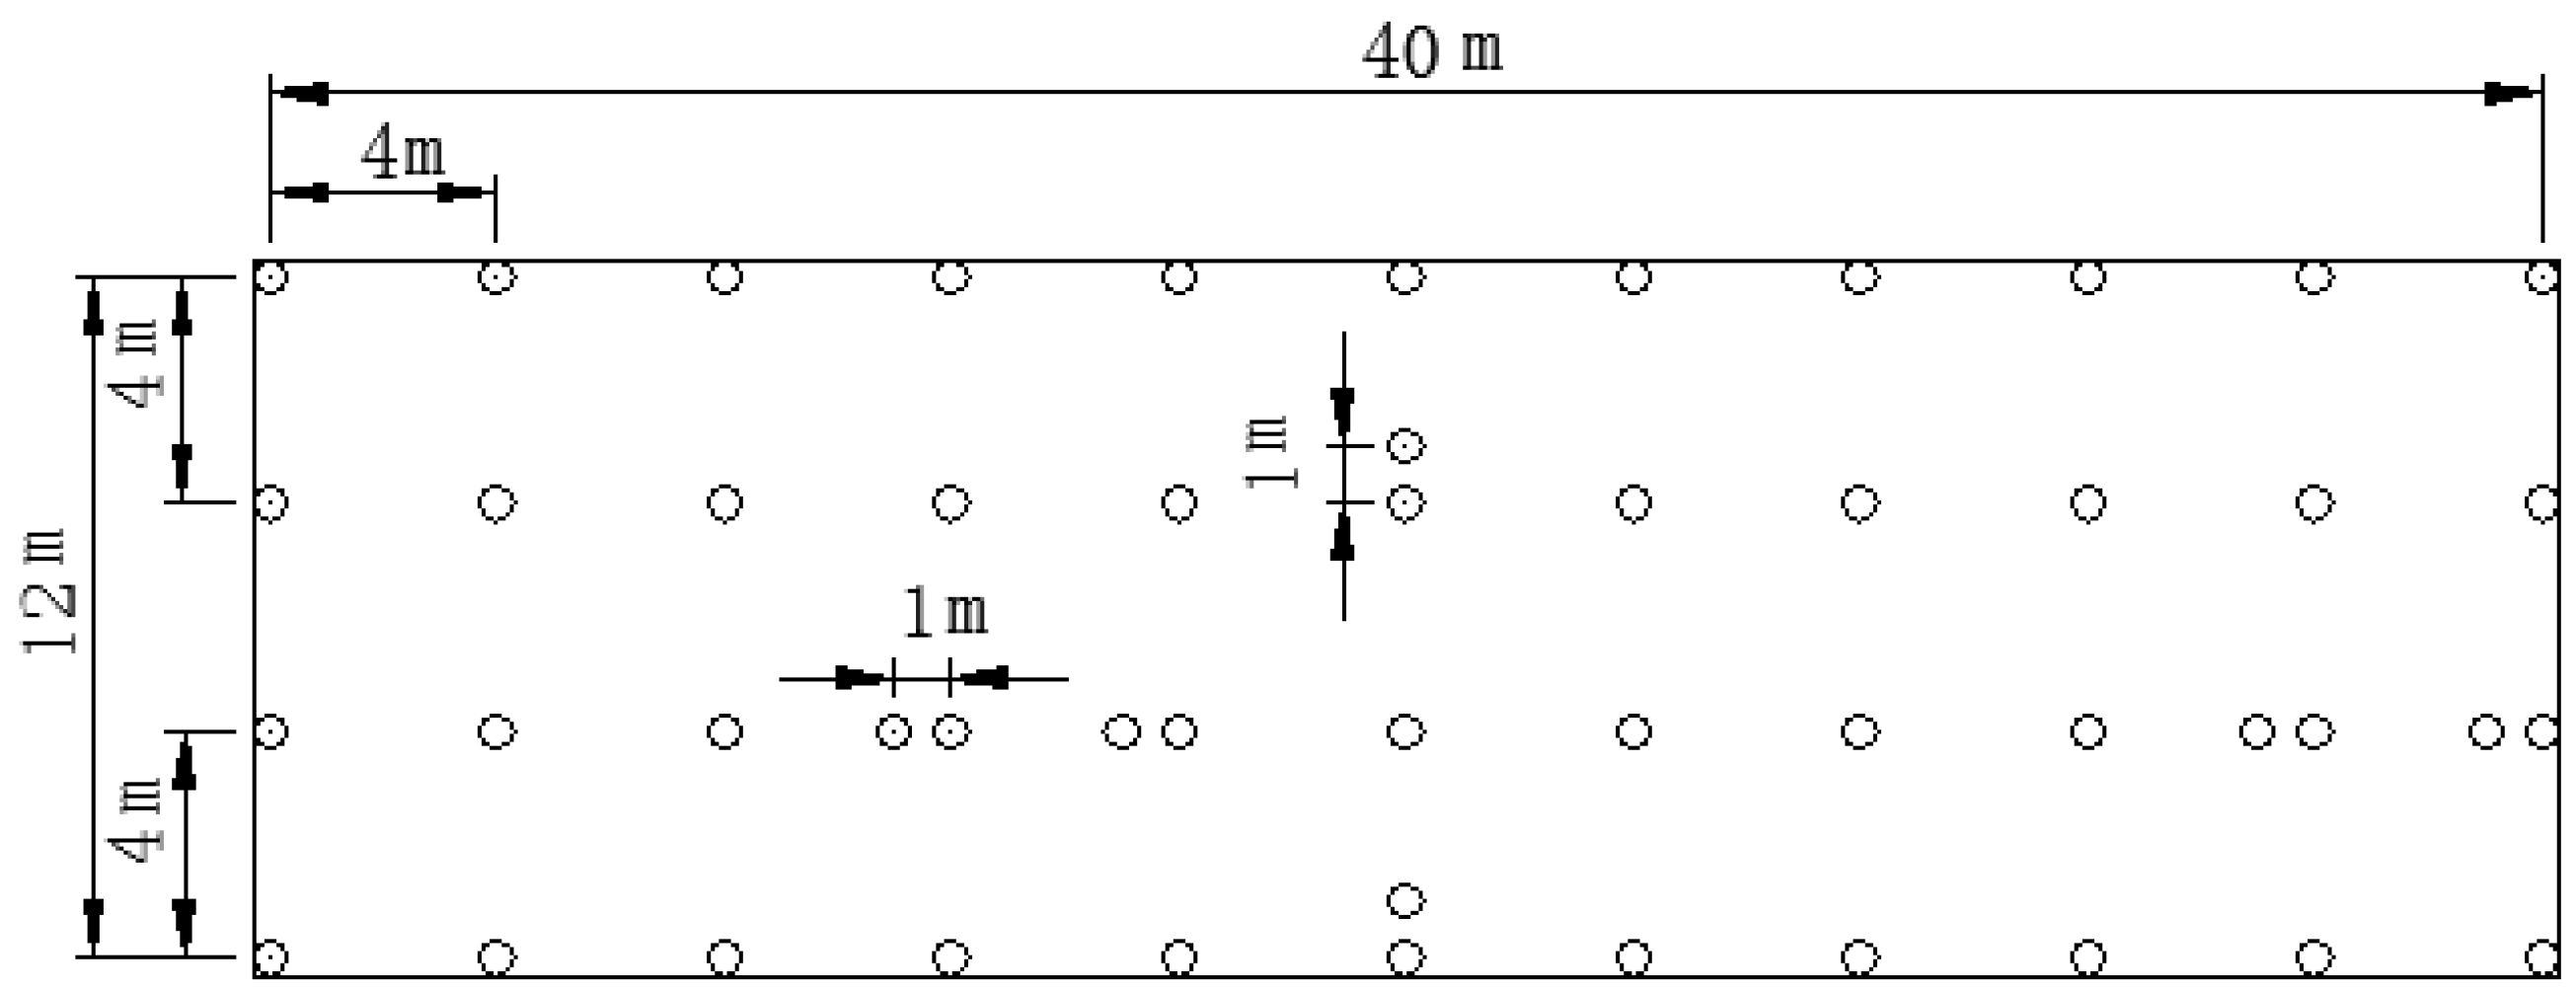
Figure 3.
Layout of soil water content measuring probes in the experiment field under maize and wheat covers in 2014.
Figure 3.
Layout of soil water content measuring probes in the experiment field under maize and wheat covers in 2014.

Figure 4.
Temporal standard deviation (STDV) in time versus temporally averaged soil water content for different soil depths in 2013. STDV values for (a) 0–10 cm, (b) 10–20 cm, (c) 20–40 cm, (d) 40–100 cm and (e) 100–120 cm soil depths.
Figure 4.
Temporal standard deviation (STDV) in time versus temporally averaged soil water content for different soil depths in 2013. STDV values for (a) 0–10 cm, (b) 10–20 cm, (c) 20–40 cm, (d) 40–100 cm and (e) 100–120 cm soil depths.
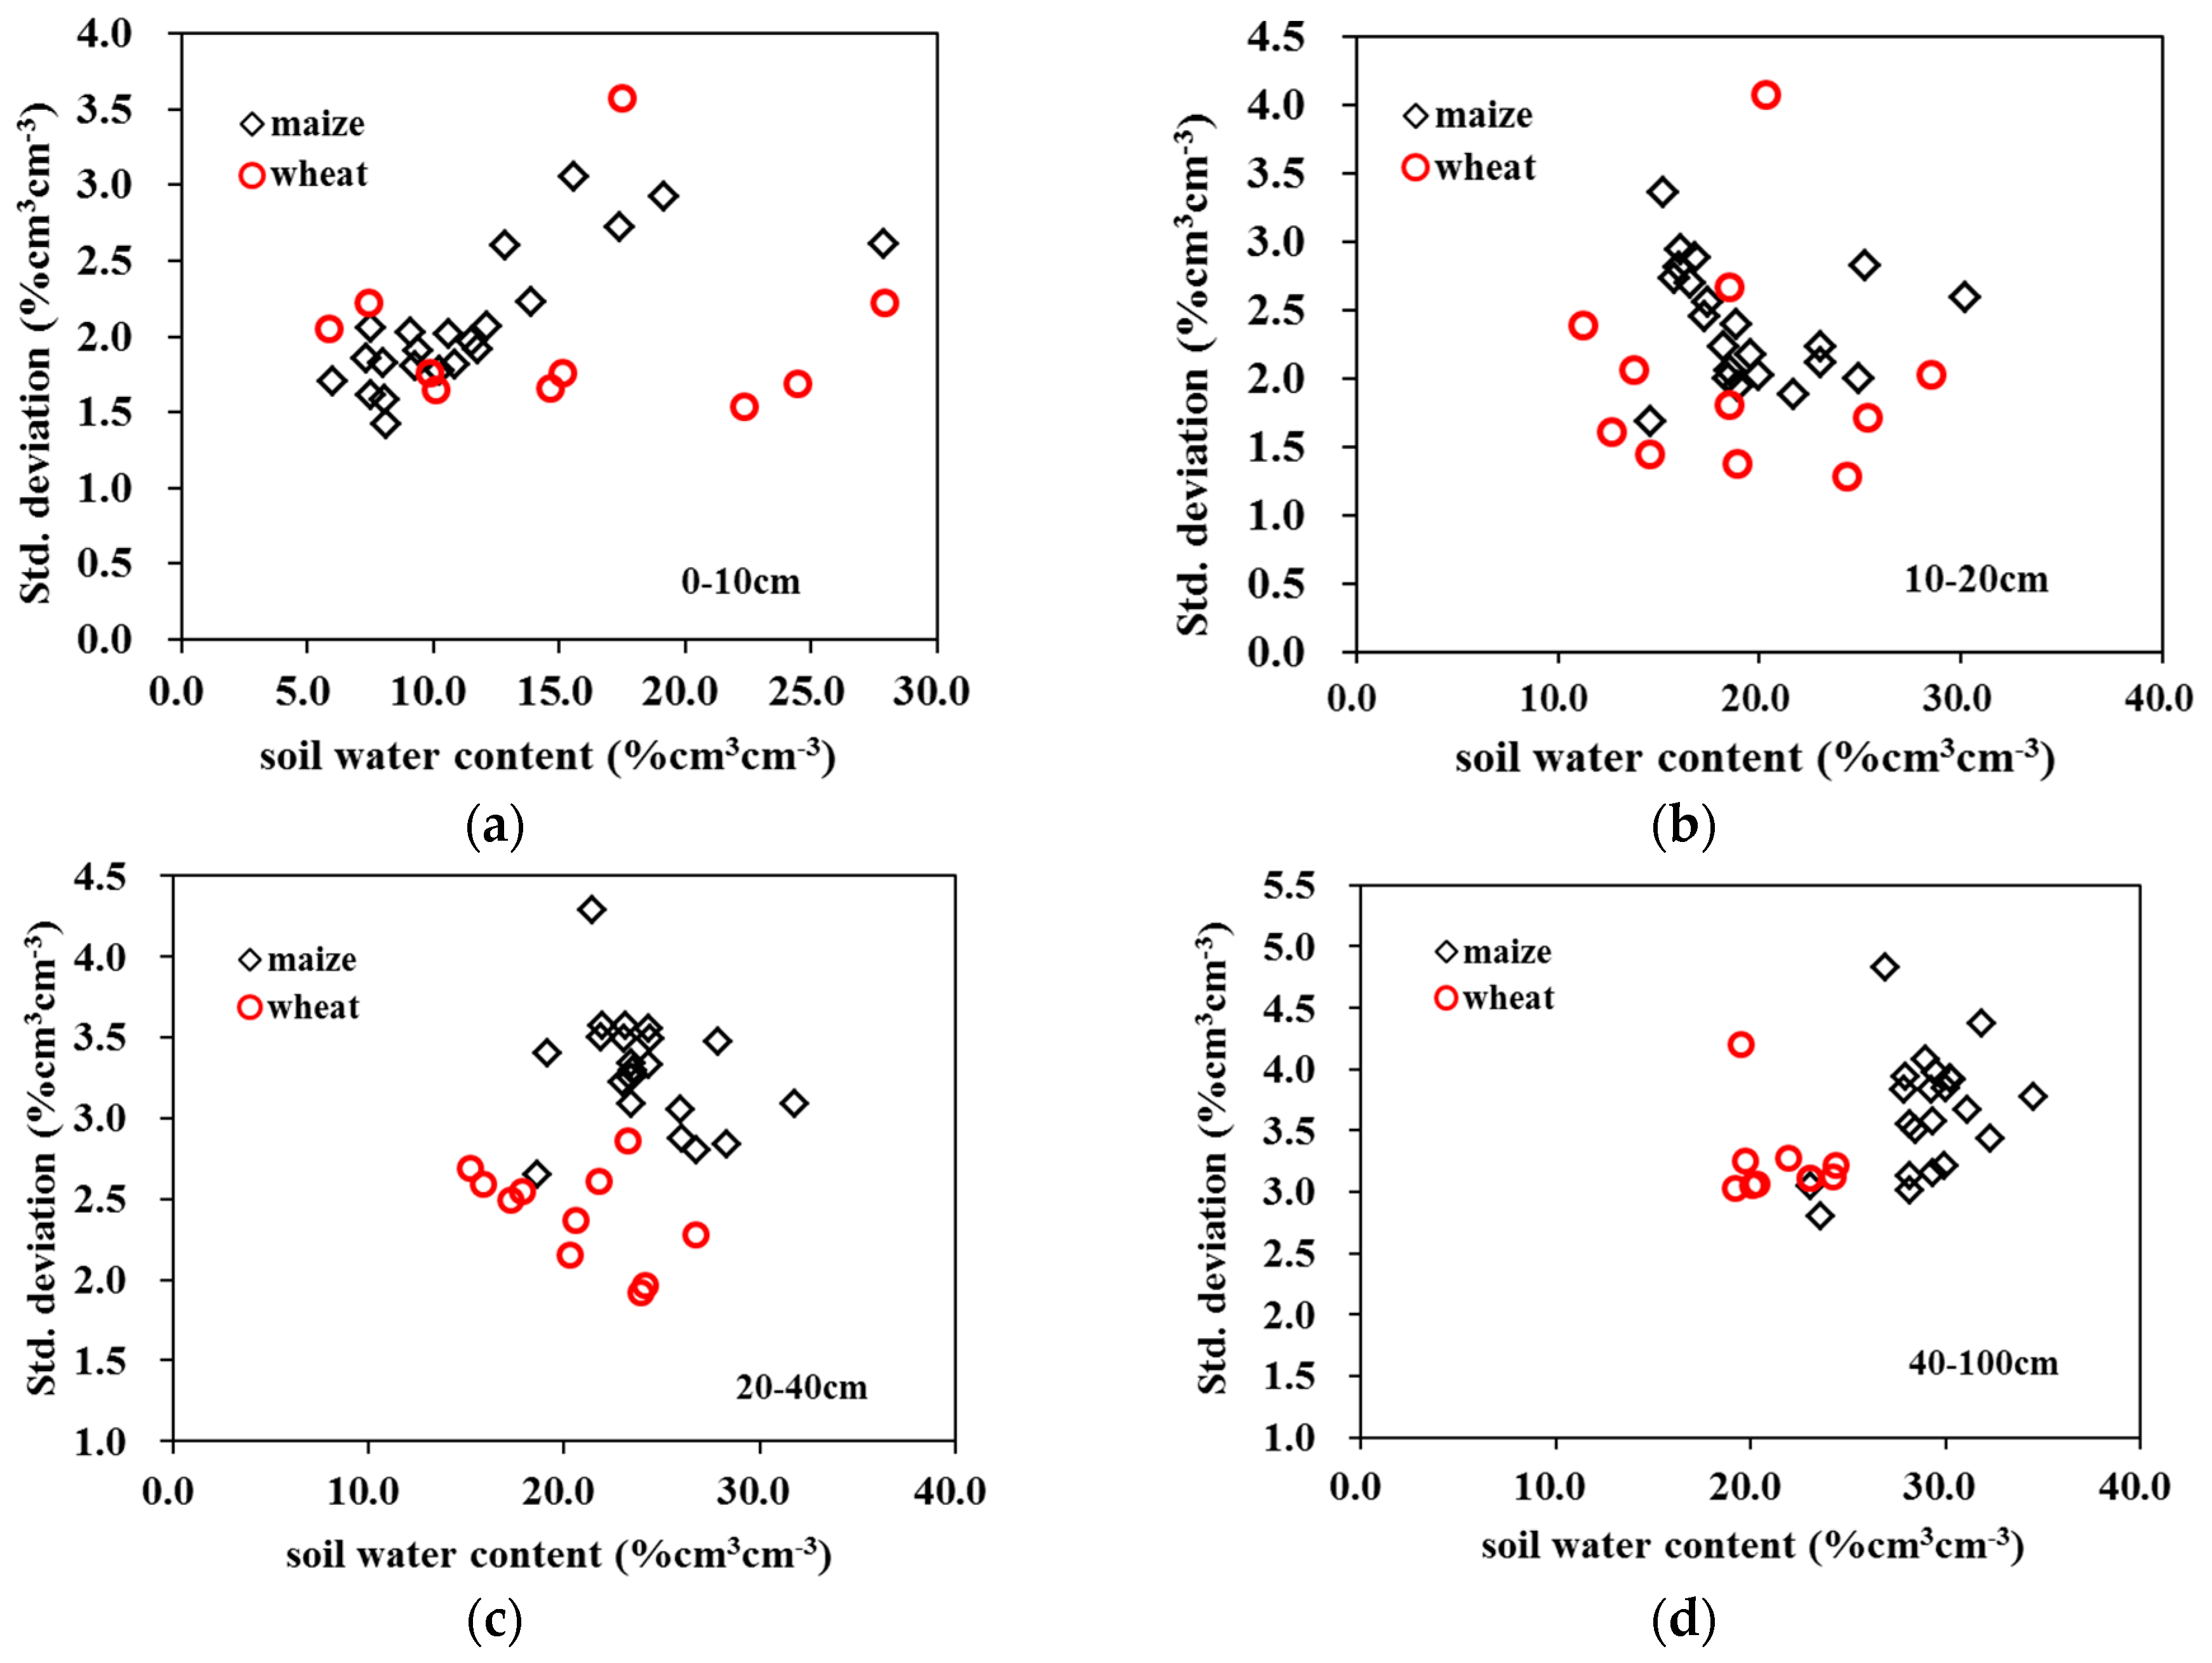
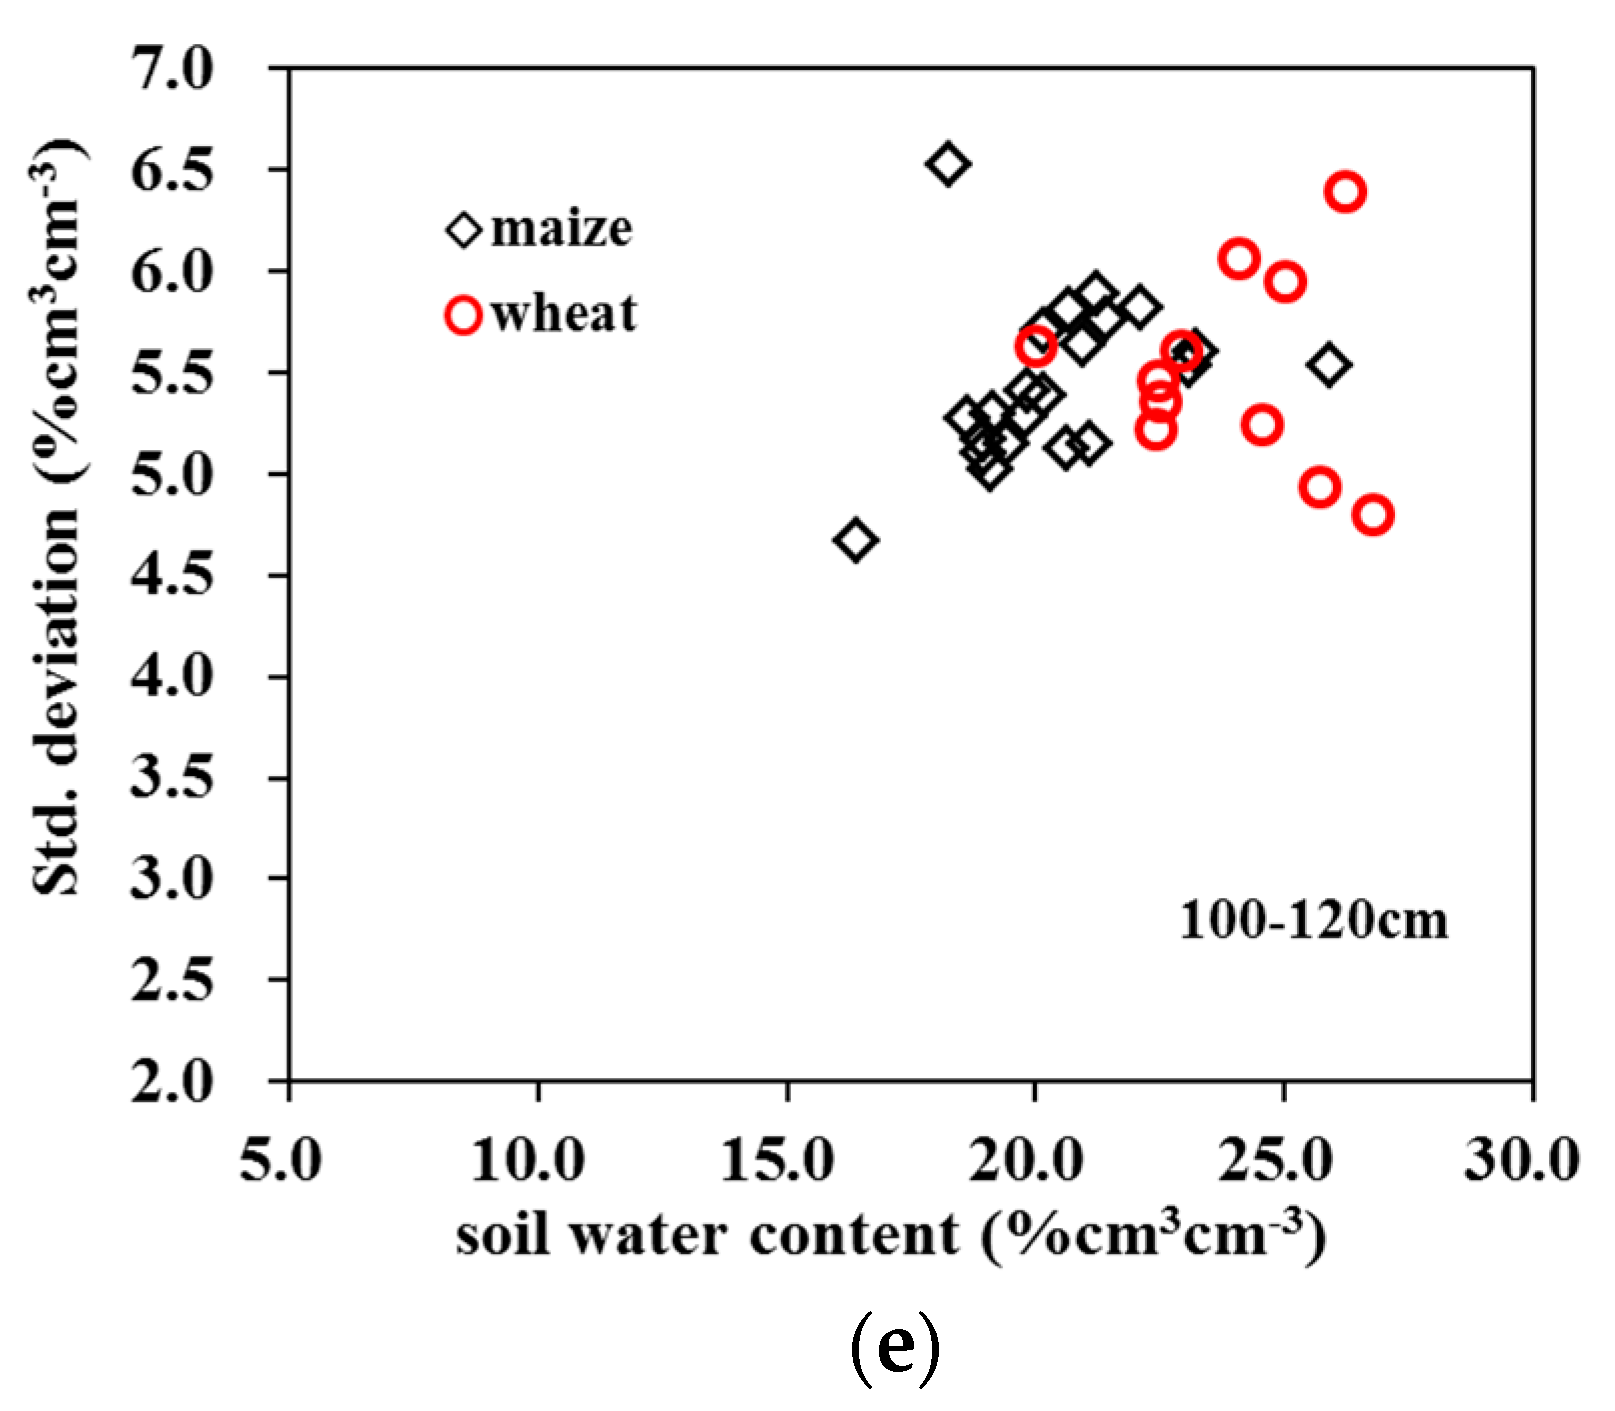
Figure 5.
Temporal standard deviation (STDV) in time versus temporally averaged soil water content for different soil depths in 2014. STDV values for (a) 0–10 cm, (b) 10–20 cm, (c) 20–40 cm, (d) 40–100 cm and (e) 100–120 cm soil depths.
Figure 5.
Temporal standard deviation (STDV) in time versus temporally averaged soil water content for different soil depths in 2014. STDV values for (a) 0–10 cm, (b) 10–20 cm, (c) 20–40 cm, (d) 40–100 cm and (e) 100–120 cm soil depths.

Figure 6.
Temporal variation of soil water content under maize cover and wheat cover in 2013. ET0, P and SWC values for (a) maize and (b) wheat in 2013.
Figure 6.
Temporal variation of soil water content under maize cover and wheat cover in 2013. ET0, P and SWC values for (a) maize and (b) wheat in 2013.

Figure 7.
Temporal variation of soil water content under maize cover and wheat cover in 2014. ET0, P and SWC values for (a) maize and (b) wheat in 2014.
Figure 7.
Temporal variation of soil water content under maize cover and wheat cover in 2014. ET0, P and SWC values for (a) maize and (b) wheat in 2014.
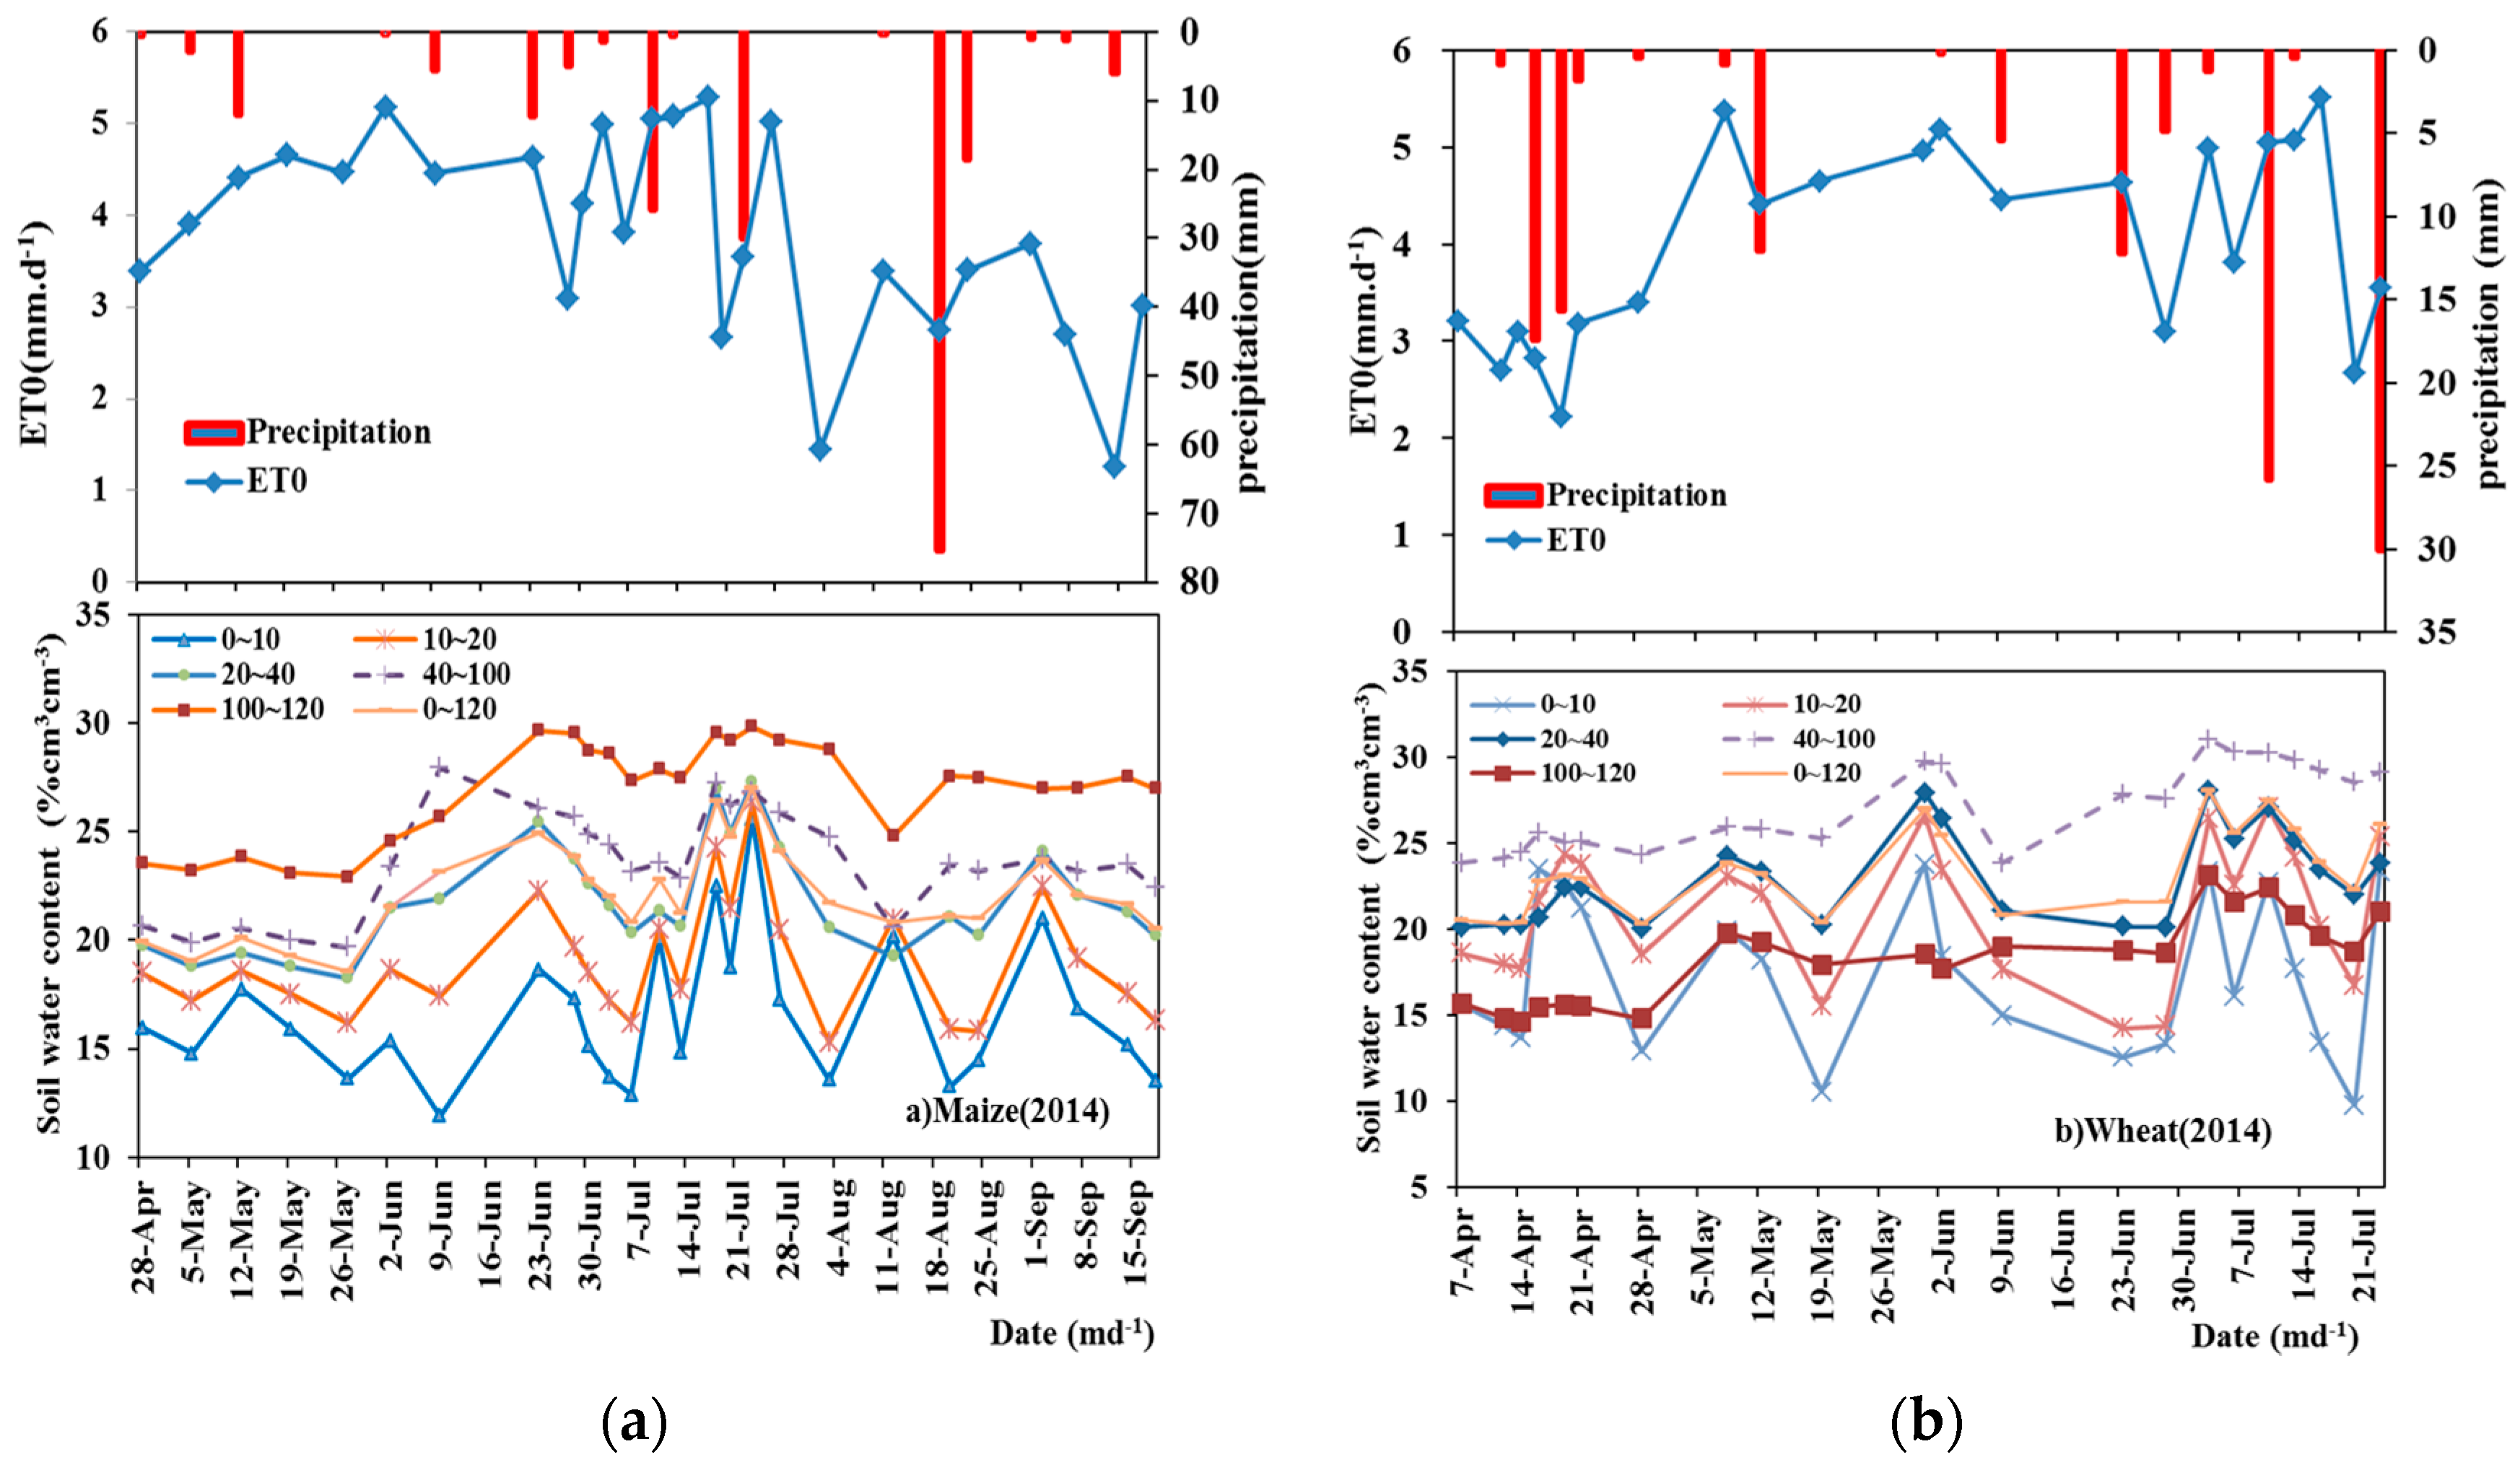
Figure 8.
Mean soil water content versus CV for maize and wheat in 2013–2014. CV values for (a) maize, (b) wheat cover in 2013, CV values for (c) maize and (d) wheat cover in 2014.
Figure 8.
Mean soil water content versus CV for maize and wheat in 2013–2014. CV values for (a) maize, (b) wheat cover in 2013, CV values for (c) maize and (d) wheat cover in 2014.
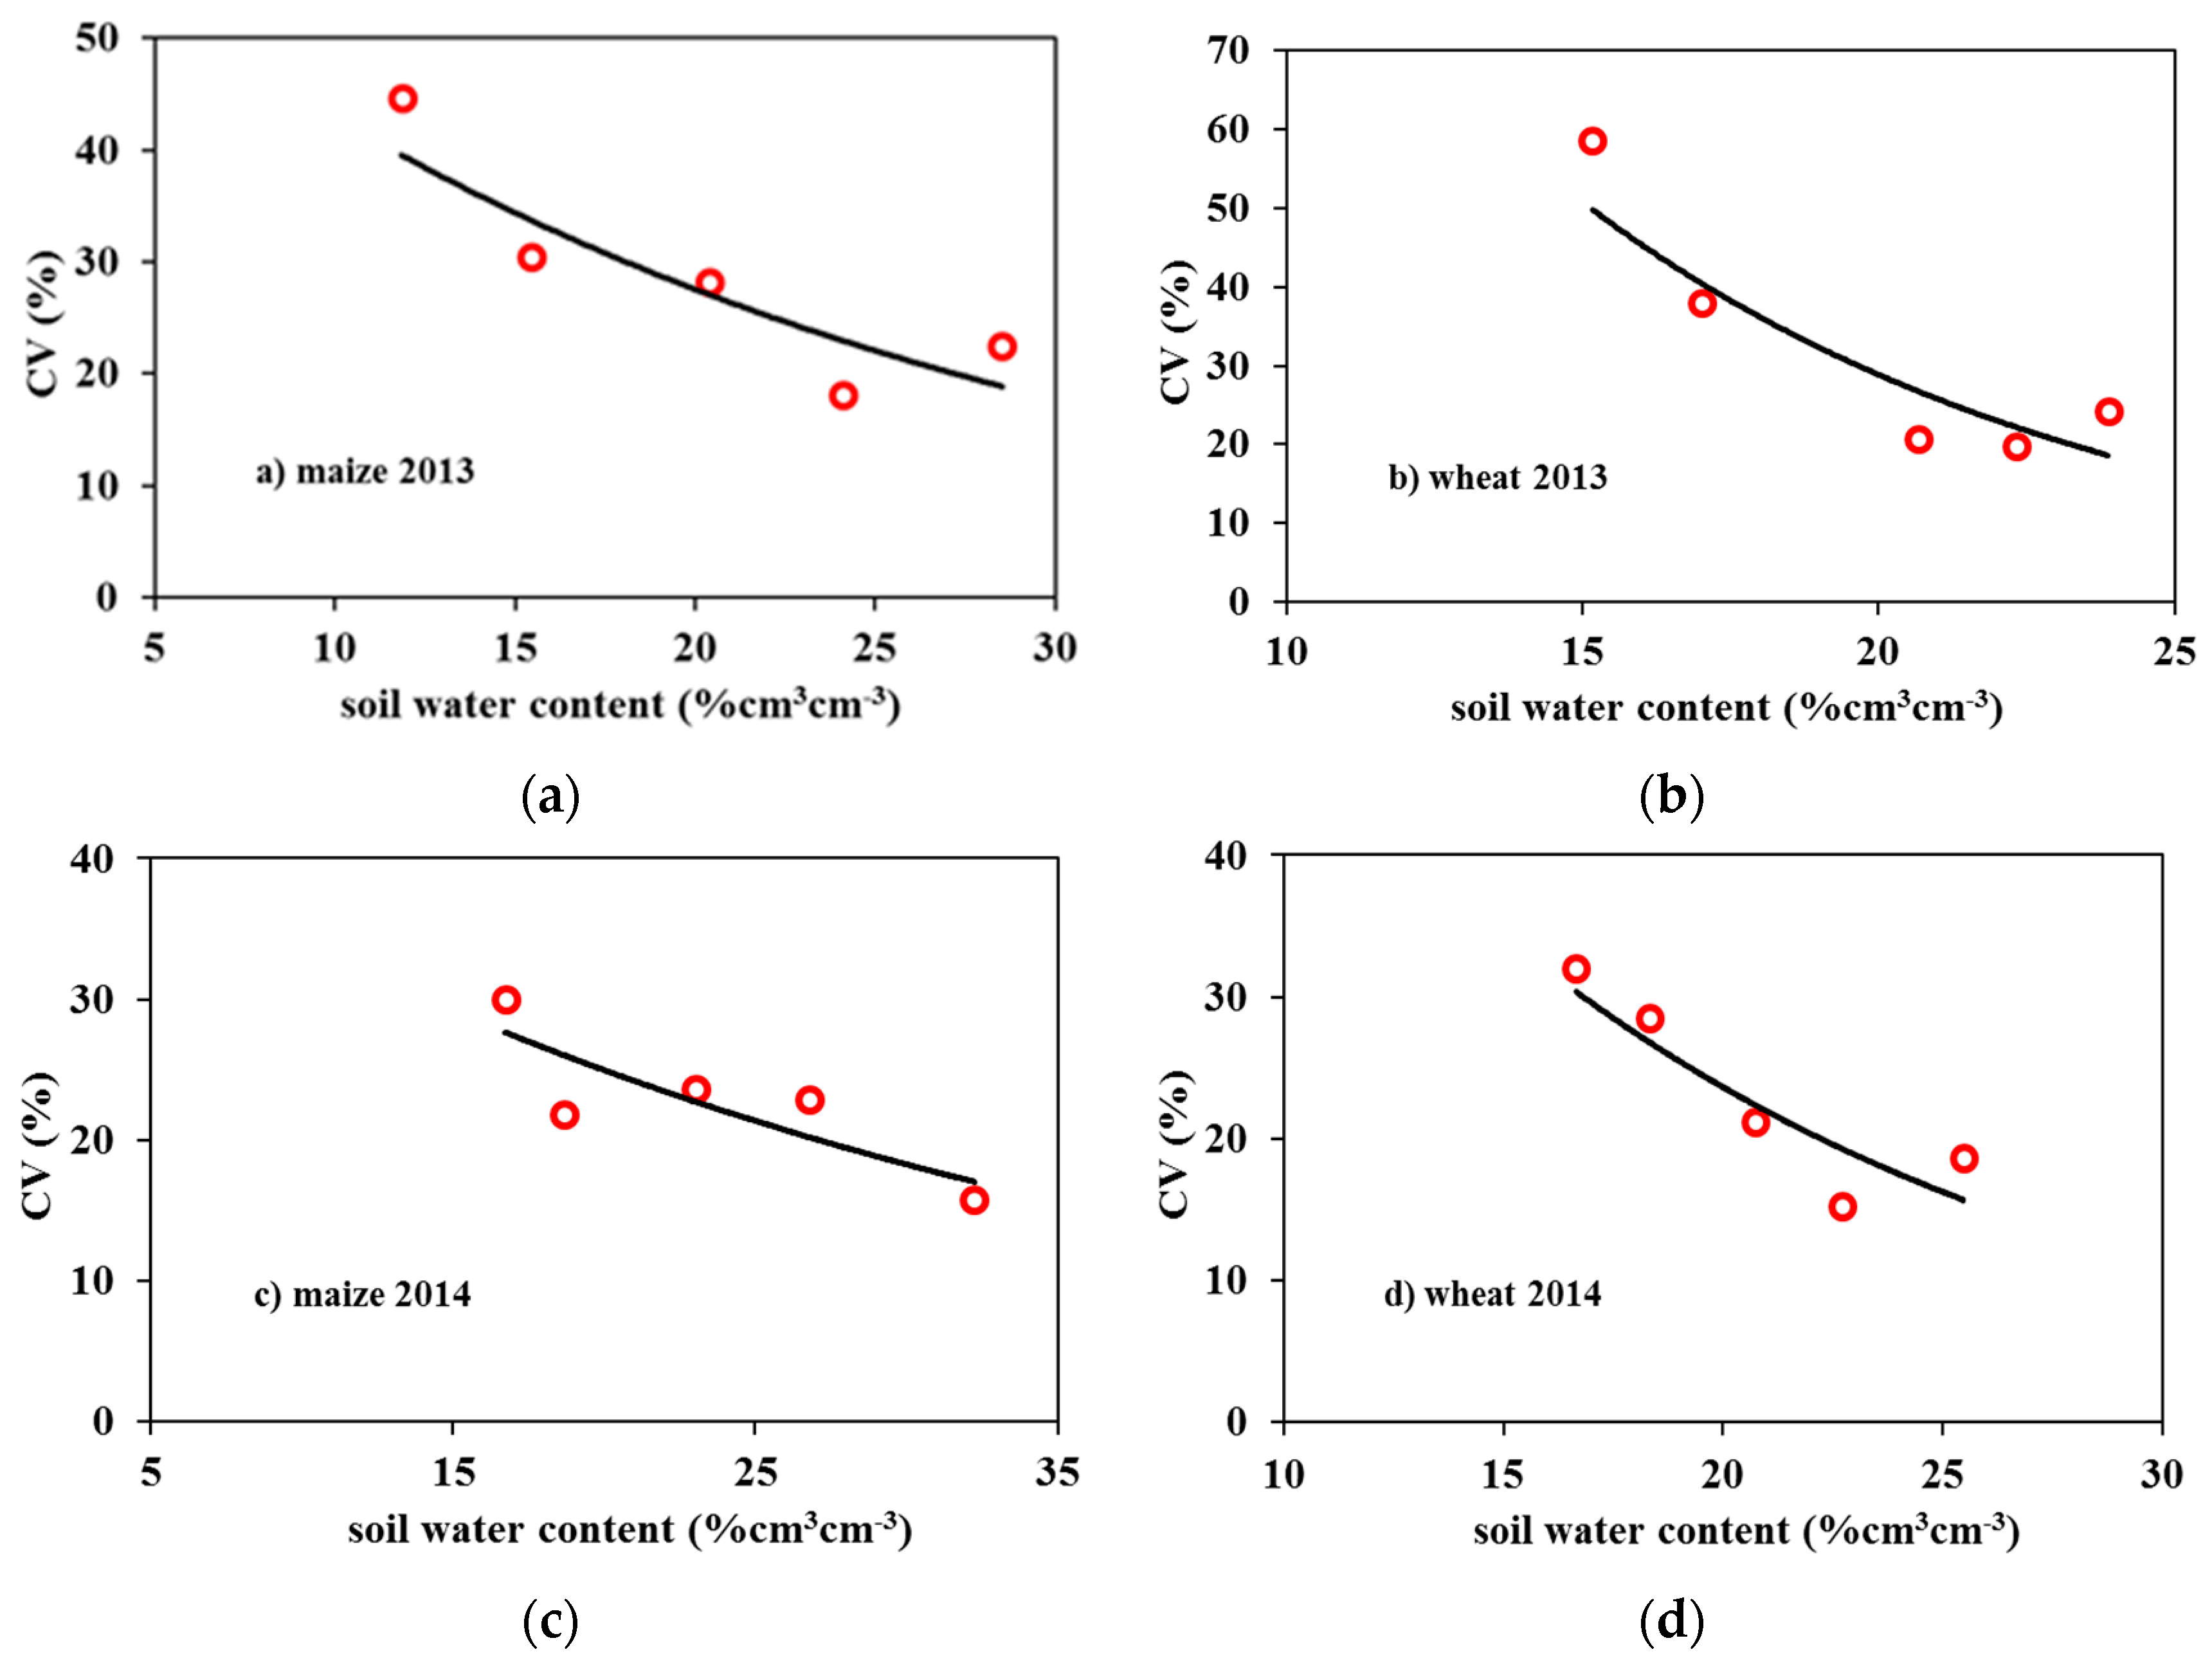
Figure 9.
Mean soil water content versus entropy for maize and wheat in 2013. Entropy values for (a) 0–10 cm, (b) 10–20 cm, (c) 20–40 cm, (d) 40–100 cm and (e) 100–120 cm soil depths.
Figure 9.
Mean soil water content versus entropy for maize and wheat in 2013. Entropy values for (a) 0–10 cm, (b) 10–20 cm, (c) 20–40 cm, (d) 40–100 cm and (e) 100–120 cm soil depths.

Figure 10.
Mean soil water content versus entropy under maize and wheat cover in 2014. Entropy values for (a) 0–10 cm, (b) 10–20 cm, (c) 20–40 cm, (d) 40–100 cm and (e) 100–120 cm soil depths.
Figure 10.
Mean soil water content versus entropy under maize and wheat cover in 2014. Entropy values for (a) 0–10 cm, (b) 10–20 cm, (c) 20–40 cm, (d) 40–100 cm and (e) 100–120 cm soil depths.

Figure 11.
Mutual entropy under different crop covers in 2013–2014. Mutual entropy values for (a) Field I and (b) Field II in 2013, mutual entropy values for (c) Field I and (d) Field II in 2014.
Figure 11.
Mutual entropy under different crop covers in 2013–2014. Mutual entropy values for (a) Field I and (b) Field II in 2013, mutual entropy values for (c) Field I and (d) Field II in 2014.
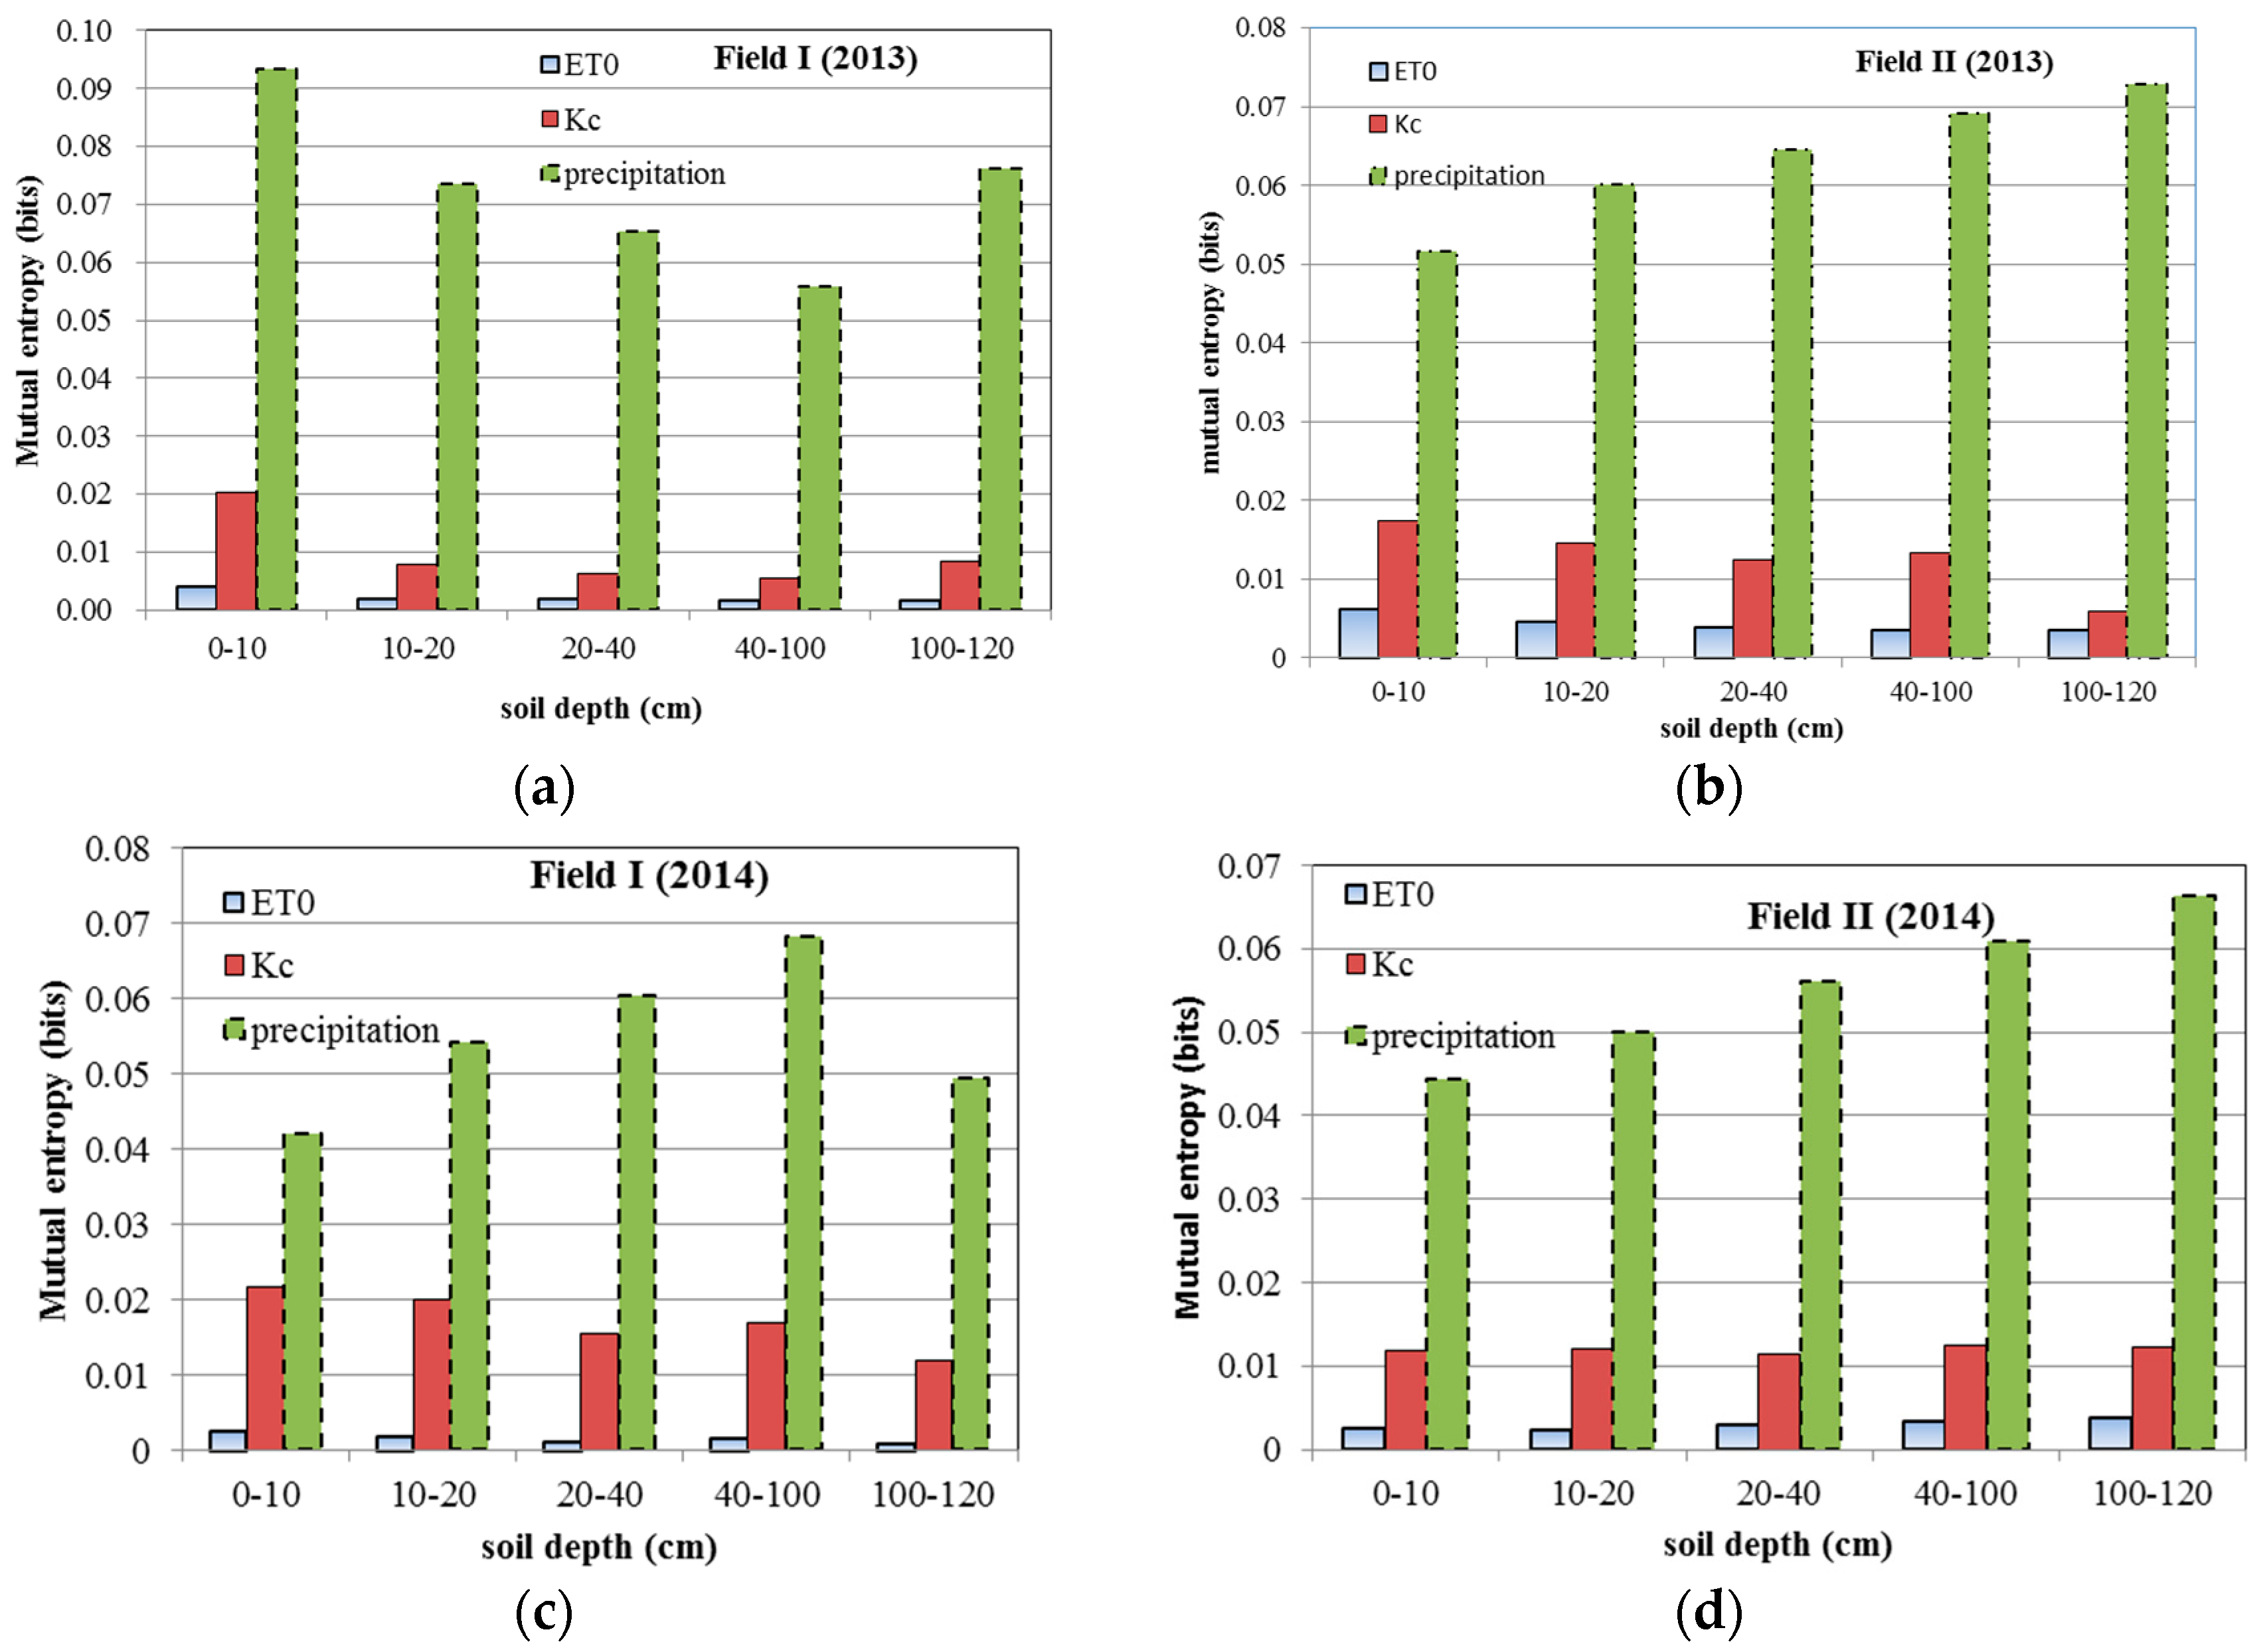
Figure 12.
Informational correlation coefficient (R0) under different crop covers in 2013–2014. R0 values for (a) maize and (b) wheat in 2013, R0 values for (c) maize and (d) wheat in 2014.
Figure 12.
Informational correlation coefficient (R0) under different crop covers in 2013–2014. R0 values for (a) maize and (b) wheat in 2013, R0 values for (c) maize and (d) wheat in 2014.


Table 1.
Physical properties of soil profile at different sites.
| Field Site | Soil Depth (cm) | Soil Particle Content (g/g) | Soil Type | ||
|---|---|---|---|---|---|
| Sand | Silt | Clay | |||
| I | 10 | 0.629 | 0.268 | 0.103 | sandy loam |
| 20 | 0.649 | 0.251 | 0.0996 | sandy loam | |
| 40 | 0.656 | 0.241 | 0.103 | sandy loam | |
| 60 | 0.443 | 0.412 | 0.146 | loam | |
| 80 | 0.653 | 0.260 | 0.087 | sandy loam | |
| 100 | 0.931 | 0.052 | 0.017 | sandy soil | |
| 120 | 0.616 | 0.301 | 0.083 | sandy loam | |
| II | 10 | 0.620 | 0.271 | 0.109 | sandy loam |
| 20 | 0.663 | 0.243 | 0.095 | sandy loam | |
| 40 | 0.531 | 0.343 | 0.127 | sandy loam | |
| 60 | 0.518 | 0.349 | 0.134 | sandy loam | |
| 80 | 0.482 | 0.401 | 0.117 | loam | |
| 100 | 0.505 | 0.362 | 0.133 | sandy loam | |
| 120 | 0.706 | 0.219 | 0.074 | sandy loam | |
Table 2.
Statistics of soil water content under different land covers in 2013.
| Depth (cm) | Land Cover | Field Site | Minimum (%cm3cm−3) | Maximum (%cm3cm−3) | Mean (%cm3cm−3) | Std. Deviation (%cm3cm−3) | CV (%) |
|---|---|---|---|---|---|---|---|
| 0–10 | maize | I | 0.62 | 32.19 | 11.86 | 5.30 | 44.65 |
| wheat | II | 2.13 | 32.47 | 15.17 | 7.39 | 58.70 | |
| 10–20 | maize | I | 1.53 | 31.94 | 15.44 | 4.71 | 30.53 |
| wheat | II | 3.29 | 32.73 | 17.01 | 6.46 | 37.98 | |
| 20–40 | maize | I | 3.63 | 36.39 | 24.12 | 4.35 | 18.10 |
| wheat | II | 7.42 | 30.00 | 20.66 | 4.30 | 20.81 | |
| 40–100 | maize | I | 8.65 | 41.84 | 28.52 | 6.41 | 22.49 |
| wheat | II | 12.86 | 34.31 | 22.33 | 4.41 | 19.75 | |
| 100–120 | maize | I | 8.19 | 35.61 | 20.39 | 5.75 | 28.20 |
| wheat | II | 10.48 | 37.89 | 23.88 | 5.81 | 24.33 |
Table 3.
Statistics of soil water content under different land covers in 2014.
| Depth (cm) | Land Cover | Field Site | Minimum (%cm3cm−3) | Maximum (%cm3cm−3) | Mean (%cm3cm−3) | Std. Deviation (%cm3cm−3) | CV (%) |
|---|---|---|---|---|---|---|---|
| 0–10 | maize | II | 4.76 | 31.59 | 16.74 | 5.03 | 30.05 |
| wheat | I | 6.46 | 29.09 | 16.66 | 5.33 | 31.99 | |
| 10–20 | maize | II | 8.51 | 31.94 | 18.69 | 4.09 | 21.88 |
| wheat | I | 10.09 | 30.81 | 20.74 | 4.40 | 21.22 | |
| 20–40 | maize | II | 5.14 | 36.39 | 32.23 | 5.15 | 15.80 |
| wheat | I | 12.76 | 33.66 | 22.71 | 3.46 | 15.24 | |
| 40–100 | maize | II | 4.46 | 33.16 | 23.04 | 5.45 | 23.66 |
| wheat | I | 13.72 | 35.89 | 25.48 | 4.75 | 18.64 | |
| 100–120 | maize | II | 4.78 | 38.60 | 26.79 | 5.97 | 22.84 |
| wheat | I | 8.37 | 30.90 | 18.33 | 5.22 | 28.48 |
© 2017 by the authors. Licensee MDPI, Basel, Switzerland. This article is an open access article distributed under the terms and conditions of the Creative Commons Attribution (CC BY) license (http://creativecommons.org/licenses/by/4.0/).
Share and Cite
MDPI and ACS Style
Wang, S.; Singh, V.P. Spatio-Temporal Variability of Soil Water Content under Different Crop Covers in Irrigation Districts of Northwest China. Entropy 2017, 19, 410. https://doi.org/10.3390/e19080410
AMA Style
Wang S, Singh VP. Spatio-Temporal Variability of Soil Water Content under Different Crop Covers in Irrigation Districts of Northwest China. Entropy. 2017; 19(8):410. https://doi.org/10.3390/e19080410
Chicago/Turabian StyleWang, Sufen, and Vijay P. Singh. 2017. "Spatio-Temporal Variability of Soil Water Content under Different Crop Covers in Irrigation Districts of Northwest China" Entropy 19, no. 8: 410. https://doi.org/10.3390/e19080410
Note that from the first issue of 2016, this journal uses article numbers instead of page numbers. See further details here.