Lifespan Development of the Human Brain Revealed by Large-Scale Network Eigen-Entropy

College of Mechatronics and Automation, National University of Defense Technology, 109 Deya Road, Changsha 410073, China
*
Author to whom correspondence should be addressed.
Entropy 2017, 19(9), 471; https://doi.org/10.3390/e19090471
Submission received: 3 August 2017
/
Revised: 25 August 2017
/
Accepted: 1 September 2017
/
Published: 4 September 2017
(This article belongs to the Special Issue Information Theory in Neuroscience)
Abstract
:Imaging connectomics based on graph theory has become an effective and unique methodological framework for studying functional connectivity patterns of the developing and aging brain. Normal brain development is characterized by continuous and significant network evolution through infancy, childhood, and adolescence, following specific maturational patterns. Normal aging is related to some resting state brain networks disruption, which are associated with certain cognitive decline. It is a big challenge to design an integral metric to track connectome evolution patterns across the lifespan, which is to understand the principles of network organization in the human brain. In this study, we first defined a brain network eigen-entropy (NEE) based on the energy probability (EP) of each brain node. Next, we used the NEE to characterize the lifespan orderness trajectory of the whole-brain functional connectivity of 173 healthy individuals ranging in age from 7 to 85 years. The results revealed that during the lifespan, the whole-brain NEE exhibited a significant non-linear decrease and that the EP distribution shifted from concentration to wide dispersion, implying orderness enhancement of functional connectome over age. Furthermore, brain regions with significant EP changes from the flourishing (7–20 years) to the youth period (23–38 years) were mainly located in the right prefrontal cortex and basal ganglia, and were involved in emotion regulation and executive function in coordination with the action of the sensory system, implying that self-awareness and voluntary control performance significantly changed during neurodevelopment. However, the changes from the youth period to middle age (40–59 years) were located in the mesial temporal lobe and caudate, which are associated with long-term memory, implying that the memory of the human brain begins to decline with age during this period. Overall, the findings suggested that the human connectome shifted from a relatively anatomical driven state to an orderly organized state with lower entropy.
1. Introduction
The human connectome undergoes complex transformations across the lifespan, and it can be mathematically modeled as a complex network by graph theoretical analysis. Imaging connectomics based on graph theory has become an effective and unique methodological framework for studying functional connectivity patterns of the developing and aging brain [1]. Normal brain development is characterized by continuous and significant network evolution through infancy, childhood, and adolescence, following specific maturational patterns. Normal aging is related to some resting state brain networks disruption, which are associated with certain cognitive decline. Specifically, a connectome (i.e., a large-scale resting-state functional connectivity network, RSFC) can be mapped by taking each parcellation unit of the whole-brain as nodes and estimating inter-unit correlations (i.e., functional connectivity, FC) in spontaneous blood oxygenation level dependent (BOLD) fluctuations as edges. Combined with graph theoretical analysis, this study aimed to explore typical age-related architecture changes of the human brain, which is a prerequisite for studying neuropsychiatric diseases such as autism, depression, schizophrenia, Alzheimer's disease, and Parkinson’s disease.
Many connectomics studies using network science and graph theory have shown age-related changes of FC patterns. FC patterns between/within resting-state subsystems (a set of brain regions that exhibit coherent activity in a task-free state [2] and exhibit consistent spatial topographic patterns across the cerebral cortex [3,4]) have been investigated with age [5], and FC patterns for brain regions had also been examined across the lifespan [6,7]. In addition, several whole-brain FC pattern studies on RSFC networks have focused either on early or late age-related changes [3,8,9,10,11,12,13], while other studies have focused on specific subsystems involving default networks [14,15,16,17], and cognitive-control [18,19,20]. Moreover, findings on large-scale RSFC network properties have revealed that modularity and local efficiency decreased over aging [8,21,22,23]. In contrast, another study reported that modularity was similar in older and younger participants [24]. Furthermore, studies of connectomics on global efficiency have not reached a consensus [8,21]. These studies focused on studying the FC pattern or some network properties in the developmental stage or across the lifespan. Little attention has been focused on the changes to whole-brain centralities with age.
Nodal connectivity or centralities account for a given region’s relationship with the entire functional connectome and not just its relationship to specified regions (seed-based analysis), or to brain subsystems (independent component analysis). As such, centrality measures allow us to capture the given region’s importance in the functional connectome. Prior studies of nodal connectivity or centralities have focused primarily on identifying “cortical hubs” [8,25,26,27,28,29] and finding rich-clubs [21,30,31] in healthy adulthood participants. A few researchers have reported that the degree distribution in the normal adult human brain conformed to an exponentially truncated power law [25,32,33]. Recent neuroscience studies have employed eigenvector centrality (EC) mapping for measuring FC in both diseases [34,35] and task states of brain activity [26]; however, these studies have not explored EC pattern changes of the whole-brain RSFC network across the lifespan in healthy individuals.
The network eigen-entropy (NEE) was defined based on EC and the Shannon entropy. In a complex system, it characterizes the orderness change of a system indicating the state or the development direction of a system. EC defined in this way assigned each node a centrality that depended on both the quantity and the quality of its connections. It integrated the centralities of a node’s neighbors and each node was ranked by its EC scores in a network. Therefore, EC was extended to capture the global features of the graph [36,37]. The energy probability (EP) of each node was derived from EC scores in a graph network. The resulting set of energy probabilities generated a frequency distribution. The EP can be regarded as a random variable that follows this frequency distribution, and the distribution measured the functional connectome heterogeneity [36]. If the nodes’ function in the network is not specialized, and the communication of information is not preferential, the EP distribution is uniform, and the network is homogenous. However, if the nodes’ function is specialized, and the communication of information is preferential, the EP distribution is distributed, and the network is heterogeneous. Collectively, the more distributed the EP histogram of a system is, the lower the entropy is and vice versa. Thus, the NEE allows us to analyze the organizational mechanisms of the functional connectome development.
We initiated this study under the assumption that the orderness of the functional connectome was related to the age of the brain.
2. Materials and Methods
2.1. fMRI Data Acquisition
The analyses described in the study used two separate resting-state functional magnetic resonance imaging (rs-fMRI) datasets. During the scan, participants were instructed to relax and to fixate on a crosshair while remaining as still as possible. Unless specifically noted, these datasets were handled identically in processing and analysis.
Dataset I was selected from the Nathan Kline Institute-Rockland Sample (NKI-RS) (http://fcon_1000.projects.nitrc.org/indi/pro/nki.html). All approvals and procedures for the collection and sharing of data were approved by the NKI institutional review board. Dataset I consisted of 173 healthy participants in total (aged 7–85 years; mean age, 36.53 ± 20.28 years; 102 males). All participants were divided into four groups in terms of the standard age division recommended by the World Health Organization (WHO), as shown in Table 1. MRI data was acquired using a 3.0 T SIMENS Trio scanner. Structural images were acquired using a magnetization-prepared rapid gradient echo (MPRAGE) sequence (repetition time [TR] = 2500 ms, echo time [TE] = 3.5 ms, flip angle = 90°, thickness = 1.0 mm, slices = 192, matrix = 256 × 256, and FOV = 256 mm). Functional images were acquired using echo-planar imaging (EPI) sequence (TR/TE = 2500/30 ms, FA = 80°, FOV = 216 mm, matrix = 64 × 64, slices = 38, thickness = 3.0 mm). A 10-minute (260 volumes) R-fMRI scan was collected for each participant.
Dataset II consisted of 100 healthy participants randomly selected from the dataset of the Human Connectome Project (HCP) (http://www.humanconnectome.org). Each participant underwent two R-fMRI sessions on separate days. The ages of all participants ranged from 26 to 30 years. Functional images were acquired using multi-band gradient EPI sequences (time repetition/echo time = 720/33.1 ms, flip angle = 52°, field of view = 208 × 180 mm2, matrix size = 104 × 90, thickness = 2.0 mm, slices = 72). A 14-minute and 24-second resting-state fMRI scan was collected for each participant (1200 volumes). For more detailed parameters, see [38].
2.2. Data Preprocessing
For the functional imaging data of each participant, the first five volumes were discarded to remove possible T1 stabilization effects. Next, imaging data were preprocessed using the statistical parametric mapping software package SPM8 (http://www.fil.ion.ucl.ac.uk/spm) following the pipeline in previous research described in [39,40]. Preprocessing steps mainly included the removal of sudden spikes caused by significant head motion, slicing time correction, spatial realignment correction, normalization, spatial smoothing, and temporal band-pass filtering. Slicing time correction was utilized to compensate for slice acquisition dependent time shifts of each volume. Six rigid body translation and rotation parameters were applied to correct head motion. Normalization included R-fMRI data written into the Montreal Neurological Institute (MNI) space at a 3 × 3 × 3 mm3 resolution using the nonlinear transformation calculated on the corresponding anatomic images. The normalized functional volumes were spatially smoothed using a 6-mm full width at half maximum (FWHM) Gaussian filter kernel. Briefly, the linear trend over each scan was removed and a temporal band pass filter from 0.01 to 0.08 Hz was performed. Prior to spatial smoothing, to reduce hardware noise, the draining vessel effect, and motion artifacts on each voxel of gray matter, we further regressed the following nuisance variables: six rigid body motion parameters, the white matter (WM), cerebrospinal fluid (CSF), and whole-brain global signals. The residuals from the functional data were used for further analysis.
2.3. Construction of Resting-State Functional Connectivity Network
The whole brain was divided into many regions using a parcellating method, which offered multi-scale parcellations. A single divided brain region included a set number of voxels with spatially coherent brain activity [41]. Each voxel time series within the whole brain was extracted after data preprocessing. The time series of a region was obtained by averaging the time series of all the voxels in this region. The Pearson’s correlation coefficients were then calculated between each pair of brain regions. To improve the normality of the correlation coefficients, Fisher’s r-to-z transform was performed to convert the correlation coefficients to z-values. Only positive coefficients were preserved to avoid ambiguous biological explanations of negative coefficients. Next, we utilized Bonferroni correction to set the correlation coefficients with p-values greater than 0.05 as 0; otherwise, we set the correlation coefficients as 1. Finally, an adjacent matrix A was generated for each participant to represent an undirected binary RSFC network.
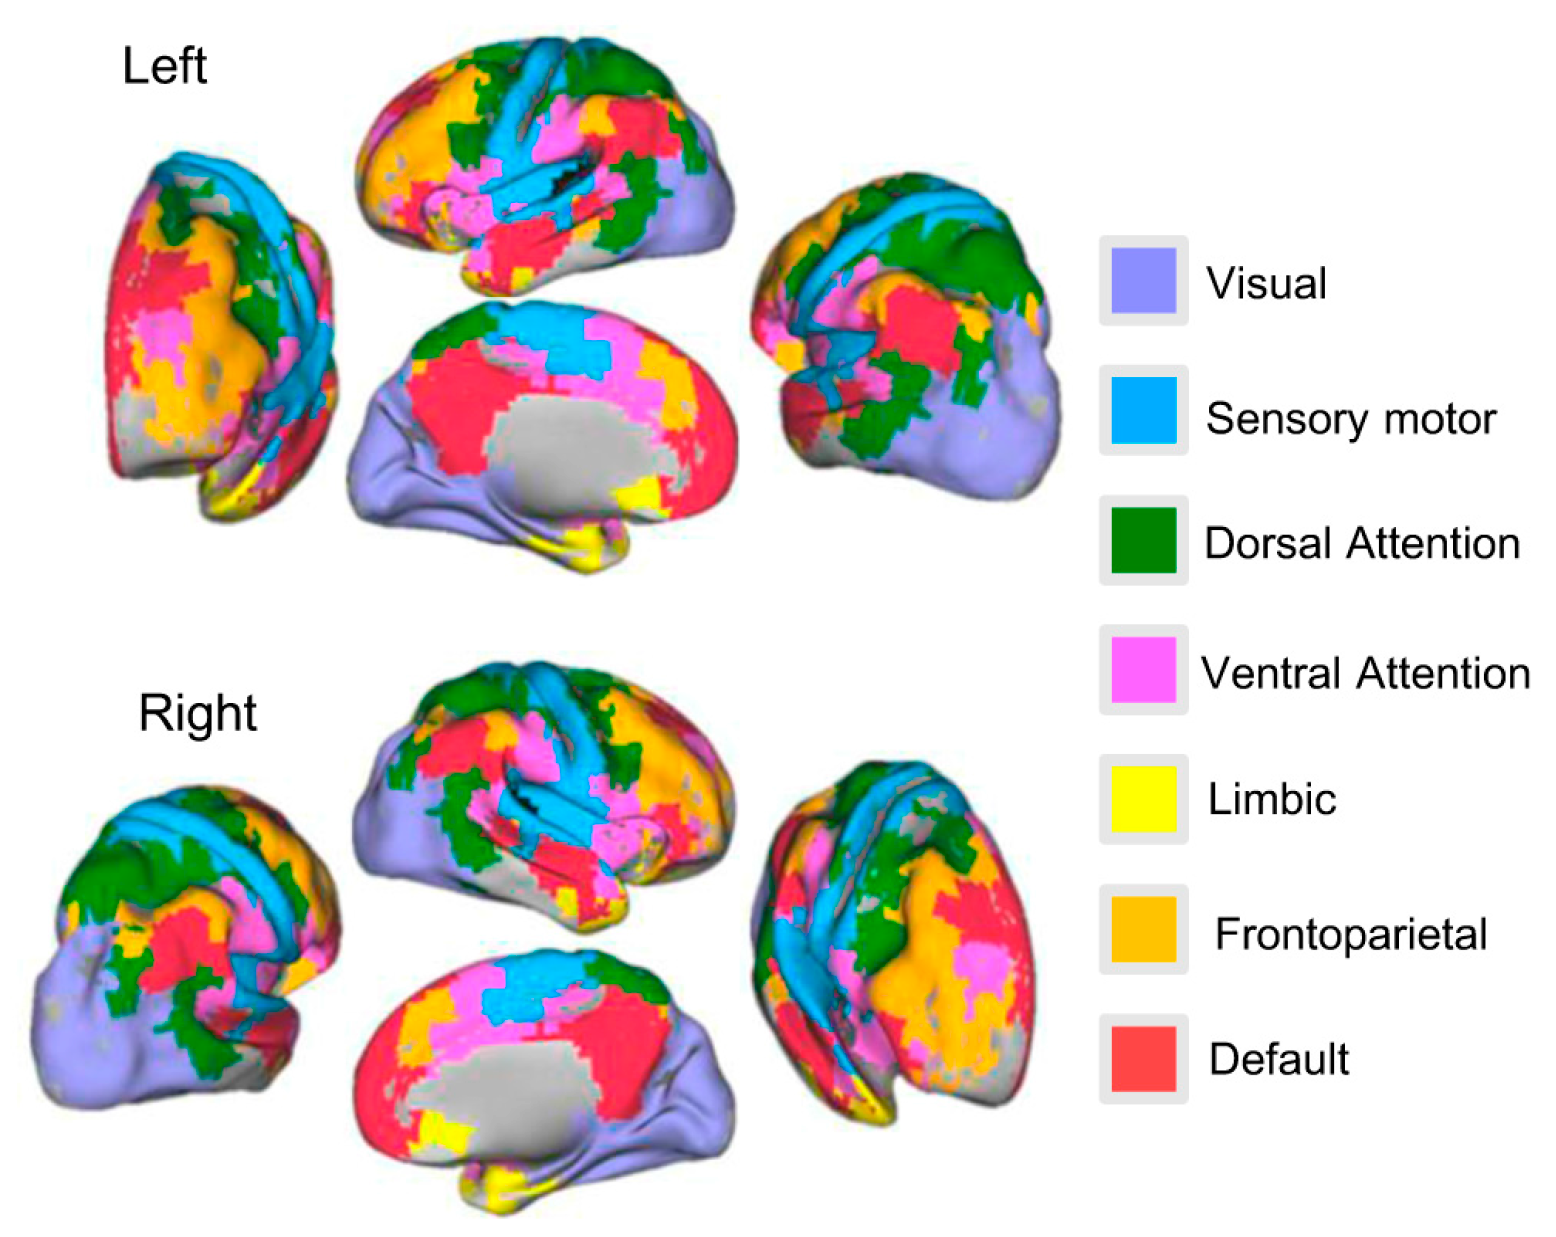
For estimating NEE change in each subsystem during a lifespan, we used a previously established functional parcellation of the human cerebral cortex [4], which was derived by clustering the whole-brain FC network of 500 subjects according to the similarity of regionals FC profiles. This procedure resulted in seven clusters, whose boundaries shared a close correspondence to the known topographic boundaries of visual and sensory motor areas, the limbic system and distributed association networks for executive control (frontoparietal), attention (dorsal, ventral), and internally-directed cognition (default). Thus, we divided the whole-brain RSFC network nodes into seven subsystems. Specifically, we first calculated the number of voxels where all voxels of each brain region were dropped in a certain subsystem. Second, we put the brain region into the subsystem owning the maximum number of voxels. If all voxels of the brain regions were not dropped into any of the subsystems, we put those regions into an unknown category. The divided results of the seven subsystems are shown in Figure 1. The unknown brain regions are not shown in Figure 1.
2.4. Calculate Network Eigen-Entropy
As the EC depends on both the quantity and the quality of its connections, the centrality score (ECi) was proportional to the sum of the scores of the node’s neighbors .
where aij denotes the element of the adjacent matrix A, and N denotes the number of nodes of a binary RSFC network, and denotes unique largest real eigenvalue. Using the power iteration method, we found that the centrality vector (EC) was an eigenvector of the adjacency matrix associated with , which had strictly positive components using the Perron-Frobenius theorem [42]. The calculation process of EC was as follow. First, a starting positive amount of influence of every node was set with 1/N. The iteration stopped after the maximum iterations had been reached. In the power iteration, every iteration vector was multiplied by the adjacency matrix of the network and normalized. The i-th component of the EC represented the relative centrality score of the node i in the network.
To calculate entropy, we first defined the intrinsic probability of each node in the binary RSFC network. We know that the unique positive centrality score of each node is the final steady state of the system through the power iteration processing. The eigenvector was only defined up to a common factor, so the ratios of the centralities of the nodes (I) were defined as an intrinsic state probability of the binary RSFC network. Thus, the intrinsic probability of each node was defined as
We also called the intrinsic probability of each unit in the system the EP of each node in the RSFC network. Thus, represents the EP of each node in a binary RSFC network. Quoting the Shannon entropy equation, NEE was constructed:
The entropy E is related to the eigenvector of a RSFC network, so we called it NEE. When the network is completely uniform , the EP distribution is uniform and the NEE is maximum.
When all nodes are not connected to each other, , the NEE is minimum theoretically, but in the real RSFC networks, the network is connected, and the NEEs are greater than minimum.
2.5. Statistical Analyses
We used multiple linear regression to model NEE with age and age2 as predictors, along with three other nuisance variables: sex, head-motion mean frame-wise displacement (meanFD) [43] and temporal signal-to-noise ratio (tSNR) [44]. The regression model was formulated as follows:
In this study, the Mann–Whitney rank-sum test was used to test whether the whole-brain NEE or brain node EP values of pairwise groups were significantly different. This is useful for examining the significant differences between two independents, but in non-normal populations, which is a sample rank instead of the sample value of the test.
2.6. Test–Retest Reliability
Test–retest reliability is an important group level statistic, referring to the temporal or intra-individual stability of an index measured across multiple occasions in a group of participants. Intra-class correlation (ICC) [45] was used on dataset II to quantify NEE’s test–retest reliability in this functional connectome analysis.
The ICC values were categorized into five common intervals [46]: 0 < ICC ≤ 0.2 (slight); 0.2 < ICC ≤ 0.4 (fair); 0.4 < ICC ≤ 0.6 (moderate); 0.6 < ICC ≤ 0.8 (substantial) and 0.8 < ICC < 1.0 (almost perfect). However, several limitations of the ICC approach has been described in [47]. In addition to the absolute values of ICC, we calculated the p-values of ICC using the permutation test. The p-value allowed a precise statistical analysis to evaluate the significance of the extracted ICC.
3. Results
3.1. Age-Related Changes of Topologic Energy Probability Distribution and Energy Probability Histograms between Groups
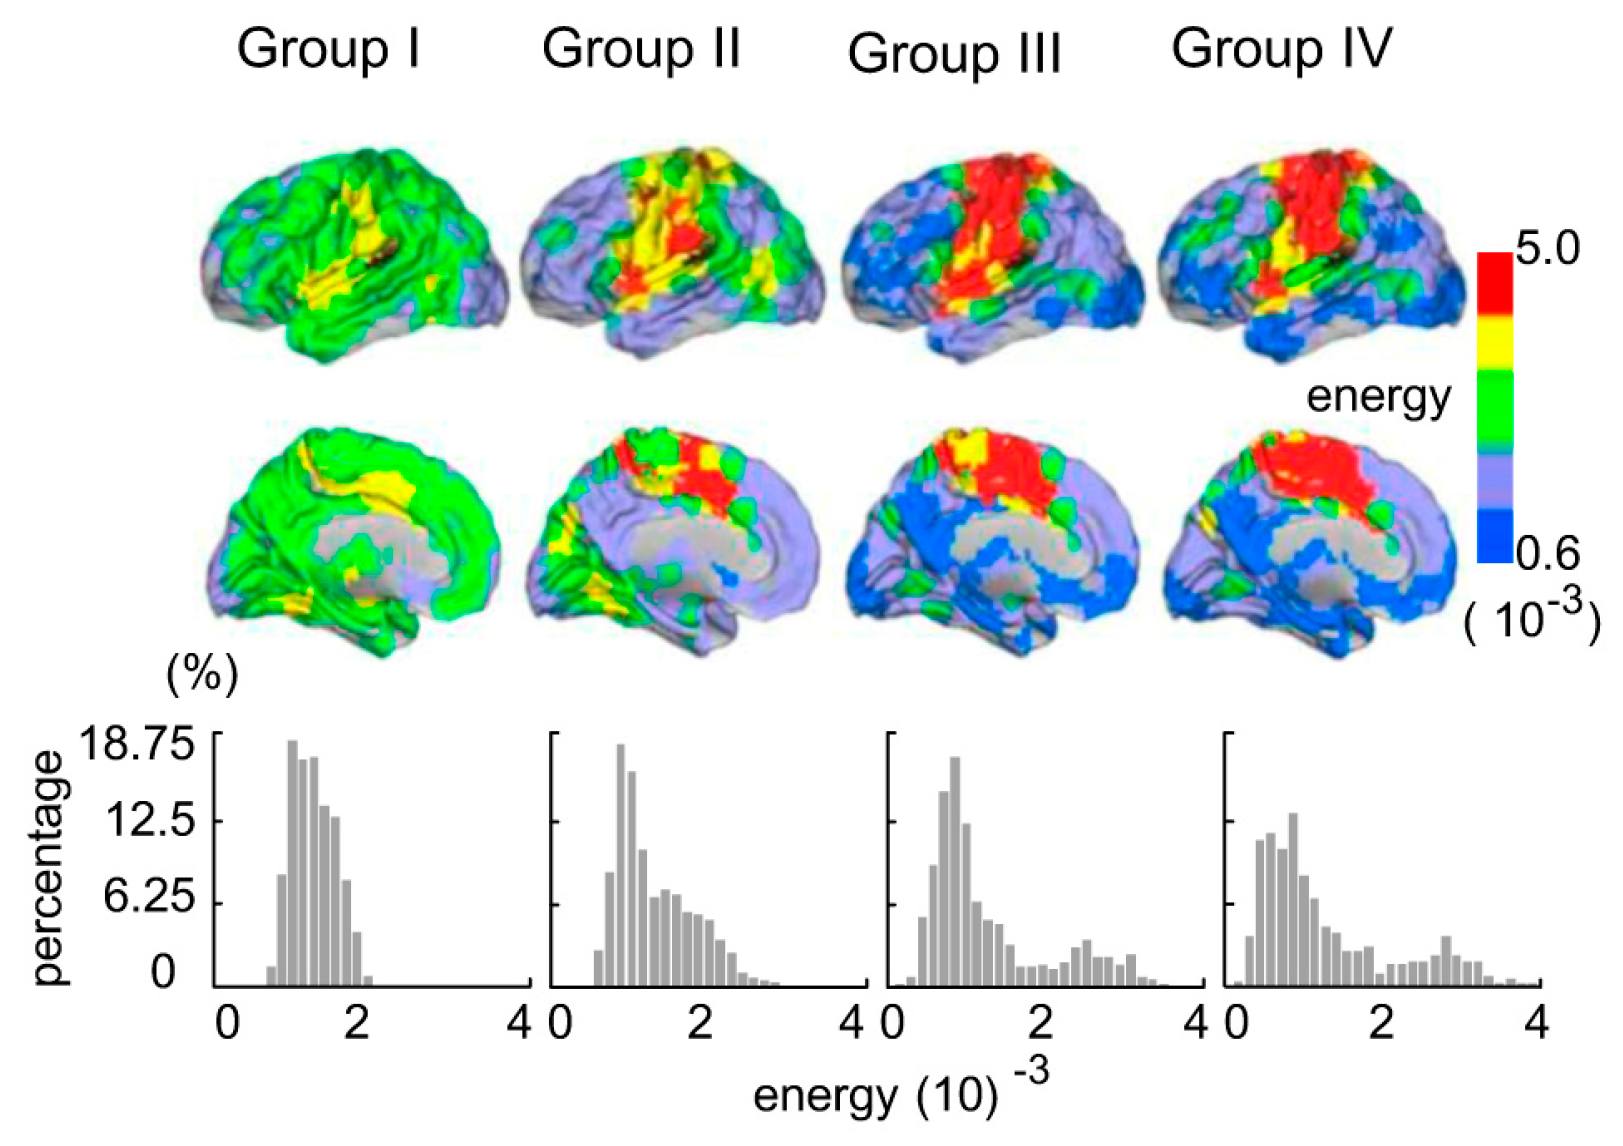
The topologic EP maps and EP histograms for the four groups are shown in Figure 2. Each region’s EP within each group was obtained by calculating the average EP in this region, in this group. Consequently, we obtained four group-level EP maps. The EP distribution of Group I was concentrated on as shown in the bottom panel of Figure 2, whereas the EP distribution interval of Group II was amplified by , which sloped to the right and tended to have a tail. The EP distribution of Group III had a right long tail, and the distribution interval ranged from to . Corresponding to the EP histograms, the topographic EP map in Group I showed that the EP of each region was approximate to equal, as shown in the top panel of Figure 2. While the EP in other regions (except the sensory motor area and ventral attention network) began to decrease in the other three groups.
To quantitatively characterize the transformation of EP distribution in individuals with age, the whole-brain NEE was calculated for each participant.
3.2. Age-Related Changes of the Whole-Brain Network Eigen-Entropy across Lifespan
Model selection analyses were carried out using the Akaike information criterion (AIC). The probable models of functional connectome orderness are shown in Figure S1. These analyses showed that the functional connectome orderness levels during a lifespan, as measured by whole-brain NEE, are best fit by the polynomial fitting curve (Figure 3). The positive quadratic trajectory showed that the whole-brain NEE values decreased fast with continuous age before close to 60 years (Figure 3a). In a multiple linear regression model, no significant impact of sex (t = 0.23, p = 0.81), meanFD (t = −0.67, p = 0.50) or tSNR (t = −0.49, p = 0.62) on NEE was exhibited. In contrast, significant impacts of age (t = −5.67, p < 0.0001) and age2 (t = 3.43, p = 0.0007) on NEE were exhibited. Pairwise comparison analysis through the four age groups using the Mann–Whitney rank-sum test showed that significant decreasing NEEs between groups were tested consistently (Figure 3b). In detail, the NEE of Group II significantly decreased relative to that of Group I (p = 0.001), and the NEE of Group III significantly decreased relative to that of Group II (p < 0.001); however, there was no significant difference between Groups III and IV for NEE (p = 0.56). Consistent with the results of a comparison of Groups III and IV, the NEE fitting curve maintained its trend during the normal aging stage. An important issue was whether the whole-brain NEE changes were driven by the seven subsystems.
3.3. Age-Related Changes of Subsystems’ Network Eigen-Entropy across Lifespan
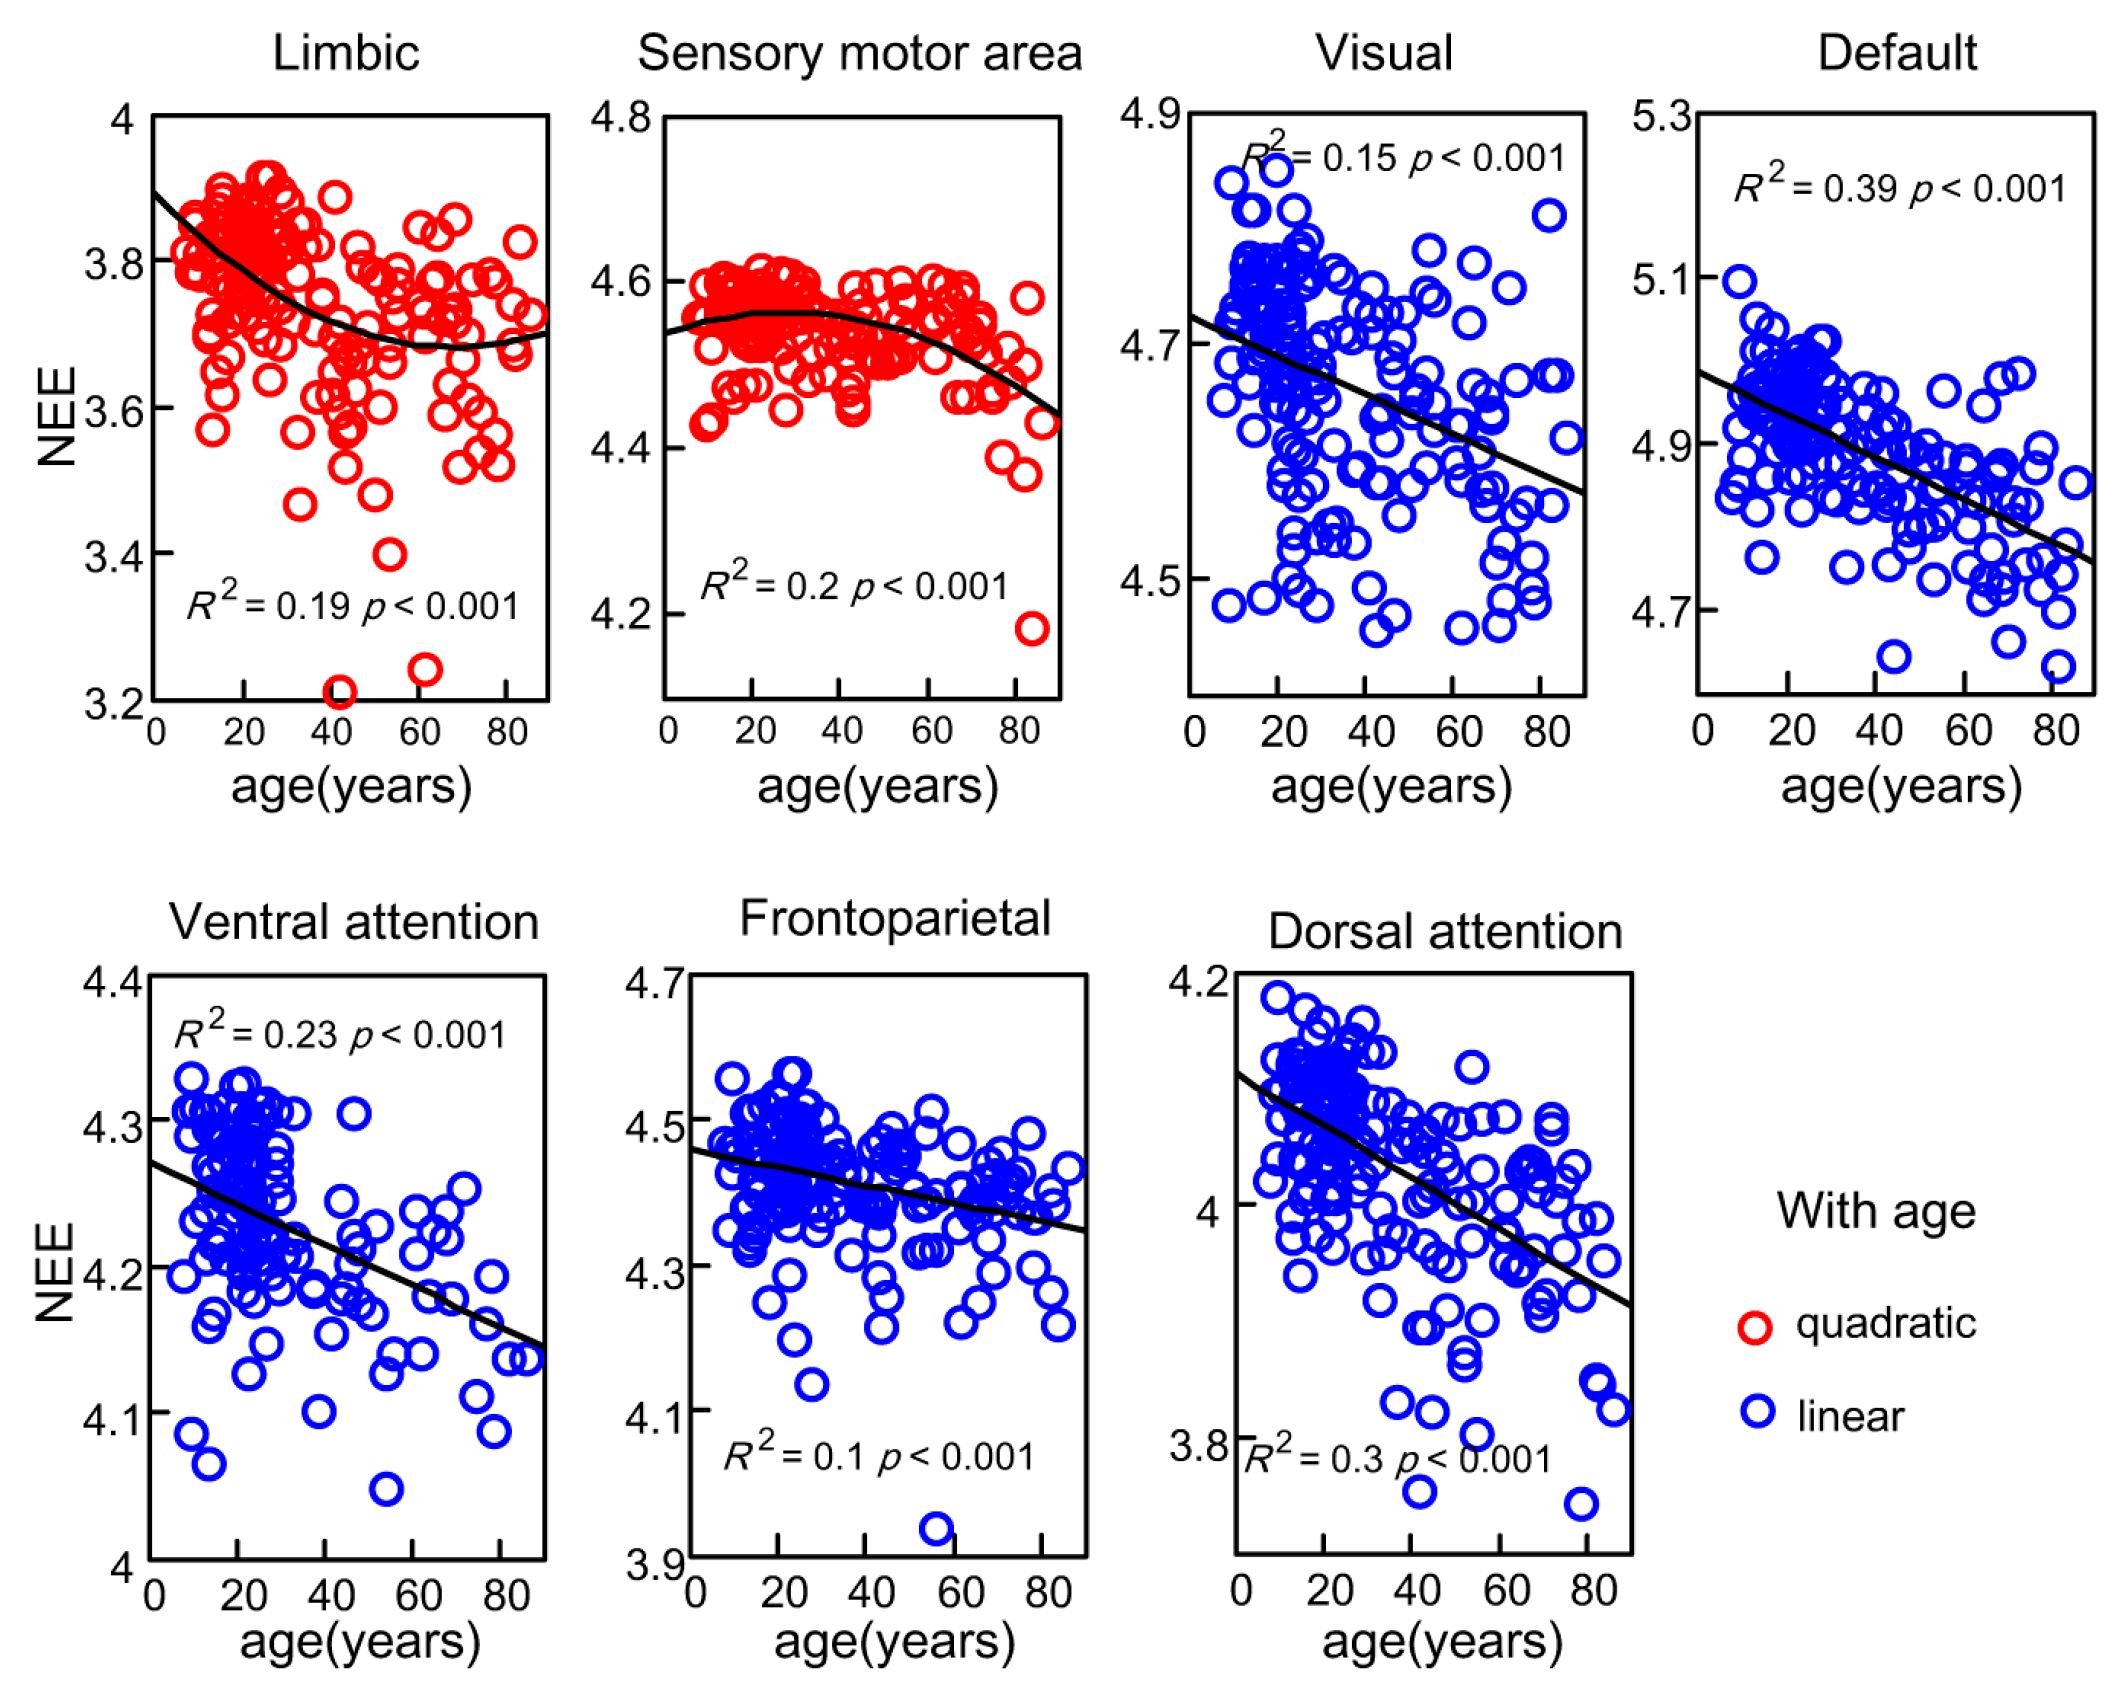
To assess how whole-brain NEEs in seven subsystems exhibited age-related changes, MLRs were fit to lifespan trajectories of the seven subsystems. The trajectories of the values of NEE in the seven subsystems showed linear or non-linear decreases with age (Figure 4). The overall trends were the same as the trend of the values of whole-brain NEE. Excluding the values of NEE of the limbic system and sensory motor area, the NEEs of the other five subsystems showed significant linear decreases with age. The age-related (t = −8.47, ) NEE trajectory within the dorsal attention network slipped the fastest (F (1, 167) = 71.82, ), and the age-related (t = −4.24, ) NEE trajectory within the frontoparietal network slipped slightly (F (1, 167) = 17.98, p = 3.69). In contrast, the NEE trajectory within the limbic system exhibited positive quadratic changes (F (2, 166) = 20.85, ) with age, and the NEE trajectory of the sensory motor area exhibited negative quadratic changes (F (2, 166) = 19.92, ) with age. Significant linear age effects (t = −3.69, ) and quadratic age effects (t = 2.45, p = 0.016) on limbic NEE were detected, and significant linear age effects (t = 2.45, p = 0.015) and quadratic age effects (t = −3.66, p = 3.44) on the sensory motor area NEE were also detected.
3.4. Brain Regions with Significant Energy Probablity Changes
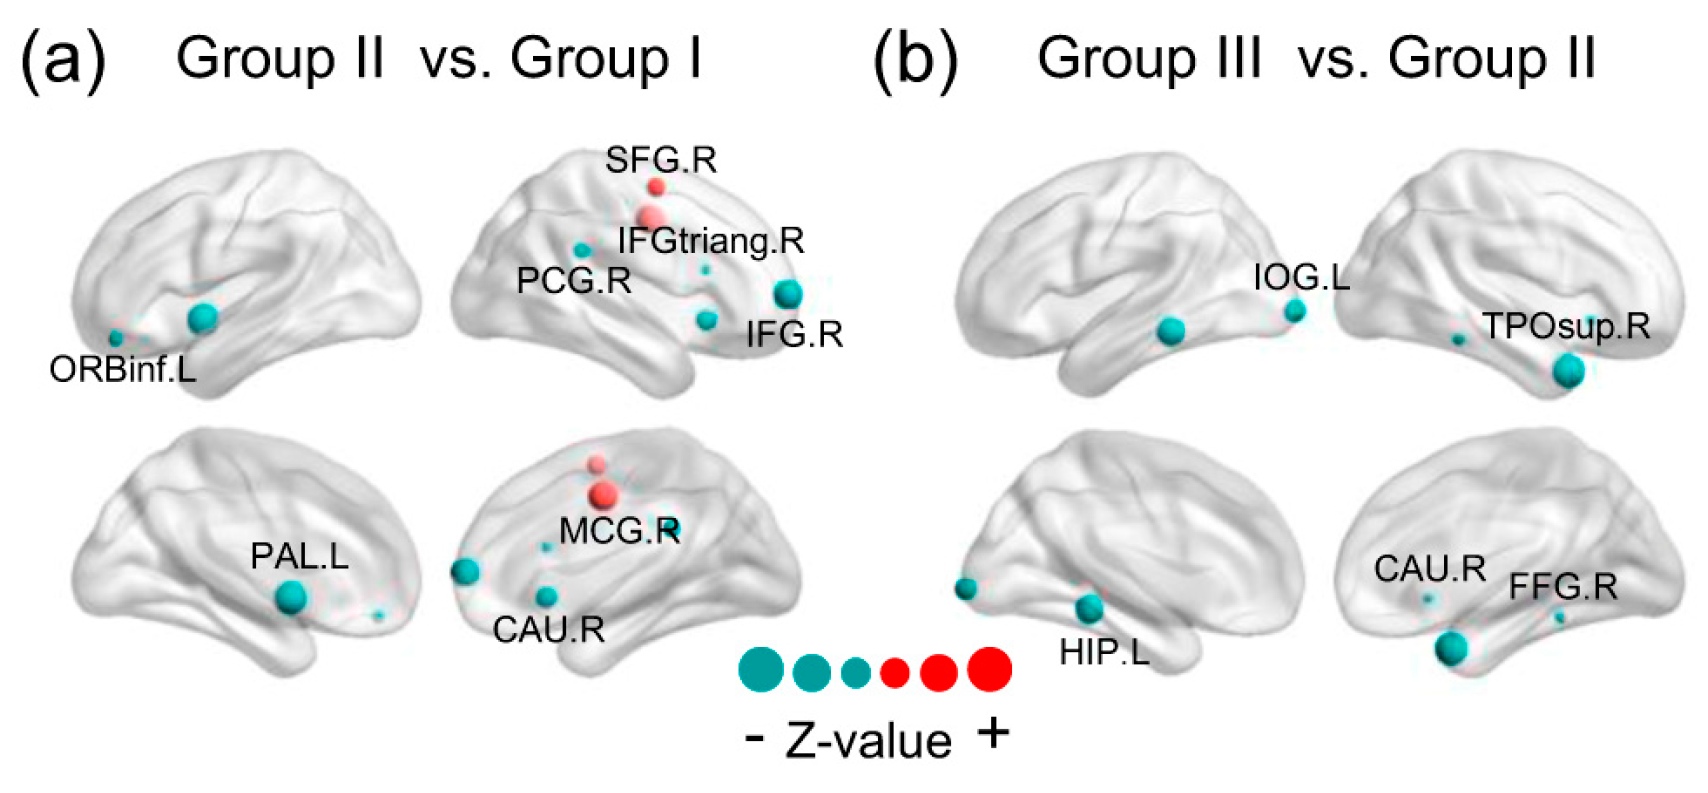
There was a specific attempt to unearth specific brain regions which prominently drive NEE decline during different periods of the lifespan. The Mann–Whitney rank-sum test analysis for EP on whole-brain regions (800 nodes) between groups was undertaken though False Discovery Rate (FDR) correction. When comparing Group II with Group I, the results exhibited a total of 14 regions that showed statistically significant age-related change, representing 1.75% of whole-brain region comparisons (q < 0.05, FDR-corrected; corresponding to an uncorrected ). These brain regions were involved with six of the seven subsystems, excluding a visual network. We mapped these significantly changed brain regions to the cerebral cortex and discovered that they were mainly comprised of the right inferior frontal gyrus, right supplementary motor area, and basal ganglia (containing the cingulate gyrus, right caudate nucleus, left globus pallidum, and left putamen). The topographic brain region distribution is shown in detail in Figure 5a. In addition to a few brain regions that showed a significant increase in EP, all the rest showed a significant decline. In addition, most of the brain regions were on the right hemisphere. When comparing Group III with Group II (Figure 5b), the results exhibited a total of 12 regions that showed statistically significant age-related change, representing 1.5% of whole-brain regions comparisons (q < 0.05, FDR-corrected; corresponding to an uncorrected). These brain regions were involved with two of the seven subsystems and when these brain regions were mapped to the cerebral cortex, it was discovered that they were primarily located within the right temporal pole, left lingual gyrus, left inferior occipital gyrus and parahippocampal gyrus, left hippocampus and right caudate nucleus, which are part of the visual subsystem and limbic system. In contrast to the results of the comparison between Group II and Group I, all significantly changed brain regions showed a reduction in EP.
3.5. Control Analyses
The scale of the brain networks and the scanning duration of the data may have influenced the calculation of the NEE. Therefore, we evaluated the potential confounding effects of these two factors on NEE.
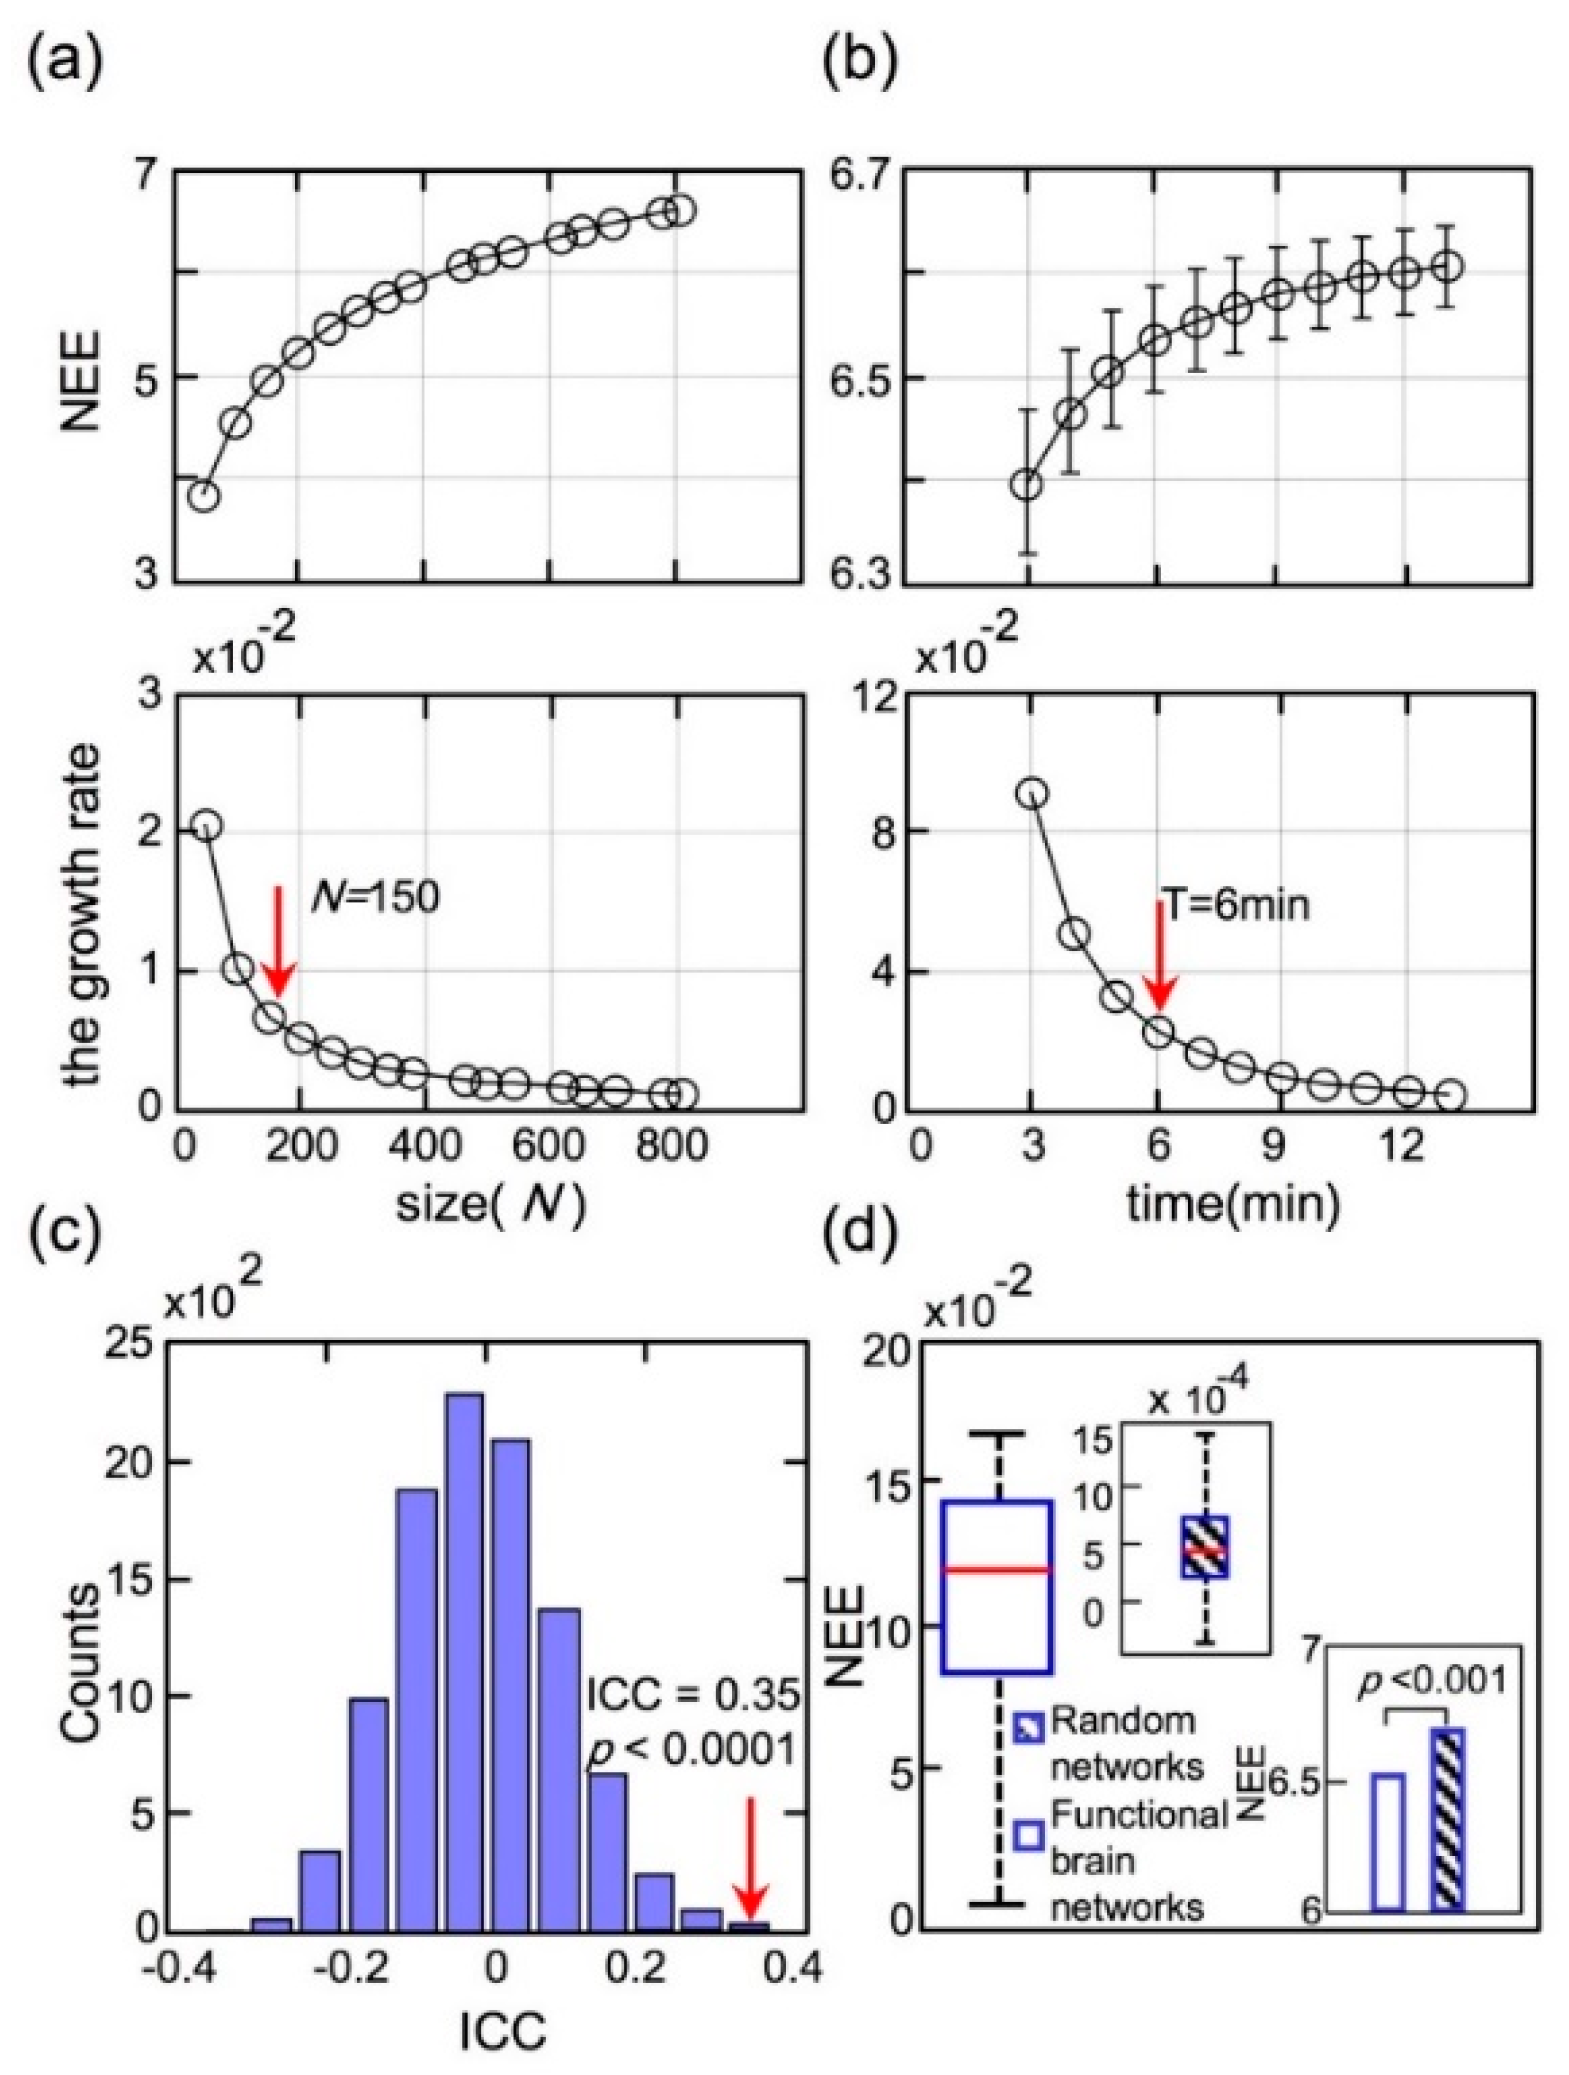
To explore how the network scales influenced NEE, a series of cortical parcellations [41] ranging from 50 to 800 regions were chosen. The top panel of Figure 6a illustrates the increased NEE values of dataset II with the network scales. The NEE value of each network scale in the top panel curve was calculated by averaging the NEE values of all participants. The bottom panel of Figure 6a shows the increased growth rate of NEE with the network scales. The network scale (the number of regions N ≥ 150) was conducted using the elbow criterion [48] of the growth rate in the top panel of Figure 6a. We selected brain parcellation with 800 regions in this study for elaboration and stability.
To investigate the effects of scanning duration on NEE, we calculated each participant’s NEE with different continuous time points in dataset II, ranging from 3 to 13 min, which were extracted from the total scanning duration (1200-time points) by adjusting the starting time point randomly. The top panel of Figure 6b shows the NEE curve with different scanning durations and the bottom panel of Figure 6b shows the growth rate curve of NEE with different scanning durations. As shown in Figure 6a, the NEE value was calculated by averaging each participant’s NEE for this scanning duration. Similarly, the scanning duration (T ≥ 6 min) was assessed using the elbow criterion of the growth rate curve, in the top panel of Figure 6b. The NEE values slightly increased with scanning duration, but the growth rates of NEE decreased sharply. To obtain stable FC, the scanning duration should be longer than six minutes.
Additionally, the test–retest reliability measures the temporal or intra-individual stability across multiple occasions in a group of participants. In this study, Intra-class correlation was used to weigh the NEE’s test–retest reliability.
The ICC value for dataset II was 0.35, which indicated fair test–retest reliability. However, several limitations of ICC approaches have been described in [47]. In addition to the absolute values of ICC, we calculated the p-values of ICC using a permutation test. The p-value allowed a precise statistical analysis to evaluate the significance of the extracted ICC. The distribution of the ICC was displayed in Figure 6c through 10,000 repeated permutation tests. According to the absolute value and p-value (p < 0.0001) of the ICC, the metric NEE was considerably reliable in temporal or intra-individual conditions.
Moreover, the significance of NEE should be established to compare it with the results of null-hypothesis networks. Null-hypothesis networks (random networks) shared the same size, density and binary degree distribution of the original network as dataset II, and the random network sample corresponded to each participant network. As shown in Figure 6d, the significant differences between the RSFC networks and random networks (p < 0.001, Mann–Whitney rank-sum test) were revealed.
4. Discussion
In this study, we calculated the whole-brain NEE from the EP of parcellation units of the cerebral cortex. By systematically investigating the development and aging of human connectome from 7 to 85 years, we found that the whole-brain NEE showed a non-linear decrease with age. The EP distribution within the whole-brain shifted from concentration to wide dispersion with age at group level. Moreover, the NEE values of subsystems showed non-linear or linear decreases with age. Interestingly, the NEE values of the sensory motor area showed negative quadratic changes with age, while the NEE of limbic system showed positive quadratic changes with age, and the other five subsystems showed linear decreases. Furthermore, brain regions with significant EP changing from flourishing (7–20 years) to the youth period (23–38 years) were mainly located in the right prefrontal cortex and basal ganglia, the areas involved in emotion regulation and executive function in coordination with the action of the sensory system, thus implying that self-awareness and voluntary control performance significantly changed during neurodevelopment. Those from the youth period through to middle (40–59 years) age were located in the mesial temporal lobe and caudate (which are associated with long-term memory), implying that the memory of the human brain begins to decline with age during this period. These results may be relevant for understanding normal developmental and aging changes in neural circuits that underlie age–related variation in cognition and behavior. These novel findings are discussed below in detail.
4.1. The Orderness of the Functional Connectome Measured by the Network Eigen-Entropy
Previous studies on structural and functional connectomics have revealed that the human brain has a small-world structure [33,49,50], which possesses a greater clustering coefficient than the random network and lower characteristic path length than the regular network. Unlike the properties of the small-world structure, whole-brain NEE characterizes the orderness of network structure from a spatial perspective based on the EC and statistical entropy. As EC conveys the global structural information of the network, the uniformity of the EC distribution reflects the degree of complex network heterogeneity. So, NEE can also capture the heterogeneity of the network. The entropy of a single discrete random variable is a measure of its average uncertainty, characterizing the degree of underlying randomness of the random variable. The orderness/certainty implied by NEE is dependent on the similarity of the intrinsic structure on multi-levels in a network. The more uniform energy distribution, the greater the entropy, the more uncertainty in the system; on the other hand, the more orderness/certainty in the system.
On the application of entropy in the human brain, there are several studies related to our study. Yao and his colleagues [51] regarded the correlation coefficients between brain regions as a random variable, and applied relative entropy to measure the variability in the distribution of correlation coefficients. The results demonstrated that the relative entropy increased with age. These results investigated whether the FC changed with age. Jia and his colleagues [51] regarded the dynamic correlation coefficients between brain regions as a random variable, and applied sample entropy to measure the complexity of dynamic FC, while the results demonstrated that the sample entropy reduced with age. Mcintosh and his colleagues [52] used multiscale entropy (MSE) to measure brain signal variability through a collection of the electroencephalography (EEG) and magnetoenphalography (MEG) signals in tasks. MSE characterized the temporal complexity of the brain signal, while NEE depicted the spatial complexity of the interaction between brain regions signal activities across the whole brain. However, these entropy analyses cannot capture the orderness of the brain network structure from a spatial perspective.
Through the analysis of the Mann–Whitney rank-sum test, we found that the mean NEE value of the RSFC networks was lower than that of random networks and their variance box distribution differed by two magnitudes (Figure 6d). As the connections between nodes in the random network were random, the EC distribution was uniform, and the intrinsic architecture of the functional brain network was regular relative to the random network. The degree of orderness of the functional brain network was higher than the random network, and the NEE could robustly distinguish functional brain networks from random networks.
4.2. The Orderness Variability of the Whole-Brain with Age
To specifically assess the association of the whole-brain NEE with age, we divided the fMRI dataset I into four age groups. In the analysis of different aged individuals in dataset I, we found that at the group level, the EP distribution of the RSFC networks shifted from concentration to dispersion (Figure 1). Through a statistical analysis of whole-brain NEE of different aged individuals, we found that the whole-brain NEE was robust when compared among the flourishing, youth period and middle age groups. Furthermore, the whole-brain NEE was significantly different among the entropies of the three sample groups, and further analysis over continuous aging showed that an approximate U-shaped trajectory of the whole-brain NEE fitted. The distribution of EP in the middle age group was more widely spread than that of the flourishing and youth periods. This led to the middle age group having a smaller NEE than that of the youth period group, which had an even smaller NEE than that of the flourishing. This revealed that there was a higher level of heterogeneity of functional connectome during middle age group than the youth period, and the youth group had a higher level of heterogeneity of functional connectome than that of the flourishing. This implied that the orderness/certainty of functional connectome enhanced rapidly until middle age. In contrast, the EP distribution was partially adjusted from middle age to old age. This led to no significant change of NEE between middle age and old age (61–85 years), and these findings may be associated with the degree of functional connectome adjustment with age. This finding verified the opinion in What is Life written by Schrodinger [53] that life continues to draw on negative entropy from the environment. The finding also was consistent with the evolution theory of the life system proposed by Darwin that the development of the organism and the highly complex brain is a process of diminishing entropy. These results may partly reveal the architectural transition of the human brain shift from a relatively anatomically driven configuration to a functional well-organized configuration with age. Furthermore, the current findings seem consistent with the notion of free energy minimization in the brain, as the entropy-like term (NEE) did indeed decrease with aging subjects [54,55,56]. Considering the notion of entropy in the context of free energy minimization may extend the value of this study to the broader community.
4.3. The Orderness Variability of Functional Subsystems with Age
In addition to determining the NEE of the whole brain, we determined the NEE of seven intra-subsystems of the brain across a lifespan. The subsystem NEE exhibited the FC pattern within this brain functional system, which indicated the orderness variability of the specific brain functional system. We observed distinct trajectories of these subsystem NEEs with age. Concretely, the NEE of limbic system decreased quickly over the early part of the lifespan (peak age of about 60 years); thereafter it showed a slightly increasing trend. This meant that the orderness of the limbic system was enhanced before 60 years, and weakened afterwards. The limbic system, as a subcortical cortex controlling human emotions and spiritual activities, showed a consistent trajectory with the whole-brain NEE. In contrast, the NEE of the sensory motor area remained at a high level before the age of 50, indicating that it maintained high homogeneity before the age of 50. After 50 years of age, its NEE decreased, which may be associated with the increases in the inter-connections and EP, making the heterogeneity of the sensory motor area and information exchange between the sensory motor area and other subsystems increase. The EP in the sensory motor area was slightly higher than other subsystems, which may be related to the earlier maturation of the sensory motor subsystem [10,57,58], while the heteromodal areas of the association cortex governing higher cognitive function were still developmental [12,18,29,59]. The finding implied that the orderness/certainty of all subsystems were the same as the orderness/certainty of whole-brain.
The energy probabilities of part brain regions of the ventral attention subnetwork and sensory motor area were apparently higher than other networks in the youth period (Group II), while the energy probabilities of the default network, frontoparietal network and limbic subsystem decreased. This finding may imply that youth is a prominent period of change to the subsystems’ heterogeneity. The energy probabilities of the sensory motor network and part of the ventral attention network brain regions were highest in the whole-brain in the middle age (Group III). However, the energy probabilities of the visual network declined, while the energy probabilities of the default, frontoparietal, and limbic networks decreased further. This result may be consistent with the further enhanced heterogeneity of whole-brain functional subsystems [60,61,62,63,64,65]. The values of EP in the brain regions of the frontoparietal network increased slightly. And the energy probabilities of part brain regions of the default network decreased further in old age (Group IV). In summary, complicated changes to subsystems were not synchronous across the lifespan, which revealed the compensatory function among functional brain areas during normal aging [66,67,68], which may partly reflect the human brain plasticity.
4.4. Brain Regions with Significant Energy Probablity Changing
Through the Mann–Whitney rank-sum test on whole-brain EPs between Group II (youth period) and Group I (flourishing), we found that the significantly changed regions were mainly located in the right prefrontal cortex and basal ganglia, which are involved in emotion regulation and executive function in coordination with the action of the sensory system, implying that self-awareness and voluntary control performance significantly changed during neurodevelopment [69,70,71]. In addition, with the exception of the energy probabilities of the right median cingulate gyrus and right superior frontal gyrus which increased with age, other regions decreased with age. In contrast, a small set of significantly different regions was revealed between Group III (middle age) and Group II (youth period), which were less than that between Group II and Group I, and belonged to subcortical regions. These regions are mainly involved in long-term memory, implying that the memory of the human brain begins to decline with age during this period. Furthermore, we found that the brain regions where EP changes only comprised a small part of the whole brain and these changed brain regions were not synchronized. Between Groups III and IV, no brain region with significant EP changes was detected.
4.5. Limitations and Future Directions
It is worth noting that there were several issues to be considered when interpreting our findings. First, two strategies are commonly used for thresholding an FC matrix to format a graph adjacency matrix: (1) the correlation criterion using a fixed correlation value for all subjects, and (2) edges density criterion using a fixed density value for all subjects. In this study, we used a constant significance criterion. Although age and edges density were unrelated (r = −0.08, p = 0.35), more consistent results might be obtained if graph analyses could be conducted on density criterion. This issue should be studied carefully in future. Second, we regressed out the global signal to partly reduce physiological and other global noise. Third, it was a challenge to map the brain’s parcellation-based functional connectome appropriately and precisely. In the study, we used a random-generated high-resolution template and explored the scale effect of a parcellation scheme on whole-brain NEE values. To eliminate the effect of templates on estimating brain system orderness, we will consider establishing voxel-wise RSFC networks in future work. Fourth, we attempted to explore the age-related differences of functional connectome over a continuous age range that covered both development and aging. However, the analyzed samples were not perfectly distributed across the entire lifespan as the number of young adults was greater than the number of older people. We utilized a quadratic model to explore the age changes across the human lifespan. The incomplete distribution of ages in our sample may have affected parametric curve fitting. Fifth, the RSFC network we constructed was binary and undirected; however, we know that an effective connection between two brain regions indicated a causal relationship, which contained more precise information. Furthermore, weighted connections indicated the strength of the information communication between two brain regions, so in future, we will also consider establishing weighted directed RSFC networks. Sixth, the present work discussed the orderness variability of functional connectome with normal developmental and aging, while structural and functional connectomics were of mutual interaction. Brain structural connectome supported and constrained functional connectome, meanwhile brain network organization refined brain structure gradually. We will consider discussing the orderness variability of structural connectomics with age in further works to reveal the consistency and discrepancy between them.
There were some disadvantages of NEE. It can describe the integral topological properties of the system, but it cannot locate local development of the system. In addition, the model used in this study is relatively simple and may impede its generalization and application to broader areas. In the future, we will expand to encompass more graph theoretic formalisms, and pursue more accurate and detailed models. The whole-brain NEE discussed in this study was estimated only for healthy individuals. We know that there is abnormal functional connectivity specific to some RSFC subsystems in brain diseases (e.g., depression, schizophrenia, autism, Alzheimer's disease) [72,73]. So, we would examine whether the NEE of the whole brain or specific subsystems could be used to predict the course of brain diseases and to evaluate treatment effects at a mesoscale level, shedding light on the pathophysiology of brain diseases in the future.
5. Conclusions
Using a public dataset (age range 7–85 years), the results demonstrated the heterogeneity changes of RSFC networks among four groups by exploring the EP distribution. Characterizing this property through network entropy, we found a trend towards the non-linear reduction of whole-brain NEE with continuous age. Going beyond detecting whole-brain NEE, we explored seven subsystems’ NEE variability with age. The results demonstrated their consistence with trends, and the asynchronization of development and aging. In summary, our findings provided new insights into tracking the evolution of the human connectome.
Supplementary Materials
The following are available online at www.mdpi.com/1099-4300/19/9/471/s1, Figure S1: Individual NEE levels between the ages of 7 to 85 years, Table S1: Model selection and curve fitting.
Acknowledgments
We gratefully thank the NKI-RS and HCP for collecting and sharing data. This work was supported by the National Science Foundation of China (61420106001, 61503397 and 9142030002) and the National Basic Research Program of China (2013CB329401).
Author Contributions
Yiming Fan and Ling-Li Zeng conceived the algorithm and wrote the manuscript. Hui Shen and Dewen Hu revised the article. Jian Qin and Fuquan Li performed the data prepared. All authors have read and approved the final manuscript.
Conflicts of Interest
The authors declare no conflict of interest.
References
- Wainwright, M.J.; Jordan, M.I. Graphical models, exponential families, and variational inference. Found. Trends Mach. Learn. 2008, 1, 1–305. [Google Scholar] [CrossRef]
- Buckner, R.L.; Krienen, F.M.; Yeo, B.T.T. Opportunities and limitations of intrinsic functional connectivity MRI. Nat. Neurosci. 2013, 16, 832–837. [Google Scholar] [CrossRef] [PubMed]
- Power, J.D.; Fair, D.A.; Schlaggar, B.L.; Petersen, S.E. The development of human functional brain networks. Neuron 2010, 67, 735–748. [Google Scholar] [CrossRef] [PubMed]
- Yeo, B.T.T.; Krienen, F.M.; Sepulcre, J.; Sabuncu, M.R.; Lashkari, D.; Hollinshead, M.; Roffman, J.L.; Smoller, J.W.; Zöllei, L.; Polimeni, J.R.; et al. The organization of the human cerebral cortex estimated by intrinsic functional connectivity. J. Neurophysiol. 2011, 106, 1125–1165. [Google Scholar] [PubMed]
- Betzel, R.F.; Byrge, L.; He, Y.; Goni, J.; Zuo, X.N.; Sporns, O. Changes in structural and functional connectivity among resting-state networks across the human lifespan. Neuroimage 2014, 102, 345–357. [Google Scholar] [CrossRef] [PubMed]
- Zuo, X.-N.; Kelly, C.; Martino, A.D.; Mennes, M.; Margulies, D.S.; Bangaru, S.; Grzadzinski, R.; Evans, A.C.; Zang, Y.-F.; Castellanos, F.X.; et al. Growing together and growing apart-regional and sex differences in the lifespan developmental trajectories of functional homotopy. J. Neurosci. 2010, 30, 15034–15043. [Google Scholar] [CrossRef] [PubMed]
- Wang, L.; Su, L.; Shen, H.; Hu, D. Decoding lifespan changes of the human brain using resting-state functional connectivity mri. PLoS ONE 2012, 7, e44530. [Google Scholar] [CrossRef] [PubMed]
- Achard, S.; Bullmore, E. Efficiency and cost of economical brain functional networks. PLoS Comput. Biol. 2007, 3, e17. [Google Scholar] [CrossRef] [PubMed]
- Fair, D.A.; Cohen, A.L.; Power, J.D.; Dosenbach, N.U.; Church, J.A.; Miezin, F.M.; Schlaggar, B.L.; Petersen, S.E. Functional brain networks develop from a “local to distributed” organization. PLoS Comput. Biol. 2009, 5, e1000381. [Google Scholar] [CrossRef] [PubMed]
- Fransson, P.; Aden, U.; Blennow, M.; Lagercrantz, H. The functional architecture of the infant brain as revealed by resting-state fMRI. Cereb. Cortex 2011, 21, 145–154. [Google Scholar] [CrossRef] [PubMed]
- Uddin, L.Q.; Supekar, K.S.; Ryali, S.; Menon, V. Dynamic reconfiguration of structural and functional connectivity across core neurocognitive brain networks with development. J. Neurosci. 2011, 31, 18578–18589. [Google Scholar] [CrossRef] [PubMed]
- Supekar, K.; Musen, M.; Menon, V. Development of large-scale functional brain networks in children. PLoS Biol. 2009, 7, e1000157. [Google Scholar] [CrossRef] [PubMed]
- Gu, S.; Satterthwaite, T.D.; Medaglia, J.D.; Yang, M.; Gur, R.E.; Gur, R.C.; Bassett, D.S. Emergence of system roles in normative neurodevelopment. Proc. Natl. Acad. Sci. USA 2015, 112, 13681–13686. [Google Scholar] [CrossRef] [PubMed]
- Fair, D.A.; Cohen, A.L.; Dosenbach, N.U.F.; Church, J.A.; Miezin, F.M.; Barch, D.M.; Raichle, M.E.; Petersen, S.E.; Schlaggar, B.L. The maturing architecture of the brain’s default network. Proc. Natl. Acad. Sci. USA 2008, 105, 4028–4032. [Google Scholar] [CrossRef] [PubMed]
- Gao, W.; Zhu, H.; Giovanello, K.S.; Smith, J.K.; Shen, D.; Gilmore, J.H.; Lin, W. Evidence on the emergence of the brain’s default network from 2-week-old to 2-year-old healthy pediatric subjects. Proc. Natl. Acad. Sci. USA 2009, 106, 6790–6795. [Google Scholar] [CrossRef] [PubMed]
- Supekar, K.; Uddin, L.Q.; Prater, K.; Amin, H.; Greicius, M.D.; Menon, V. Development of functional and structural connectivity within the default mode network in young children. Neuroimage 2010, 52, 290–301. [Google Scholar] [CrossRef] [PubMed]
- Yang, Z.; Chang, C.; Xu, T.; Jiang, L.; Handwerker, D.A.; Castellanos, F.X.; Milham, M.P.; Bandettini, P.A.; Zuo, X.-N. Connectivity trajectory across lifespan differentiates the precuneus from the default network. Neuroimage 2014, 89, 45–56. [Google Scholar] [CrossRef] [PubMed]
- Fair, D.A.; Dosenbach, N.U.F.; Church, J.A.; Cohen, A.L.; Brahmbhatt, S.; Miezin, F.M.; Barch, D.M.; Raichle, M.E.; Petersen, S.E.; Schlaggar, B.L. Development of distinct control networks through segregation and integration. Proc. Natl. Acad. Sci. USA 2007, 104, 13507–13512. [Google Scholar] [CrossRef] [PubMed]
- Kilford, E.J.; Garrett, E.; Blakemore, S.J. The development of social cognition in adolescence: An integrated perspective. Neurosci. Biobehav. Rev. 2016, 70, 106–120. [Google Scholar] [CrossRef] [PubMed]
- Luna, B.; Padmanabhan, A.; O’Hearn, K. What has fmri told us about the development of cognitive control through adolescence? Brain Cogn. 2010, 72, 101–113. [Google Scholar] [CrossRef] [PubMed]
- Cao, M.; Wang, J.H.; Dai, Z.J.; Cao, X.Y.; Jiang, L.L.; Fan, F.M.; Song, X.W.; Xia, M.R.; Shu, N.; Dong, Q.; et al. Topological organization of the human brain functional connectome across the lifespan. Dev. Cogn. Neurosci. 2014, 7, 76–93. [Google Scholar] [CrossRef] [PubMed]
- Song, J.; Birn, R.M.; Boly, M.; Meier, T.B.; Nair, V.A.; Meyerand, M.E.; Prabhakaran, V. Age-related reorganizational changes in modularity and functional connectivity of human brain networks. Brain Connect. 2014, 4, 662–676. [Google Scholar] [CrossRef] [PubMed]
- Geerligs, L.; Renken, R.J.; Saliasi, E.; Maurits, N.M.; Lorist, M.M. A brain-wide study of age-related changes in functional connectivity. Cereb. Cortex 2015, 25, 1987–1999. [Google Scholar] [CrossRef] [PubMed]
- Meunier, D.; Achard, S.; Morcom, A.; Bullmore, E. Age-related changes in modular organization of human brain functional networks. Neuroimage 2009, 44, 715–723. [Google Scholar] [CrossRef] [PubMed]
- Joyce, K.E.; Laurienti, P.J.; Burdette, J.H.; Hayasaka, S. A new measure of centrality for brain networks. PLoS ONE 2010, 5, e12200. [Google Scholar] [CrossRef] [PubMed]
- Lohmann, G.; Margulies, D.S.; Horstmann, A.; Pleger, B.; Lepsien, J.; Goldhahn, D.; Schloegl, H.; Stumvoll, M.; Villringer, A.; Turner, R. Eigenvector centrality mapping for analyzing connectivity patterns in fmri data of the human brain. PLoS ONE 2010, 5, e10232. [Google Scholar] [CrossRef] [PubMed]
- He, Y.; Wang, J.; Wang, L.; Chen, Z.J.; Yan, C.; Yang, H.; Tang, H.; Zhu, C.; Gong, Q.; Zang, Y.; et al. Uncovering intrinsic modular organization of spontaneous brain activity in humans. PLoS ONE 2009, 4, e5226. [Google Scholar] [CrossRef] [PubMed]
- Power, J.D.; Schlaggar, B.L.; Lessov-Schlaggar, C.N.; Petersen, S.E. Evidence for hubs in human functional brain networks. Neuron 2013, 79, 798–813. [Google Scholar] [CrossRef] [PubMed]
- Cao, M.; Huang, H.; Peng, Y.; Dong, Q.; He, Y. Toward developmental connectomics of the human brain. Front. Neuroanat. 2016, 10, 25. [Google Scholar] [CrossRef] [PubMed]
- Van den Heuvel, M.P.; Sporns, O. Rich-club organization of the human connectome. J. Neurosci. 2011, 31, 15775–15786. [Google Scholar] [CrossRef] [PubMed]
- Nigam, S.; Shimono, M.; Ito, S.; Yeh, F.C.; Timme, N.; Myroshnychenko, M.; Lapish, C.C.; Tosi, Z.; Hottowy, P.; Smith, W.C. Rich-club organization in effective connectivity among cortical neurons. J. Neurosci. 2016, 36, 670–684. [Google Scholar] [CrossRef] [PubMed]
- Bullmore, E.; Sporns, O. Complex brain networks: Graph theoretical analysis of structural and functional systems. Nat. Rev. Neurosci. 2009, 10, 186–198. [Google Scholar] [CrossRef] [PubMed]
- Achard, S.; Salvador, R.; Whitcher, B.; Suckling, J.; Bullmore, E. A resilient, low-frequency, small-world human brain functional network with highly connected association cortical hubs. J. Neurosci. 2006, 26, 63–72. [Google Scholar] [CrossRef] [PubMed]
- Van, D.E.; Schoonheim, M.M.; Ijzerman, R.G.; Moll, A.C.; Landeirafernandez, J.; Klein, M.; Diamant, M.; Snoek, F.J.; Barkhof, F.; Wink, A.M. Altered eigenvector centrality is related to local resting-state network functional connectivity in patients with longstanding type 1 diabetes mellitus. Hum. Brain Mapp. 2017, 38, 3623–3636. [Google Scholar]
- Binnewijzend, M.; Adriaanse, S.; Flier, W.M.; Teunissen, C.E.; Munck, J.C.; Stam, C.J.; Scheltens, P.; Berckel, B.N.M.; Barkhof, F.; Wink, A.M. Brain network alterations in alzheimer’s disease measured by eigenvector centrality in fmri are related to cognition and csf biomarkers. Hum. Brain Mapp. 2014, 35, 2383–2393. [Google Scholar] [CrossRef] [PubMed]
- Zuo, X.N.; Ehmke, R.; Mennes, M.; Imperati, D.; Castellanos, F.X.; Sporns, O.; Milham, M.P. Network centrality in the human functional connectome. Cereb. Cortex 2012, 22, 1862–1875. [Google Scholar] [CrossRef] [PubMed]
- Wink, A.M.; de Munck, J.C.; Yd, V.D.W.; Oa, V.D.H.; Barkhof, F. Fast eigenvector centrality mapping of voxel-wise connectivity in functional magnetic resonance imaging: Implementation, validation, and interpretation. Brain Connect. 2012, 2, 265–274. [Google Scholar] [CrossRef] [PubMed] [Green Version]
- Smith, S.M.; Beckmann, C.F.; Andersson, J.; Auerbach, E.J.; Bijsterbosch, J.; Douaud, G.; Duff, E.; Feinberg, D.A.; Griffanti, L.; Harms, M.P. Resting-state fmri in the human connectome project. Neuroimage 2013, 80, 144–168. [Google Scholar] [CrossRef] [PubMed]
- Zeng, L.L.; Wang, D.; Fox, M.D.; Sabuncu, M.; Hu, D.; Ge, M.; Buckner, R.L.; Liu, H. Neurobiological basis of head motion in brain imaging. Proc. Natl. Acad. Sci. USA 2014, 111, 6058–6062. [Google Scholar] [CrossRef] [PubMed]
- Zeng, L.L.; Shen, H.; Liu, L.; Hu, D. Unsupervised classification of major depression using functional connectivity mri. Hum. Brain Mapp. 2014, 35, 1630–1641. [Google Scholar] [CrossRef] [PubMed]
- Craddock, R.C.; James, G.A.; Holtzheimer, P.E.; Hu, X.P.; Mayberg, H.S. A whole brain fmri atlas generated via spatially constrained spectral clustering. Hum. Brain Mapp. 2012, 33, 1914–1928. [Google Scholar] [CrossRef] [PubMed]
- Strang, G. Introduction to Linear Algebra, 5th ed.; Wellesley-Cambridge Press: Wellesley, MA, USA, 2016. [Google Scholar]
- Power, J.D.; Barnes, K.A.; Snyder, A.Z.; Schlaggar, B.L.; Petersen, S.E. Spurious but systematic correlations in functional connectivity mri networks arise from subject motion. Neuroimage 2012, 59, 2142–2154. [Google Scholar] [CrossRef] [PubMed]
- Van Dijk, K.R.; Sabuncu, M.R.; Buckner, R.L. The influence of head motion on intrinsic functional connectivity mri. Neuroimage 2012, 59, 431–438. [Google Scholar] [CrossRef] [PubMed]
- Zuo, X.N.; Xing, X.X. Test-retest reliabilities of resting-state fmri measurements in human brain functional connectomics: A systems neuroscience perspective. Neurosci. Biobehav. Rev. 2014, 45, 100–118. [Google Scholar] [CrossRef] [PubMed]
- Landis, J.R.; Koch, G.G. The measurement of observer agreement for categorical data. Biometrics 1977, 33, 159–174. [Google Scholar] [CrossRef] [PubMed]
- Vargha, P. A critical discussion of intraclass correlation coefficients. Stat. Med. 1997, 16, 821–823. [Google Scholar] [CrossRef]
- Allen, E.A.; Damaraju, E.; Plis, S.M.; Erhardt, E.B.; Eichele, T.; Calhoun, V.D. Tracking whole-brain connectivity dynamics in the resting state. Cereb. Cortex 2014, 24, 663–676. [Google Scholar] [CrossRef] [PubMed]
- Eguı´luz, V.M.; Chialvo, D.R.; Cecchi, G.A.; Baliki, M.; Apkarian, A.V. Scale-free brain functional networks. Phys. Rev. Lett. 2005, 94, 018102. [Google Scholar] [CrossRef] [PubMed]
- Liao, X.; Vasilakos, A.V.; Yong, H. Small-world human brain networks: Perspectives and challenges. Neurosci. Biobehav. Rev. 2017, 77, 286–300. [Google Scholar] [CrossRef] [PubMed]
- Yao, Y.; Lu, W.L.; Xu, B.; Li, C.B.; Lin, C.P.; Waxman, D.; Feng, J.F. The increase of the functional entropy of the human brain with age. Sci. Rep. 2013, 3, 2853. [Google Scholar] [CrossRef] [PubMed]
- Mcintosh, A.R.; Vakorin, V.; Kovacevic, N.; Wang, H.; Diaconescu, A.; Protzner, A.B. Spatiotemporal dependency of age-related changes in brain signal variability. Cereb. Cortex 2014, 24, 1806–1817. [Google Scholar] [CrossRef] [PubMed]
- Schrödinger, E. What is Life? University Press: Cambridge, UK, 1944. [Google Scholar]
- Tkacik, G.; Marre, O.; Mora, T.; Amodei, D.; Ii, M.J.B.; Bialek, W. The simplest maximum entropy model for collective behavior in a neural network. J. Stat. Mech. Theor. Exp. 2012, 2013, 829–837. [Google Scholar]
- Maren, A.J. The cluster variation method: A primer for neuroscientists. Brain Sci. 2016, 6, E44. [Google Scholar] [CrossRef] [PubMed]
- Tkačik’s, G.; Marre, O.; Amodei, D.; Schneidman, E.; Bialek, W.; Nd, B.M. Searching for collective behavior in a large network of sensory neurons. PLoS Comput. Biol. 2014, 10, e1003408. [Google Scholar] [CrossRef] [PubMed]
- Lin, W.; Zhu, Q.; Gao, W.; Chen, Y.; Toh, C.H.; Styner, M.; Gerig, G.; Smith, J.K.; Biswal, B.; Gilmore, J.H. Functional connectivity mr imaging reveals cortical functional connectivity in the developing brain. AJNR Am. J. Neuroradiol. 2008, 29, 1883–1889. [Google Scholar] [CrossRef] [PubMed]
- Miao, C.; Yong, H.; Dai, Z.; Liao, X.; Jeon, T.; Ouyang, M.; Chalak, L.; Bi, Y.; Rollins, N.; Qi, D. Early development of functional network segregation revealed by connectomic analysis of the preterm human brain. Cereb. Cortex 2016, 27, 1949–1963. [Google Scholar]
- Kaiser, M. Mechanisms of connectome development. Trends Cogn. Sci. 2017, 9, 703–717. [Google Scholar] [CrossRef] [PubMed]
- Fjell, A.M.; Sneve, M.H.; Grydeland, H.; Storsve, A.B.; Walhovd, K.B. The disconnected brain and executive function decline in aging. Cereb. Cortex 2017, 27, 2303–2317. [Google Scholar] [CrossRef] [PubMed]
- Sala-Llonch, R.; Bartres-Faz, D.; Junque, C. Reorganization of brain networks in aging: A review of functional connectivity studies. Front. Psychol. 2015, 6, 663. [Google Scholar] [CrossRef] [PubMed]
- Andrewshanna, J.R.; Snyder, A.Z.; Vincent, J.L.; Lustig, C.; Head, D.; Raichle, M.E.; Buckner, R.L. Disruption of large-scale brain systems in advanced aging. Neuron 2007, 56, 924–935. [Google Scholar] [CrossRef] [PubMed]
- Wu, T.; Zang, Y.; Wang, L.; Long, X.; Li, K.; Chan, P. Normal aging decreases regional homogeneity of the motor areas in the resting state. Neurosci. Lett. 2007, 423, 189–193. [Google Scholar] [CrossRef] [PubMed]
- Onoda, K.; Ishihara, M.; Yamaguchi, S. Decreased functional connectivity by aging is associated with cognitive decline. J. Cogn. Neurosci. 2012, 24, 2186–2198. [Google Scholar] [CrossRef] [PubMed]
- Tomasi, D.; Volkow, N.D. Aging and functional brain networks. Mol. Psychiatry 2012, 17, 471, 549–558. [Google Scholar] [CrossRef] [PubMed]
- West, R.L. An application of prefrontal cortex function theory to cognitive aging. Psychol. Bull. 1996, 120, 272–292. [Google Scholar] [CrossRef] [PubMed]
- Raz-Yaseef, N. Aging of the brain and its impact on cognitive performance: Integration of structural and functional findings. In Handbook of Aging and Cognition, 2nd ed.; Psychology Press: Hove, UK, 2000; pp. 1–90. [Google Scholar]
- Woodruff-Pak, D.S. The Neuropsychology of Aging; Blackwell: Hoboken, NJ, USA, 1997; p. 119. [Google Scholar]
- Albin, R.L.; Young, A.B.; Penney, J.B. The functional anatomy of basal ganglia disorders. Trends Neurosci. 1989, 12, 366–375. [Google Scholar] [CrossRef]
- Alexander, G.E.; Crutcher, M.D. Functional architecture of basal ganglia circuits: Neural substrates of parallel processing. Trends Neurosci. 1990, 13, 266–271. [Google Scholar] [CrossRef]
- Alexander, G.E.; DeLong, M.R.; Strick, P.L. Parallel organization of functionally segregated circuits linking basal ganglia and cortex. Annu. Rev. Neurosci. 1986, 9, 357–381. [Google Scholar] [CrossRef] [PubMed]
- Wang, H.; Zeng, L.L.; Chen, Y.; Yin, H.; Tan, Q.; Hu, D. Evidence of a dissociation pattern in default mode subnetwork functional connectivity in schizophrenia. Sci. Rep. 2015, 5, 14655. [Google Scholar] [CrossRef] [PubMed]
- Zeng, L.L.; Shen, H.; Liu, L.; Wang, L.; Li, B.; Fang, P.; Zhou, Z.; Li, Y.; Hu, D. Identifying major depression using whole-brain functional connectivity: A multivariate pattern analysis. Brain 2012, 135, 1498–1507. [Google Scholar] [CrossRef] [PubMed]
Figure 1.
Surface rendering of all seven resting-state functional connectivity subsystems comprising 800 brain regions in total on both left hemisphere (left) and right hemisphere (right). The inflated surfaces are provided by Caret. The color map indicates colors picturing each of the seven components and their regions on the surfaces.

Figure 2.
The topographic energy probability maps and energy probability histograms for the four groups.
Figure 2.
The topographic energy probability maps and energy probability histograms for the four groups.

Figure 3.
(a) The network eigen-entropy values reduced with age and the polynomial fitting curve was significant with an R2 of 0.47 and p of 0.001; (b) Using the Mann–Whitney rank-sum test by pairwise comparison, significant network eigen-entropy differences between groups were exhibited.
Figure 3.
(a) The network eigen-entropy values reduced with age and the polynomial fitting curve was significant with an R2 of 0.47 and p of 0.001; (b) Using the Mann–Whitney rank-sum test by pairwise comparison, significant network eigen-entropy differences between groups were exhibited.
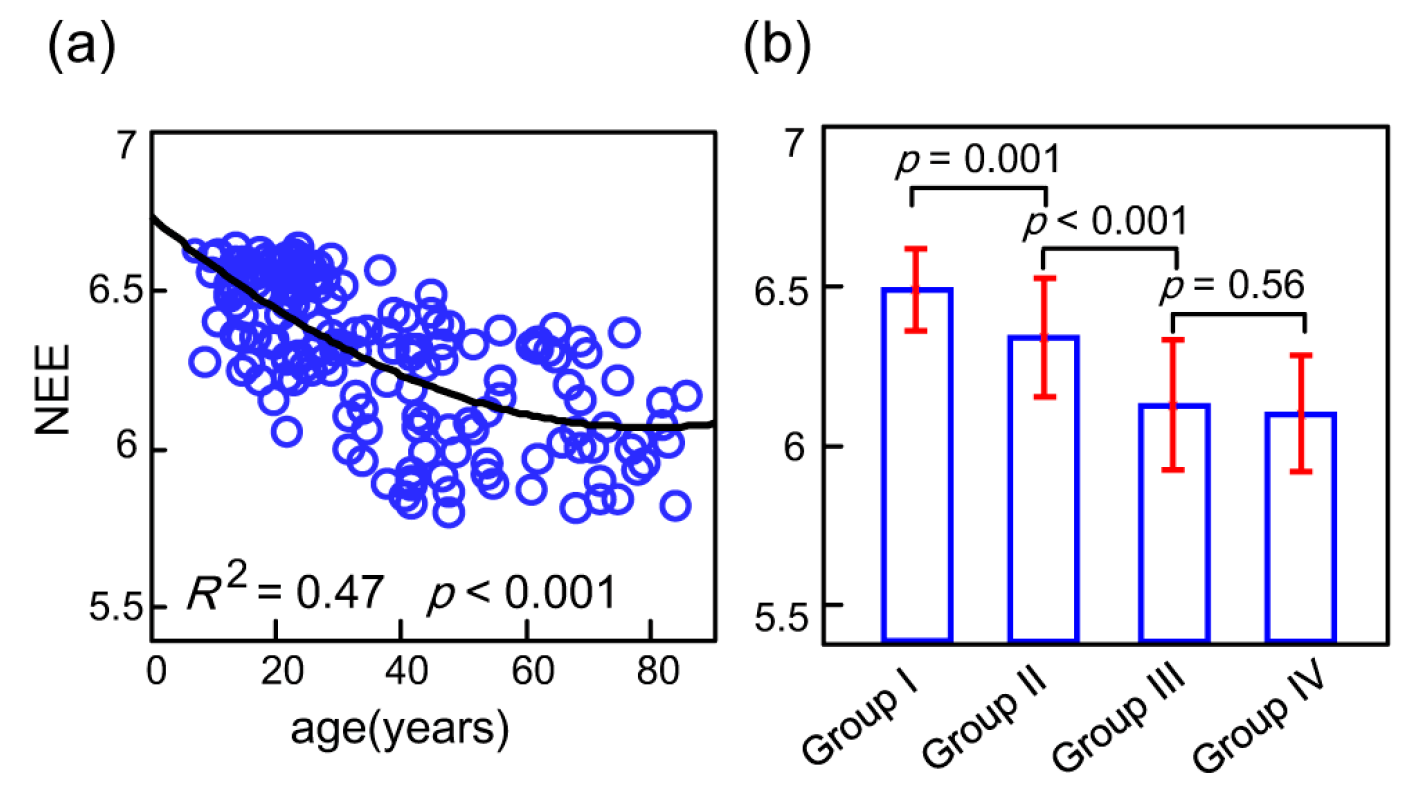
Figure 4.
The network eigen-entropy trajectories of seven subsystems with age, the polynomial fitting curve of the limbic system and sensory motor area were significant with an R2 of 0.19 and 0.20; the linear decreased fitting curve of the other five subsystems were significantly detected.
Figure 4.
The network eigen-entropy trajectories of seven subsystems with age, the polynomial fitting curve of the limbic system and sensory motor area were significant with an R2 of 0.19 and 0.20; the linear decreased fitting curve of the other five subsystems were significantly detected.

Figure 5.
Statistically significant differences in brain regions in energy probability among three groups. The red represents the positive and the teal color represents the negative Z-value. The size of the node represents the absolute Z-value. The results were presented using the BrainNet Viewer package (http://www.nitrc.org/projects/bnv). (SFG.R = right superior frontal gyrus, IFG.R = right inferior frontal gyrus, MCG.R = right median cingulate gyrus, PCG.R = right posterior cingulate gyrus, IFGtriang.R = the triangular part of the right inferior frontal gyrus, CAU.R = right caudate, ORBinf.L = the orbital part of left inferior frontal gyrus, PAL.L = left globus pallidum, IOG.L = left inferior occipital gyrus, HIP.L = left hippocampus, TPOsup.R = the temporal pole of right superior temporal gurus, FFG.R = right fusiform gyrus).

Figure 6.
(a) The network eigen-entropy values changed with the network scales; (b) The values of network eigen-entropy changed with different scanning durations; (c) The permutation distribution of the estimate of Intra-class correlation when disrupting sessions; (d) Significant differences of network eigen-entropy values between the RSFC networks and random networks. The variance distribution of resting-state functional connectivity network NEE values was two orders of magnitude larger than that of the random networks’ shown by a box diagram.


Table 1.
Demographics of the four age groups.
| Groups | Classification | Age Range (years) | Number of Participants | Gender (M a/F b) |
|---|---|---|---|---|
| Group I | flourishing | 7–20 | 40 | 23/17 |
| Group II | youth period | 23–38 | 35 | 17/18 |
| Group III | middle age | 40–59 | 37 | 27/10 |
| Group IV | old age | 61–85 | 32 | 15/17 |
M a = Male; F b = Female.
© 2017 by the authors. Licensee MDPI, Basel, Switzerland. This article is an open access article distributed under the terms and conditions of the Creative Commons Attribution (CC BY) license (http://creativecommons.org/licenses/by/4.0/).
Share and Cite
MDPI and ACS Style
Fan, Y.; Zeng, L.-L.; Shen, H.; Qin, J.; Li, F.; Hu, D. Lifespan Development of the Human Brain Revealed by Large-Scale Network Eigen-Entropy. Entropy 2017, 19, 471. https://doi.org/10.3390/e19090471
AMA Style
Fan Y, Zeng L-L, Shen H, Qin J, Li F, Hu D. Lifespan Development of the Human Brain Revealed by Large-Scale Network Eigen-Entropy. Entropy. 2017; 19(9):471. https://doi.org/10.3390/e19090471
Chicago/Turabian StyleFan, Yiming, Ling-Li Zeng, Hui Shen, Jian Qin, Fuquan Li, and Dewen Hu. 2017. "Lifespan Development of the Human Brain Revealed by Large-Scale Network Eigen-Entropy" Entropy 19, no. 9: 471. https://doi.org/10.3390/e19090471
Note that from the first issue of 2016, this journal uses article numbers instead of page numbers. See further details here.