A Simple Thermodynamic Analysis of Photosynthesis

Departamento de Física, Escuela Superior de Física y Matemáticas, Instituto Politécnico Nacional U.P. Adolfo López Mateos, C.P. 07738, México D.F.
*
Author to whom correspondence should be addressed.
Entropy 2007, 9(4), 152-168; https://doi.org/10.3390/e9040152
Submission received: 24 October 2006
/
Revised: 26 September 2007
/
Accepted: 4 October 2007
/
Published: 26 November 2007
Abstract
:In this paper we present a comparative study of nine photosynthetic pathways by means of their thermodynamic performance. The comparison is made by using the thermal efficiency of light-to-chemical energy conversion and the so-called ecological criterion arising from finite-time thermodynamics. The application of both criteria leads to photosynthesis made by metaphytes and non sulfur purple bacteria as those of best thermodynamic performance. In spite of the simplicity of our thermodynamic approach some insights over the low overall efficiency of photosynthesis is suggested.
PACS Codes:
87.101. Introduction
Schrödinger suggested that the maintenance of high organization of living beings is due to a continuum influx of negative entropy [1]. Photosynthesis is a process where energy-rich organic molecules emerge from simple, energy-poor molecules absorbing solar photons [2]. This photochemical reaction occurs in the photosynthetic reaction center, which is a very complicated molecular complex [3]. Many models to describe the photosynthetic center have been proposed. Van Rotterdam et. al. [3] suggested that the transduction of photons’ energy to a transmembrane electrochemical potential difference for protons operates in a simple battery-like manner. De Vos [4], conceived the photosynthesis engine as composed by two parts: a photovoltaic component that absorbs the solar radiation and converts it into work, and a chemical reactor, which uses the work in order to keep a chemical reaction going on in the “reverse direction”. A very complete model was proposed by Juretic and Zupanovic [5]. This model is based on a non-equilibrium thermodynamics approach provided by Meszena and Westerhoff [6]. In the treatment of photosynthesis several design principles for biological systems have been used, such as maximum efficiency [7] & [8], minimum entropy production [2] and maximum entropy production [5]. Recently Lavergne [9] has disscused a photochemical energy transducer as a model for photosynthesis within a second law analysis. Nowadays, there is no consensus about what optimization criterion if any is followed by photosynthesis performance. In this article we present a brief and simple comparison between nine photosynthetic pathways in terms of their overall thermal efficiencies and also in terms of the so-called ecological function defined within the context of finite-time thermodynamics [10]. By means of both criteria we found that photosynthesis occurring in superior plants and non sulfur purple bacteria has a better performance than the other ones. In fact, in our “ecological” analysis, we use the integral of the ecological function over the duration of photosynthetic chemical reaction. Although, efficiency and the integral of the ecological function have a similar dependence on the free energy changes, we show both comparisons because the integral of ecological function exhibits some features that are not present in the efficiency behavior. The article is organized as follows: In sect. II we present the basis and main assumptions of our thermodynamic analysis in a first approximation; in sect. III we show our thermal efficiency calculations; in sect. IV the analysis based on the ecological function is shown; in sect. V we present again efficiency and ecological calculations taking into account the role of dilution of Sun’s radiation. Finally, in sect. VI, we present the concluding remarks.
2. Photosynthesis Thermodynamics
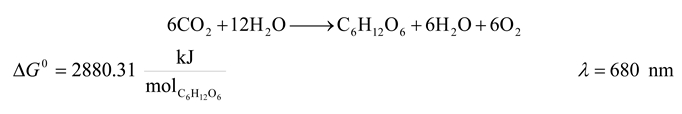
There exist several photosynthetic pathways by means of which living organisms can store solar energy in form of chemical energy. The most studied pathway being the photosynthesis made by superior plants and cyanobacteria, which can be summarized as follows,
However, alternative pathways are used by green and purple bacteria, which use compounds different from water, as sources of hydrogen to synthesize glucose. Among these compounds donors of hydrogen are sulfhydric acid, and several organic compounds such as methanol and ethanol for example. In Appendix we show nine photosynthetic pathways with their corresponding standard free energy changes. The photosynthesis reaction is usually divided in two groups of chemical reactions. The first one called the light phase of photosynthesis, in which the reactions are driven by solar light and the second one, called the dark phase, where the chemical reactions occur without solar light presence [11,12,13,14,15]. All chemical steps of photosynthesis in superior plants are well described in [11,12,13,14,15]. In the following sections we will develop a thermodynamic analysis of photosynthesis within the context of some results arising from classical and finite-time thermodynamics.
Our thermodynamic analysis of photosynthesis starts by establishing the following convenient working hypothesis:
- a)
- The Sun, the Earth and the photosynthetic organism (PO) are three different thermodynamic systems.
- b)
- The Sun is a thermal reservoir with constant temperature TS = 5762 K [4].
- c)
- The Sun has constant pressure, volume and chemical composition.
- d)
- Earth behaves as a thermal reservoir at TE = 298.15 K.
- e)
- The Earth is a system with constant pressure, volume and chemical composition.
- f)
- The photosynthetic organism (PO) has constant pressure, volume and temperature, with TPO = TE = 298.15 K.
- g)
- The PO chemical composition is not constant.
- h)
- All photosynthetic reactions are isothermal processes at TPO = 298.15 K.
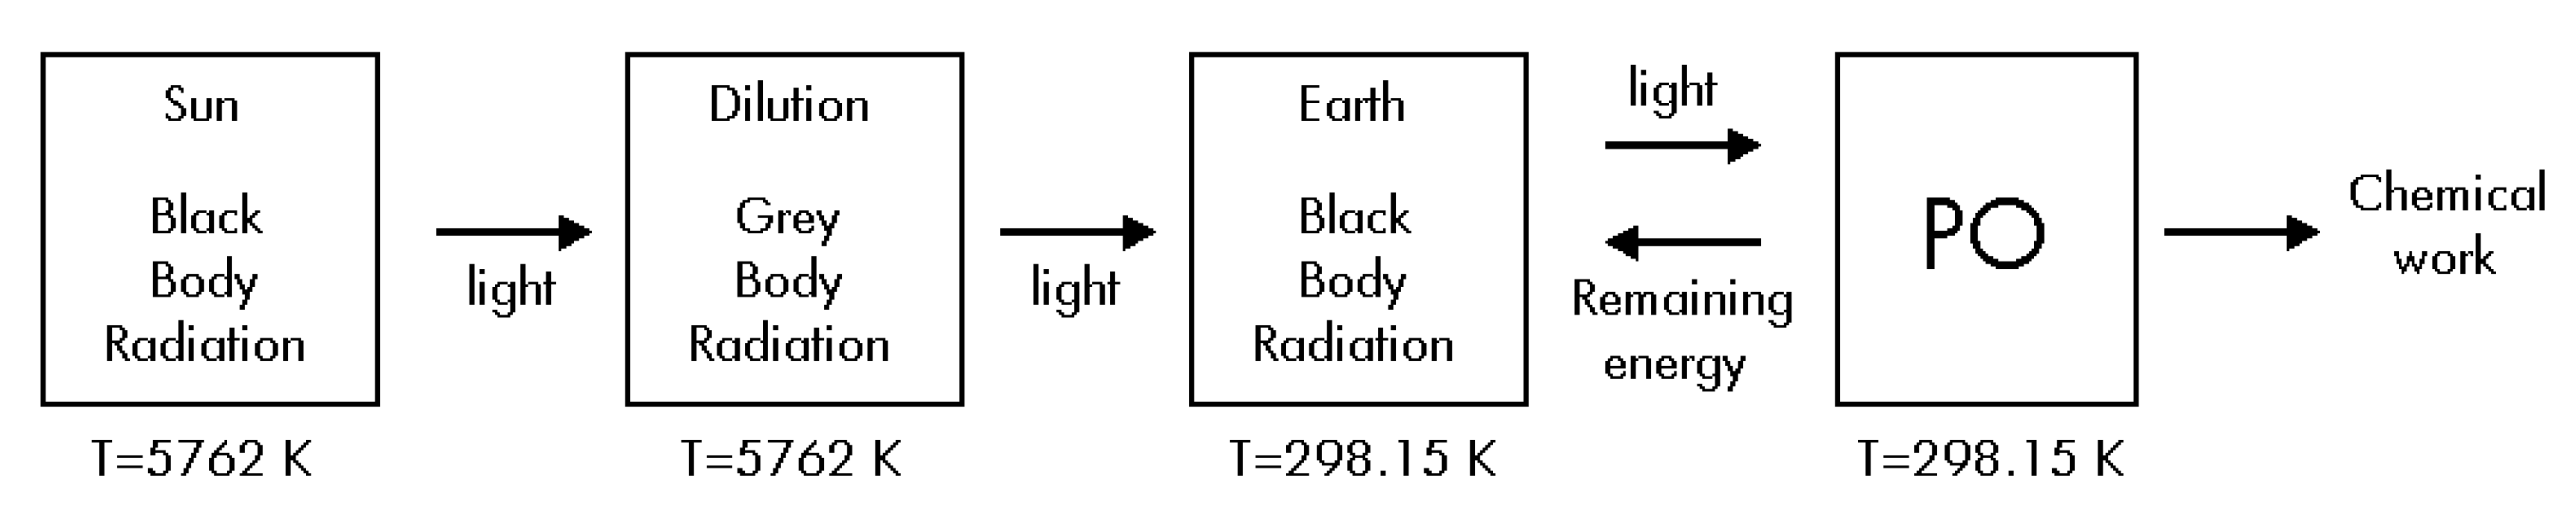
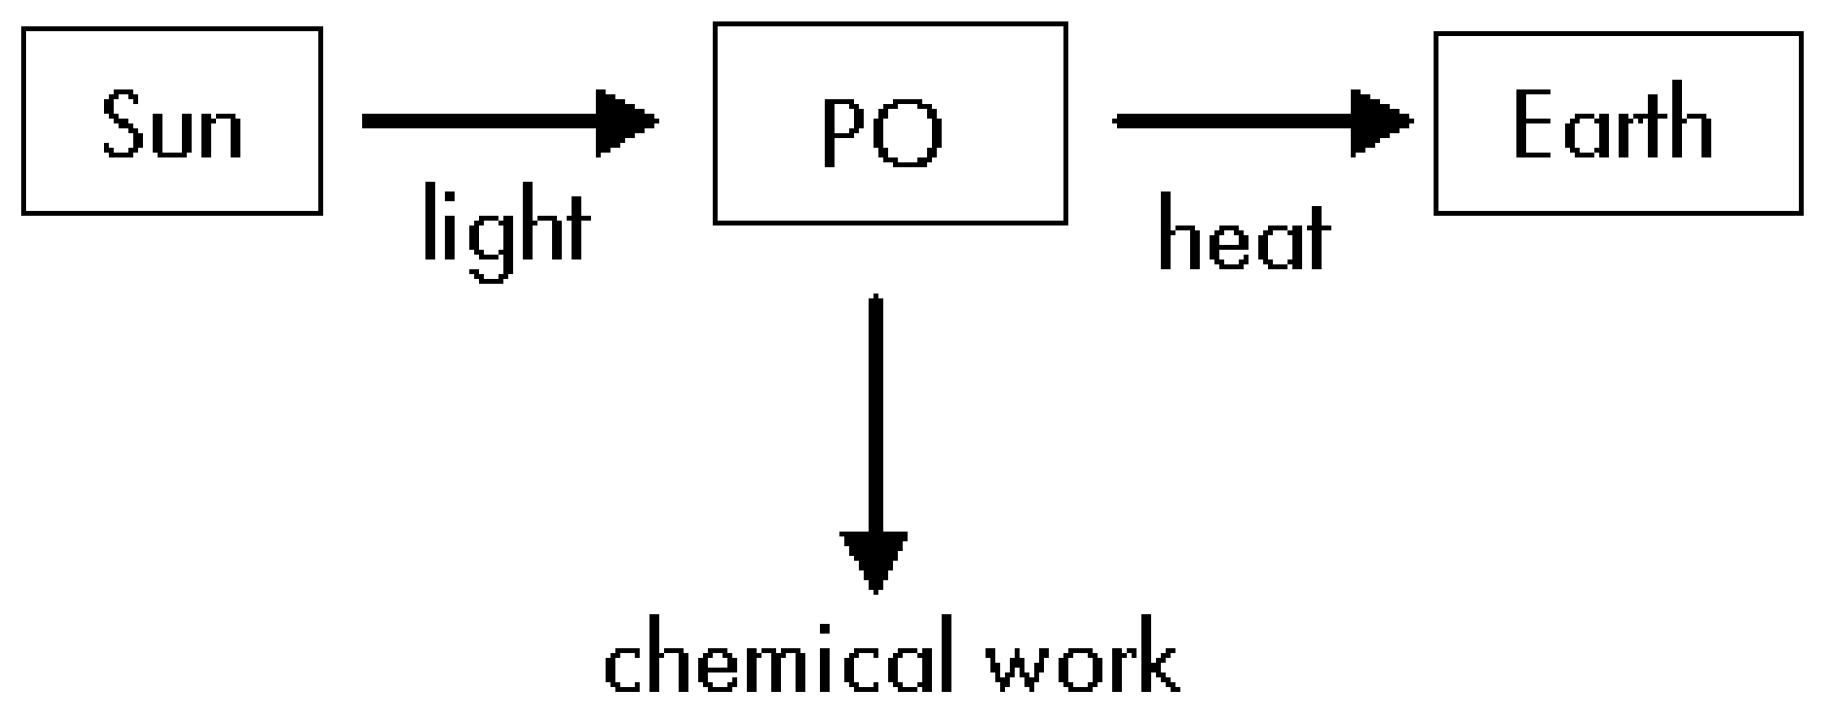
For our thermodynamic study we will divide the overall process in three steps: i) The light travels from de Sun up to the PO without making any work; ii) The PO uses some part of the received energy to produce glucose by using some chemical compounds; iii) The PO delivers the remaining energy to the Earth in form of heat (see Figure 1).
Figure 1.
Diagram corresponding to the overall energy fluxes.

Consider the following thermodynamic equations [16]:
where U is the internal energy, G the Gibbs free energy, T the temperature, P the pressure, V the volume, S the entropy, μk the k-th chemical potential and nk is the k-th number of moles. From Eqs. (1) and (2) and the mentioned working hypothesis we get the following expressions:
For the Sun system we have:
the subscript “S” refers the Sun.
For the Earth system, we obtain:
the subscript “E” refers the Earth.
Finally, for the PO we get:
the subscript “PO” refers the photosynthetic organism.
From Eqs. 5a and 5b, we can see that the chemical work is directly the Gibbs free energy change and thus:
By integrating Eqs. 3a, 4a, and 6 we obtain:
Thermodynamics of Step #1
Several authors [2] assert that superior plants need 60 photons to synthesize one glucose molecule. Then for each glucose mol synthesized, the Sun losses energy given by:
being NA the Avogadro’s number, h the Planck’s constant, c the light’s speed and λ the photon’s wavelength. With this energy change there is a concomitant entropy change, expressed as:
The energy lost by the Sun is absorbed by the photosynthetic organism, then:
and therefore, with an entropy gain given by:
Earth does not participate in this step of the process, therefore,
thus, the total change of entropy in this step is:
To obtain Eq. (14) we followed the first approximation used by Brittin and Gamow [17]. This approach consists in assuming that the diluted radiation stemming from Sun reaches the Earth with a grey body radiation spectrum. Then the process taking place when energy exchange between different frequencies is permitted can be compared to a flow of heat from a reservoir at the temperature TS to a cooler reservoir at the temperature TE. ( See Figure 1. of [17] ).
Thermodynamics of Step #2
In this step of the process the PO uses part of the absorbed energy in Step#1 and transforms it as chemical energy in the glucose synthesis. In this step, the PO does not exchange energy with its sorroundings, then ΔUPOStep#2 = 0 and the entropy change turns out to be:
being ΔGPOStep#2 the PO free energy change in Step#2.
Since Earth and Sun do not participate in this step both their entropy and energy changes become zero. Thus, the total entropy change in Step#2 becomes:
Thermodynamics of Step#3
During this step the PO rejects to Earth the remaining energy, which was not used in glucose synthesis. Thus the internal energy and entropy changes for the PO are:
and for the Earth these changes are:
Finally, for the Sun we have ΔUSStep#3 = 0 and ΔSSStep#3 = 0.
Thus, by adding Eqs. (18) and (20) with ΔSSStep#3 = 0, the total entropy change in Step#3 is:
and therefore, by using Eqs. (14), (16) and (21), the total entropy change in the three steps is:
This expression can be simplified if we take into account the Brittin and Gamow’s approximation [17]:
Then Eq. (22) becomes:
3. Efficiency Calculation
In this section we compare the efficiency of the nine photosynthetic pathways shown in the Appendix. Here, the efficiency is taken as:
Where ΔG0 is the standard Gibbs free energy change during the photosynthetical reaction. The ΔG0 and λ data for each of the nine cases are shown in the Appendix. The numerical results obtained from Eqs. (23) and (24) are depicted in Table I. The wavelength values were taken from [13], where it is asserted that the light used in photosynthesis by some PO’s have the maxima bounds shown at the second column of Table I. In Eq. (23) and (24) we use the standard free energy because of the difficulty to obtain actual free energy changes. (In addition, we are more interested in comparing efficiency values than in their absolute values). This issue has been discussed by Cornish-Bowden [18], but some authors [12] have used standard Gibbs free energy changes in efficiency calculations.

Table 1.
Efficiency Eq. (24) and entropy change Eq. (23) for the nine photosynthetic pathways given in the Appendix. For several pathways different λ values were taken. Clearly, reaction 1 (superior plants) has the higher efficiency.
| Reaction | λ [nm] | ΔU [kJ/mol] | ΔG0 [kJ/mol] | η % | ΔSUniverse [kJ/(mol K)] |
|---|---|---|---|---|---|
| 1 | 680 | 10555.287 | 2880.31 | 27.288 | 25.742 |
| 2 | 840 | 8544.756 | 429.64 | 5.028 | 27.218 |
| 2 | 870 | 8250.109 | 429.64 | 5.208 | 26.230 |
| 2 | 890 | 8064.713 | 429.64 | 5.327 | 25.608 |
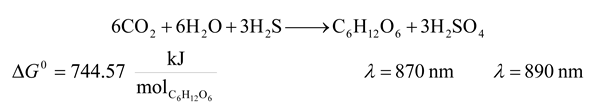
| 3 | 870 | 8250.109 | 744.57 | 9.025 | 25.174 |
| 3 | 890 | 8064.713 | 744.57 | 9.232 | 24.552 |
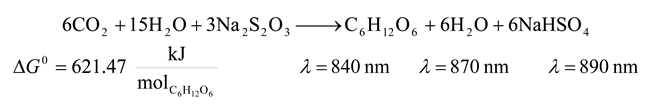
| 4 | 840 | 8544.756 | 621.47 | 7.273 | 26.575 |
| 4 | 870 | 8250.109 | 621.47 | 7.533 | 25.587 |
| 4 | 890 | 8064.713 | 621.47 | 7.706 | 24.965 |
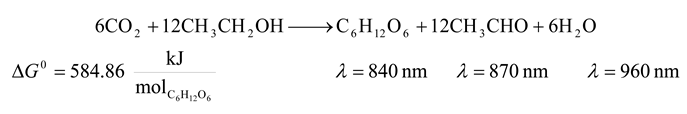
| 5 | 840 | 8544.756 | 584.86 | 6.845 | 26.698 |
| 5 | 870 | 8250.109 | 584.86 | 7.089 | 25.709 |
| 5 | 960 | 7476.661 | 584.86 | 7.822 | 23.115 |
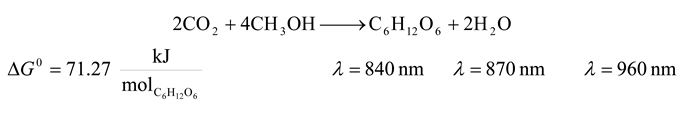
| 6 | 840 | 8544.756 | 71.27 | 0.834 | 28.420 |
| 6 | 870 | 8250.109 | 71.27 | 0.864 | 27.432 |
| 6 | 960 | 7476.661 | 71.27 | 0.953 | 24.838 |
| 7 | 870 | 8250.109 | 1066.56 | 12.928 | 24.094 |
| 7 | 960 | 7476.661 | 1066.56 | 14.265 | 21.500 |
| 8 | 870 | 8250.109 | 609.48 | 7.388 | 25.627 |
| 8 | 960 | 7476.661 | 609.48 | 8.152 | 23.033 |
| 9 | 798 | 8994.480 | 320.65 | 3.565 | 29.092 |
4. Comparison of the Photosynthesis Ecological Functions
In this section we will present a brief analysis of some photosynthetical reactions within the context of finite-time thermodynamics [2], [5,6,7,8], [10]. In particular, we will use the so-called ecological criterion [10]. This criterion is based in the maximization of the so-named ecological function, defined as:
where P is the power output of an energy conversion process, T is the absolute temperature of a heat reservoir to which the heat is rejected and σ is the total entropy production during the process.
To obtain an expression for E independent of time, we integrate Eq. (25) along the time interval τ employed to synthesize one mol of glucose by using 60 mol of photons, that is:
We take this process as an isothermal one that is, T=TPO, then:
where W is the mean work done, and ΔSU is the mean total entropy change of the universe, both during the time interval τ. This interval can be different for each photosynthetic pathway, due to they are distinct in many respects, including structural, kinetic and thermodynamic aspects. However, we will only compare the integral of the ecological function, see 6th column of Table II.
On the other hand, by means of Eq. (23) we have:
with:
and we also have:
Thus, the integral of ecological function is:
that is a function of ΔG and λ, , given by,
We compare now the photosynthetical pathways by means of the values of the integral of ecological function. In Table II, we show the results of Eq. (30) for nine photosyntetical pathways using the standard Gibbs free energy.
As we can see, the photosynthesis in superior plants has the maximum value for the integral of the ecological function. Here, we only compare the integral of the ecological function for the nine photosynthetical pathways searching for its maximum value and we had not made a general optimization of the ecological function. It has been suggested that the ecological function represents a good trade off between high power output and low entropy production [10], [19]. Thus, the photosynthesis made by metaphytes is better than the other ones, in the sense of the ecological function. Remarkably, in all of the calculated cases, the integral of function E has negative values. According with Eq. (25), this means that the dissipative term Tσ is larger than the power term P, which may be a possible explanation of the low overall efficiency of photosynthesis [20]. Although efficiency and have a similar dependence on ΔG0, their results are not redundant because the integral of the ecological function gives information about the dissipative terms that are not explicitly taken into account in the efficiency analysis. In addition, the integral of ecological function and the efficiency have dependence on the wavelength, and if we simultaneously analyze the dependence on ΔG0 and λ it is easy to see that both functions have not exactly the same monotony (see Figure 2).
5. Analyzing the Radiation’s Entropy Change.
Such as Brittin and Gamow assert [17], Eq. (14) is only an approximation. However, if a more complete estimation of ΔSUniverse for its radiative term is made, we must calculate the correct entropy change for the radiation during its travel from the Sun up to the Earth. Then, it is necessary to do a new thermodynamic analysis considering four steps during the overall process: i) The radiation travels from de Sun up to the Earth suffering a free adiabatic expansion without making any work, and without exchanging any heat; ii) The PO absorbs light from the environment; iii) The PO uses some part of the received energy to produce glucose by using some chemical compounds; iv) The PO delivers the remaining energy to the environment (see Figure 3). We now give a brief thermodynamic description of the four steps.
Table 2.
Comparison of nine photosynthetical pathways in terms of Ecological Function given by Eq. (30). For this case, reaction 1 (superior plants) has the higher value of the integral of the ecological function.
| Reaction | λ [nm] | ΔU [kJ/mol] | ΔG0 [kJ/mol] | η % | [kJ/mol] |
|---|---|---|---|---|---|
| 1 | 680 | 10555.287 | 2880.31 | 27.288 | -4794.667 |
| 2 | 840 | 8544.756 | 429.64 | 5.028 | -7685.476 |
| 2 | 870 | 8250.109 | 429.64 | 5.208 | -7390.829 |
| 2 | 890 | 8064.713 | 429.64 | 5.327 | -7205.433 |
| 3 | 870 | 8250.109 | 744.57 | 9.025 | -6760.969 |
| 3 | 890 | 8064.713 | 744.57 | 9.232 | -6575.573 |
| 4 | 840 | 8544.756 | 621.47 | 7.273 | -7301.816 |
| 4 | 870 | 8250.109 | 621.47 | 7.533 | -7007.169 |
| 4 | 890 | 8064.713 | 621.47 | 7.706 | -6821.773 |
| 5 | 840 | 8544.756 | 584.86 | 6.845 | -7375.036 |
| 5 | 870 | 8250.109 | 584.86 | 7.089 | -7080.389 |
| 5 | 960 | 7476.661 | 584.86 | 7.822 | -6306.941 |
| 6 | 840 | 8544.756 | 71.27 | 0.834 | -8402.216 |
| 6 | 870 | 8250.109 | 71.27 | 0.864 | -8107.569 |
| 6 | 960 | 7476.661 | 71.27 | 0.953 | -7334.121 |
| 7 | 870 | 8250.109 | 1066.56 | 12.928 | -6116.989 |
| 7 | 960 | 7476.661 | 1066.56 | 14.265 | -5343.541 |
| 8 | 870 | 8250.109 | 609.48 | 7.388 | -7031.149 |
| 8 | 960 | 7476.661 | 609.48 | 8.152 | -6257.701 |
| 9 | 798 | 8994.480 | 320.65 | 3.565 | -8353.180 |
Figure 2.
The integral of the ecological function in terms of the efficiency for each ΔG0 of the nine pathways. Data obtained by using Eqs. (24) and (30).
Figure 2.
The integral of the ecological function in terms of the efficiency for each ΔG0 of the nine pathways. Data obtained by using Eqs. (24) and (30).
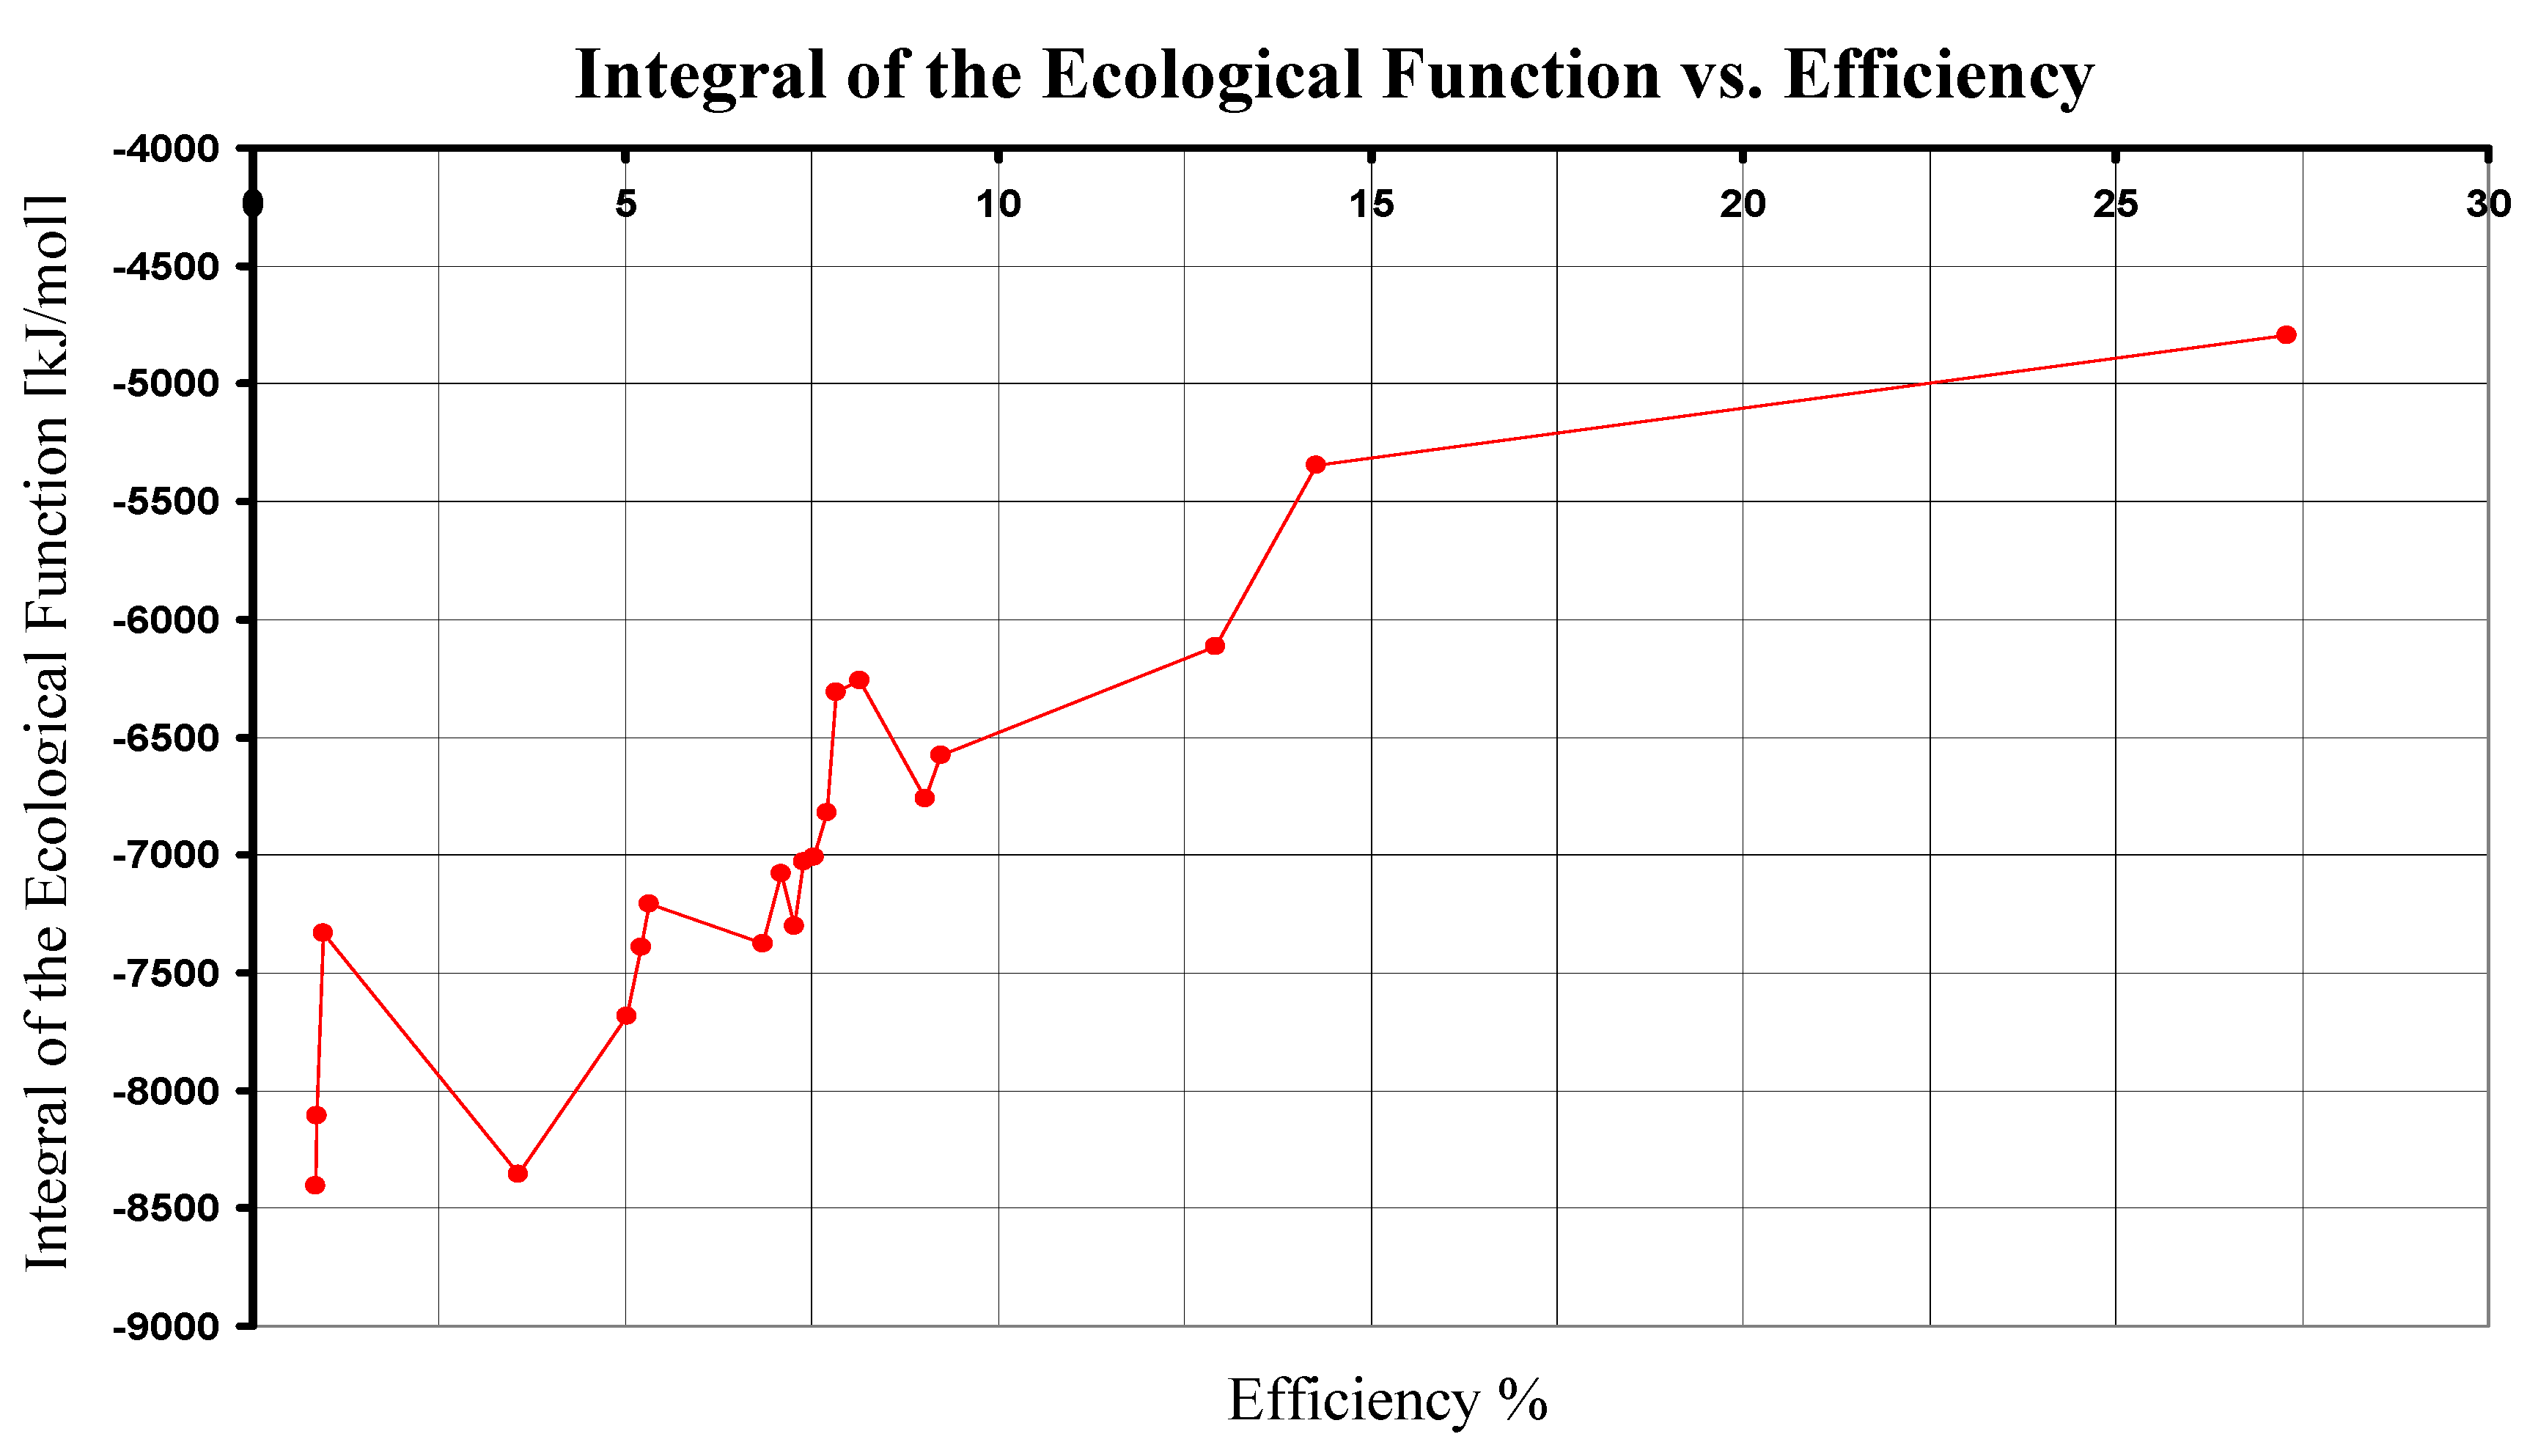
Figure 3.
Alternative diagram corresponding to the overall energy fluxes.
Thermodynamics of Step #1
As Figure 3 shows, the photons in the surface of the Sun act as a black-body radiation at TS = 5762 K that suffers a free adiabatic expansion during the travel across the space. Just before arriving to the Earth, the diluted gas of photons has the properties of an equivalent grey-body at TS = 5762 K in a radiative equilibrium with the Earth’s atmosphere which acts as a black-body at TE = 298.15 K [17]. The emissivity ε of this equivalent grey-body radiation is the square of the Sun’s radius divided by the square of the radius of the Earth’s orbit which is the so-called dilution factor [4]. Then the radiation equilibrium equation is:
with
where RS is the radius of the Sun, RO is the radius of the Earth’s orbit and σ is the Stefan-Boltzman’s constant. The initial state of the photons’ gas is the black-body radiation at TS = 5762 K in the Sun’s surface having entropy SS, energy US and volume VS. On the other hand, the final state is the black-body radiation at TE = 298.15 K in the Earth’s atmosphere having entropy SE, energy UE and volume VE. Then the entropy and the energy of the radiation at the initial and final states are given by [21]:
where a is defined by a = 4σ / c.
Thermodynamics of Step #2
During this step, the light energy goes from the Earth’s atmosphere at TE = 298.15 K to the PO at the same temperature TPO = 298.15 K. Then the entropy change becomes zero.
Thermodynamics of Step #3
During this step, the PO uses some energy in the photosynthetic reaction to making chemical work denoted by ΔGPOStep#3. Then the entropy change during this step is:
Thermodynamics of Step #4
Finally, the PO at TPO = 298.15 K delivers the remaining energy to the environment at the same temperature TE = 298.15 K. Then the entropy change becomes zero.
By using Eqs. (37), (38), (39) and (40) and simplifying by means of the approximation 1/TS ≈ 0, we obtain:
and now by taking Eqs. (27) and (41) we get:
Finally, by using Eqs. (24), (41) and (42) in the comparison of the nine photosynthetical pathways mentioned, we arrive to Table III and Figure 4. As it can be seen, under this analysis the maximum value of is now reached by the photosynthesis made by non sulfur purple bacteria. (Reaction number seven from the Appendix with its superior value λ = 960 nm [13].)
Table 3.
Comparison of nine photosynthetical pathways in terms of Ecological Function given by Eq. (42). In this case, the higher value of the integral of the ecological function is reached by reaction 7 with λ = 960 nm.
| Reaction | λ [nm] | ΔU [kJ/mol] | ΔG0 [kJ/mol] | η % | ΔSUniverse [kJ/(mol K)] | [kJ/mol] |
|---|---|---|---|---|---|---|
| 1 | 680 | 10555.287 | 2880.31 | 27.288 | 37.543 | -8313.096 |
| 2 | 840 | 8544.756 | 429.64 | 5.028 | 36.771 | -10533.728 |
| 2 | 870 | 8250.109 | 429.64 | 5.208 | 35.454 | -10140.865 |
| 2 | 890 | 8064.713 | 429.64 | 5.327 | 34.625 | -9893.671 |
| 3 | 870 | 8250.109 | 744.57 | 9.025 | 34.397 | -9511.005 |
| 3 | 890 | 8064.713 | 744.57 | 9.232 | 33.568 | -9263.811 |
| 4 | 840 | 8544.756 | 621.47 | 7.273 | 36.128 | -10150.068 |
| 4 | 870 | 8250.109 | 621.47 | 7.533 | 34.810 | -9757.205 |
| 4 | 890 | 8064.713 | 621.47 | 7.706 | 33.981 | -9510.011 |
| 5 | 840 | 8544.756 | 584.86 | 6.845 | 36.251 | -10223.288 |
| 5 | 870 | 8250.109 | 584.86 | 7.089 | 34.933 | -9830.425 |
| 5 | 960 | 7476.661 | 584.86 | 7.822 | 31.474 | -8799.161 |
| 6 | 840 | 8544.756 | 71.27 | 0.834 | 37.973 | -11250.468 |
| 6 | 870 | 8250.109 | 71.27 | 0.864 | 36.656 | -10857.605 |
| 6 | 960 | 7476.661 | 71.27 | 0.953 | 33.197 | -9826.341 |
| 7 | 870 | 8250.109 | 1066.56 | 12.928 | 33.317 | -8867.025 |
| 7 | 960 | 7476.661 | 1066.56 | 14.265 | 29.859 | -7835.761 |
| 8 | 870 | 8250.109 | 609.48 | 7.388 | 34.850 | -9781.185 |
| 8 | 960 | 7476.661 | 609.48 | 8.152 | 31.392 | -8749.921 |
| 9 | 798 | 8994.480 | 320.65 | 3.565 | 39.148 | -11351.340 |
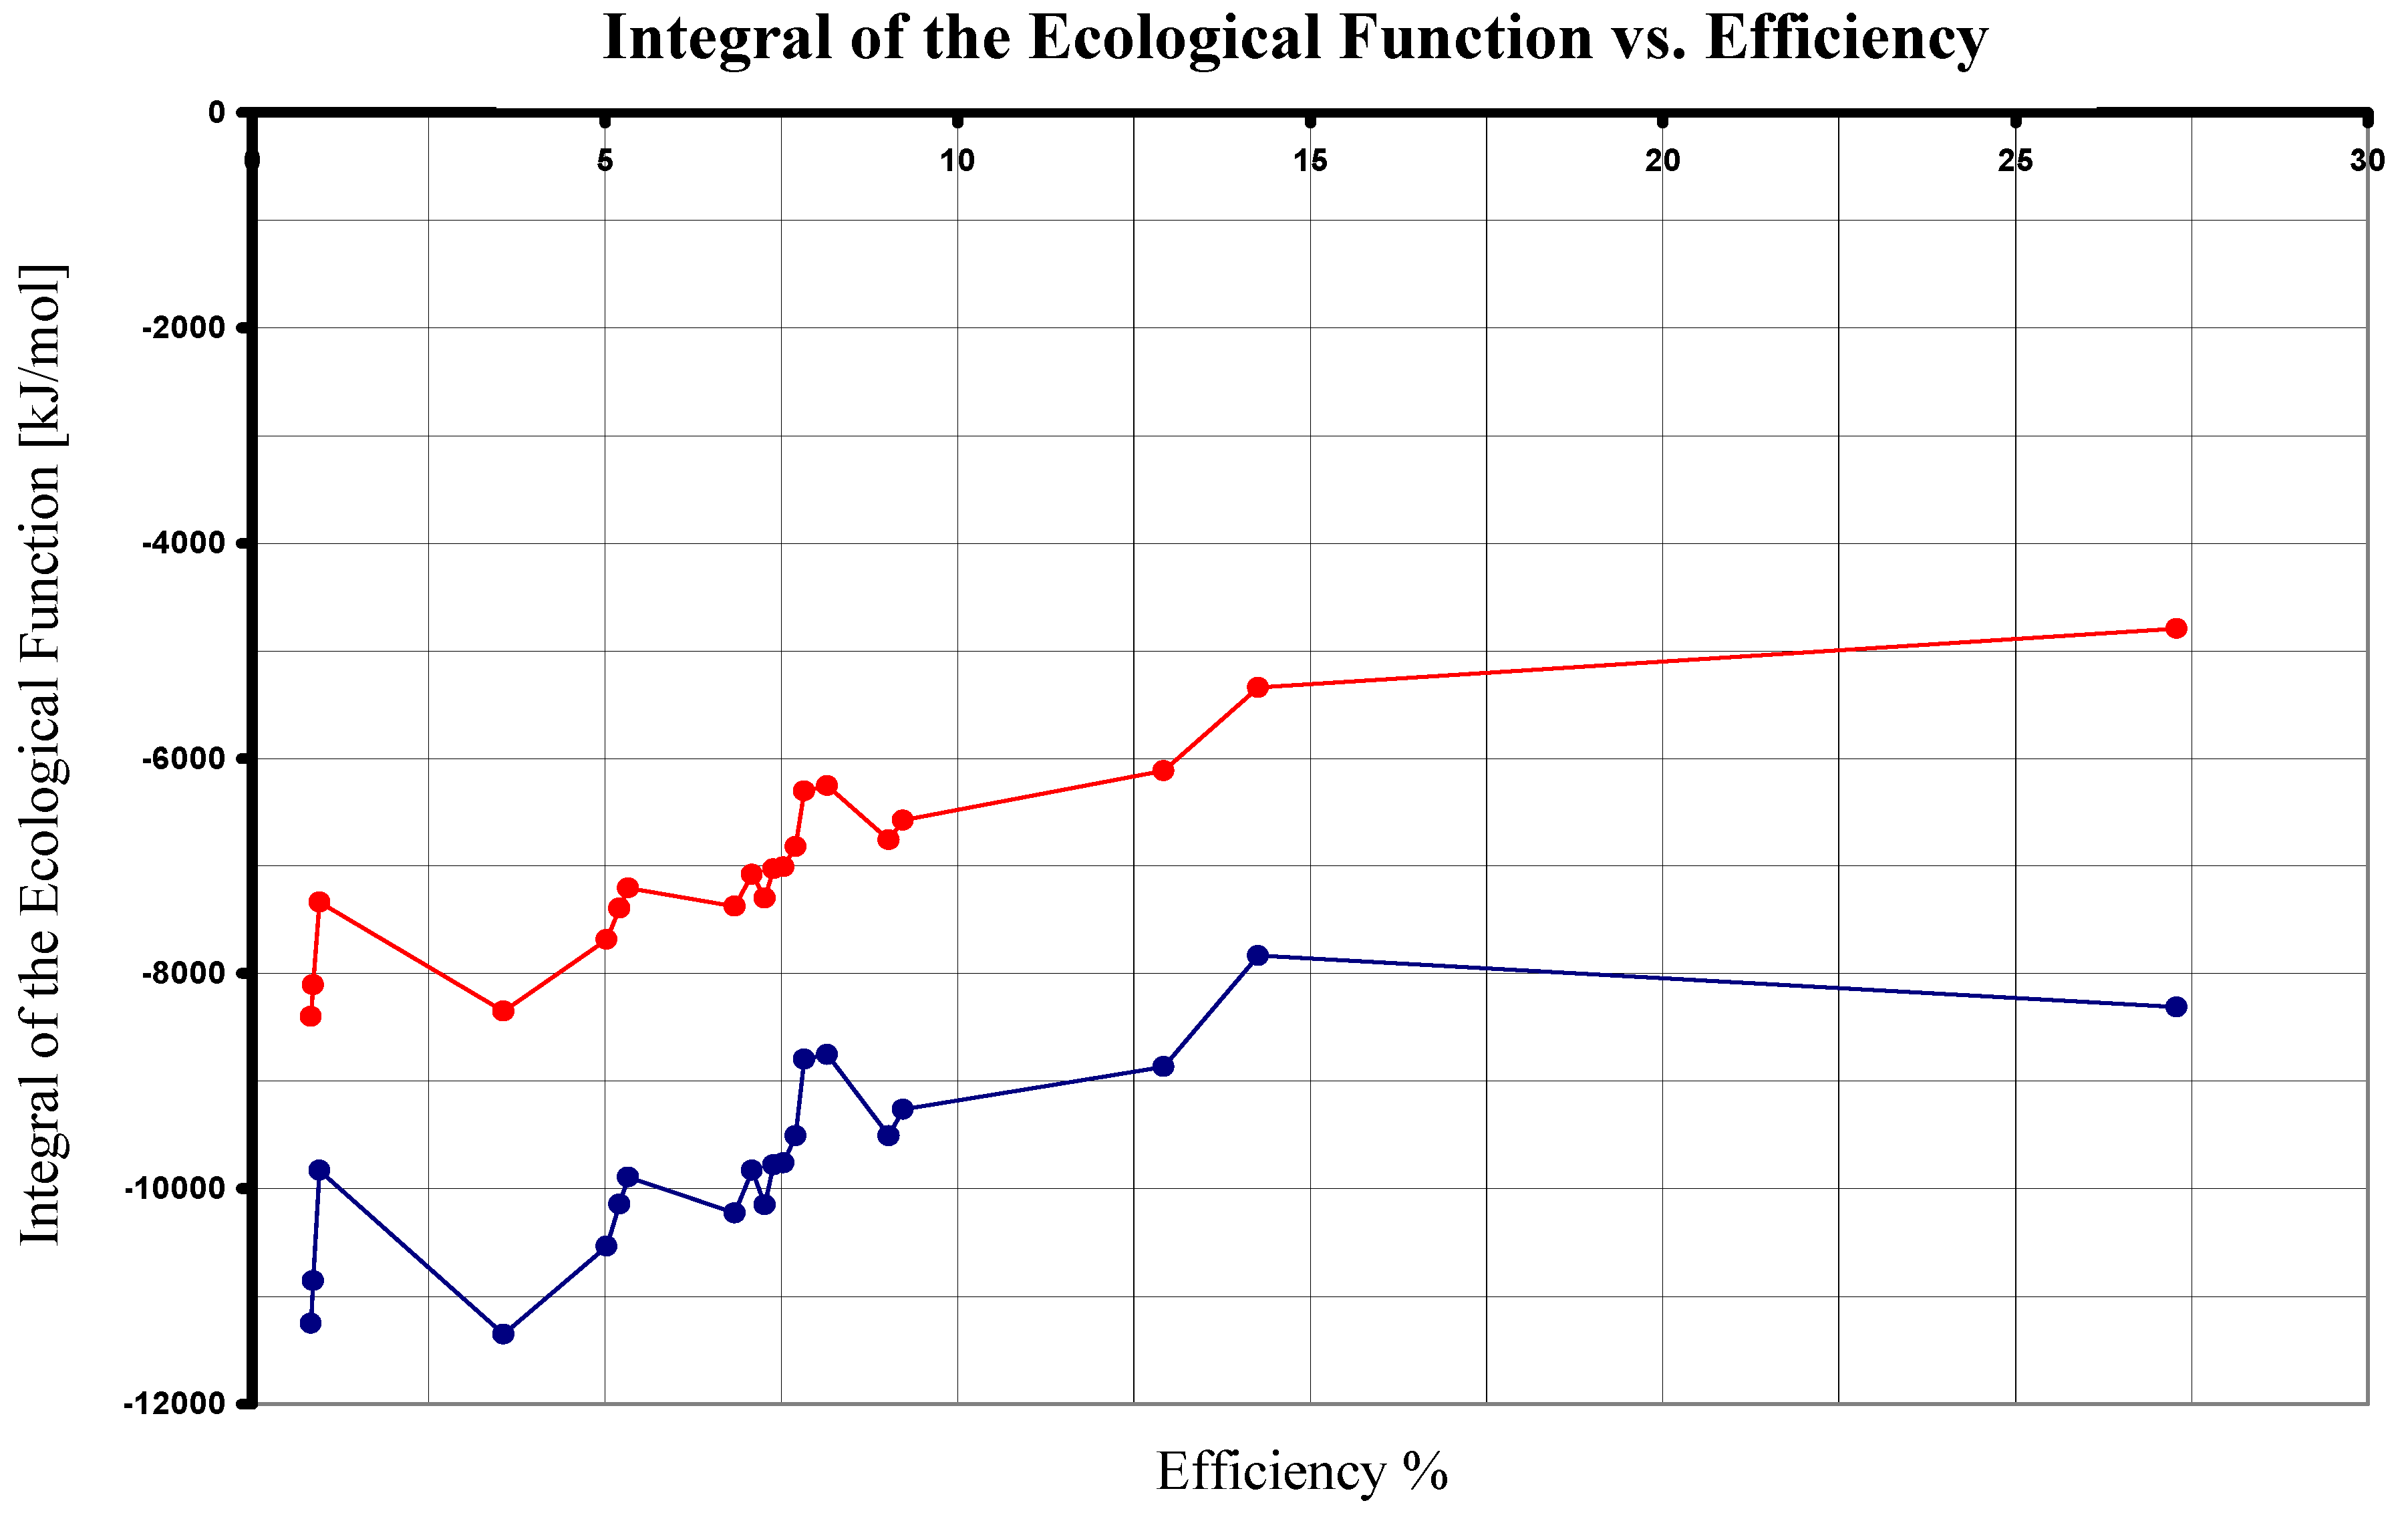
Figure 4.
The Integral of the Ecological Function in terms of the Efficiency.Upper plot corresponds Eqs. (24) and (30). Inferior graph corresponds to Eqs. (24) and (42).
Figure 4.
The Integral of the Ecological Function in terms of the Efficiency.Upper plot corresponds Eqs. (24) and (30). Inferior graph corresponds to Eqs. (24) and (42).
6. Concluding Remarks
In many man-made energy converters several design principles have been used to obtain certain optimal objectives [22,23,24,25,26]. Among these, one finds maximum power output, minimum entropy generation, maximum efficiency and several others. However, is a pertinent hypothesis to think that Nature uses analogous design procedures? Nowadays, there is not a consensus about this matter. However, several authors have proposed optimization criteria to analyze the performance mode of operation of some natural processes. In particular, for the case of photosynthesis, criteria such as maximum efficiency, minimum entropy production and maximum entropy production have been used. We have described a simplified analysis of photosynthesis, in particular, we compared the thermal efficiency of light-to-chemical energy conversion for nine different photosynthetic pathways. Additionally, we also compared these chemical pathways by means of the so-called ecological function used in finite-time thermodynamics. These analyses are not redundant because the “ecological” criterion reveals some features that are not explicit in the efficiency analysis. Under this analysis, in Table I we see that reaction 1 (metaphytes) reaches the higher overall thermal efficiency. Under the first Brittin and Gamow’s approach, the ecological analysis gave that metaphytes reach the higher value of the integral of the ecological function. However, when the second Brittin and Gamow’s approach is taken into account (the 4/3 term), the non sulfur purple bacteria slightly reach the higher value of the integral of the ecological function above the corresponding value for the metaphytes. It is convenient to remark that our calculation for the thermal efficiency must be taken as an inferior bound of actual efficiencies due to typical standard Gibbs free energy changes are smaller than actual Gibbs free energy changes [12]. In spite of our analysis is based on a very elementary approach, it suggests that possibly some biological processes are concomitant with certain thermodynamic optimality criteria. In summary, in the present article we have obtained some known results as that concerning to efficiency of metaphytes and other one we consider less known as it is the case for the negative values of the ecological function for photosynthesis, that is, with a dissipation term larger than the work produced as a possible explanation of the low overall efficiency of photosynthesis.
Appendix
These data were taken or calculated from [11,12,13], [27,28,29,30]
- 1. Superior Plants and Cyanobacteria
![Entropy 09 00152 i001]()
- 2. Sulfur Purple Bacteria and Sulfur Green Bacteria, young bacteria
![Entropy 09 00152 i002]()
- 3. Sulfur Purple Bacteria, old bacteria
![Entropy 09 00152 i003]()
- 4. Sulfur Purple Bacteria and Sulfur Green Bacteria
![Entropy 09 00152 i004]()
- 5. Non Sulfur Purple Bacteria and Non Sulfur Green Bacteria
![Entropy 09 00152 i005]()
- 6. Non sulfur Purple Bacteria and Non Sulfur Green Bacteria
![Entropy 09 00152 i006]()
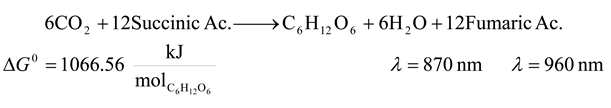
- 7. Non Sulfur Purple Bacteria
![Entropy 09 00152 i007]()
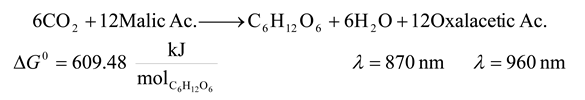
- 8. Non Sulfur Purple Bacteria
![Entropy 09 00152 i008]()
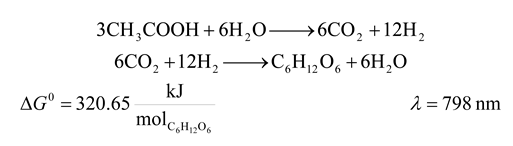
- 9. Heliobacteria
![Entropy 09 00152 i009]()

References and Notes
- Schrödinger, E. What is life? Cambridge University Press: Cambridge, 1944. [Google Scholar]
- Andriesse, C.D.; Hollestelle, M.J. Minimum entropy production in photosynthesis. Biophys. Chem. 2001, 90, 249–253. [Google Scholar] [CrossRef]
- van Rotterdam, B.J.; Crielaard, W.; van Stokkum, I.H.M.; Hellingwerf, K.J.; Westerhoff, H.V. FEBS Letters 2002, 510, 105–107. [PubMed]
- De Vos, A. Endoreversible Thermodynamics of Solar Energy Conversion; Oxford University Press: Oxford, U.K, 1992. [Google Scholar]
- Juretic, D.; Zupanovic, P. Photosynthetic models with maximum entropy production in irreversible charge transfer steps. Comp. Biol. Chem. 2003, 27, 541–553. [Google Scholar] [CrossRef]
- Meszena, G.; Westerhoff, H.V. Non-equilibrium thermodynamics of light absorption. J. Phys. A: Math. Gen. 1999, 32, 301–311. [Google Scholar] [CrossRef]
- Stucki, J.W. The optimal efficiency and the economic degrees of coupling of oxidative phosphorylation. Eur. J. Biochem. 1980, 109, 269–283. [Google Scholar] [CrossRef] [PubMed]
- Andersen, B.; Shiner, J.S.; Uehlinger, D.E. Allometric scaling and maximum efficiency in physiological eigen time. Proc. Natl. Acad. Sci. USA 2002, 99, 5822–5824. [Google Scholar] [CrossRef] [PubMed]
- Lavergne, J. Commentary on: “Photosynthesis and negative entropy production” by Jennings and coworkers. Biochim. Biophys. Acta 2006, 1757, 1453–1459. [Google Scholar] [CrossRef] [PubMed]
- Angulo-Brown, F. An ecological optimization criterion for finite time heat engines. J. Appl. Phys. 1991, 69, 7465–7469. [Google Scholar] [CrossRef]
- Lehninger, A.L. Principles of Biochemistry; Worth Publishers: New York, NY, 1982. [Google Scholar]
- Lehninger, A.L. Biochemistry, 2nd Ed. ed; Worth Publishers: New York, NY, 1975. [Google Scholar]
- Hall, D.O.; Rao, K.K. Photosynthesis; Cambridge University Press: Cambridge, 1995; pp. 126–144. [Google Scholar]
- Volkenstein, M.V. Biofísica; MIR: Moscow, 1985; Chapter 14; pp. 478–796. (in Spanish) [Google Scholar]
- Hopkins, W.G. Introduction to Plant Physiology, 2nd Ed. ed; John Wiley & Sons: New York, 1999. [Google Scholar]
- Zemansky, M.W.; Dittman, R.H. Heat and Thermodynamics; Mc Graw Hill: New York, 1981; pp. 212–244. [Google Scholar]
- Brittin, W.; Gamow, G. Negative entropy and photosynthesis. Proc. Natl. Acad. Sci. USA 1961, 47, 724–727. [Google Scholar] [CrossRef] [PubMed]
- Cornish-Bowden, A. Metabolic efficiency: Is it a useful concept? Biochem. Soc. Trans. 1983, 11, 44–45. [Google Scholar] [PubMed]
- Angulo-Brown, F.; Arias-Hernandez, L.; Santillan, M. On some connections between first order irreversible thermodynamics and finite-time thermodynamics. Rev. Mex. Fis. 2002, 48S, 182–192. [Google Scholar]
- Calow, P. Life Cycles; John Wiley & Sons: New York, NY, 1978; p. 29. [Google Scholar]
- Mandl, F. Statistical Physics; John Wiley & Sons: New York, NY, 1988; Chapter 10; pp. 251–259. [Google Scholar]
- Advances in Thermodynamics; Vol. 4, Finite-Time Thermodynamics and Thermoeconomics; Sieniutycz, S.; Salomon, P. (Eds.) Taylor & Francis: New York, NY, 1990.
- Bejan, A. Entropy generation minimization: The new thermodynamics of finite-size devices and finite-time processes. J. Appl. Phys. 1996, 79(3), 1191–1218. [Google Scholar] [CrossRef] [Green Version]
- Hoffmann, K.H.; Burzier, J.M.; Schubert, S. Endoreversible Thermodynamics. J. Non-Equilib. Thermodyn. 1997, 22(4), 311–355. [Google Scholar]
- Recent Advances in Finite-Time Thermodynamics; Wu, C.; Chen, L.; Chen, J. (Eds.) Nova Sci. Pub.: New York, NY, 1999.
- Advances in Finite-Time Thermodynamics: Analysis and optimization; Chen, L.; Sun, F. (Eds.) Nova Sci. Pub.: New York, NY, 2004.
- Madigan, M.T.; Martinko, J.M.; Parker, J. Brock, Biology of Microorganisms, 8th Ed. ed; Prentice Hall: Upper Saddle River, NJ, 2000; pp. 635–676, (Spanish Edition). [Google Scholar]
- Dean, J.A. Lange’s Handbook of Chemistry; McGrawHill: New York, NY, 1992. [Google Scholar]
- Conn, E.E.; Stumpf, P.K. Outlines of Biochemistry, 3rd Ed. ed; John Wiley & Sons: New York, NY, 1972; Chapter 15; pp. 401–425, (Spanish Edition). [Google Scholar]
- Parés, R.; Farrás, I.; Jiménez, A.J. Bioquímica de los Microorganismos; Reverté: Barcelona, Spain, 1997; Chapter 23; pp. 304–320. (in Spanish) [Google Scholar]
© 2007 by MDPI (http://www.mdpi.org). Reproduction is permitted for noncommercial purposes.
Share and Cite
MDPI and ACS Style
Albarrán-Zavala, E.; Angulo-Brown, F. A Simple Thermodynamic Analysis of Photosynthesis. Entropy 2007, 9, 152-168. https://doi.org/10.3390/e9040152
AMA Style
Albarrán-Zavala E, Angulo-Brown F. A Simple Thermodynamic Analysis of Photosynthesis. Entropy. 2007; 9(4):152-168. https://doi.org/10.3390/e9040152
Chicago/Turabian StyleAlbarrán-Zavala, E., and F. Angulo-Brown. 2007. "A Simple Thermodynamic Analysis of Photosynthesis" Entropy 9, no. 4: 152-168. https://doi.org/10.3390/e9040152