Investigation of DNA-protein Sequence-Specific Interactions with a ds-DNA Array

Chien-Shiung Wu Laboratory, Department of Biological Science and Medical Engineering, Southeast University, Nanjing 210096, P.R. China
*
Author to whom correspondence should be addressed.
Molecules 2005, 10(2), 417-426; https://doi.org/10.3390/10020417
Submission received: 2 April 2004
/
Revised: 21 December 2004
/
Accepted: 22 December 2004
/
Published: 28 February 2005
Abstract
:The sequence specific recognitions between DNAs and proteins play important roles in many biological functions. The use of double-stranded DNA arrays (ds-DNA arrays) for studying sequence specific recognition between DNAs and proteins is a promising method. Here we report the use of a ds-DNA probe with multi operation sites of restriction proteins in the middle sequence to investigate DNA-protein sequence-specific interactions including methylation. We arranged EcoR I site and Rsa I site on the same duplex DNA probe to fabricate ds-DNA arrays. We used the ds-DNA arrays to study DNA-restriction enzyme reactions before and after duplex DNA methylation under different probe concentration and reaction time conditions. Our results indicated that the ds-DNA arrays can be further biochemically modified and made accessible for interactions between DNAs and proteins in complex multi-step gene-regulation processes.
Introduction
A major pursuit in biological research is to understand how cells maintain normal cellular homeostasis and how they behave in an intricately controlled manner in response to their surroundings. DNA-proteins sequence-specific interactions play important roles in regulating cellular processes such as transcription [1], recombination [2], restriction [3], replication [4] and DNA-drugs interaction [5,6]. Several methods have been developed to analyze the DNA-protein sequence-specific interactions, which are mainly gel-shift assays [7,8] and DNase I foot-printing assays [9]. However, they are not only laborious, time-consuming and incapable of providing highly parallel analysis, but also they are not suitable for analyzing the complex multi-step protein-DNA interactions.
Oligonucleotide arrays or DNA arrays have provided a platform for high-throughput detection of biomolecules and for analyzing the interaction between biological molecules [10,11,12,13], and now are beginning to be used in detecting DNA-binding proteins [14,15,16,17]. Most DNA arrays are made of ssDNA, and recognize the target DNA through hybridization. Unlike arrays used for gene resequencing, a new type of DNA arrays, double-stranded DNA (ds-DNA) arrays should be fabricated for detecting sequence-specific regulatory DNA-binding proteins. Preliminary studies of double-stranded DNA arrays suggested that these ds-DNA arrays are well suited for the analysis of DNA–protein interactions, particularly for the discovery of the sequences recognized by transcription factors and the quantitative assessment of those important interactions. Bulyk was the first to convert single-stranded to a double-stranded array to perform highly parallel investigations of DNA–protein interactions by synthesizing a constant sequence at every position on an array and then annealing and enzymatically extending a complementary primer and he first used the ds-DNA arrays to study the DNA-protein sequence-specific interaction [14].
As we know, a number of DNA–protein interactions require that the DNA be biochemical modified in some way. For example, restriction-modification systems occur in many bacterial species, and constitute a defense mechanism against the introduction of foreign DNA into the cell [18,23]. Our group had also published two methods for fabrication of ds-DNA arrays and here we also use restriction enzymes as proteins to investigate DNA-proteins interactions, for restriction enzymes have very stringent sequence requirements, they have been used as model systems to study the sequence specificity of DNA–protein interactions [19,20,21,22]. We arranged EcoR I site and Rsa I recognition site on the same duplex DNA probe to fabricate ds-DNA arrays and labeled the ds-DNA probes during the ds-DNA arrays creation previously and then used the ds-DNA arrays to study DNA-restriction enzyme reactions before and after duplex DNA methylation under different probe concentration and reaction time conditions. Our results indicated that the ds-DNA arrays can be further biochemically modified and that the DNA is accessible for interaction with DNA-binding proteins in complex multi-step gene-regulation processes.
Results and Discussion
Restriction enzyme digestion
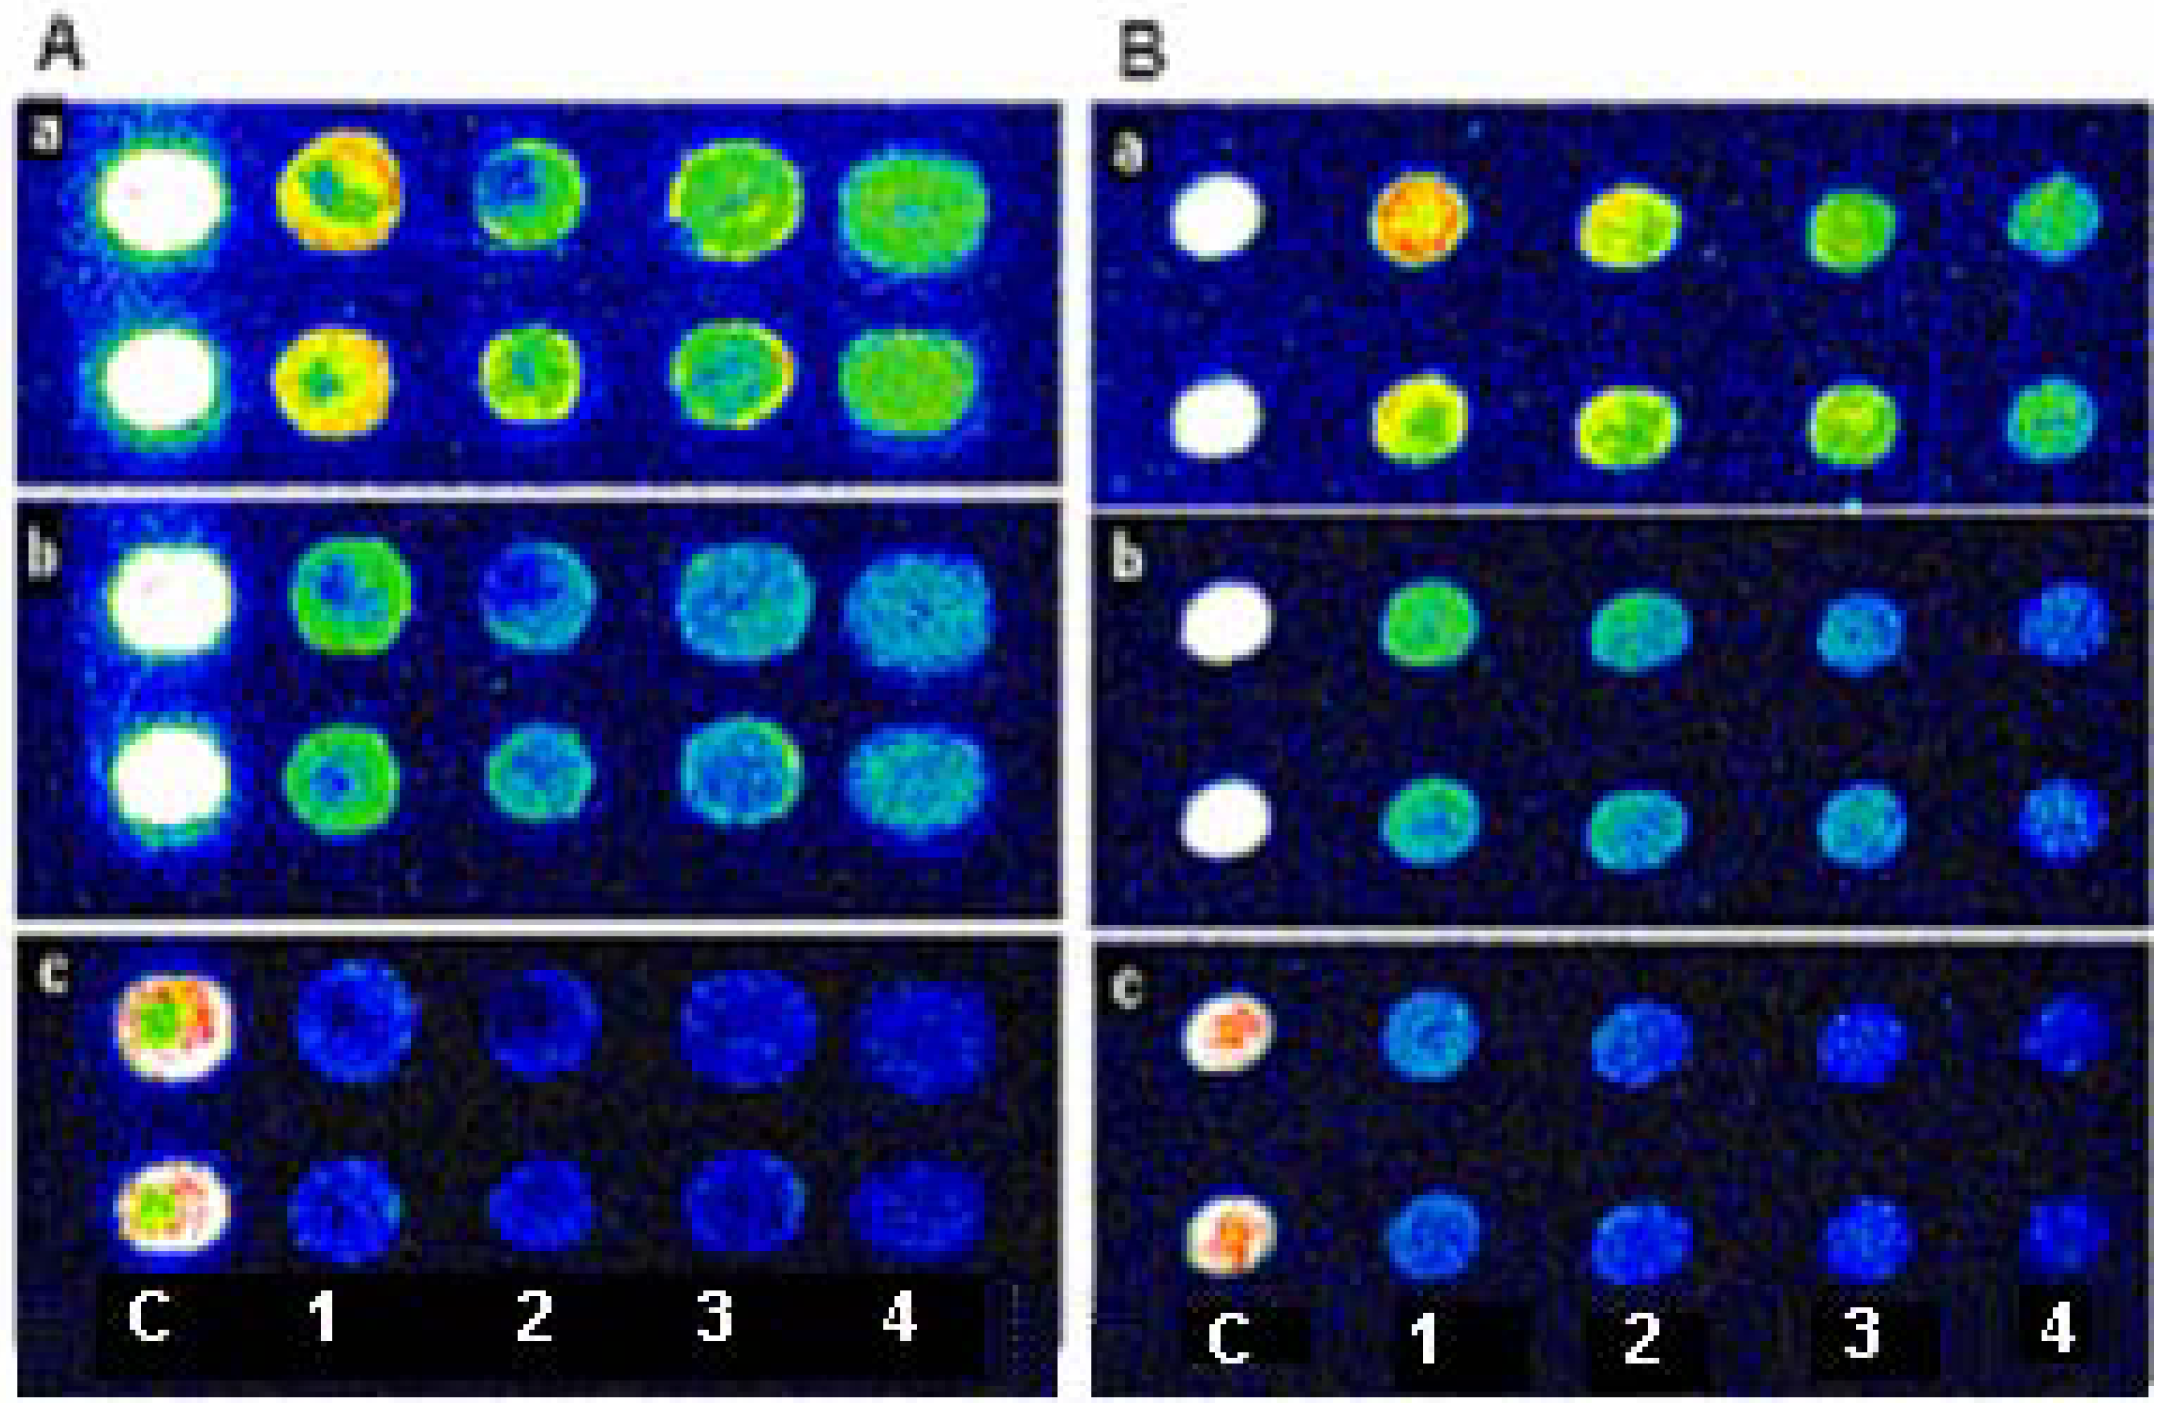
To verify and study the DNA/protein interactions on the fabricated ds-DNA arrays, ds-DNA arrays which had been inserted with Cy3-dUTP were used for digestion with EcoR I and Rsa I, respectively. The relative fluorescence intensity variations before and after endonuclease digestions are shown in Figure 1 and Figure 2, and summarized in Table 1 and Table 2.
Figure 1.
The images of EcoR I and Rsa I digestion on ds-DNA array. (A): the image of the ds-DNA array which created by insertion with Cy3-dUTP (a) digested by EcoR I under 1h(b) and 12h(c); (B): the image of ds-DNA array (a) digested by Rsa I under 1 h(b) and 12 h(c) digestion. The four different concentrations of Oligo II (C, 1, 2, 3 and 4 below the two images indicate control, 80 µM, 40 µM, 20 µM and 10 µM Oligo II, respectively.) were spotted onto the array.

Figure 2.
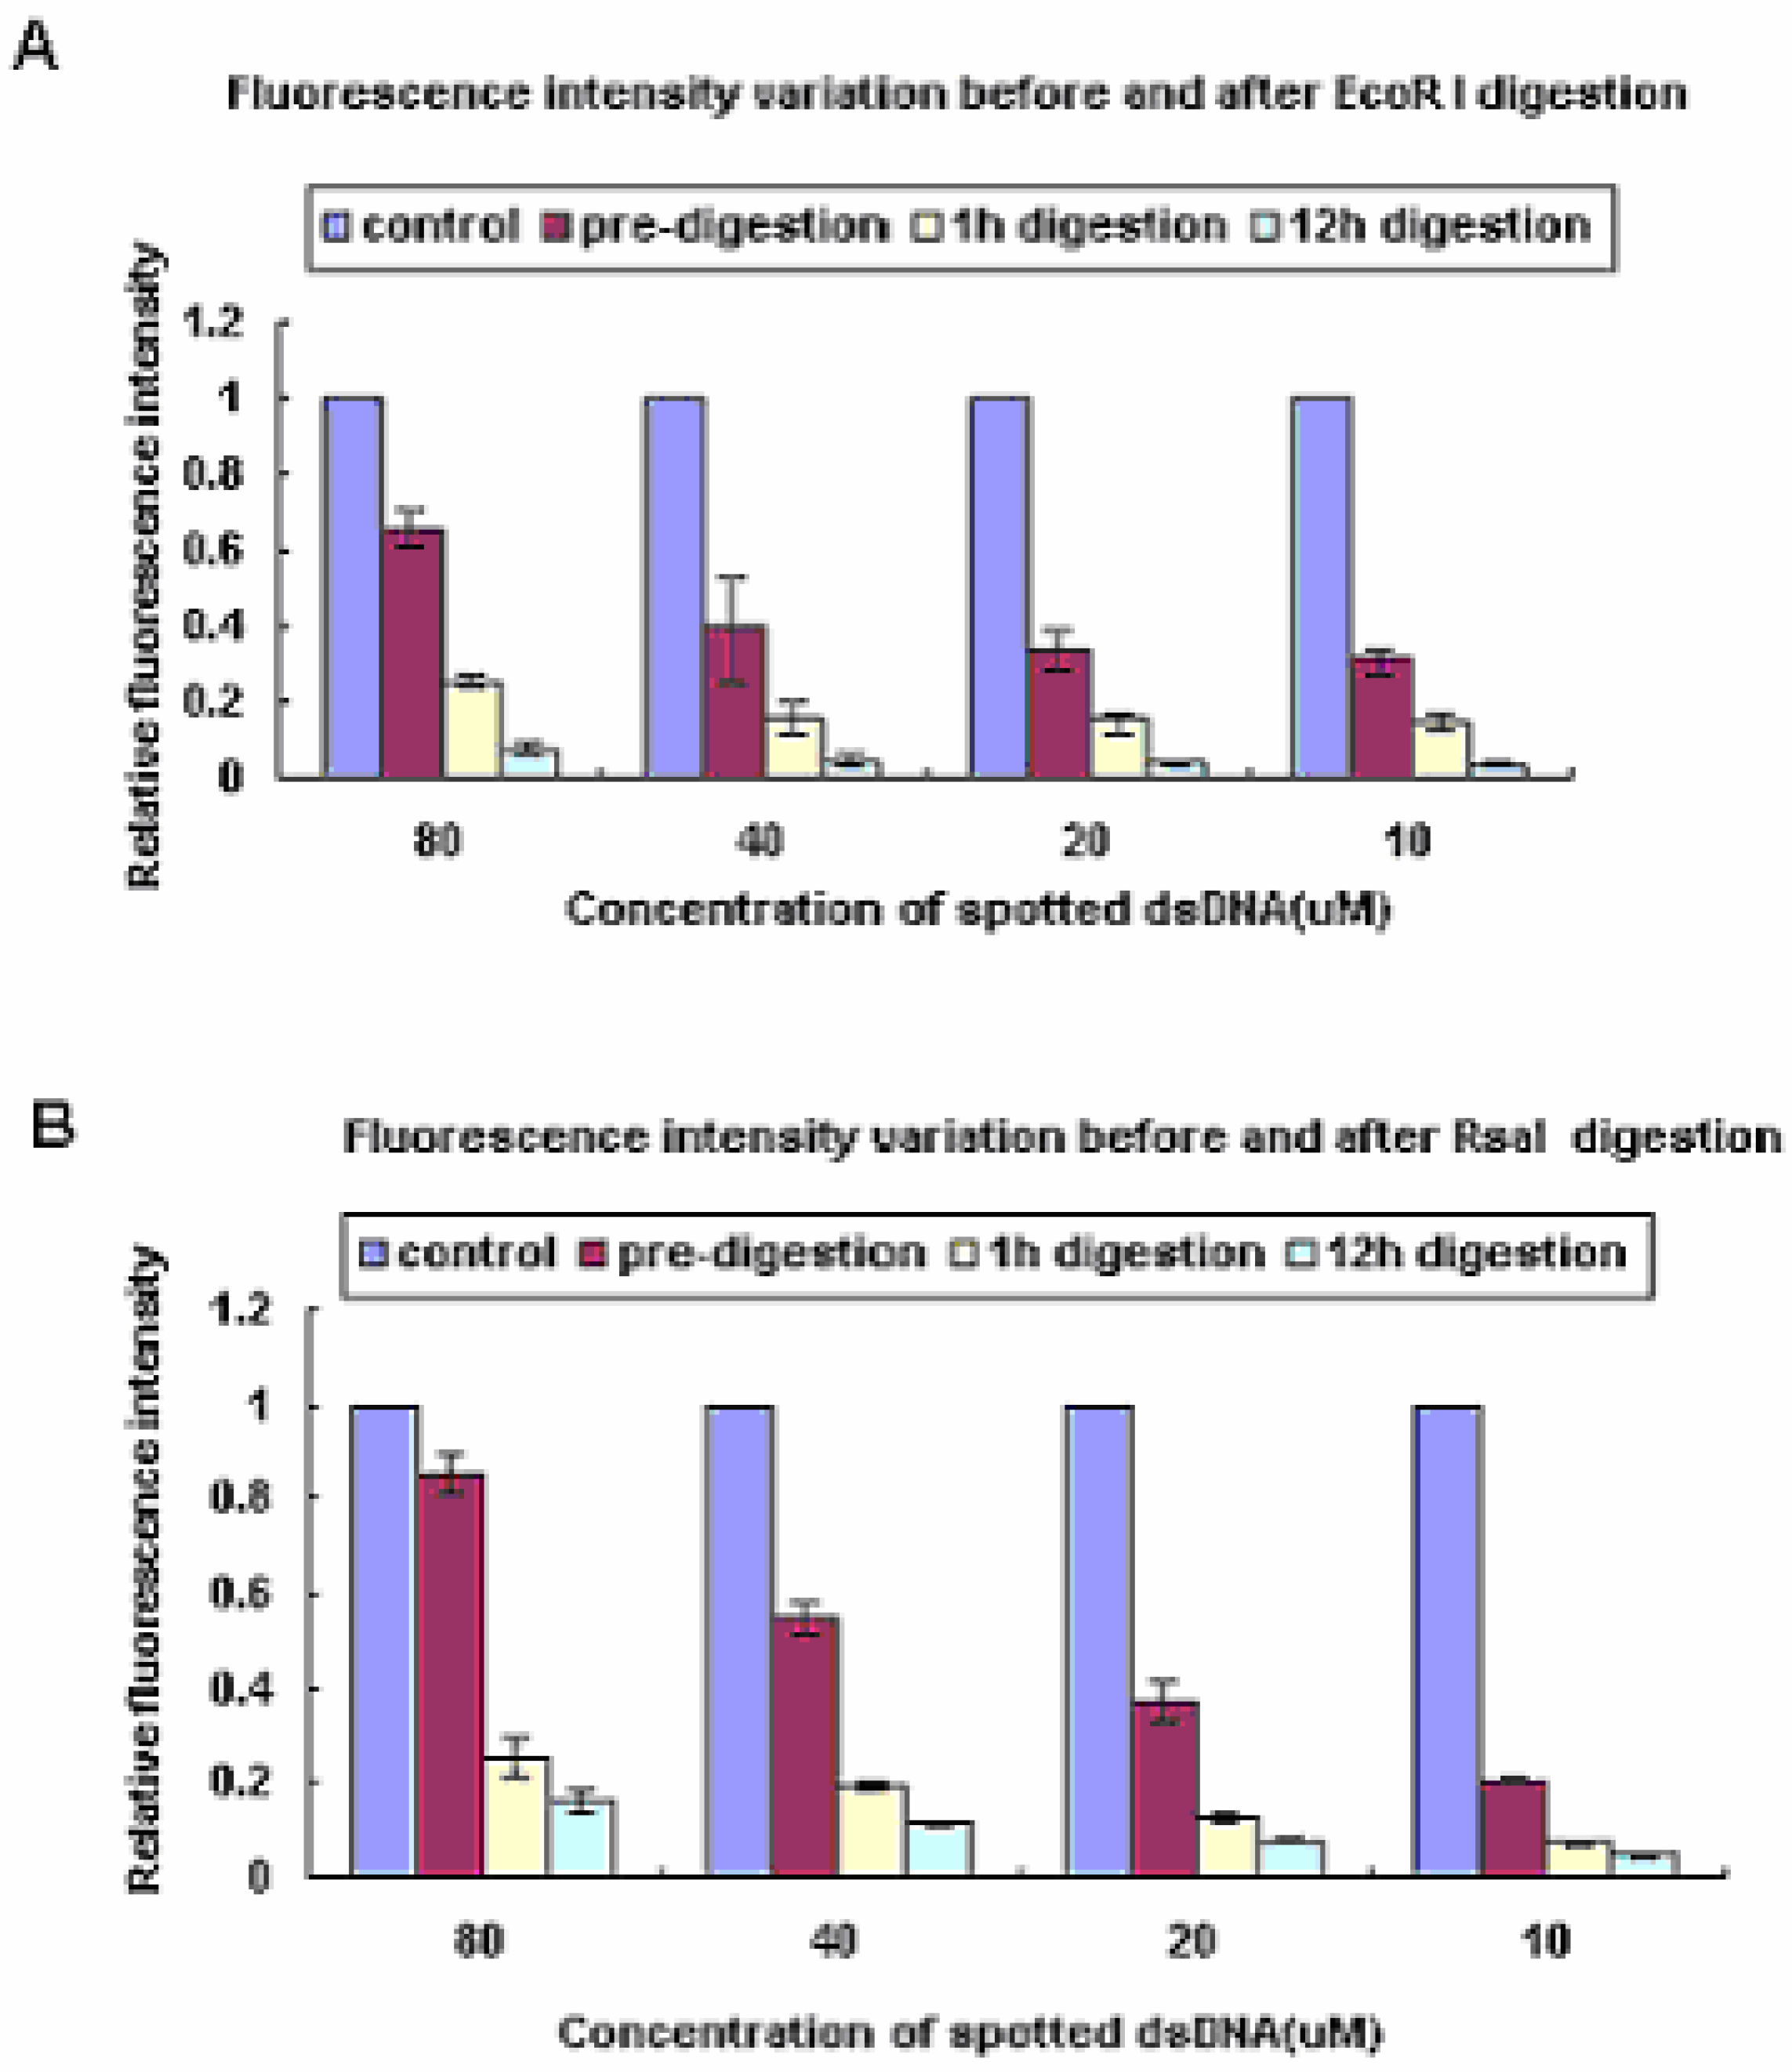
The relative fluorescence intensity variation before and after restriction enzyme digestion. Oligo I, which didn’t contain the two restriction enzyme recognition sites, was spotted as a control.
Figure 2.
The relative fluorescence intensity variation before and after restriction enzyme digestion. Oligo I, which didn’t contain the two restriction enzyme recognition sites, was spotted as a control.


| Control | 80µM | 40µM | 20µM | 10µM | |
|---|---|---|---|---|---|
| Pre-digestion | 1 | 0.65 | 0.40 | 0.35 | 0.22 |
| 1h-digestion | 1 | 0.25 | 0.17 | 0.15 | 0.14 |
| 12h-digestion | 1 | 0.07 | 0.06 | 0.05 | 0.05 |
| Control | 80µM | 40µM | 20µM | 10µM | |
|---|---|---|---|---|---|
| Pre-digestion | 1 | 0.85 | 0.53 | 0.39 | 0.26 |
| 1h-digestion | 1 | 0.26 | 0.16 | 0.11 | 0.07 |
| 12h-digestion | 1 | 0.15 | 0.11 | 0.07 | 0.05 |
To determine whether the digestion efficiency was affected by the concentrations of the ds-DNA probes and reaction time, four different concentrations (80 µM, 40 µM, 20 µM, 10 µM) and two different reaction times (1 h, 12 h) were tested in this experiment. To avoid the signal intensity loss caused by background decrease, we calculated the intensity ratios between experimental spots and controls to compare the signal change before and after incubation. As the data shown in Table 1 and Table 2 indicate, it is suggested that the fluorescence intensities decreased as the digestion time increased. On the other hand, the probe concentrations were not the main factors influencing the digestion efficiency. It indicated that the probes density below 80 µM was not congested enough to encumber the enzyme molecules’ movement.
Restriction enzyme digestion after the treatment of EcoR I methylase
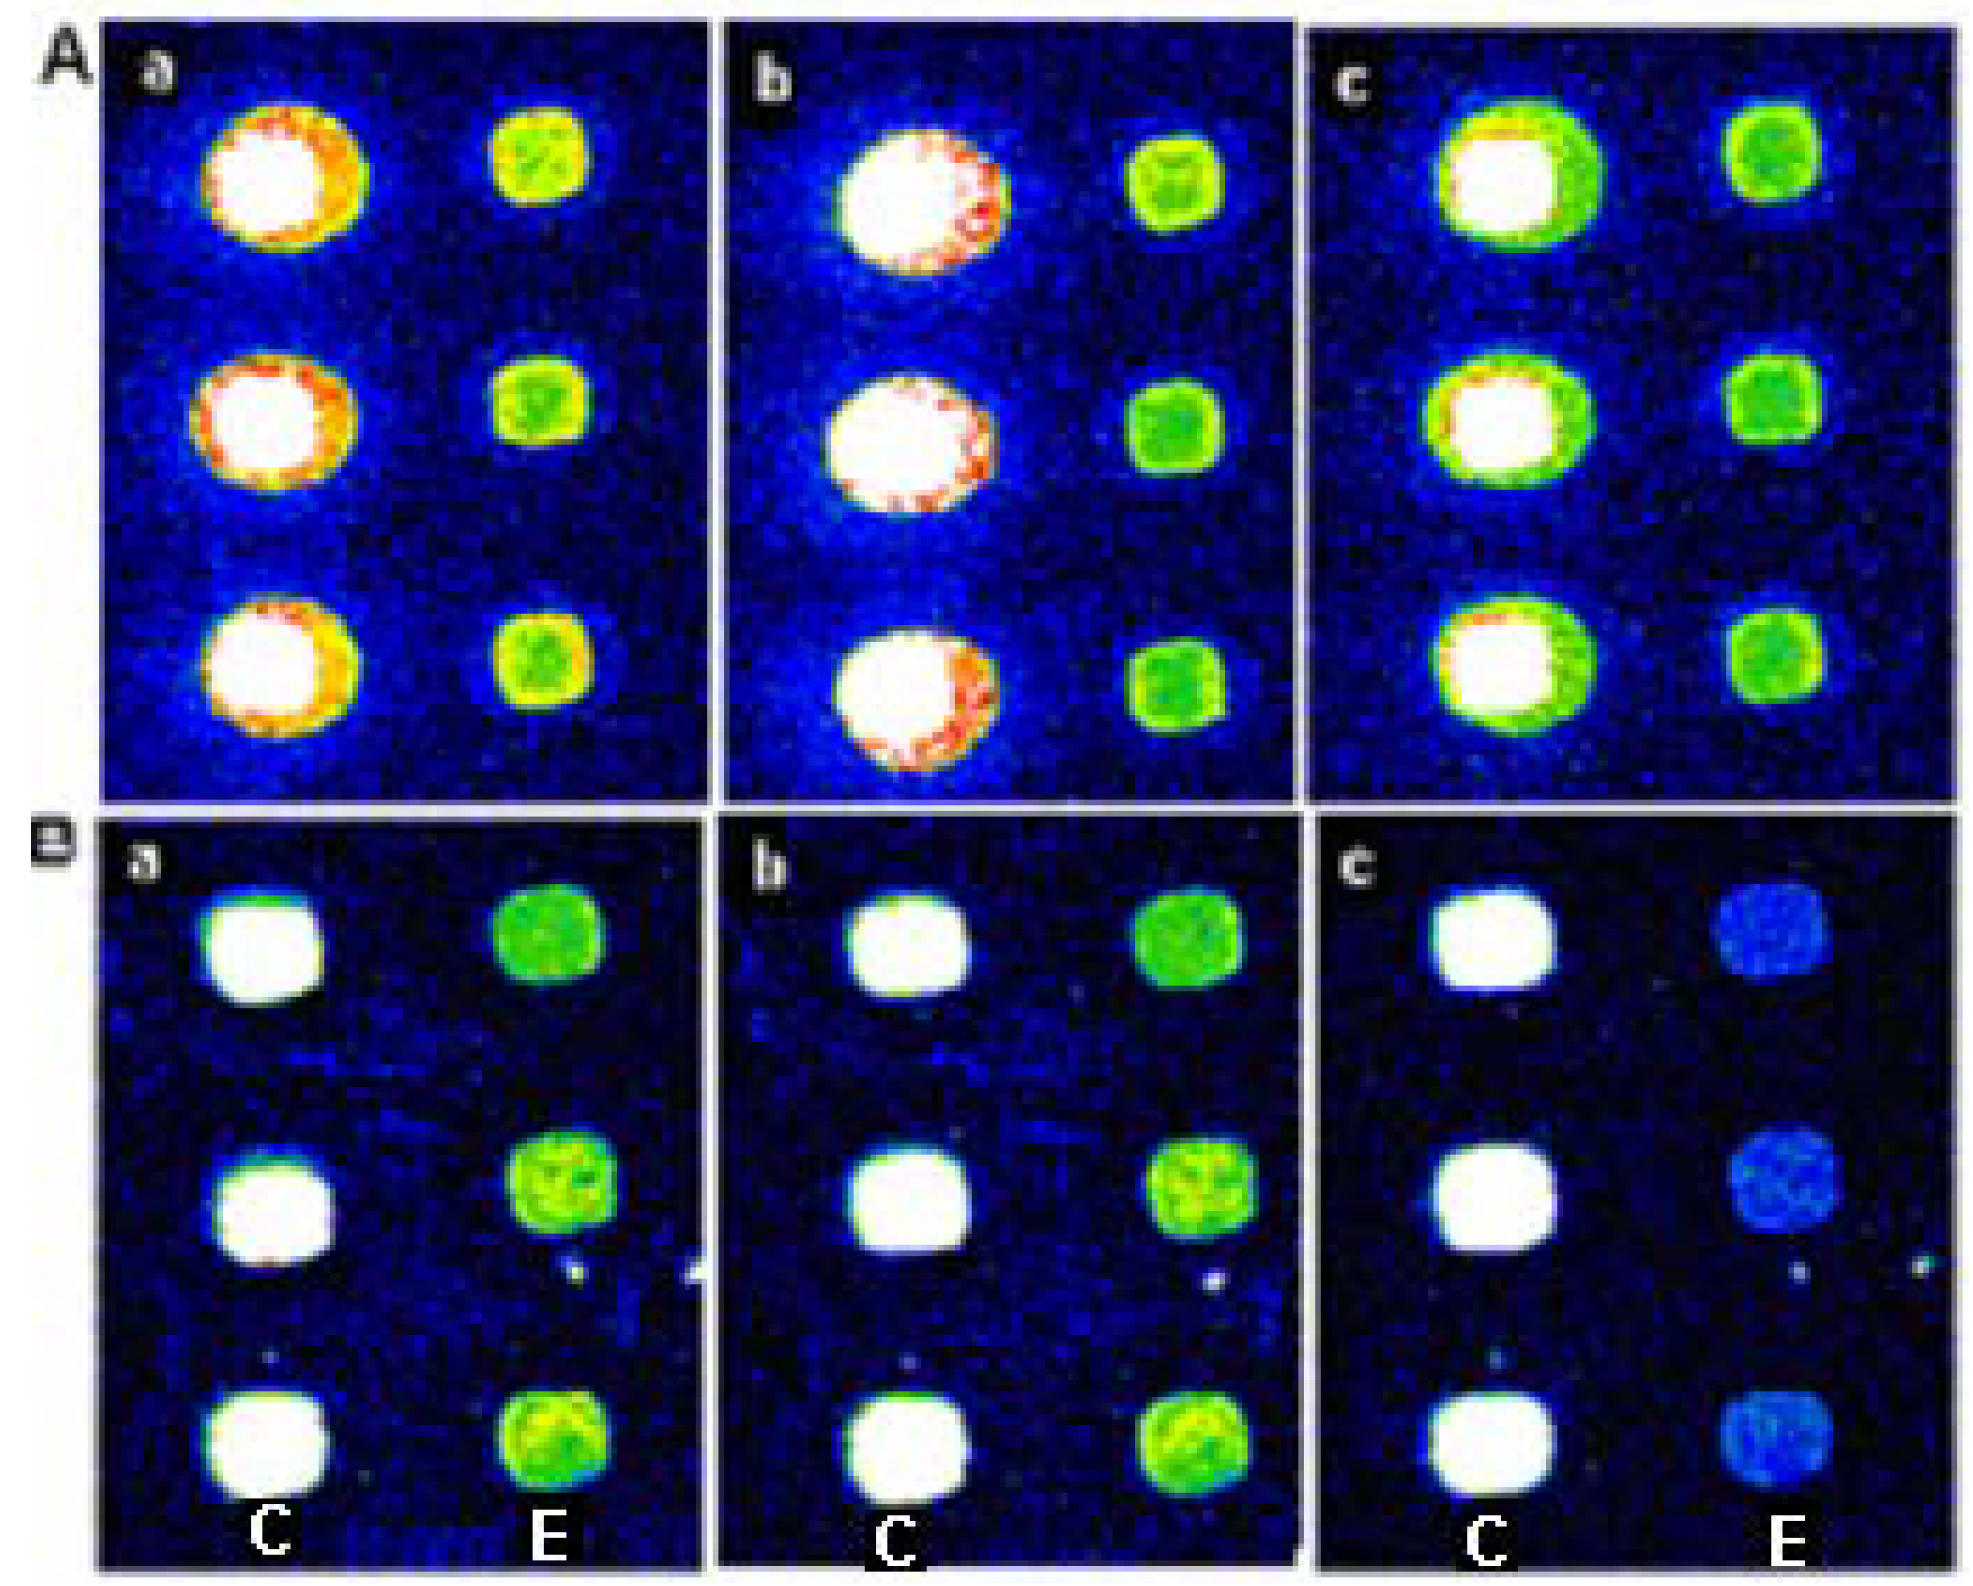
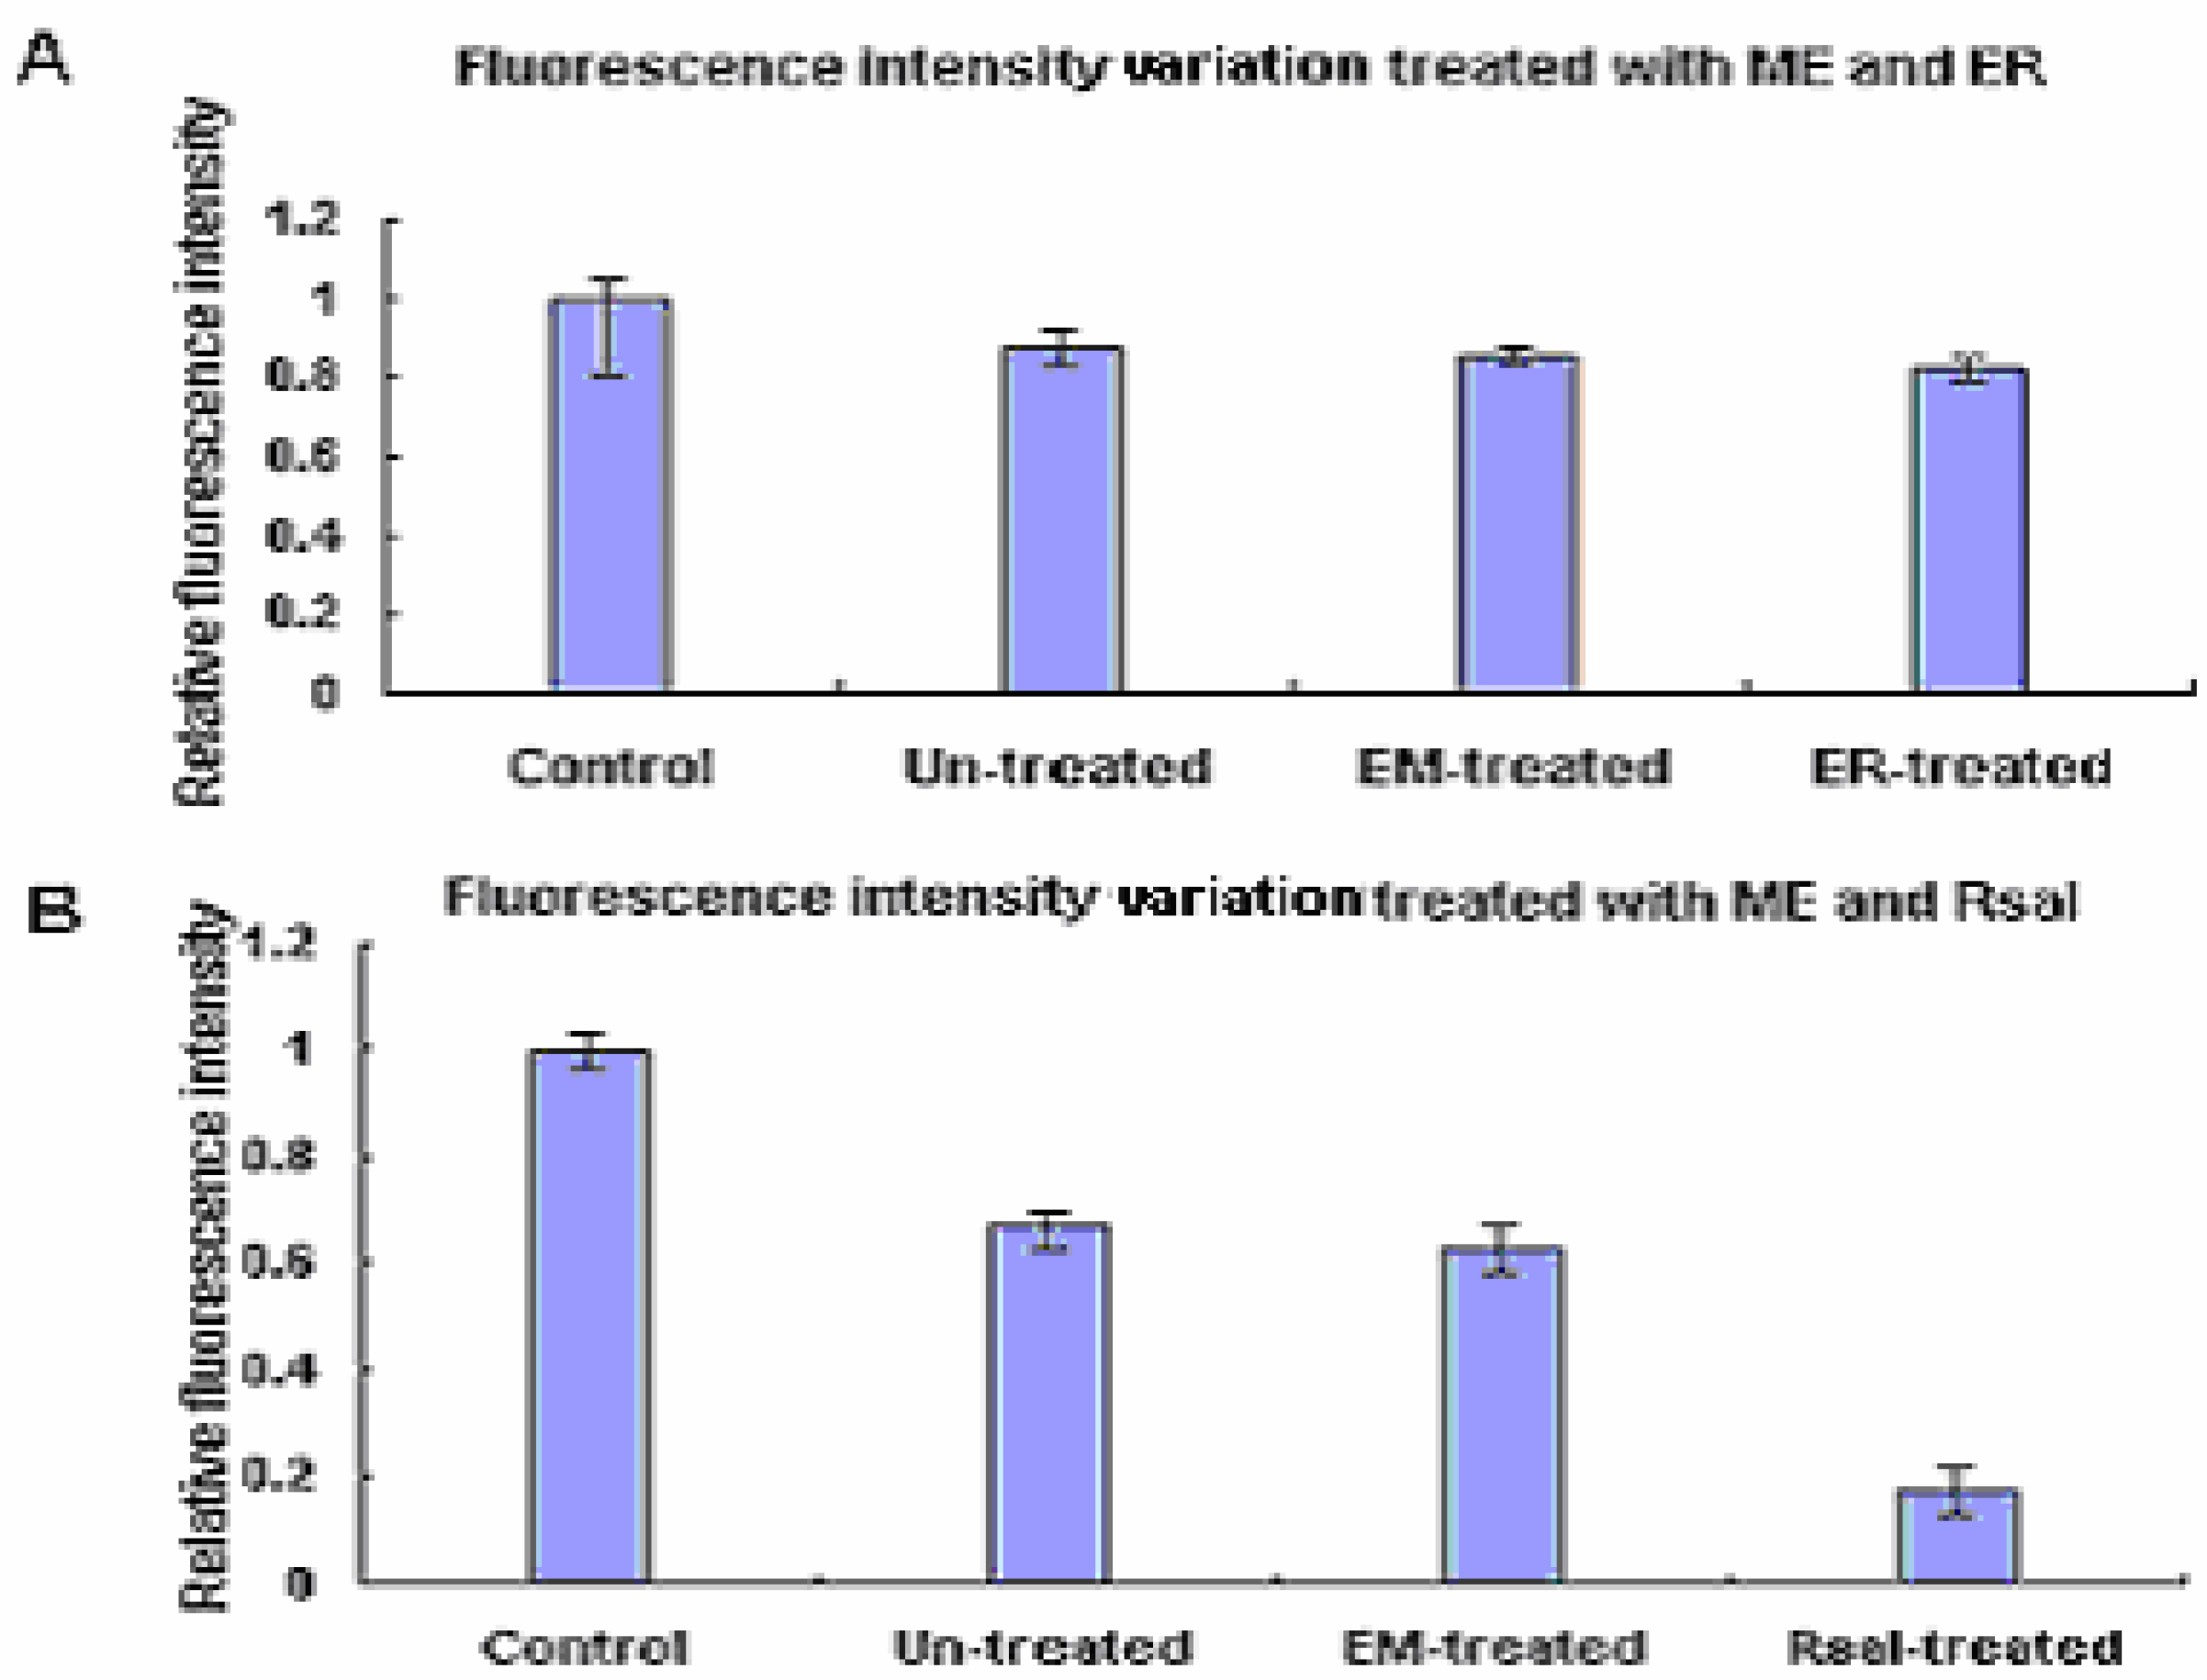
The ds-DNA arrays labeled with Cy3-dUTP were treated with EcoR I methylation enzyme before the two enzymes digestion. The results are shown in Figure 3 and Figure 4 and Table 3. The data showed that there were no significant signal losses after the EcoR I digestion of the ds-DNA array which had been previously treated with EcoR I methylation enzyme. However, the ds-DNA array after Rsa I incubation presented significant signal decrease when previously treated with EcoR I methylase.
Table 3.
The ratios between experiment spots and controls of Restriction enzymes digestion after the treatment of EcoR I methylase
| Control | Un-treated | EM*-treated | RE*-treated | |
|---|---|---|---|---|
| EcoR I digestion | 1 | 0.85 | 0.84 | 0.82 |
| Rsa I digestion | 1 | 0.65 | 0.62 | 0.19 |
*EM and RE refer to EcoR I methylase and Restriction enzyme respectively.
Figure 3.
The images of array one digested by EcoR I and Rsa I after methylation. (A): Images of array one which created by inserted Cy3-dUTP (a) was treated by EcoR I methylation enzyme (b) and then by EcoR I (c); (B): Images of array one which created by inserted Cy3-dUTP (a) was treated by EcoR I methylation enzyme (b) and then by Rsa I (c). (C and E below the images indicate Control probe and Oligo I, respectively)

Figure 4.
The fluorescence intensity variation of EcoR I and Rsa I digestion on the same array after methylation. EM indicated methylation enzyme and ER indicated EcoR I.
Figure 4.
The fluorescence intensity variation of EcoR I and Rsa I digestion on the same array after methylation. EM indicated methylation enzyme and ER indicated EcoR I.

Conclusions
There are Restriction Modification (RM) systems which are species/strain specific, and they only allow the survival of DNA received from a like species or strain having the same RM system [18,23]. This combination of a specific methylase and endonuclease functioned as a type of immune system for individual bacterial strains, protecting them from infection by foreign DNA. In any cell with a RM system, both the restriction and modification enzymes have the same sequence specificity. The EcoR I endonuclease within the same bacteria will not cleave the methylated DNA. Foreign viral DNA, which is not methylated at the sequence "GAATTC" will therefore be recognized as "foreign" DNA and will be cleaved by the EcoR1 endonuclease [23]. Our ds-DNA array platform would be useful in studying the efficiency and influence factors in this kind of complex RM systems.
In summary, we anticipate that double-stranded DNA arrays designed in various formats will have broad applications in studying protein-DNA interactions, including inhibitors/activators of sequence specific transcription factors, or synergy among transcription regulators. We also anticipate that ds-DNA arrays will be very effective substitutes for many tedious protein-DNA interaction assays currently used in the field, such as gel mobility shift assays, filter binding assays, etc.
Acknowledgements
This work was supported by the projects 60223002 and 60341002 of the National Natural Science Foundation of China, and also the grant 2002AA2Z2041 from National High Tech Program.
Experimental
General
Aminosilane glass slide were obtained from Dako. Glutaraldehyde (50% water solution) was purchased from Amresco. Endonucleases (EcoR I, Rsa I) and EcoR I methylase were obtained from New England BioLabs. Sodium borohydride, SDS (Sodium dodecyl sulfate), methanol, acetone and buffer components were all purchased as ACS grade reagents from Sigma Chemical Company. All the oligonucleotide probes were dissolved in 0.1mol/L Na2CO3-NaHCO3 buffer (30% 0.1 M Na2CO3 with 70% 0.1 M NaHCO3, pH 9.5 at RT). Deionized distilled water was purified by Milli-Q® (Millipore Corp.). 20×SSC buffer (Saline-Sodium Citrate buffer) was prepared as follow: NaCl (35.06 g) and sodium citrate (17.64 g) were dissolved in deionized distilled water (180 mL); the pH was adjusted to 7.0 with NaOH, the solution was made up to 200mL and then autoclaved before use. To use 20×SSC, it was simply diluted with an appropriate amount of distilled/deionized water. 0.1M PBS (phosphate-buffered saline) was prepared as follow: NaCl (8 g), KCl (0.2 g), Na2HPO4 (1.44 g) and KH2PO4 (0.24 g) were dissolved deionized distilled water (800 mL); the pH was modified with HCl to 7.4, and the solution was made up to 1000 mL and autoclaved before use. All the arrays used in this research were scanned by using a ScanArray® Lite instrument (Packard Biochip Technologies) in the Cy3 channel at 85% laser power, 80% PMT gain, 5 µm resolution.
The layout of the ds-DNA microarray fabrication
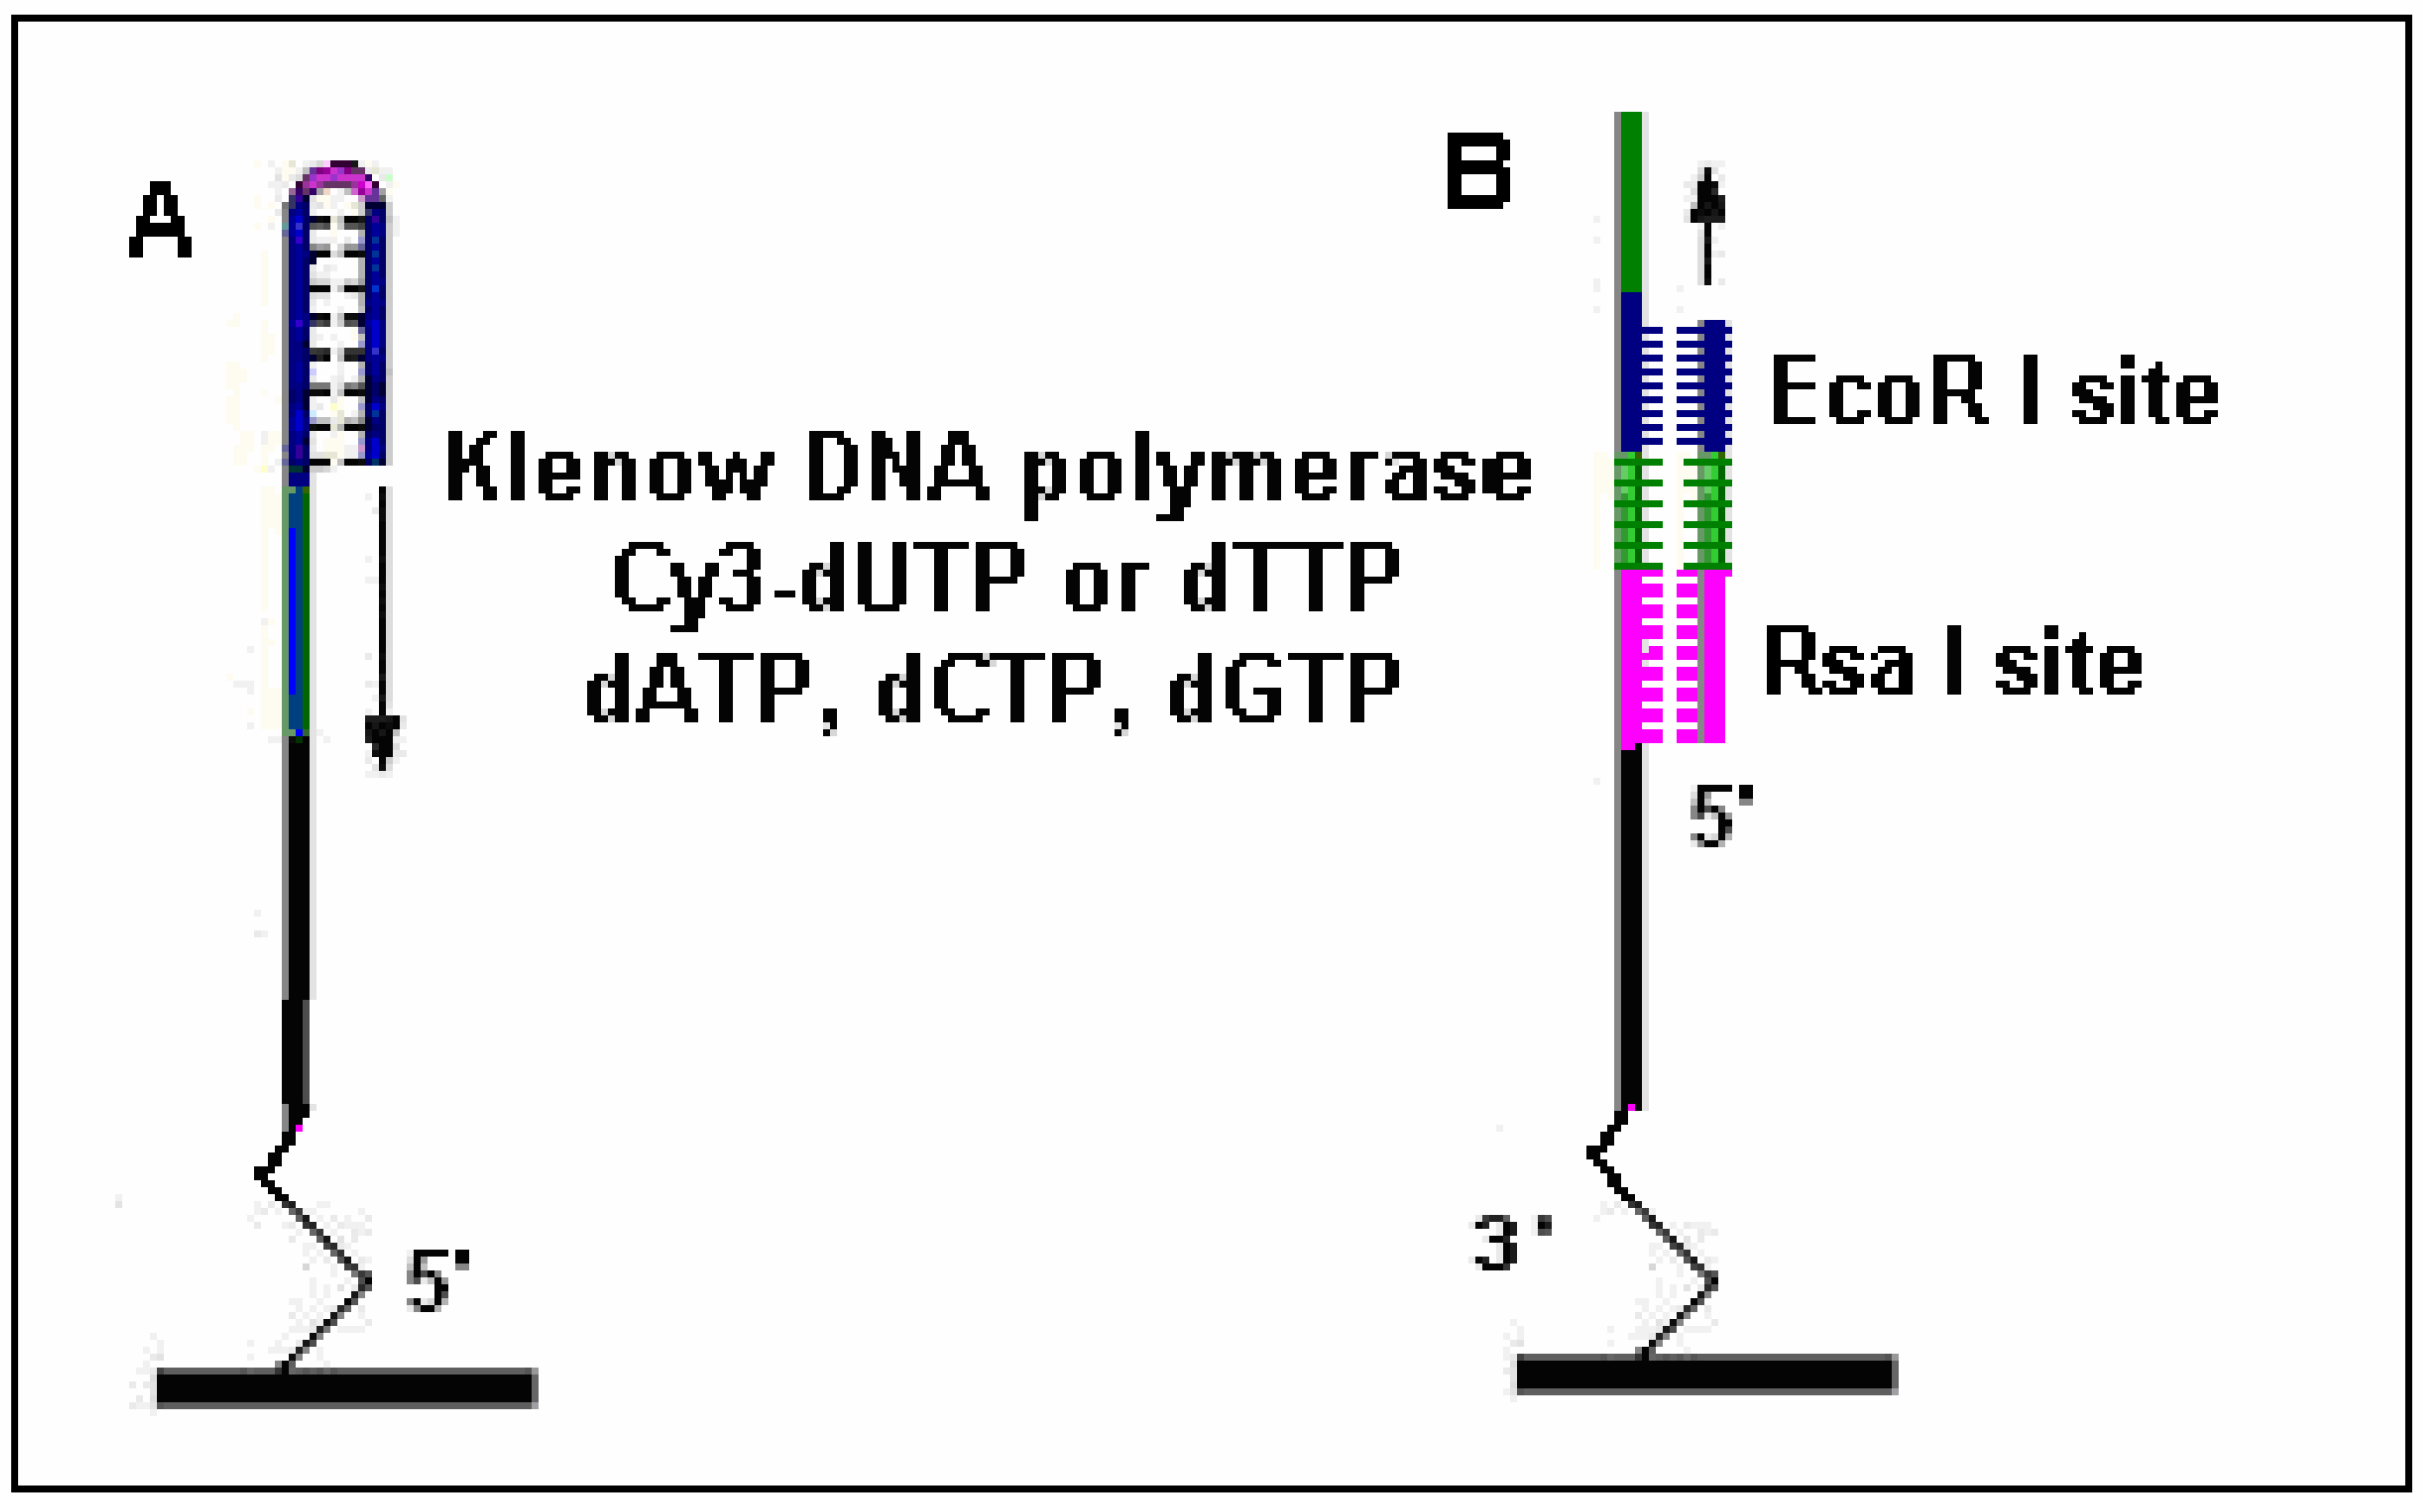
The two methods used to fabricate ds-DNA array are described in Figure 5. For method one, we firstly chemically synthesized one special single-stranded oligonucleotide as control which contained two reverse self-complementary sequences at its 3’end and an overhang sequence at its 5’ end, then spotted the single-stranded oligonucleotide on chemically derived glass surface by microarrayer. After the spotted single-stranded oligonucleotide was anchored on the glass surface by the 5’end, two reverse self-complementary DNA sequences were annealed to form a short double-stranded hairpin structure with a free 3’ hydroxyl end. Finally, the free 3’ end hydroxyl of the hairpin structure was enzymatically extended on the template of the remaining single-stranded overhang sequence. For method two, we first spotted a single-stranded oligonucleotide which contained two restriction enzyme operation sites onto glass and then annealed it with its complementary oligonucleotide. Finally, we labeled all the probes by DNA polymerase with Cy3-dUTP.
Figure 5.
Methods used to manufacture ds-DNA arrays. A: Oligo I could be self-hybridized at the hairpins and elongated as control; B: Oligo II was spotted onto glass through the 3’-NH2 and annealed with Oligo III to receive an elongation primer. The two probes were labeled by DNA polymerase with Cy3-dUTP.

Preparation of oligonucleotides
Three kinds of special single-stranded oligonucleotides chemically synthesized by Shengyou Inc. (Shanghai, China) were used for manufacturing ds-DNA arrays (summarized in Table 5). Oligo I which didn’t contain any restriction enzymes sites was designed with two reverse self-complementary sequences at its 3’ end. Oligo II which linked with an –NH2 at the 3’ end was synthesized to contain both an Rsa I (5’…GTAC…3’) and an EcoR I (5’…GAATTC…3’) binding sites in the middle sequence. Oigo III was the part complementary sequence of Oligo II.
| Name | Sequence | Length (nt) |
|---|---|---|
| Oligo I | 5’…NH2-TTTTTTGTTGCATTTCCGGGTTTGGCAAGCTTTTAAGCTT… 3’ | 40 |
| Oligo II | 3’…NH2-TTTTTCTCCCCTGAAAGGG  TATA TATA  GCTTTTATTTATTAT…5’ GCTTTTATTTATTAT…5’ | 44 |
| Oligo III | 5’…GAG GGGACTTT CCC  ATAT ATAT  CG…3’ CG…3’ | 26 |
The blocked area indicates the endonuclease recognition site.
Preparation of single-stranded DNA (ssDNA) arrays
Aminosilane-derivatized glass slides were cleaned with deionized distilled water and incubated in 5% glutaraldehyde in 0.01 M PBS, pH 7.4, for 2 h. Then the slides were thoroughly washed twice with methanol, acetone and deionized distilled water, and dried. The 80 µM Oligo I was spotted on the slides as a control by using an arrayer (Cartesian5500, Cartesian) and Oligo II at the 4 different concentrations (80 µM, 40 µM, 20 µM, 10 µM) was spotted on the same glass. After printing, the slides were incubated in a moist chamber at 37 ºC for at least 1 h and then in sodium borohydride solution (0.5 g NaBH4 in 200 mL sterile water plus 4 mL 3 M sodium acetate, pH 5.2) for 30 min, then rinsed with 2×SSC, 0.5% SDS for 10 min and sterile water for 10 min, dried and stored at 4 ºC.
Fabricating double-stranded DNA (ds-DNA) arrays
The slides were boiled for 10min and then Oligo III (25 µL, added as an extension primer), which was dissolved in hybridization buffer (10×SSC, 0.2% SDS, 50% formamide, 100µg/mL sheared Salmon Sperm DNA) at a concentration of 100 nM was annealed with the immobilized Oligo II array in a moist incubation chamber at 55 ºC for 1 h, then the slides were rinsed with 2×SSC, 0.5% SDS for 10 min and sterile water for 10 min and dried. After that, the 25 µL elongation system included 1×nick translation buffer, 4 µM dATP, 4 µM dCTP, 4 µM dGTP, 4 µM dTTP or 0.02 µL Cy3-dUTP (Amersham Pharmacia Biotech, UK), 3U Klenow DNA polymerase I (Amersham Pharmacia Biotech, UK) was added onto the slides and the reaction was performed at 37 ºC for 1 h. Subsequently the slides were rinsed with 2×SSC/0.5%SDS and deionized distilled water, and then dried.
Digested ds-DNA arrays with restriction enzymes
After the fabrication of the ds-DNA arrays, two slides of the ds-DNA arrays labeled with Cy3-dUTP were digested by endonuclease, respectively, one by Rsa I and another by EcoR I. The 20 µL reaction systems were added onto the slides and the digestions were performed at 37 ºC. After every reaction, the arrays were rinsed sequentially with 2×SSC/0.5%SDS, 0.2×SSC/0.5%SDS and then deionized distilled water, and dried. All the arrays were first digested for 1 h, scanned, and then treated for another 12 h with the same endonuclease and scanned again. The fluorescence loss was detected with the ScanArray®Lite under the same conditions. The Rsa I (1×RE buffer, 2 µg Acetylated BSA, 5U Restriction Rsa I Enzyme) and EcoR I (1×RE buffer, 2 µg Acetylated BSA, 5U Restriction EcoR I Enzyme) reaction systems were applied.
Digested ds-DNA arrays by EcoR I and Rsa I after the treatment of EcoR I methylase
Two ds-DNA arrays which had been labeled were treated with EcoR I methylase. The reaction system included 1×reaction buffer, 80 µM S-adenosylmethionine (SAM, 32 mM, 10% ethanol in 5 mM H2SO4), 0.2U/µL EcoR I methylase and performed at 37 ºC for 1h. After the reaction, the arrays were rinsed successively with 2×SSC/0.5%SDS, 0.2×SSC/0.5%SDS, and deionized distilled water, and then dried. After the scanning, one array was digested by Rsa I and another by EcoR I for 12 h, and then the two slides were scanned under the same conditions.
References
- Pabo, C.O.; Sauer, R.T. Transcription factors: structural families and principles of DNA recognition. Annu. Rev. Biochem. 1992, 61, 1053–1095. [Google Scholar] [PubMed]
- Craig, N.L. The mechanism of conservative site-specific recombination. Annu. Rev. Genet. 1988, 22, 77–105. [Google Scholar] [PubMed]
- Pingoud, A.; Jeltsch, A. Recognition and cleavage of DNA by type-II restriction endonucleases. Eur. J. Biochem. 1997, 246, 1–22. [Google Scholar] [PubMed]
- Margulies, C.; Kaguni, J.M. Ordered and sequential binding of DNA protein to oriC, the chromosomal origin of Escherichia coli. J. Biol. Chem. 1996, 271, 17035–17040. [Google Scholar] [PubMed]
- Brazil, M. Getting stuck in DNA-binding drugs. Nature 2002, 1, 9. [Google Scholar]
- Chaires, J.B. Drug-DNA interaction. Curr. Opin. Struct. Biol. 1998, 8, 314–320. [Google Scholar] [CrossRef]
- Jansen, C.; Gronenborn, A.M.; Clore, G.M. The binding of the cyclic AMP receptor protein to synthetic DNA sites containing permutations in the consensus sequence TGTGA. Biochem. J. 1987, 246, 227–232. [Google Scholar] [PubMed]
- Ruscher, K.; Reuter, M.; Kupper, D.; Trendelenburg, G.; Dirnagl, U.; Meisel, A. A fluorescence based non-radioactive electrophoretic mobility shift assay. 2000, 78, 163–170. [Google Scholar]
- Galas, D.J.; Schmitz, A. DNase footprinting: a simple method for the detection of protein-DNA binding specificity. Nucleic Acid Res. 1978, 5, 3157–3170. [Google Scholar] [CrossRef]
- Lockhart, D.J.; Dong, H.; Byrne, M.C.; Follettie, M.T.; Gallo, M.V.; Chee, M.S.; Mittmann, M.; Wang, C.; Kobayashi, M.; Horton, H.; Brown, E.L. Expression monitoring by hybridization to high-density oligonucleotide arrays. Nat. Biotechnol. 1996, 14, 1675–1680. [Google Scholar] [CrossRef]
- Roth, F.P.; Hughes, J.D.; Estep, P.W.; Church, G.M. Finding DNA regulatory motifs within unaligned noncoding sequences clustered by whole-genome mRNA quantitation. Nat. Biotechnol. 1998, 16, 939–945. [Google Scholar] [CrossRef]
- Schena, M.; Shalon, D.; Davis, R.W.; Brown, P.O. Quantitative monitoring of gene expression patterns with a complementary DNA microarray. Science 1995, 270, 467–470. [Google Scholar] [CrossRef] [Green Version]
- Hou, P.; Ji, M.J.; Liu, Z.C.; Shen, J.X.; Cheng, L.; He, N.Y.; Lu, Z.H. A microarray to analyze methylation patterns of p16 ink4a gene 5’-cpg islands. Clin. Biochem. 2003, 36, 197–202. [Google Scholar] [CrossRef]
- Bulyk, M.L.; Gentalen, E.; Lockhart, D.J.; Church, G.M. Quantifying DNA-protein interactions by double-stranded DNA arrays. Nat. Biotechnol. 1999, 17, 573–577. [Google Scholar]
- Wang, J.K.; Bai, Y.F.; Li, T.X.; Lu, Z.H. DNA microarrays with unimolecular hairpin double-stranded DNA probes: fabrication and exploration of sequence-specific DNA/protein interactions. J. Biochem. Bioph. Meth. 2003, 55, 215–232. [Google Scholar]
- Wang, J.K.; Li, T.X.; Bai, Y.F.; Zhu, Y.; Lu, Z.H. Fabricating Unimolecular Double-stranded DNA Microarray on solid surface for probing DNA-protein Interactions. Molecules 2003, 8, 153–168. [Google Scholar]
- Wang, J.K.; Li, T.X.; Bai, Y.F.; Lu, Z.H. Evaluating the binding affinities of NF-kB P50 homodimer to the wild-type and single-nucleotide mutant Ig-kB sites by the unimolecular ds-DNA microarray. Anal. Biochem. 2003, 316, 192–201. [Google Scholar]
- Naito, T; Kusano, K; Kobayashi, I. Selfish behavior of restriction-modification systems. Science 1995, 267, 897–899. [Google Scholar] [PubMed]
- Polisky, B.; Greene, P.; Garfin, D.E.; McCarthy, B.J.; Goodman, H.M.; Boyer, H.W. Specificity of substrate recognition by the EcoRI restriction endonuclease. Proc. Natl. Acad. Sci. USA 1975, 72, 3310–3314. [Google Scholar] [PubMed]
- Thielking, V.; Alves, J.; Fliess, A.; Maass, G.; Pingoud, A. Accuracy of the EcoRI restriction endonuclease: binding and cleavage studies with oligodeoxynucleotide substrates containing degenerate recognition sequences. Biochem. 1990, 29, 4682–4691. [Google Scholar]
- Lesser, D.R.; Kurpiewski, M.R.; Jen-Jacobson, L. The energetic basis of specificity in the EcoRI endonuclease–DNA interaction. Science 1990, 250, 776–786. [Google Scholar] [PubMed]
- McClarin, J.A.; Frederick, C.A.; Wang, B.C.; Greene, P.; Boyer, H.W.; Grable, J.; Rosenberg, J.M. Structure of the DNA–EcoR I endonuclease recognition complex at 3 Ǻ resolution. Science 1986, 234, 1526–1540. [Google Scholar] [PubMed]
- Rubin, R.A.; Modrich, P. EcoR I Methylase: Physical and catalytic properties of the homogeneous enzyme. J. Biol. Chem. 1977, 252, 7265–7272. [Google Scholar] [PubMed]
© 2005 by MDPI (http://www.mdpi.org). Reproduction is permitted for noncommercial purposes.
Share and Cite
MDPI and ACS Style
Bai, Y.; Ge, Q.; Wang, J.; Li, T.; Liu, Q.; Lu, Z. Investigation of DNA-protein Sequence-Specific Interactions with a ds-DNA Array. Molecules 2005, 10, 417-426. https://doi.org/10.3390/10020417
AMA Style
Bai Y, Ge Q, Wang J, Li T, Liu Q, Lu Z. Investigation of DNA-protein Sequence-Specific Interactions with a ds-DNA Array. Molecules. 2005; 10(2):417-426. https://doi.org/10.3390/10020417
Chicago/Turabian StyleBai, Yunfei, Qinyu Ge, Jinke Wang, Tongxiang Li, Quanjun Liu, and Zuhong Lu. 2005. "Investigation of DNA-protein Sequence-Specific Interactions with a ds-DNA Array" Molecules 10, no. 2: 417-426. https://doi.org/10.3390/10020417