Introduction
Bile is a secretory and excretory fluid, which is secreted by the gall bladder into the intestine. Adult humans produce each day about 0.4 – 0.8 L of bile, which is a complex fluid containing water, inorganic compounds and a number of organic substances. Within the last fraction, lipids and bilirubin as well as different cholesterol and derivatives thereof were isolated. The earliest reliable data with regard to the composition of bile were presented years ago by Berzelius [
1], Freiherrn von Gorup-Besanez [
2] and Menzies [
3]. The first source for the isolation of bile salts was bile extract [
1,
2,
3]. In vertebrates, the two fundamental physiological functions of bile lie in the digestive nature of the bile fluid as well as being an excretory fluid [
4]. The presence in the bile fluid of bile salts, which are effective digestive detergents, promotes the digestion and absorption of lipids and fats or fat-soluble vitamins in the small intestine. Many waste products, including bile salts (which are not only digestive detergents but also end products of cholesterol metabolism), bilirubin (the end product of heme metabolism), cholesterol (derived from the synthesis and exceeding body needs) and heavy metals such as iron and copper (also derived from absorption exceeding body needs), are removed from the body by secretion into bile and eliminated via faeces [
5]. For drug elimination, the biliary secretion pathway presents an excretory route for lipophilic steroids and drug metabolites [
6]. Although every day large quantities of bile salts are secreted into the intestine, only moderate amounts are lost from the human body, because approximately 95 % of the bile salts delivered to the duodenum are reabsorbed into blood within the ileum. Based on this so-called enterohepatic circulation mechanism each bile salt molecule is “reused” about 20 times [
7].
The concentration of phospholipids in the bile is quite high. Its fraction consists mainly of phosphatidylcholine (PC), and in the presence of bile salts, mixed systems i.e. mixed vesicles, mixed micelles, depending on the lipid to detergent ratio, are formed [
8,
9]. It is described that the microdomains contained in the mixed micelles were able to solubilise cholesterol [
10,
11,
12,
13,
14]. An important aspect in the formation of mixed micelles lies in the fact that the mixed micelle association lowers the monomeric activity of bile salts and thus prevents the solubilisation and thus destruction and membranolytic effect of the apical membrane of the epithelial cells [
15,
16].
Table 1.
The concentration of bile salts in different body compartments of humans [
5,
8].
Table 1.
The concentration of bile salts in different body compartments of humans [5,8].
| Compartment | Concentration |
|---|
| Gall bladder | 10 – 50 mmol/L |
| Gut | ~4 – 20 mmol/L |
| Liver Canaliculi | ~5 mmol/L |
| Portal vein blood | 0.1 mmol/L |
| Peripheral blood | 5-20 μmol/L |
Species with a gall bladder, like humans, are able to further modify bile salts to e.g. taurocholic, chenodeoxycholic, glycocholic, taurochenodeoxycholic acids, or the bile salts can be metabolised by bacteria to lithocholic and ursodeoxycholic acids (for more details see [
17,
18]). A further function of the gall bladder is the storage and concentration of bile (up to five-fold) during the fasting state. The physiology, biosynthesis and bile acid metabolism, however, is quite complex and has been reviewed recently [
4,
5,
7]. The concentrations of bile salts in various body compartments are summarised in
Table 1.
The chemical structure of bile salts (
Figure 1A and
Figure 1B) is quite different, compared to the classical head-tail-detergents, where the hydrophilic head group and hydrophobic, flexible, hydrocarbon chains of the molecule are clearly separated (e.g. octyl glucoside (OG) or sodium dodecyl sulphate (SDS)) [
19,
20,
21]. Bile salts have a rigid framework due to the steroid nucleus. Bile salt molecules bear a hydrophobic surface, which is the convex side of the rigid steroid ring system, and a polar surface, composed of the hydroxyl groups, forming the concave side of the molecule (
Figure 1C). Because of the amphiphilic nature of bile salts they self-organise when they are transferred in an aqueous phase. The self-association is driven by the hydrophobic effect [
22,
23,
24]. The combination of the rigidity of the molecule nucleus and the unusual chemical structure induce an aggregation behaviour, which is quite different to head-tail-detergents with aliphatic chains [
23]. The dispersion of classical head-tail-detergents like OG or SDS in an aqueous phase induces spontaneously the aggregation of the monomer molecules into micelles. This happens above a specific detergent concentration denoted as the critical micelle concentration (
cmc) [
24]. For head-tail-detergents large aggregates are often formed.
Under physiological conditions (≈25 ºC, 300 mOsmol,
pH 7) the aggregation number of such micelles can range, e.g. for SDS, between 50 and 80 SDS monomers per micelle [
23,
25,
26,
27]. The size and shape of micelles and aggregation number is dependent on the environmental conditions like ionic strength,
pH, temperature etc. Bile salts, however, due to the more or less “planar” hydrophobic and planar hydrophilic structure of the molecules (see
Figure 1C), form much smaller micelles than the classical head-tail-detergents [
20,
23,
28]. For sodium cholate (NaC) and sodium deoxycholate (NaDC) the aggregation number at room temperature is between 4 – 6 molecules for NaC and higher for NaDC, with 7 – 12 molecules (these micelles are denoted as primary micelles) [
29,
30]. This property is not surprising, because the peculiar molecular structure of bile salts (
Figure 1) does not really allow the formation of larger aggregate structures in order to isolate the hydrophobic part of the molecule from the aqueous phase. Compared to the classical head-tail-detergent, where a clear and sharp-defined
cmc is detected, a well-defined
cmc for bile salts does not really exist. This involves the formation of micelles as a continuous self-association process with increasing the total detergent concentration,. At very high bile salt concentrations so-called secondary micelles are formed (see below).
Various models of bile salt aggregate structures have been discussed over the last 50 years. Three models have been proposed: primary micelles, which are formed at low detergent concentration, having a disk shaped structure with one or two bile salt layers (model I) [
31,
32,
33], and at higher detergent concentration, secondary micelles, where the aggregates are stabilised via hydrogen bondings between different primary micelles. Kawamura
et al. [
34] have proposed another model, where the aggregates form a disk shaped structure with a single bile salt layer (model II). In contrast, other results [
35,
36] suggest a helical structure (model III) with counter ions and water on the axis of a helix. Recently the results presented by Warren
et al. [
37], analysing the spontaneous bile salt aggregation based on molecular dynamic simulations, have discounted the “helix-model”. The results of their study revealed that the adoption of a disk shaped structure for bile salts is more likely.
Figure 1.
Chemical structure of the two bile salts: (A) sodium cholate (NaC) and (B) sodium deoxycholate (NaDC). Under physiological conditions (300 mOsmol, pH 7) bile salts are negatively charged. (C) Structural formula of sodium cholate showing the hydrophobic surface (indicated in red) and the hydrophilic parts (indicated in blue) of the molecule.
Various applications with bile salts have been reported [
38,
39,
40,
41,
42,
43]. Taminen and Kolekmainen [
44] have recently reviewed the potential of bile acids as building blocks for the formation of supra-molecular structures, which have been shown to possess molecular recognition properties. As an example bile acid-porphyrin conjugates are investigated with respect to their saccharide binding capacities [
45,
46,
47]. Other applications are described, especially in the field of protein biochemistry in order to use bile salts for the isolation of membrane bound proteins or other structures [
23,
41,
48,
49].
In the field of pharmaceutical sciences, bile salt micelles and derived mixed systems are intensively investigated, because of their potential as drug carrier systems [
39,
40,
41,
43,
50]. One advantage using such carrier systems is the increased drug solubility in the presence of bile salt micelles or mixed micelles (often formed with lipids) [
39,
40].
Various therapeutic drugs are commercialised as formulations containing bile salts, phospholipids and/or fatty acids. A commercial product with the trade name Valium
® MM [
41,
51] for i.v. application contains the tranquilizer diazepam, a 1,4-benzodiazepin derivative, “solubilised” in mixed micelles (MM). The formulation contains glycocholic acid and soy lecithin as well as benzyl alcohol (preservative), sodium bisulfite, sodium chloride (HCl and NaOH) and water for injection.
The reason why some commercial bile acid formulations contain lipids lies in the fact that the membranolytic activities of the detergents in the mixed system is strongly reduced, and thus the used detergents become less haemolytic [
15,
41]. On the other hand, membranolysis of bacterial membranes is a key strategy for the development of antimicrobial components [
52,
53]. The mechanism of membranolysis of e.g. amphiphilic peptide drugs is largely investigated in order to understand the concepts how to design the peptides and thus to generated highly potent antimicrobial drugs. However, it is also observed that the antimicrobial activity depends on the tested microorganisms and can cover the range from no antimicrobial activity up to very strong activity. One reason for this is the different lipid composition of the membrane of the microorganism [
8,
11,
12,
15], which strongly influences the membranolytic activity of detergents or peptides.
Therefore, this paper deals with the investigation of the membranolytic properties of two bile salts: sodium cholate (NaC) and sodium deoxycholate (NaDC) (
Figure 1A and
Figure 1B). The two main steps in membranolysis, the partitioning of the detergent in the membrane as well as the complete disruption and solubilisation of the membrane are investigated in more detail (see
Figure 2).
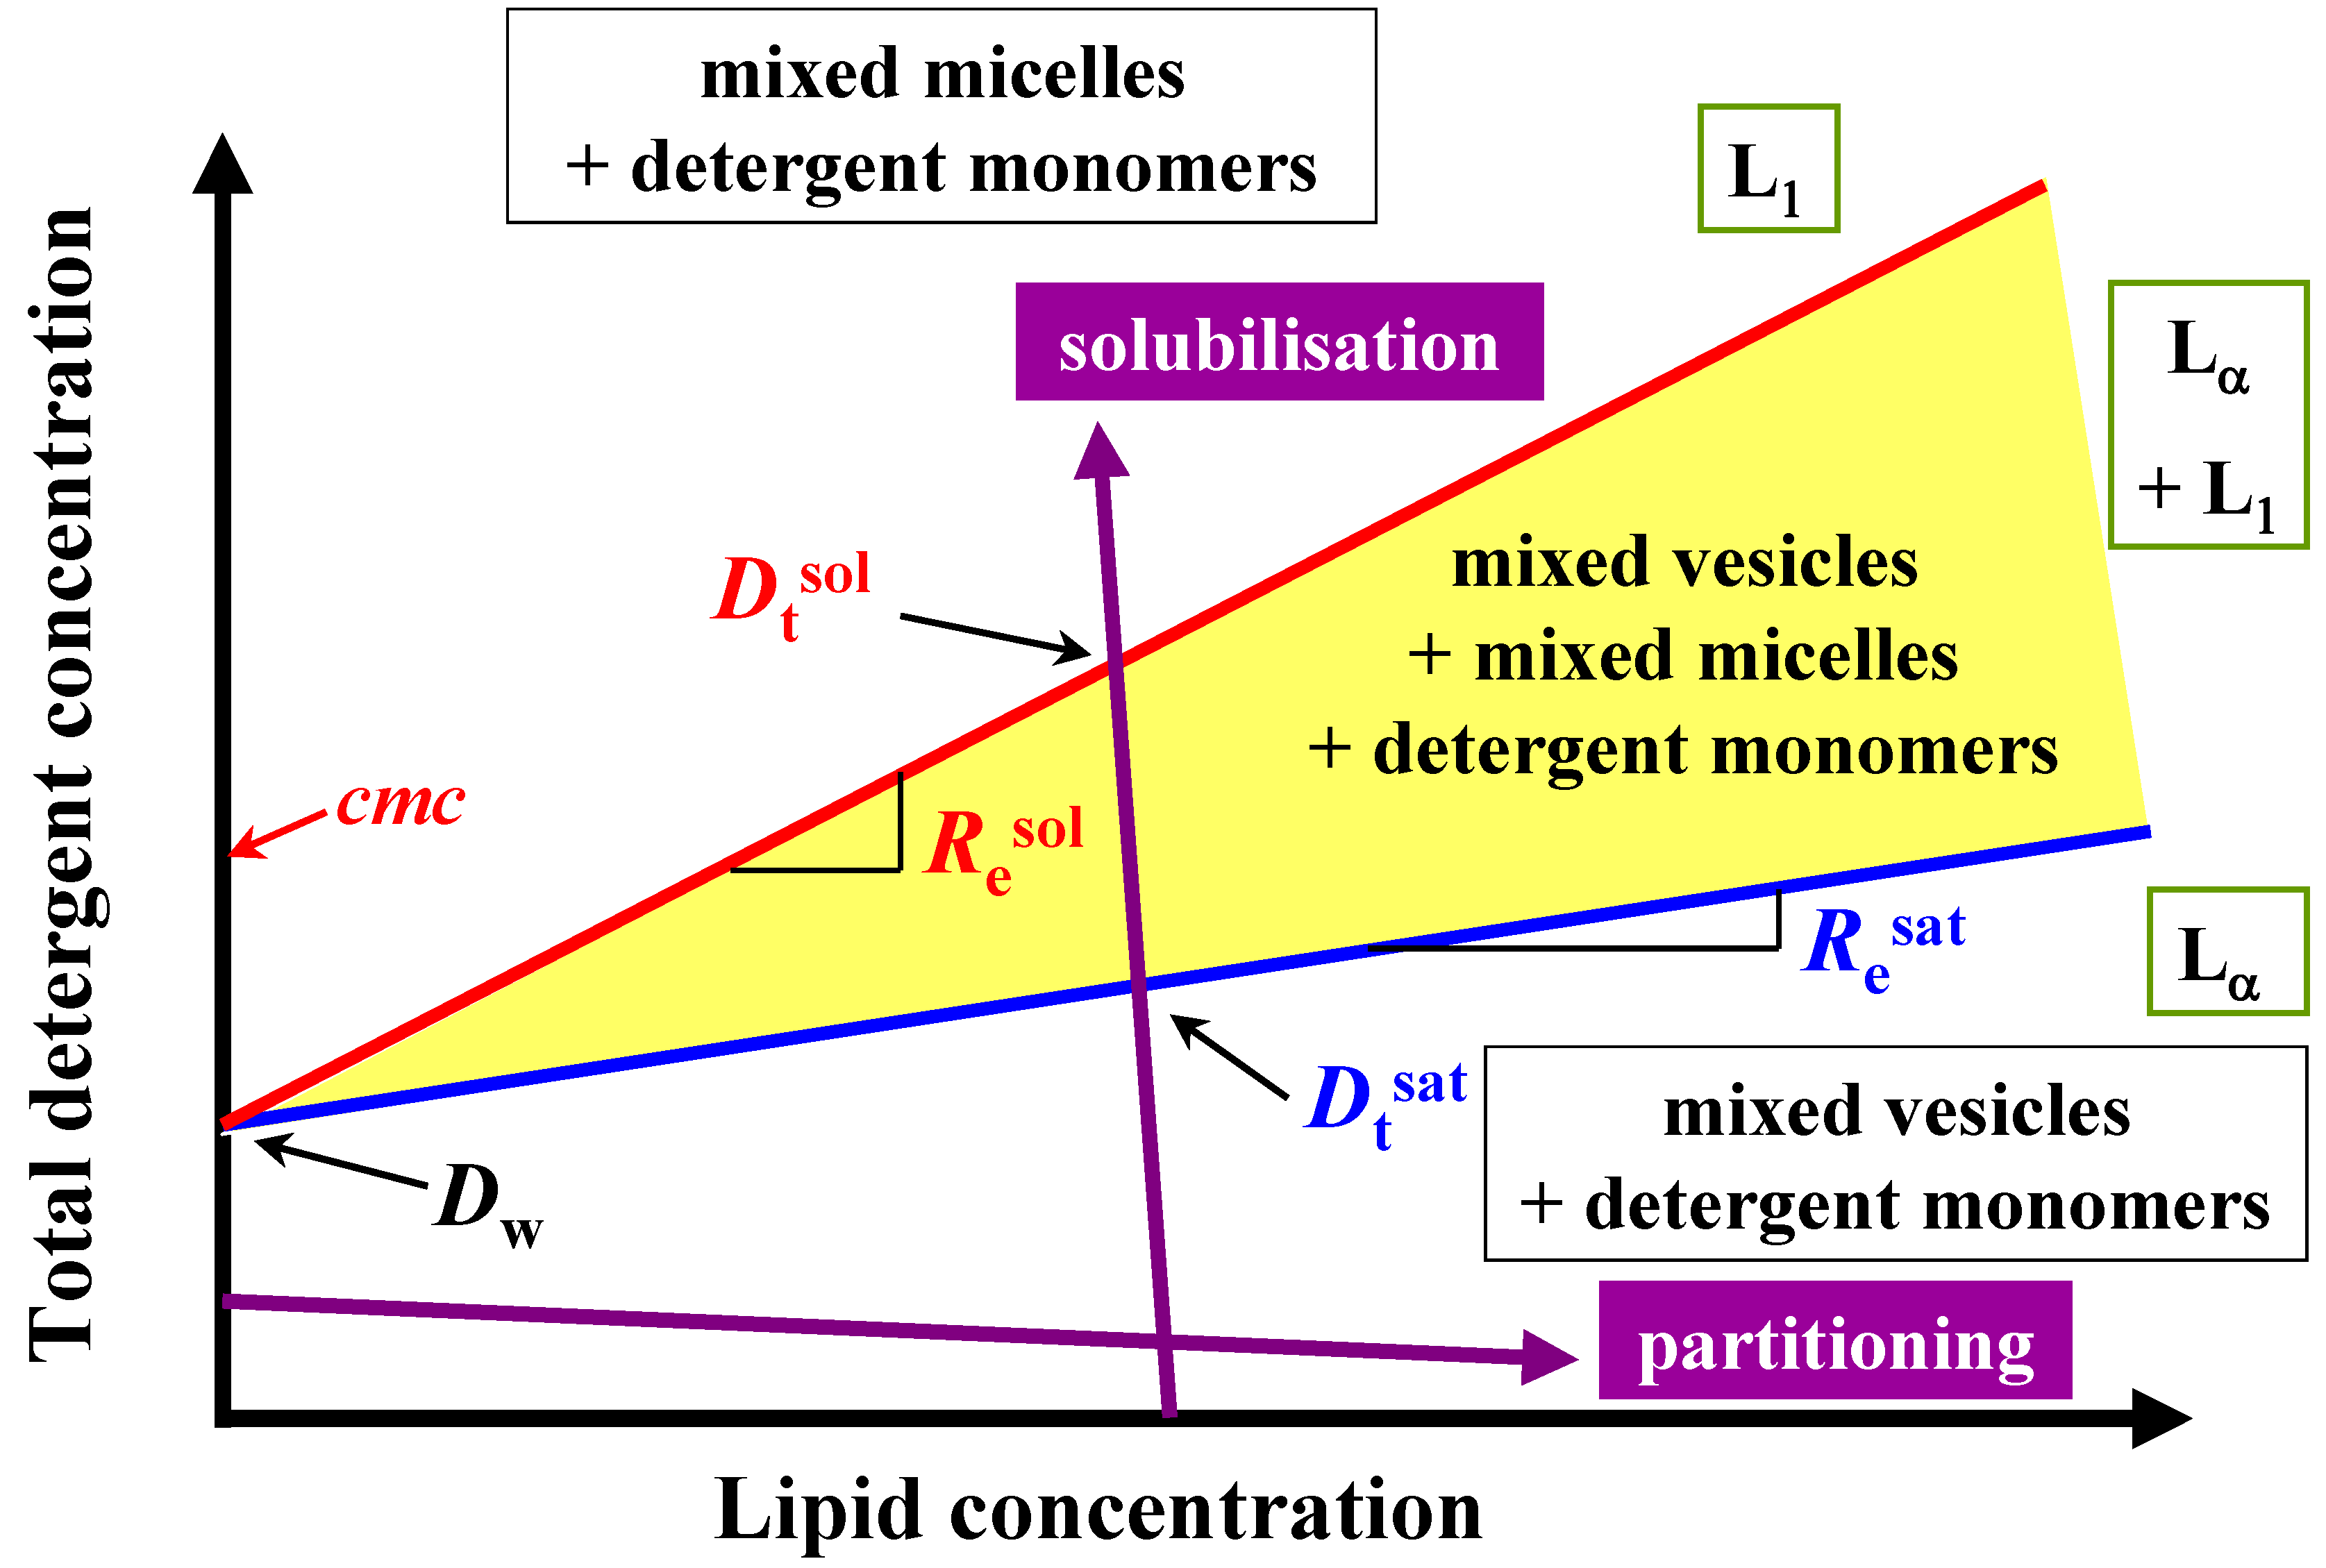
Figure 2.
Schematic phase diagram of lipid/detergent mixtures, a so-called total detergent concentration (Dt) versus lipid concentration (L) phase diagram, representing the liposome to micelle transition. The blue and red lines indicate the phase boundaries Dtsat and Dtsol for saturation (sat) respectively solubilisation (sol) process. The detergent to lipid ratio is given by Resat and Resol, and the hypothetical detergent concentration in the presence of lipid Dwsat and Dwsol for the saturation and solubilisation. Lα: liquid crystalline phase, L1 micellar phase.
NaC is the tri-hydroxy, whereas NaDC is the di-hydroxy bile salt variant. Under physiological conditions bile salts are negatively charged and bear one negative element charge. Clearly defined phospholipid model membranes (liposomes) were used [
54], in order to understand unambiguously the membranolytic detergent effect. Additionally, environmental conditions like temperature, ionic strength were considered.
The interaction of bile salts and their membranolytic activity was investigated as a function of:
- ♦
bile salt hydrophobicity
- ♦
ionic strength
- ♦
temperature
- ♦
chain length of phospholipids
- ♦
saturation degree of the acyl chains of the membrane
- ♦
surface charge density of the membrane
- ♦
membrane phase properties
Information was derived from isothermal titration calorimetry (ITC), dynamic light scattering (DLS), differential scanning calorimetry (DSC), and some structural data are supplemented by small angle neutron scattering (SANS).
Results and Discussion
Isothermal titration calorimetry (ITC) was used for the characterisation of the interaction of the bile salt detergents sodium cholate and sodium deoxycholate with model membranes. The liposomes were prepared from phosphatidylcholines (PCs) with saturated acyl chains of different length (C14: 1,2-dimyristoyl-
sn-glycero-3-phosphatidylcholine, DMPC, and C16: 1,2-dipalmitoyl-
sn-glycero-3-phosphatidylcholine, DPPC), unsaturated fatty acids (1-palmitoyl-2-oleoyl-
sn-glycero-3-phosphatidylcholine, POPC) and of a natural occurring PC source composed of lipids with mainly unsaturated acyl chains (soybean phosphatidylcholine, SPC). Under physiological conditions, PCs are zwitterionic. Hence, to analyse the influence of membrane surface charge density with regard to membranolytic activity of the detergents, membranes were prepared with a lipid, which under physiological conditions is negatively charged (1,2-dipalmitoyl-
sn-glycero-3-phosphatidyl-glycerol, DPPG) [
54,
76]. Different DPPC to DPPG mixtures were prepared in order to modulate the surface charge.
Using ITC, the partition coefficients
P were determined as well as the transfer enthalpy Δ
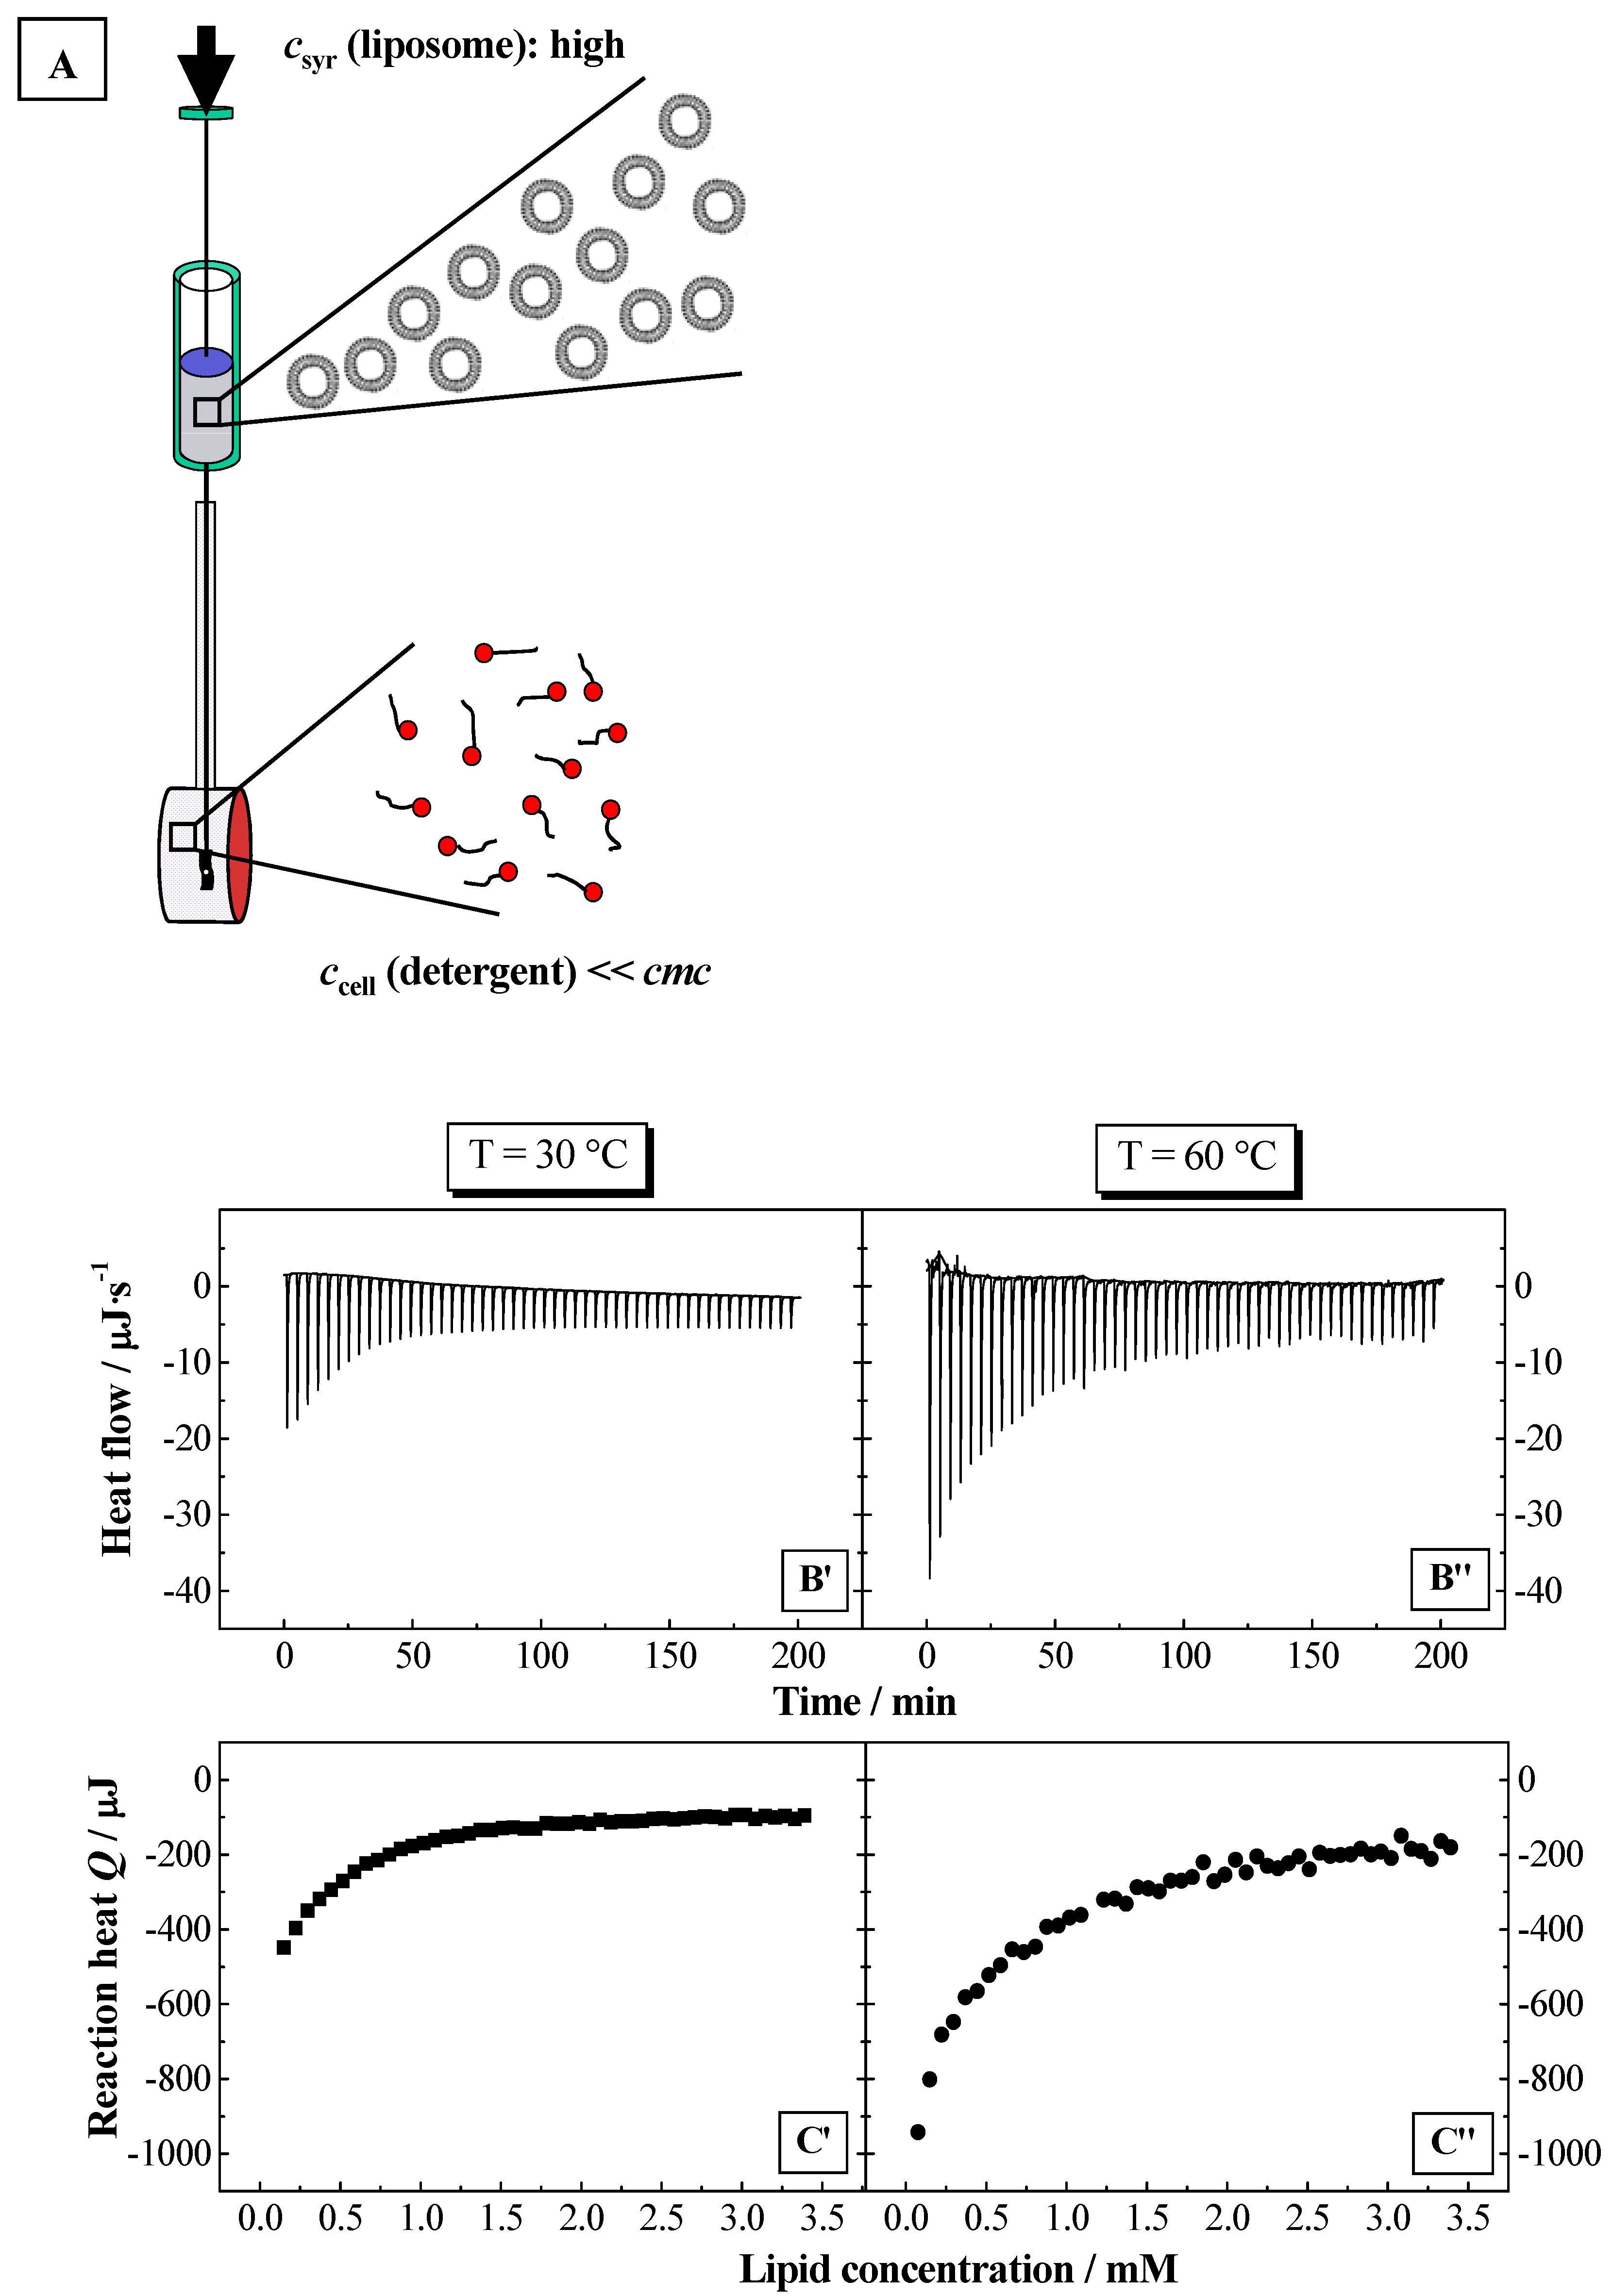
HT for the detergent from water to the bilayer phase. The partition experiments were performed as shown in
Figure 2 and
Figure 3A (for more details see Experimental section). The partition coefficients were calculated using a model, which takes into account electrostatic interactions (see above). The membranolytic effect was assessed in a so-called solubilisation experiment, where a certain amount of detergent is added to the liposomal dispersion up to the complete disruption of the membrane and the formation of mixed micelles composed of a large excess of detergent and smaller amounts of lipid. This process is investigated by ITC and DLS. Based on the results from ITC, thermodynamic parameters are determined for the solubilisation process of the lipid membranes. The phase boundaries for the vesicle-to-micelle phase transition are determined from ITC or alternatively from DLS experiments.
Influence of bile salt hydrophobicity
Based on the chemical nature of NaDC and NaC, the hydrophobicity of the former bile salt is higher because it has only two hydroxyl groups compared the NaC with three hydroxyl groups (see
Figure 1). As a consequence the solubility and the aggregation properties are quite different [
23,
24]. The
cmc in water at
pH 7.5 (25 °C) is 15 mM for NaC and 6 mM for NaDC [
79]. The influence of the bile salt hydrophobicity with regards to the bile salt partitioning into lipid membranes at 60 °C in water is represented in
Figure 6. The temperature was chosen in order to make sure that the experiments are performed for both lipid systems in the liquid crystalline phase [
54,
64]. As can be seen from
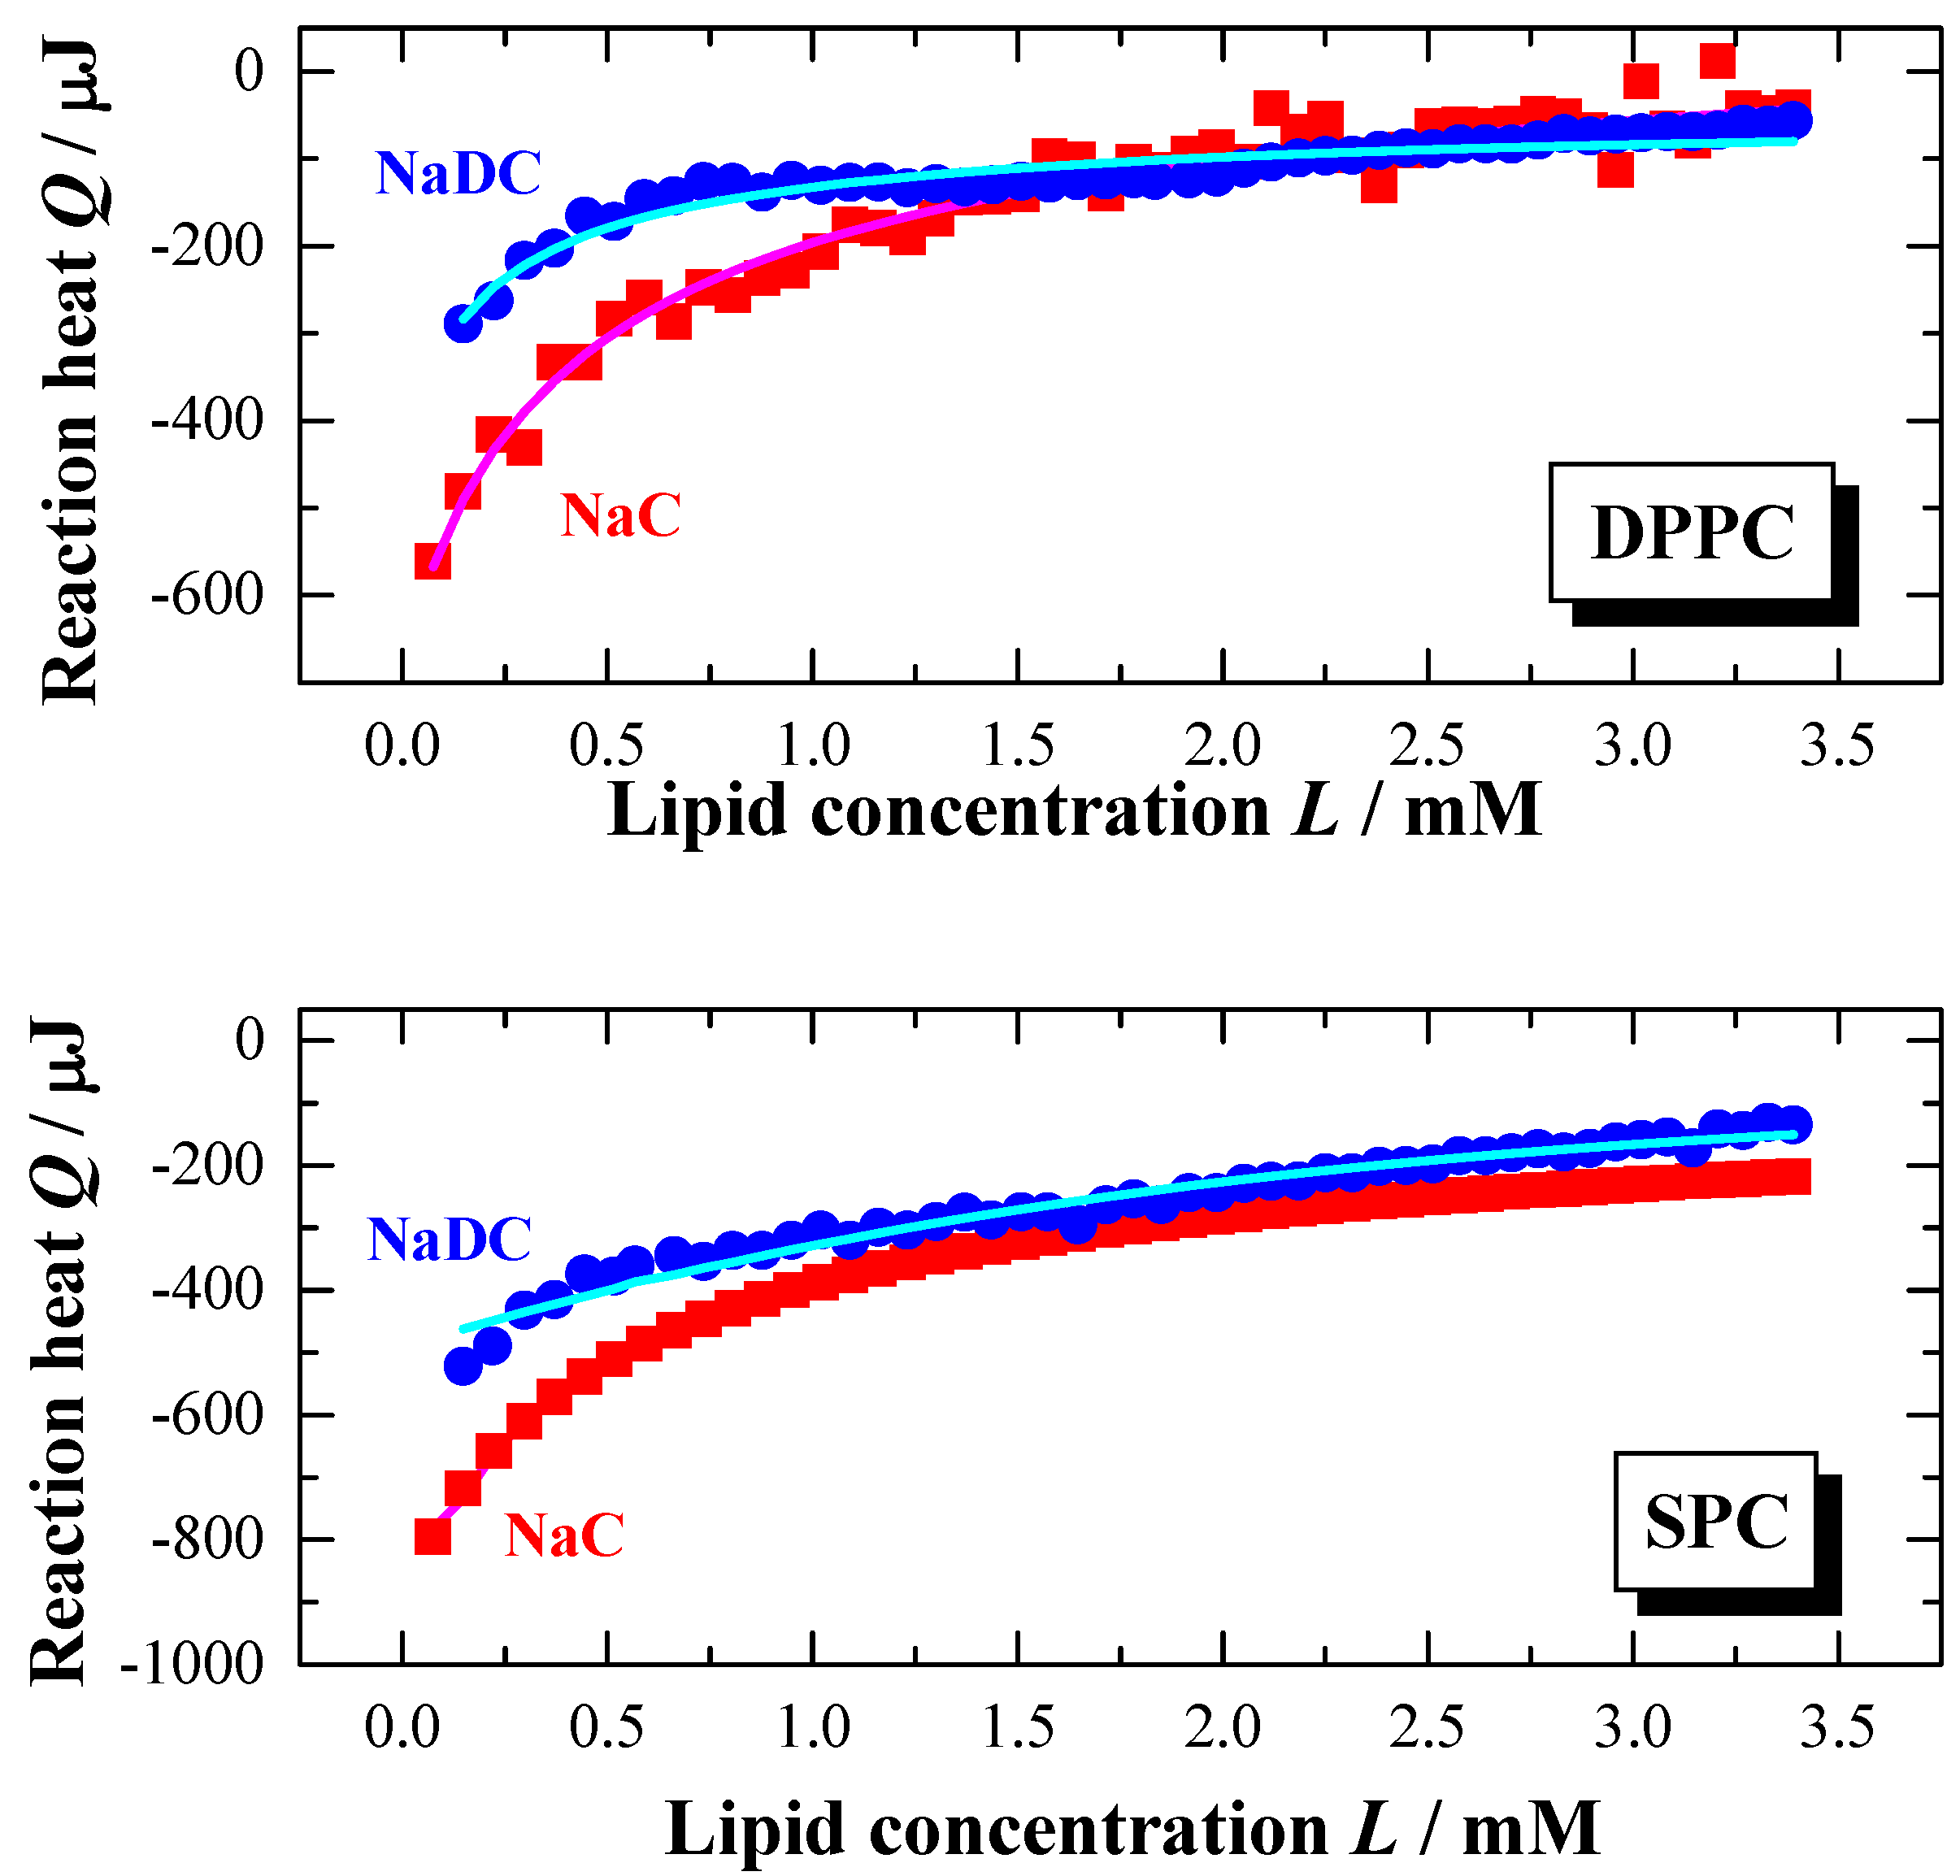
Figure 6, there is a clear difference in the partitioning behaviour between the two bile salts. The titration of NaC shows a titration curve with a continuous change in the reaction heats.
However, the titration curve of NaDC is characterised by a discontinuous shape in the Q versus L course leading to the assumption that the interaction of NaDC with the membranes appears to be a two-step process. At the beginning of the titration the reaction heat Q decreases much more for NaDC with increasing the lipid concentration compared to NaC. For the later injections a weaker reaction heat decrease is observed as a function of lipid titration. For NaC the partition curve indicates a one-step process. Therefore, the experimental and calculated data (calculated with the model presented above) agree much better for NaC compared to NaDC.
Figure 6.
Partition experiment: Titration of a lipid dispersion (syringe) of a concentration of 20 mM, DPPC (top) and SPC (bottom), into a NaC (10 mM) or NaDC (4 mM) solutions in water at
T = 60 °C (
pH 7.5). Injection scenario: 50 injections à 5 μl. The plots represent the change in reaction heat
Q of each injection versus lipid concentration
L in the cell (adapted from [
56,
59]). The full lines were obtained from simulations using the partition model described in the text.
Under the chosen experimental conditions, exotherm reaction heats are obtained (
Figure 6). The transfer enthalpies Δ
HT are negative for the transfer of bile salt monomers from the aqueous to the lipid phase. For the examined lipid systems, it is observed that Δ
HT (NaC) < Δ
HT (NaDC). Compared to the detergent transfer enthalpy from water to a detergent micelle, where Δ
HT values of -8 kJ·mol
-1 (NaC) and -13 kJ·mol
-1 (NaDC) are obtained [
79], the transfer enthalpies to a lipid phase are much smaller.
The partition coefficients presented in this study are given in mole fraction units.
P0 is the intrinsic partition coefficient, and
Pav represents the partition coefficient in the “middle” of the titration experiment (
Table 2).
A strong dependency of the hydrophobicity of the bile salts is seen in the partition coefficients. Comparing the two reported partition coefficient show that P (NaC) << P (NaDC), indicating that NaDC is easier incorporated in the membrane.
Analysing the change in Gibbs free energy Δ
GT for the micellisation process indicates values in the range of -20 to -26 kJ·mol
-1, whereas much more negative values are detected for the detergent monomer transfer to a lipid membrane (
Table 2). As can be seen from
Table 2, the Gibbs free energy change varies with the presence of detergent amount; a decrease is observed with increasing the detergent concentration in the lipid phase. The reasons for this effect are twofold. First, with increasing presence of detergent, the membrane surface charge increases, and as a consequence, as described by the Gouy-Chapman model, a decrease in the concentration of the detergent molecules in the vicinity of the membrane is induced. The apparent partitioning coefficient
Papp decreases therefore at each titration step, whereas the intrinsic partitioning coefficient
P0, which does not consider electrostatic effects, is a constant. Second, non-ideal mixing of the bile salt detergent with the lipid molecules has to be considered, leading to a non-zero non-ideality coefficient (
ρ). A
ρ ≠ 0 will also decrease the partition coefficient (see Equation 4).
Table 2.
Thermodynamic parameters for the partitioning of NaC and NaDC into DPPC and SPC membranes dispersed in water at
pH 7.5 at 60 °C (liquid crystalline phase). The thermodynamic values are given in kJ·mol
-1 [
56,
59].
Table 2.
Thermodynamic parameters for the partitioning of NaC and NaDC into DPPC and SPC membranes dispersed in water at pH 7.5 at 60 °C (liquid crystalline phase). The thermodynamic values are given in kJ·mol-1 [56,59].
| System | ΔHT | ΔG0T | ΔGavT | Τ·ΔS0T | Τ·ΔSavT | P0 x 106 | Pav x 103 |
|---|
| NaC/DPPC | -1.2 | -43.4 | -24.8 | 42.2 | 23.6 | 6.4 | 7.8 |
| NaC/SPC | -1.6 | -43.6 | -24.9 | 42.0 | 23.4 | 6.9 | 8.1 |
| NaDC/DPPC | -0.7 | -48.7 | -35.0 | 48.1 | 34.4 | 44 | 310 |
| NaDC/SPC | -0.4 | -48.6 | -35.1 | 48.2 | 34.7 | 43 | 319 |
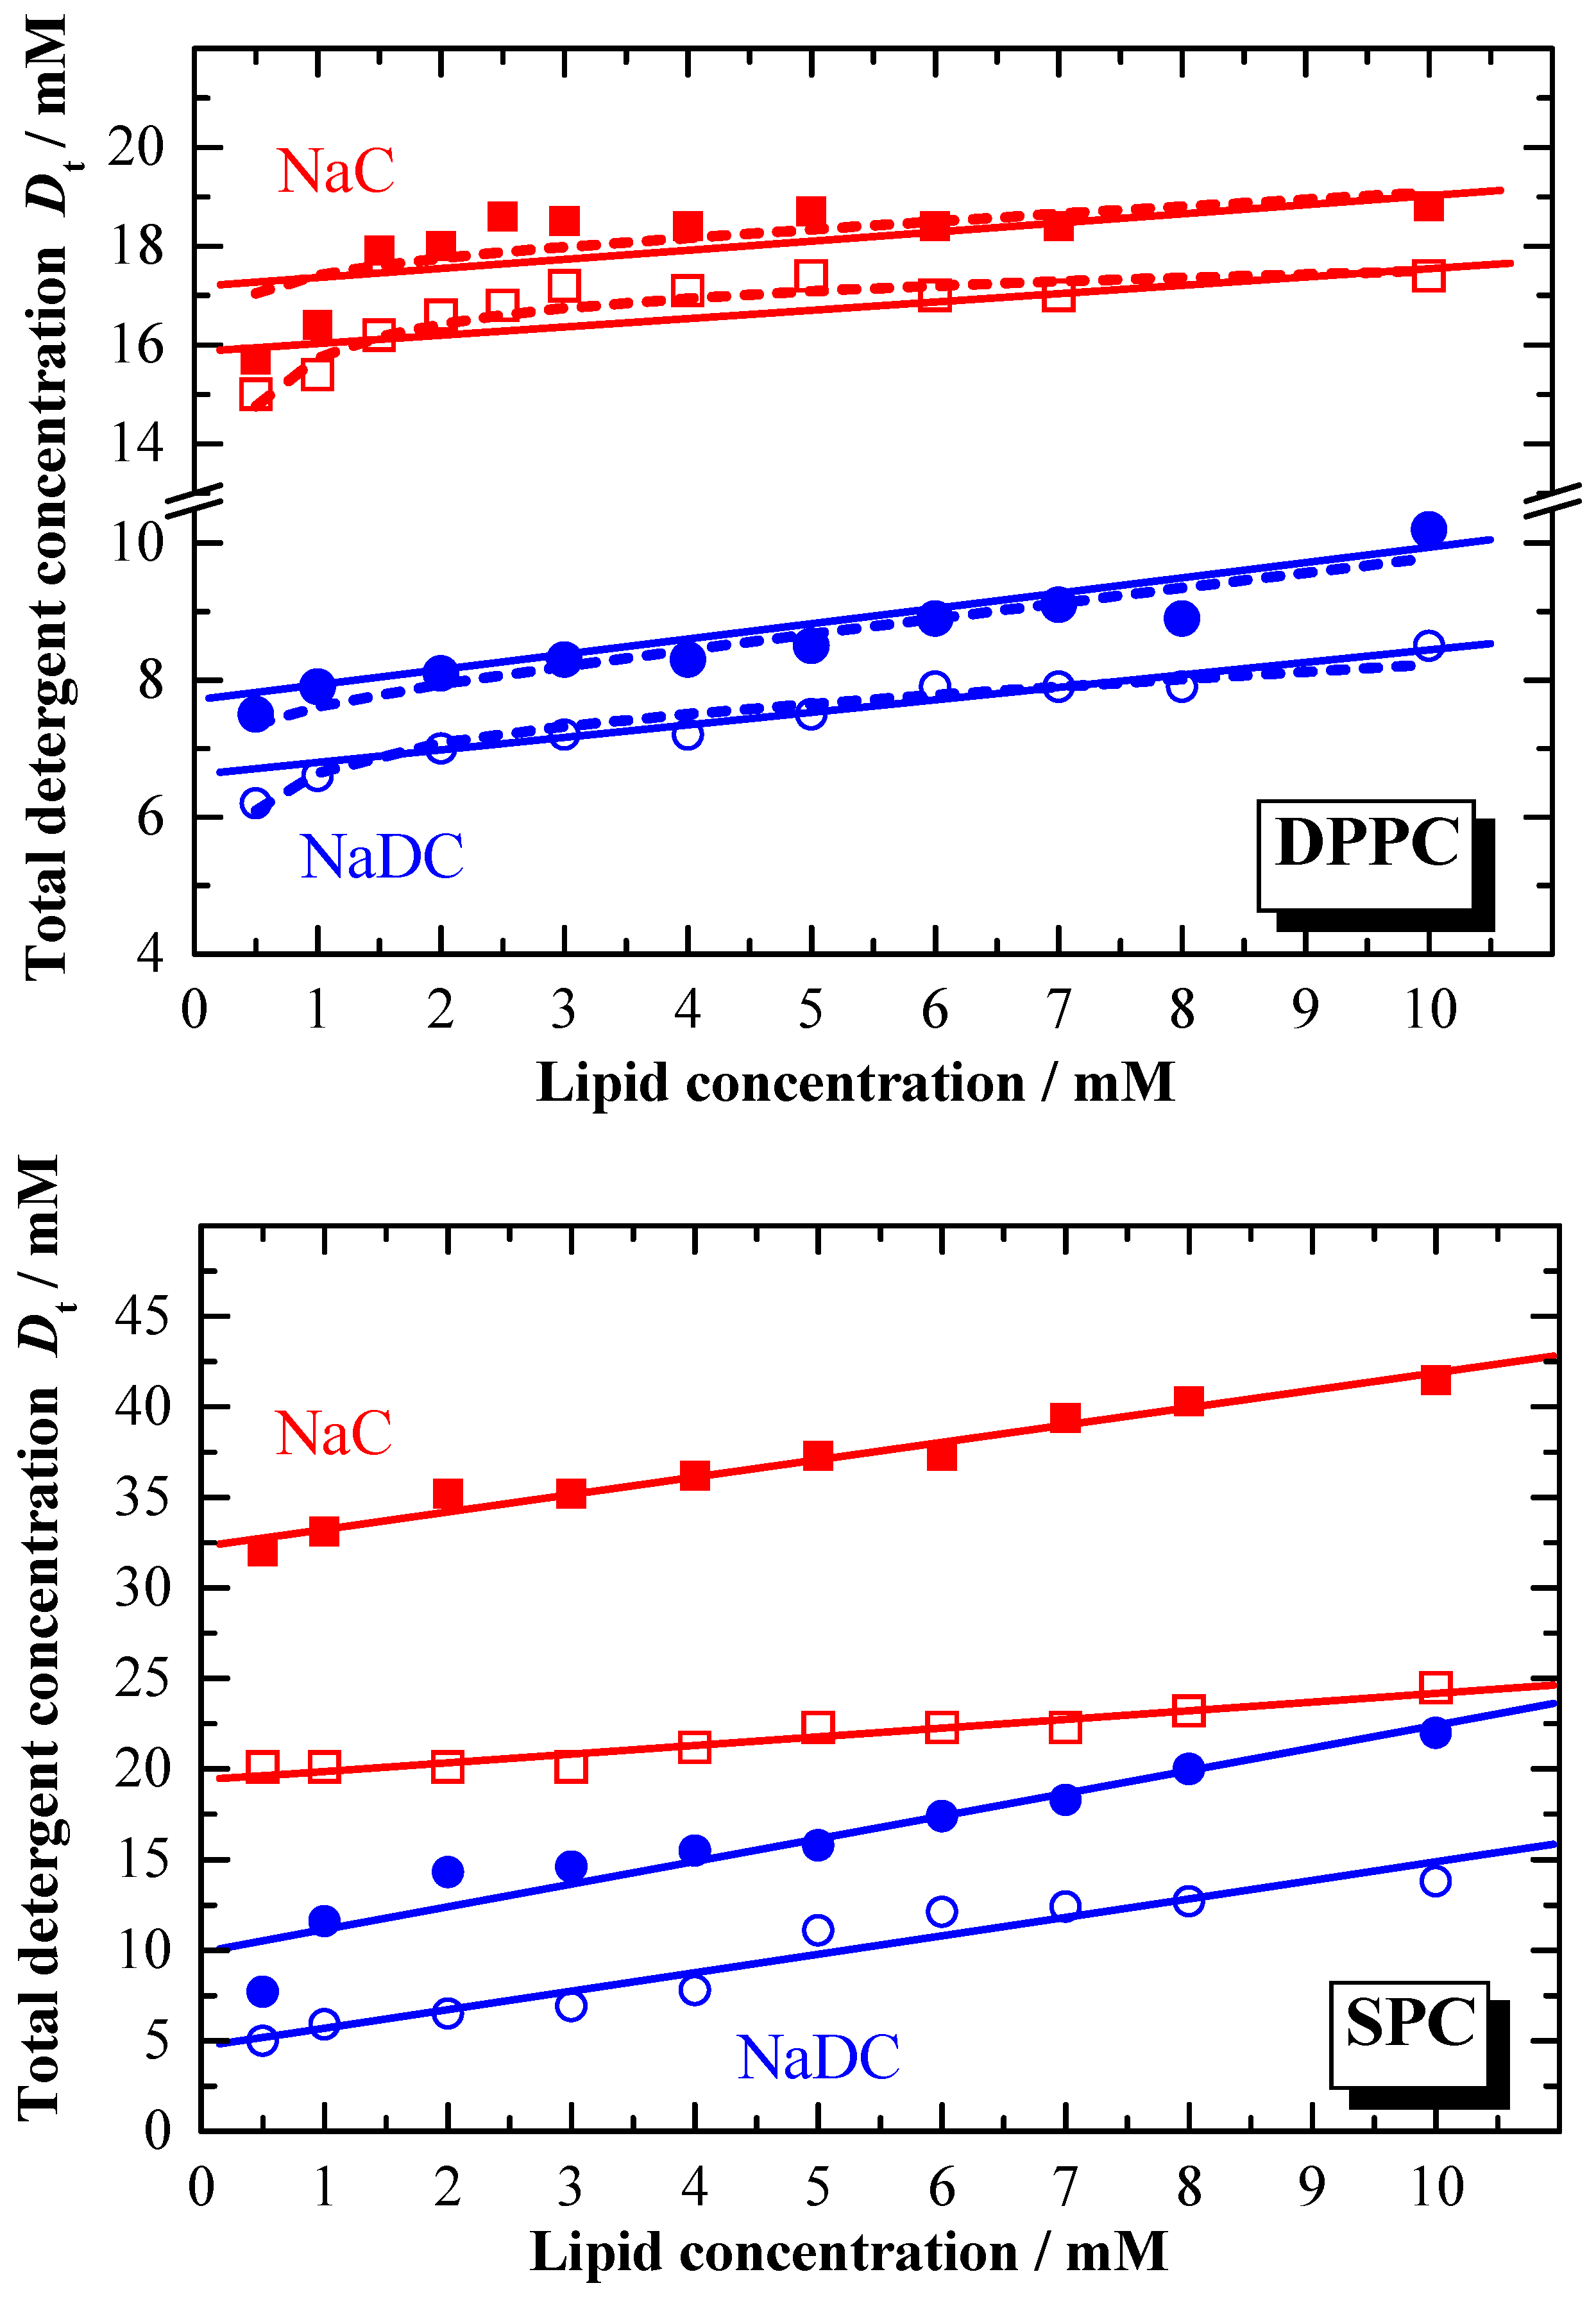
The difference in the partition coefficient between the two bile salts reflects also the membranolytic activity of the detergent. The lipid to detergent phase diagrams for NaDC and NaC, representing the solubilisation of the membrane are shown in
Figure 7. In general, the amount of detergent required for the saturation and solubilisation of the membrane is different for the two bile salts. For the solubilisation of e.g. DPPC membranes at least two times more NaC is needed compared to NaDC. The detergent concentration where membrane solubilisation occurs depends on the total lipid amount. For higher lipid concentrations, the detergent concentration needed is higher than the
cmc [
79,
80]. The composition of the aggregates formed at the saturation solubilisation phase boundary is given by the effective detergent to lipid ratios
Re, which are summarised in
Table 3.
Resat (NaC) is in general smaller compared to
Resat (NaDC). This is still the case for
Resol (NaC), however the difference become smaller. Comparing these
Re data with data reported for non ionic detergents like OG [
25,
28], shows that for ionic detergents
Re data at least one order of magnitude higher. The extremely low
Re data for bile salts indicate the saturation limit being reached at very low effective detergent concentration in the membrane, and thus reflects the high membranolytic potential. This is more pronounced for the more hydrophobic bile salt.
Table 3.
NaC and NaDC solubilisation data for DPPC and SPC in water (
pH 7.5) at 60 °C.
Re: slopes of the saturation (sat) and solubilisation (sol) process,
Dw: equilibrium bile salt concentration. Values reported in parentheses are obtained using the model proposed by Roth
et al. [
75].
Table 3.
NaC and NaDC solubilisation data for DPPC and SPC in water (pH 7.5) at 60 °C. Re: slopes of the saturation (sat) and solubilisation (sol) process, Dw: equilibrium bile salt concentration. Values reported in parentheses are obtained using the model proposed by Roth et al. [75].
| System | Resat | Resol | Dwsat / mM | Dwsol / mM |
|---|
| NaC/DPPC | 0.11 (0.022) | 0.15 (0.13) | 16.5 (18) | 17.8 (18) |
| NaC/SPC | 0.48 | 0.96 | 19.4 | 32.3 |
| NaDC/DPPC | 0.21 (0.082) | 0.23 (0.211) | 6.4 (8) | 7.5 (8) |
| NaDC/SPC | 1.02 | 1.25 | 4.7 | 9.9 |
From
Figure 7 and the data reported in
Table 3 it is obvious that
Dwsat ≠
Dwsol as expected by equation 13, and that the linearity described by equation 13 is also not given. Deviation from linearity is especially observed for lipid concentrations lower than 2 mM. The reason for this behaviour could be that below this concentration the equilibrium aggregation state becomes concentration dependent.
The initial 3 stage model describing the solubilisation of membranes involves no compositional changes of the coexisting aggregates throughout the complete coexistence range. Obviously this is not the case. Therefore, Roth
et al. [
75] have developed a model taking in consideration the finite size of the mixed micelles and the energetic effects of end-caps of cylindrical micelles. Using this model, deviations from linearity at low lipid concentrations can be better described. The calculated curves (according to Roth
et al.) are represented in
Figure 7 as dashed lines, and as can be seen, fit much better the experimental data. The corresponding data for the phase diagram using the Roth
et al. approach are reported in
Table 3 (values in parentheses).
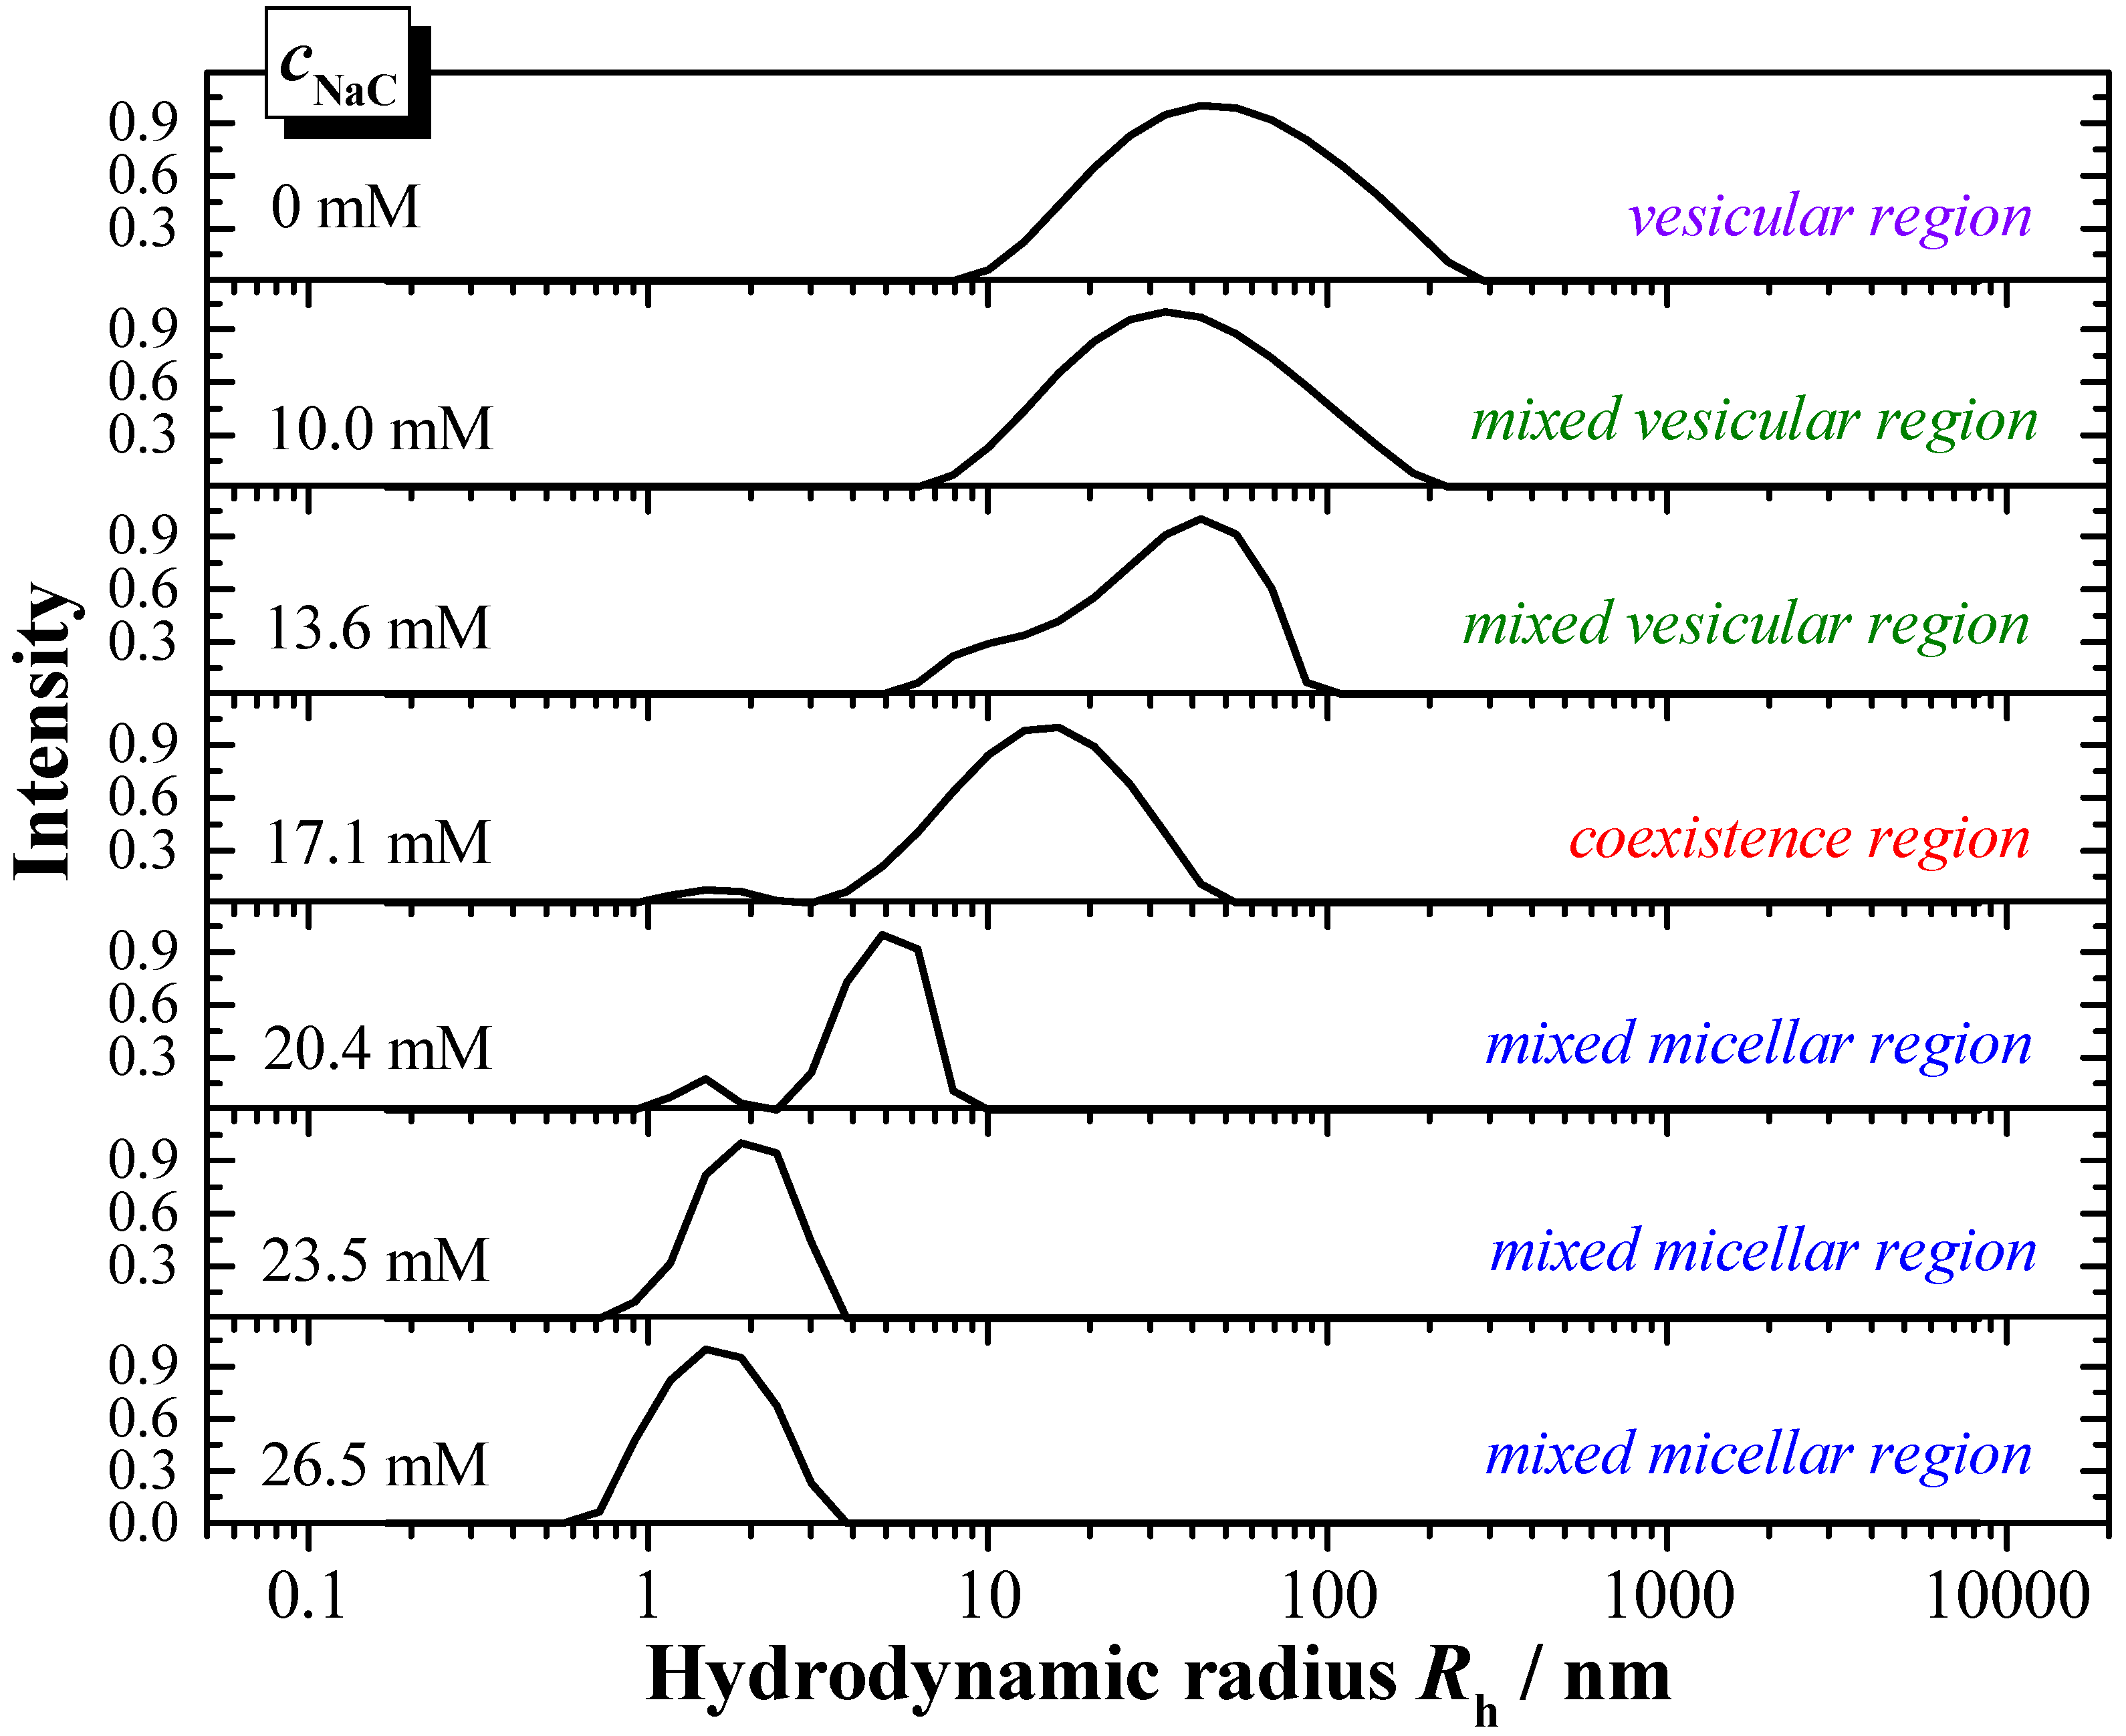
The interaction properties of the two bile salts have also been investigated by DLS, in order to derive information with regards to the particles formed during solubilisation, and to complement the results derived from ITC. The presented example (
Figure 8) shows the DLS-scattering intensity as a function of the hydrodynamic radius
Rh. In
Figure 8 is exemplarily shown the titration of a 6 mM DPPC dispersion in water (
pH 7.5, 55 °C) with a 150 mM NaC solution in water (
pH 7.5) in steps of 20 µL.
The hydrodynamic radius of the pure DPPC vesicles is about Rh ≈ 50 nm, and shows a broad size distribution. The addition of bile salt induces a decrease of the hydrodynamic radii. In the mixed vesicular range for the system DPPC/NaC a decrease to Rh ≈ 25 nm is detected.
The coexistence region is characterised by the presence of larger aggregates of a size in the range Rh ≈ 15 nm and much smaller aggregates of Rh ≈ 1.5 nm. The aggregate size in the mixed micellar region further decreases upon increasing the presence of bile salt. A more or less constant aggregate size of Rh ≈ 1.5 nm is obtained at the end of the titration for both systems DPPC/NaC and DPPC/NaDC.
Based on the DLS results the phase boundaries with the characteristic data Dtsat and Dtsol can be obtained and are compared to the data derived from ITC. Both values correspond very well. The DLS data confirm that the amount of the more hydrophilic bile salt NaC is higher compared to the higher membranolytic potential of NaDC.
Figure 7.
Phase diagrams for the vesicle-to-micelle transition (membrane solubilisation) in NaC/DPPC, NaDC/DPPC, NaC/SPC and NaDC/SPC in water (
pH 7.5) at
T = 60 °C. Phase boundaries are represented by the experimentally obtained data
Dtsat (open symbols) and
Dtsol (closed symbols). Solid lines: phase boundaries calculated according to equation 13, dashed lines: phase boundaries calculated according Roth
et al. [
75].
Figure 8.
Results of DLS (dynamic light scattering) solubilisation experiments: Solubilisation of DPPC vesicles at 6 mM dispersed in water (pH 7.5) with NaC at a concentration of 150 mM at T = 55 °C. Titration volume: 20 μL NaC.
Figure 8.
Results of DLS (dynamic light scattering) solubilisation experiments: Solubilisation of DPPC vesicles at 6 mM dispersed in water (pH 7.5) with NaC at a concentration of 150 mM at T = 55 °C. Titration volume: 20 μL NaC.
Influence of ionic strength
Increasing the ionic strength induces a screening of the negative charge of the bile salts. As a consequence they become more “hydrophobic”; the cmc of e.g. NaC in water (pH 7.5, 25 °C) decreases from 15 mM to 11.5 mM for an increase of the ionic strength to 100 mM NaCl (pH 7.5, 25 °C).
The transfer enthalpies ΔHT become more negative with increasing the ionic strength. For the system NaDC/DPPC (60 °C, pH 7.5) ΔHT (H2O) = -0.7 kJ·mol-1 and for ΔHT (100 mM NaCl) = -6.7 kJ·mol-1.
Additionally, increasing the ionic strength should increase the bile salt partition coefficient, because the charges are screened to a large extent reducing the electrostatic effects. This is observed. Higher
Pav values and larger Δ
GavT are obtained in 100 mM NaCl compared to pure water. The intrinsic partition coefficient should be unaffected by changing the ionic strength, due to the fact that charge screening effects at infinite dilution of the bile salt in the lipid phase is strongly reduced (for more details see [
41,
56,
59,
62]).
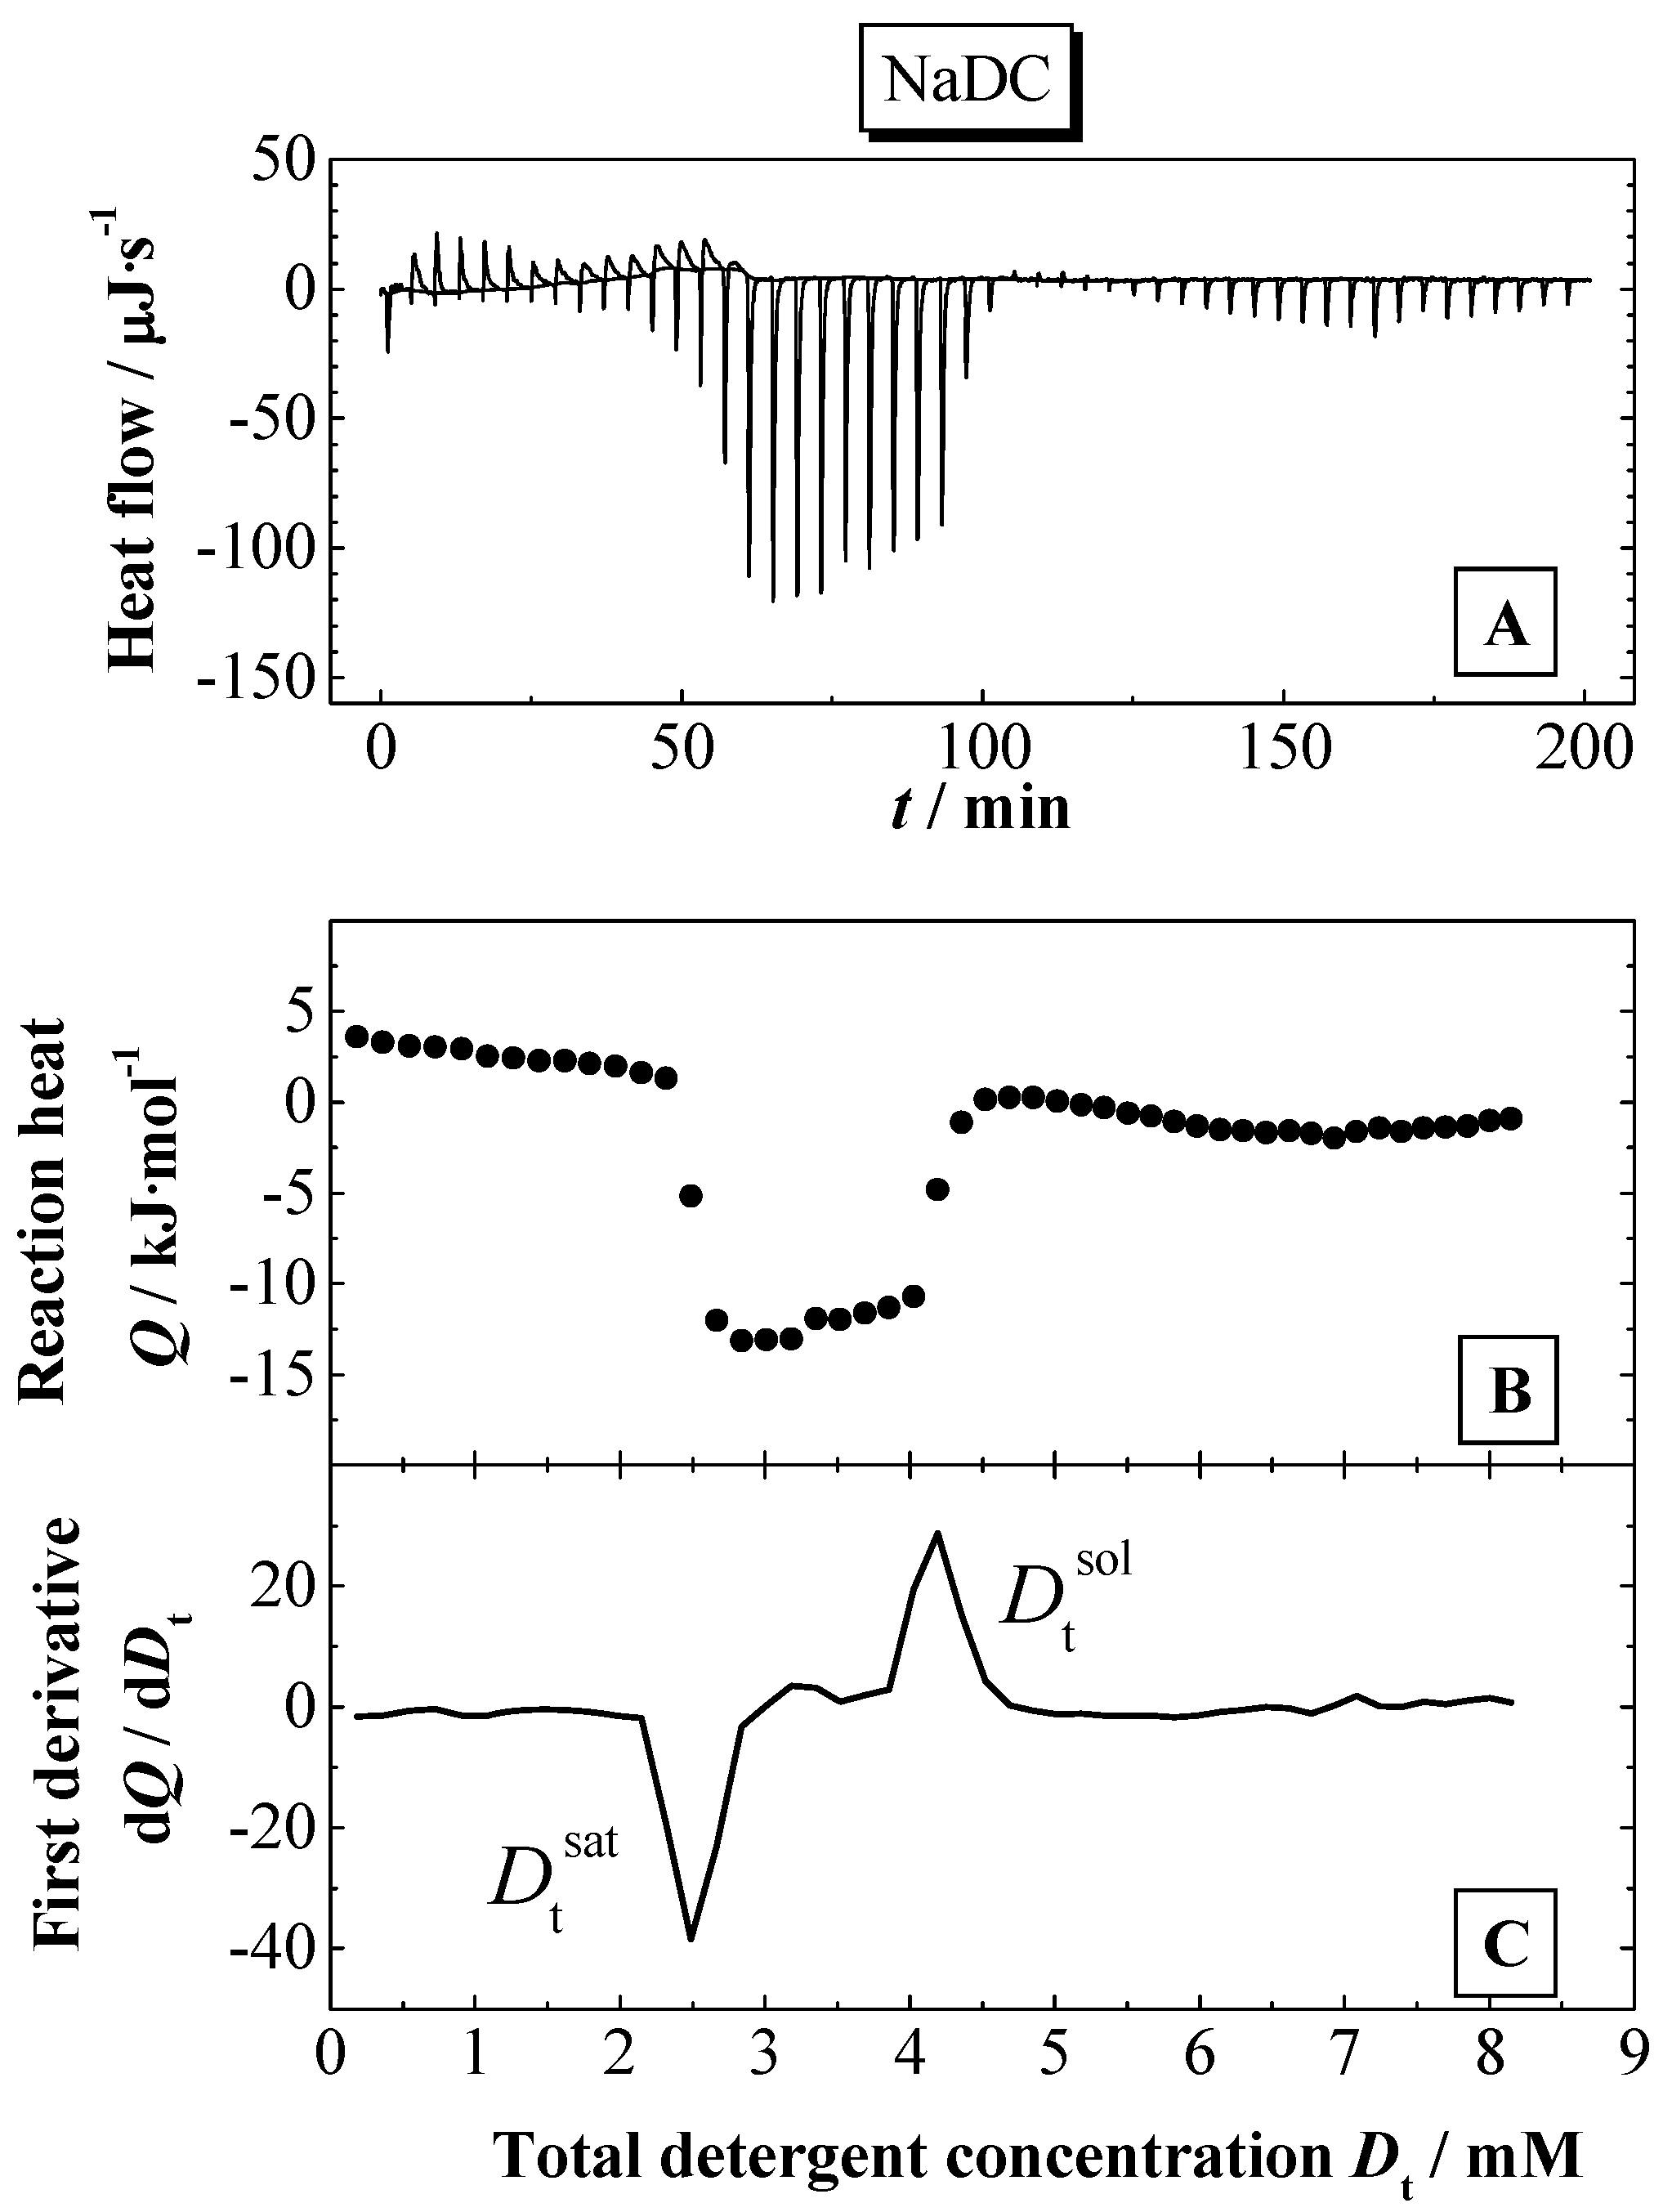
In the presence of ions the detergent concentration for the saturation and solubilisation of membranes (
Figure 9) is drastically reduced, as can be seen by comparing the corresponding
Dw# values (see
Table 3 and
Table 4).
Figure 9.
Solubilisation experiment: Titration of a micellar NaDC solution (50 mM) into a DPPC dispersion (6 mM) in 0.1 M NaCl, pH 7.5 at 60 ºC with 50 x 5 μl.(A) Calorimetric traces, (B) normalised titration heat Q versus total detergent concentration in the cell Dt, (C) first derivative of curve (B).
The composition of the mixed vesicles as well as the mixed micelles shows in general larger Re# values, indicating that more detergent is incorporated in the aggregates as the ionic strength increases. The detergent amount required for saturation and solubilisation of the phospholipid membranes is dramatically reduced for both bile salts in the presence of salt. The system NaC/DPPC at 60 °C shows with increasing the ionic strength from water to 100 mM NaCl a decrease of Dw# by about 60 %.
The phase diagrams for the vesicle-to-micelle transition in water (
Figure 7) are characterised by non-linear phase boundaries with a decrease of the phase boundaries at low lipid concentration [
59,
62,
75,
81]. This is not observed to such an extent for the lipid to bile salt systems dispersed in 100 mM NaCl. These results are confirmed by the analysis of the DLS titration experiments (data not shown). However, based on DLS no exact information with regards to the shape of the formed aggregates can be obtained. Therefore, SANS measurements were performed [
82,
83,
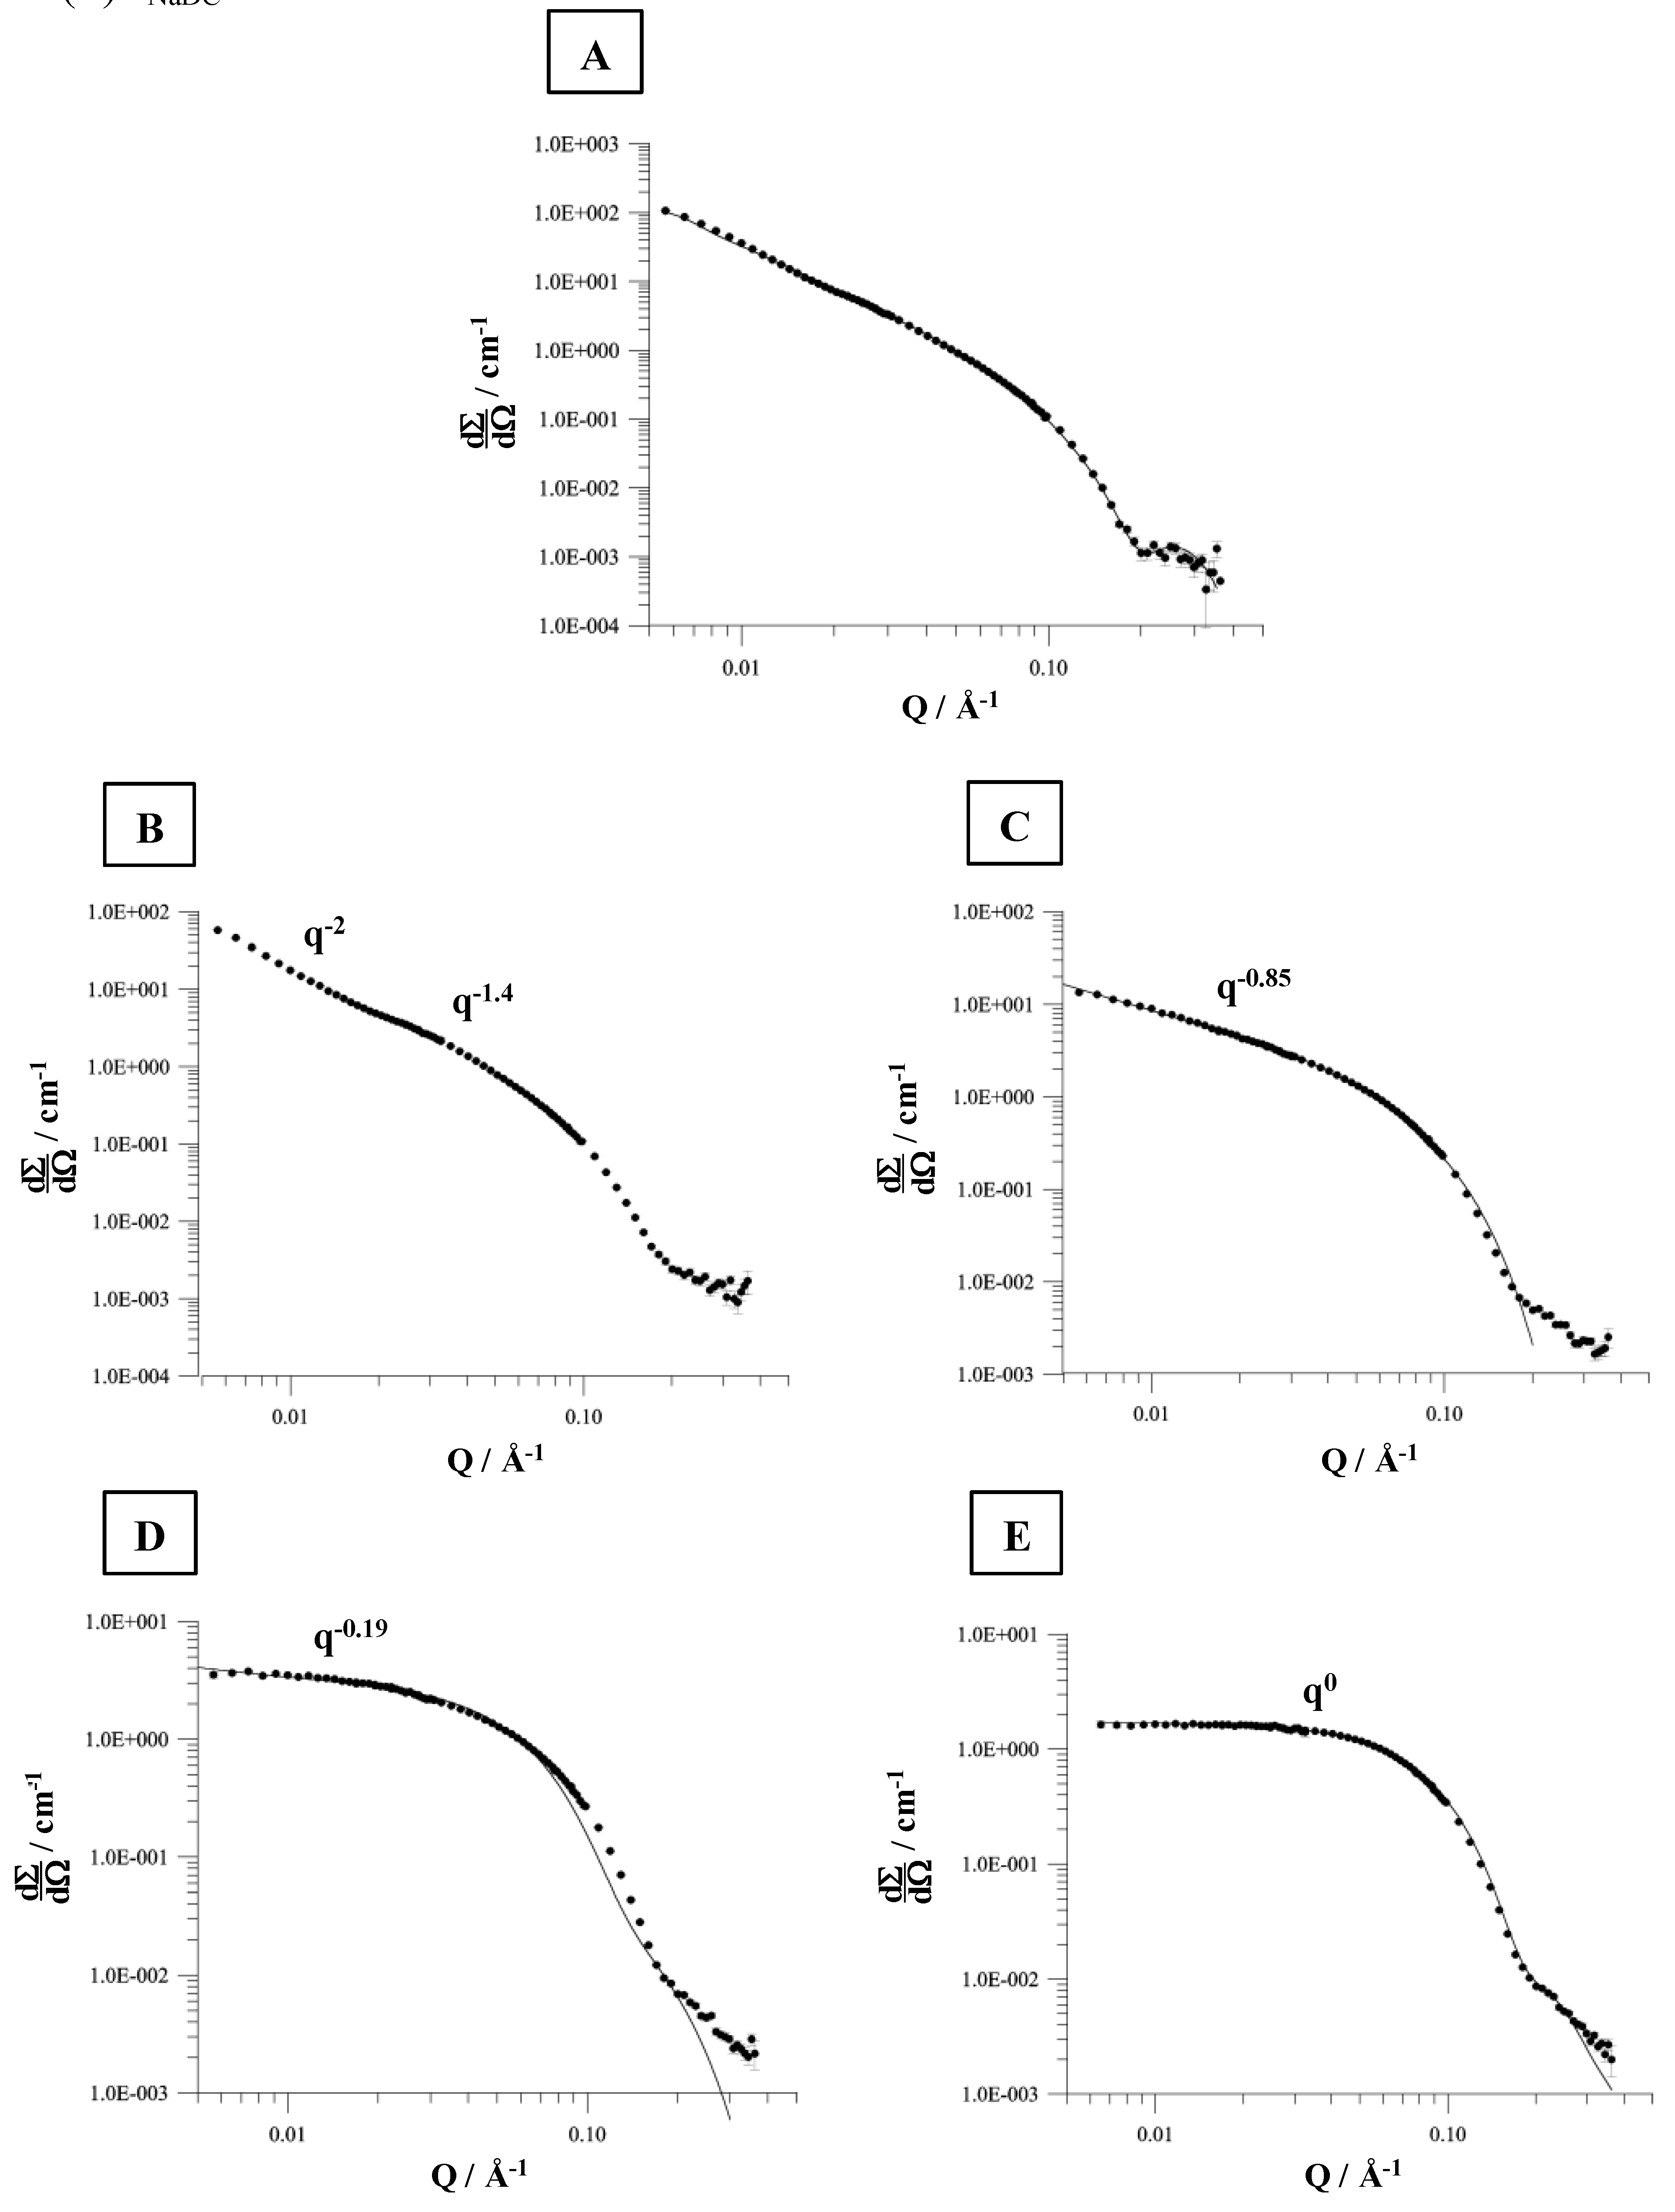
84]. This is exemplarily described for the system NaDC/DPPC in 100 mM NaCl at 60 °C. Various amounts of detergent (1.5 – 10 mM) were added to a constant amount of DPPC (6 mM) dispersion. The corresponding scattering plots are shown in
Figure 10. The interpretation of the SANS data is performed according to the Guinier analysis [
82,
83,
85]. In brief: the exponent of the scattering vector
q, the so-called
q-domain, contains information of the aggregate type. A
q-2 is an indication for the scattering of vesicles, whereas
q-1 is due to scattering of longitudinal aggregates, like cylindrically shaped micelles. A
q0 is a characteristic for spherical micelles.
Table 4.
NaC and NaDC solubilisation data for DPPC and SPC in 100 mM NaCl (pH 7.5) at 60 °C. Re: slopes of the saturation (sat) and solubilisation (sol) process, Dw: equilibrium bile salt concentration.
Table 4.
NaC and NaDC solubilisation data for DPPC and SPC in 100 mM NaCl (pH 7.5) at 60 °C. Re: slopes of the saturation (sat) and solubilisation (sol) process, Dw: equilibrium bile salt concentration.
| System | Resat | Resol | Dwsat / mM | Dwsol / mM |
|---|
| NaC/DPPC | 0.19 | 0.29 | 5.6 | 6.6 |
| NaC/SPC | 0.45 | 0.91 | 7.9 | 11.2 |
| NaDC/DPPC | 0.20 | 0.39 | 1.4 | 1.7 |
| NaDC/SPC | 0.29 | 0.82 | 2.2 | 2.9 |
The SANS data for a mixture composed of 6 mM DPPC and 1.5 mM NaDC (mixture in the mixed vesicular range, below the coexistence curve for the saturation process) forms aggregates which would fit for a model aggregate system of ellipsoidal shape (
Figure 10A).
At detergent concentrations between 3.5 and 7.5 mM more complex scattering patterns are obtained, which were analysed according to Guinier [
82]. A mixture composed of 6 mM DPPC and 3.5 mM NaDC forms a composition, which is found in the coexistence range of the vesicle-to-micelle transition. The SANS data can be divided in two
q-regions, which corresponds to the scattering properties as observed for flexible, polymer like micelles [
82]. The calculated persistence length is
lp = 19 nm, which is in good agreement with literature data by Petersen
et al. [
86] who reported
lp = 18 nm.
The cylindrical micelles formed have dimensions of
a = 3.3 nm and
b = 2.1 nm. Increasing the amount of detergent e.g. to 5.5 mM NaDC induces the formation of aggregates composed of cylindrical and ellipsoidal shapes. This is illustrated by
q-0.85 (
Figure 10C). The cylindrical aggregates become more symmetric. The ellipsoidal micelles are characterised by
a = 9.5 nm and
b = 2.1 nm, with an eccentricity of
ε = 4.5. These results are in accordance to the SANS data presented by Hjelm
et al. [
69]. At a detergent concentration of 7.5 mM (
Figure 10D) the evaluation of the SANS data yield a scattering vector with
q-0.19 which shows that the formed ellipsoidal aggregates are transformed to more spherical shaped micelles (both type of micelles are present) and at a detergent concentration of 10 mM the fitted scattering vector of
q0 is indicative for the presence of spherical micelles. The micelle radius calculated is approximately 2.2 nm and more or less independent of the ionic strength [
82]. The micelle radius determined by Hjelm
et al. [
69] was 2.5 nm. Based on DLS measurements the hydrodynamic radius in the mixed micellar range was ≈1.5 nm and independent of the ionic strength, confirming the SANS data.
Figure 10.
SANS (small angle neutron scattering) distributions for the solubilisation of DPPC liposomes (6 mM) by various amounts of NaDC in 0.1 M NaCl, pH 7.4 at 60 ºC. (A) cNaDC = 1.5 mM, (B) cNaDC = 3.5 mM, (C) cNaDC = 5.5 mM, (D) cNaDC = 7.5 mM, and (E) cNaDC = 10 mM.
Figure 10.
SANS (small angle neutron scattering) distributions for the solubilisation of DPPC liposomes (6 mM) by various amounts of NaDC in 0.1 M NaCl, pH 7.4 at 60 ºC. (A) cNaDC = 1.5 mM, (B) cNaDC = 3.5 mM, (C) cNaDC = 5.5 mM, (D) cNaDC = 7.5 mM, and (E) cNaDC = 10 mM.
Influence of temperature
The influence of temperature over a temperature range between 20 and 60 °C was investigated for POPC and SPC. In this temperature range SPC stays in the liquid crystalline phase, because the main phase transition temperature of SPC is at Tm ≈ -15 °C and for POPC at Tm ≈ -3 °C.
The transfer enthalpies are negative for the transfer of detergent monomers from the aqueous to the lipid phase (
Figure 3). Increasing the temperature induces in general more negative transfer enthalpies. The difference is maximal for the system NaDC/SPC dispersed in 100 mM NaCl (
pH 7.5) with Δ
HT(30 °C) = -2.1 kJ·mol
-1 and Δ
HT(60 °C) = -7.3 kJ·mol
-1.
When the ΔHT data are compared, at the same temperature, for SPC and POPC, it becomes obvious that much more negative data are obtained for POPC. The reason for this seems to be the different fatty acid composition and distribution of the lipid (see below).
The temperature dependency of Δ
HT allows the calculation of the change of heat capacity Δ
Cp = (∂Δ
HT / ∂
T)
p, if a linear decrease in the transfer enthalpies as a function of temperature is assumed. The data are summarised in
Table 5.
Table 5.
Change of the heat capacity ΔCp for SPC and POPC detergent systems at low and high ionic strength.
Table 5.
Change of the heat capacity ΔCp for SPC and POPC detergent systems at low and high ionic strength.
| Detergent | Buffer | ΔCp / J·K-1·mol-1 |
|---|
| | | SPC | POPC |
| NaC | Water, pH 7.5 | -29 | -46 |
| NaC | 100 mM NaCl, pH 7.5 | -37 | -91 |
| NaDC | Water, pH 7.5 | ≈0 | -105 |
| NaDC | 100 mM NaCl, pH 7.5 | -175 | -302 |
The temperature dependence of the transfer enthalpies origins from a negative Δ
Cp, which is observed when hydrophobic surfaces exposed to water are reduced [
54,
76]. This is the case by transferring detergent monomers from the aqueous phase into the apolar lipid phase. In most cases, the Δ
Cp data are more negative for NaDC compared to NaC. An increase of the ionic strength makes Δ
Cp data more negative (
Table 5).
The comparison of the Δ
Cp data for the partitioning of detergent monomers in a lipid phase with the Δ
Cp data for the partitioning of detergent monomers in a micellar phase show strong differences. For the micellisation process of NaC and NaDC Δ
Cp data ranges between -260 and -360 J·K
-1·mol
-1. Due to the fact that the Δ
Cp data are more negative for the micellisation process, it can be stated that a change in exposed apolar surface area to water is smaller by transferring bile salt monomers into membranes compared to micelles. However, it has to be considered that a partial compensation of this effect may occur, because apolar parts of the lipid molecule may be further exposed to water due to the incorporation of monomer molecules, and thus perturbing the lipid organisation in the bilayer membrane [
76].
With increasing temperature the partition coefficient Pav for SPC decreases slightly, however this trend depends on the fatty acid composition of the membrane. The effect on temperature on the solubilisation process shows that higher amounts of detergents are required when the temperature is raised, which is due to the fact that the coexistence region is reached at higher detergent concentrations for the solubilisation experiment. The width of the coexistence range, however, is quite similar and more or less only slightly temperature dependent. The Re# data show a similar tendency with temperature and with salt for both lipid systems.
Influence of the phospholipid chain length of PC liposomes
The required detergent amount for membrane solubilisation is considerably lower for lipid membranes with shorter chains compared to the same lipid with longer acyl chains. This is even obvious for an acyl chain difference of just two methylene units. Comparing DMPC (C14-PC) and DPPC (C16-PC) shows that for DMPC the slopes of the phase boundaries are smaller and identical for both phase boundaries (
Re# ≈ 0.065). This means the amount of detergent in the mixed vesicles and micelles is lower for phosphatidylcholines with shorter (C14) acyl chains compared to lipid analogue with longer acyl chains (C16). The reason for this behaviour lies in the fact that lipids with short hydrocarbon chains form much more easier surfaces with positive curvatures as they occur in micelles, compared to lipids with longer acyl chains [
87,
88,
89,
90,
91].
Influence of the saturation degree of the acyl chains of the membrane
In order to get more insight with regards to the influence of the saturation degree of the acyl chains three different lipid systems with similar acyl chain lengths were investigated: DPPC (synthetic lipid, both acyl chains saturated), POPC (synthetic lipid, one acyl chain saturated, one acyl chain unsaturated) and SPC (naturally occurring lipid system with higher degree of unsaturated acyl chains in addition to higher acyl chain heterogeneity).
Comparing the SPC and POPC systems it can be stated that the phase boundaries for the solubilisation with NaC are found at higher detergent concentration for all phospholipids compared to the solubilisation with NaDC. This is due to the lower cmc of NaDC.
Decreasing the ionic strength reduces the ionic shielding effect of the polar head groups of the detergent molecules and as a consequence the phase boundaries are shifted to higher bile salt concentrations. The difference is more pronounced for POPC than for SPC.
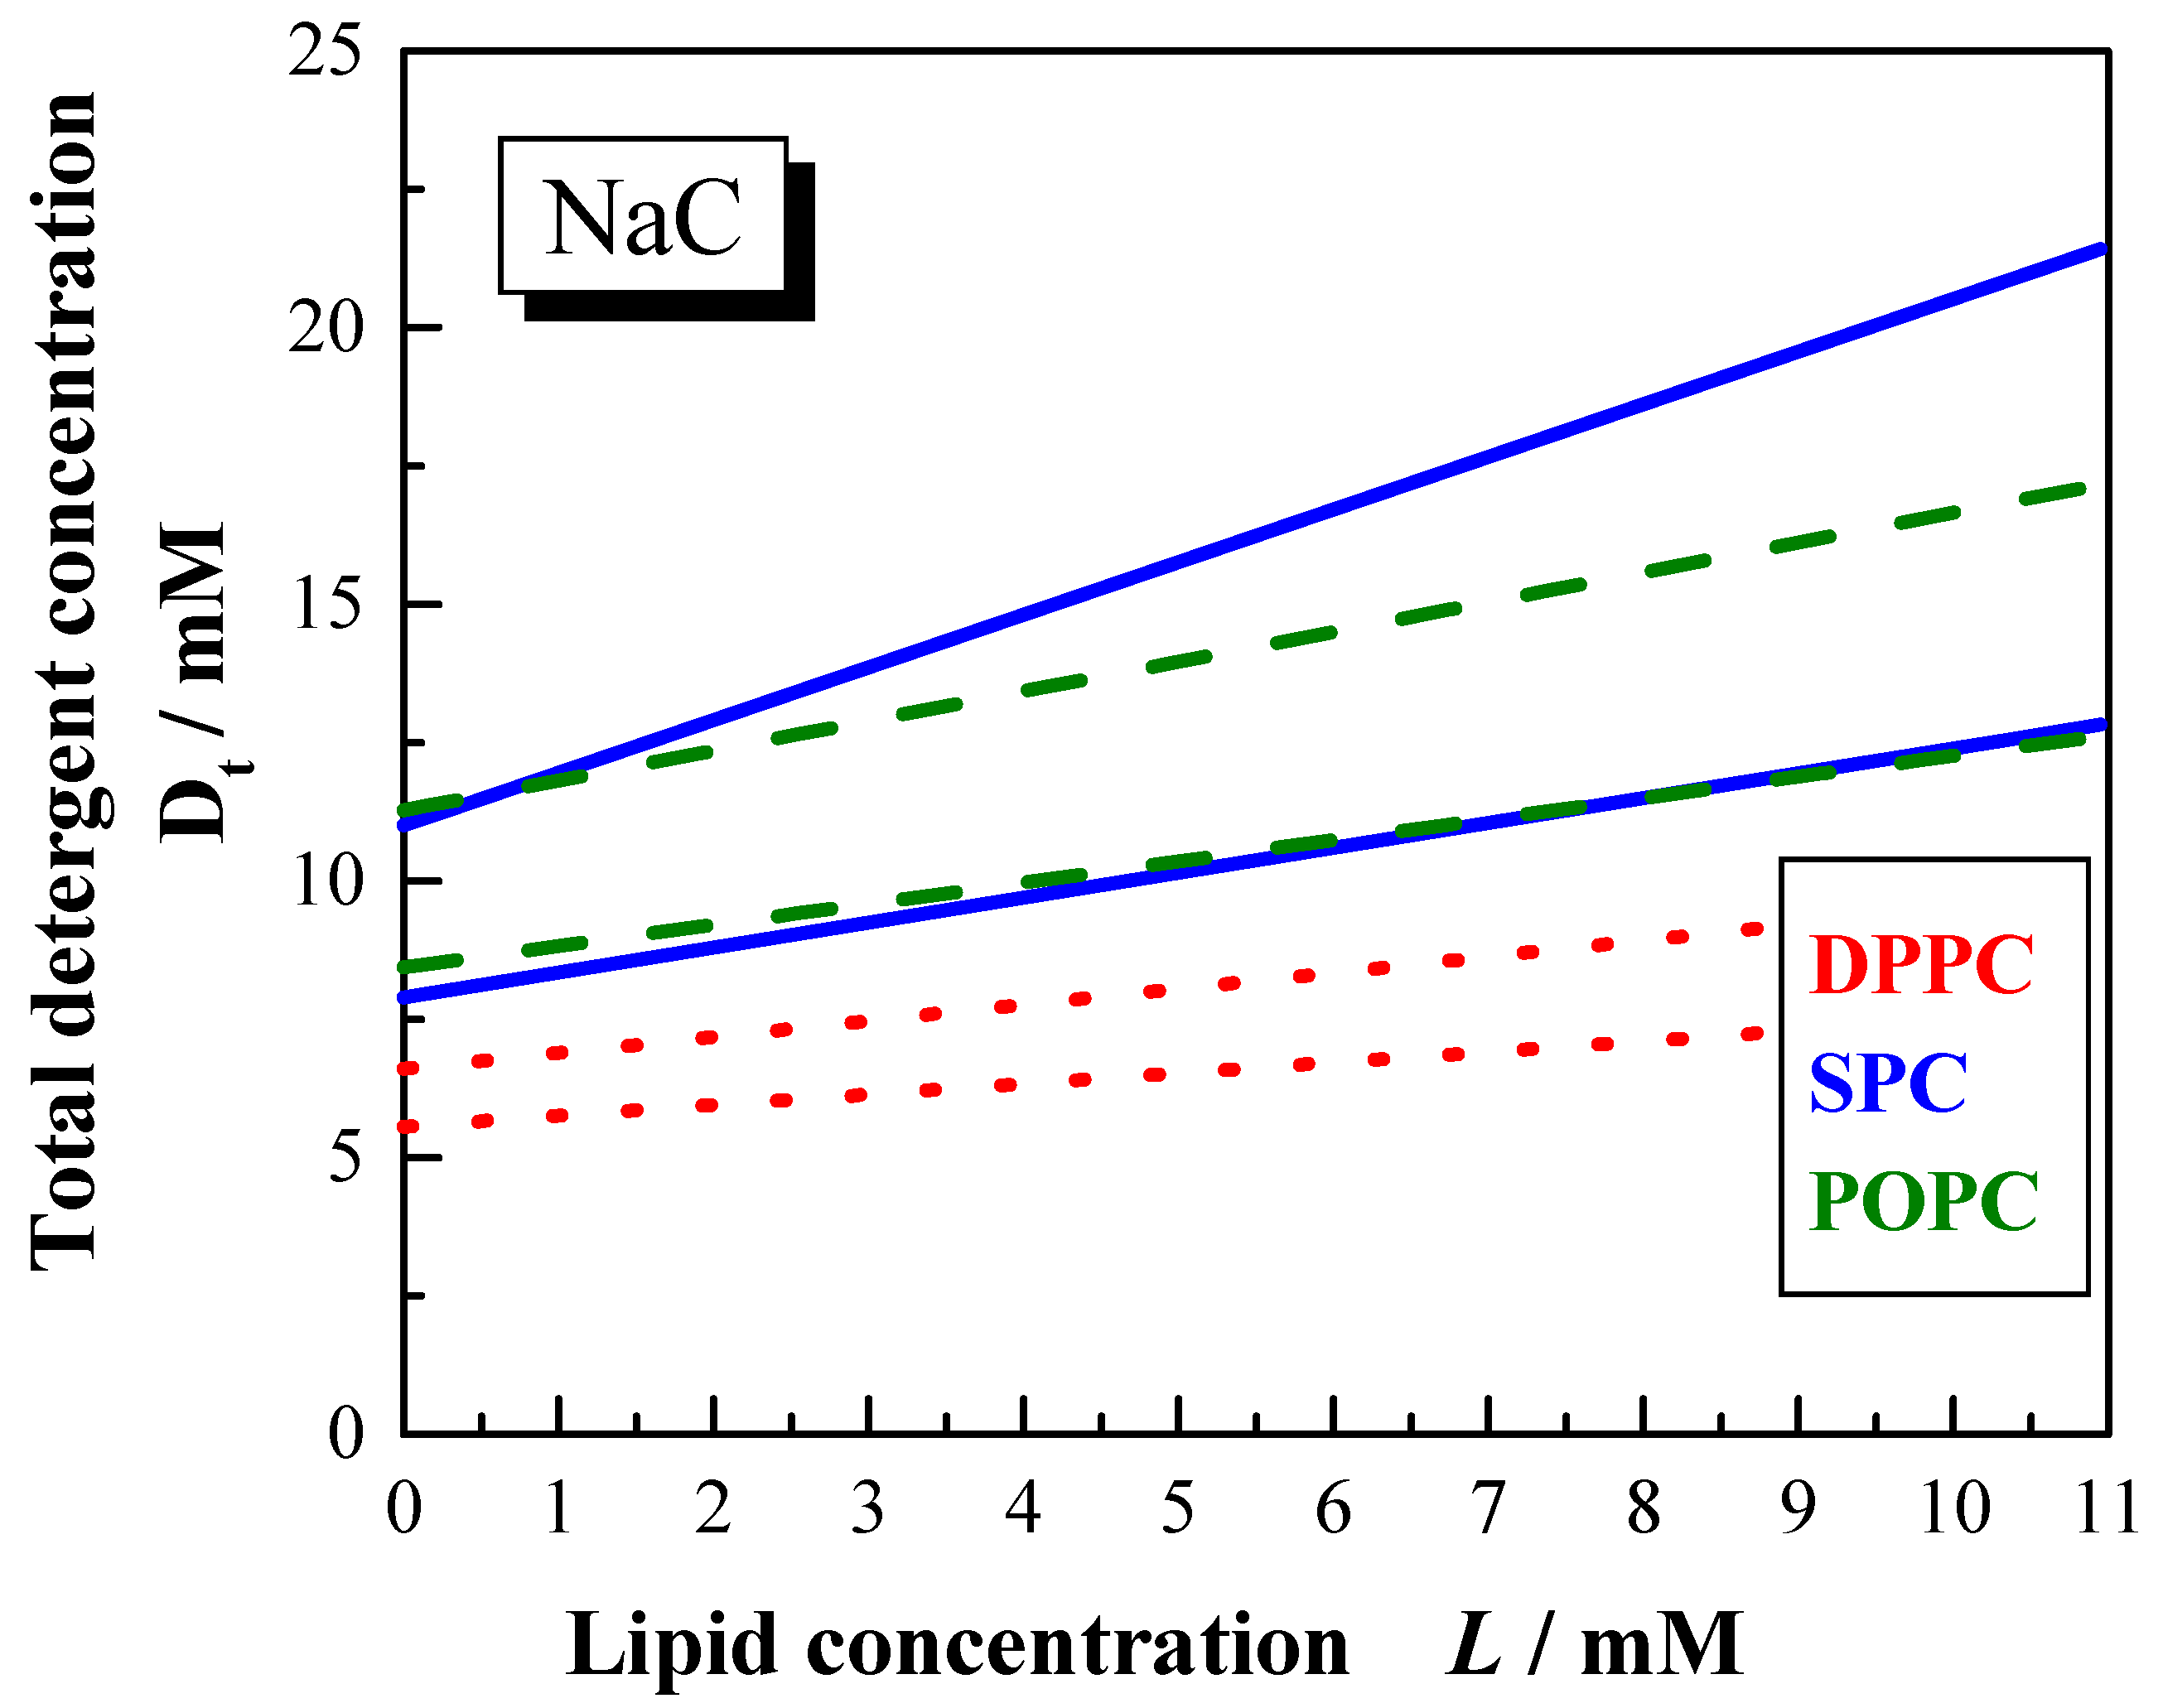
The width of the phase boundaries depends also on the saturation degree of the acyl chains (
Figure 11). For NaC mixtures in water the phase boundaries are narrower for POPC than for SPC. The solubilisation process requires higher bile salt concentrations for SPC compared to POPC, whereas for the saturation process similar detergent amounts are required. The phase boundaries for dihydroxy bile salt in water and both bile salts in 100 mM NaCl show similar positions for SPC and POPC. The
Resol values are larger for SPC compared to POPC, which implicates the mixed micelles are formed with larger amount of detergent molecules within the aggregate.
Figure 11.
Phase boundaries for the vesicle to micelle transition induced by NaC (100 mM NaCl, pH 7.5) for different lipid systems DPPC (dotted lines), POPC (dashed lines) and SPC (solid lines) at 60 °C.
Figure 11.
Phase boundaries for the vesicle to micelle transition induced by NaC (100 mM NaCl, pH 7.5) for different lipid systems DPPC (dotted lines), POPC (dashed lines) and SPC (solid lines) at 60 °C.
Dw# values obtained for the bile salt mixtures with SPC and POPC (both in 100 mM NaCl) are obviously below the cmc. For detergent to lipid mixtures dispersed in water, the Dw# values for the NaDC containing systems are in the range of the cmc and for the NaC containing systems they are higher than the cmc. This lead to the conclusion, that the charge shielding effect of the detergent molecules in 100 mM NaCl favors the disruption of the bilayer membranes. Probably, the bile salt molecules now can form multimeric aggregates in the bilayer making them unstable. This is supported by the lower Resat values obtained for solubilisation in salt solutions.
Compared to the membranolytic resistance of membranes with unsaturated acyl chains [
59], it is observed that phospholipids with saturated acyl chains [
56,
92] are more easily transformed into micelles. In other words, less detergent is required for the solubilisation of saturated bilayer membranes compared to unsaturated lipid analogues.
Figure 11 summarises the phase boundaries for the DPPC, SPC, and POPC solubilisation by NaC (60°C, 100 mM NaCl,
pH 7.5).
The detergent to lipid ratios for the saturation as well as for the solubilisation process are higher for unsaturated lipids compared to a lipid of similar chain length, however with saturated hydrocarbon chains. Furthermore, the phase boundaries are located at lower total detergent concentration. The higher susceptibility of saturated lipids for the transformation into mixed micelles is most likely due to their larger tendency for the formation of positively curved surfaces. Lipids with unsaturated acyl chains have a tendency for the formation of aggregates with negative curvature and are thus less easily transformed into aggregates with positive curvature.
Influence of the surface charge density of the membrane
The influence of the surface charge membrane density [
93] with regards to the interaction of the anionic bile salts NaC and NaDC into lipid vesicles composed of pure negatively charged DPPG or mixtures of DPPC and DPPG at molar ratios of 3:1 and 1:1 were investigated (100 mM NaCl,
pH 7.4) in the liquid crystalline phase. The obtained results clearly indicate that the partition process is dependent on the structure of the bile salt molecules; higher partition coefficient for NaDC are obtained due to its higher hydrophobicity [
62].
The results illustrate that the transfer enthalpies for partitioning of the bile salts in purely zwitterionic vesicles (DPPC) and purely negatively charged vesicles (DPPG) are almost the same, however different for the two bile salts (Δ
HT (NaC, 100 mM NaCl,
pH 7.4,
T = 60 °C) ≈ -4.2 kJ·mol
-1 and Δ
HT (NaDC, 100 mM NaCl,
pH 7.4,
T = 60 °C) ≈ -11.4 kJ·mol
-1). The partition coefficients are also very similar for the two lipid system, but different for the bile salts (
Pav (NaC, 100 mM NaCl,
pH 7.4,
T = 60 °C) ≈ 4·10
4 and
Pav (NaDC, 100 mM NaCl,
pH 7.4,
T = 60 °C) ≈ 2·10
5). Astonishingly, the surface charge density of the negatively charged lipid systems plays only a minor role [
62].
The constructed vesicle-to-micelle phase diagrams, based on ITC, reflect differences in the saturation and solubilisation processes between NaC and NaDC, as described before. The parameters of the phase transition in bile salt/phospholipid mixtures show a strong solubilising efficacy of bile salts in contrast to classical head-tail-detergents [
20,
41]. Low amounts of bile salts are required for the formation of mixed micelles. This is in agreement with DLS results.
From the solubilisation data of liposomes bearing different surface charge densities, no apparent charge effects on the vesicle-to-micelle transition could be found. The results can be understand when the curvature tendency of the mixed systems is considered. The found properties show that there is an influence of the detergent partitioning related to the spontaneous curvature of the vesicles. DPPG vesicles require lower bile salt concentrations for the solubilisation compared to DPPC vesicles, which is explained by the higher spontaneous curvature tendency of PG-liposomes. For the mixed DPPC/DPPG vesicles higher bile salt concentrations are necessary for the solubilisation than for the pure phospholipid vesicles caused by the differentiated vesicle-to-micelle transition due to the asymmetric distribution of DPPC and DPPG in the inner and outer vesicle layer. This behaviour is more pronounced for the 3:1 mixture with the higher amount of DPPC (75 w%) compared to the 1:1 mixture with only 50 w% DPPC.
Influence of the phase properties
The results presented above were all obtained with biological model membranes in the liquid crystalline phase. Under these conditions the membranes become permeable at low detergent concentrations. However, studies of the vesicle-to-micelle transition in the gel phase are not feasible using ITC or DLS, because the kinetics of detergent incorporation in the membrane is too slow. This is due to the slow flip-flop process of gel membranes [
71]. However, using another calorimetric technique, DSC, it is possible to investigate the detergent-membrane interaction [
56,
94]. Thus, it is possible to analyse it if gel phase membranes are converted to mixed micelles at similar detergent saturation concentrations as found for liquid crystalline phase membranes. Furthermore, one might get insights in the distribution of detergent molecules in liquid crystalline versus gel phase domains.
The presence of small concentrations of detergent abolish the pretransition (L
β’ → P
β’) of PC membranes [
54]. The main phase transition temperature (P
β’ → L
α) is shifted to lower temperature indicating a destabilisation of the gel phase. Increasing the amount of detergent induces the apparition of two peaks in the DSC curves. The first peak, located at lower temperature, is in general much sharper, compared to the broader second peak found at higher temperature. However, both peaks occur at lower temperature compare to the temperature of the main phase transition of the pure PC [
56].
The occurrence of the two peaks is due to the formation of gel phase and liquid crystalline phase domains which coexist over a larger temperature range. This corresponds to the results presented by Forte
et al. [
98] for taurocholate/DPPC systems.
An increase of the detergent concentration induces a broadening of the phase transition and a strong decrease of the phase transition enthalpy. The complete disappearance of the phase transition occurs at much higher detergent concentrations as necessary for the solubilisation of liquid crystalline membranes. These results reflect that less detergent is incorporated in gel phase membranes, and heating the system (as in done in the DSC experiment) induce a transformation of gel phase mixed vesicles coexisting with mixed micelles into pure mixed micelles [
56].


