Preparative Separation and Identification of the Flavonoid Phlorhizin from the Crude Extract of Lithocarpus Polystachyus Rehd

Abstract
:Introduction

Results and Discussion
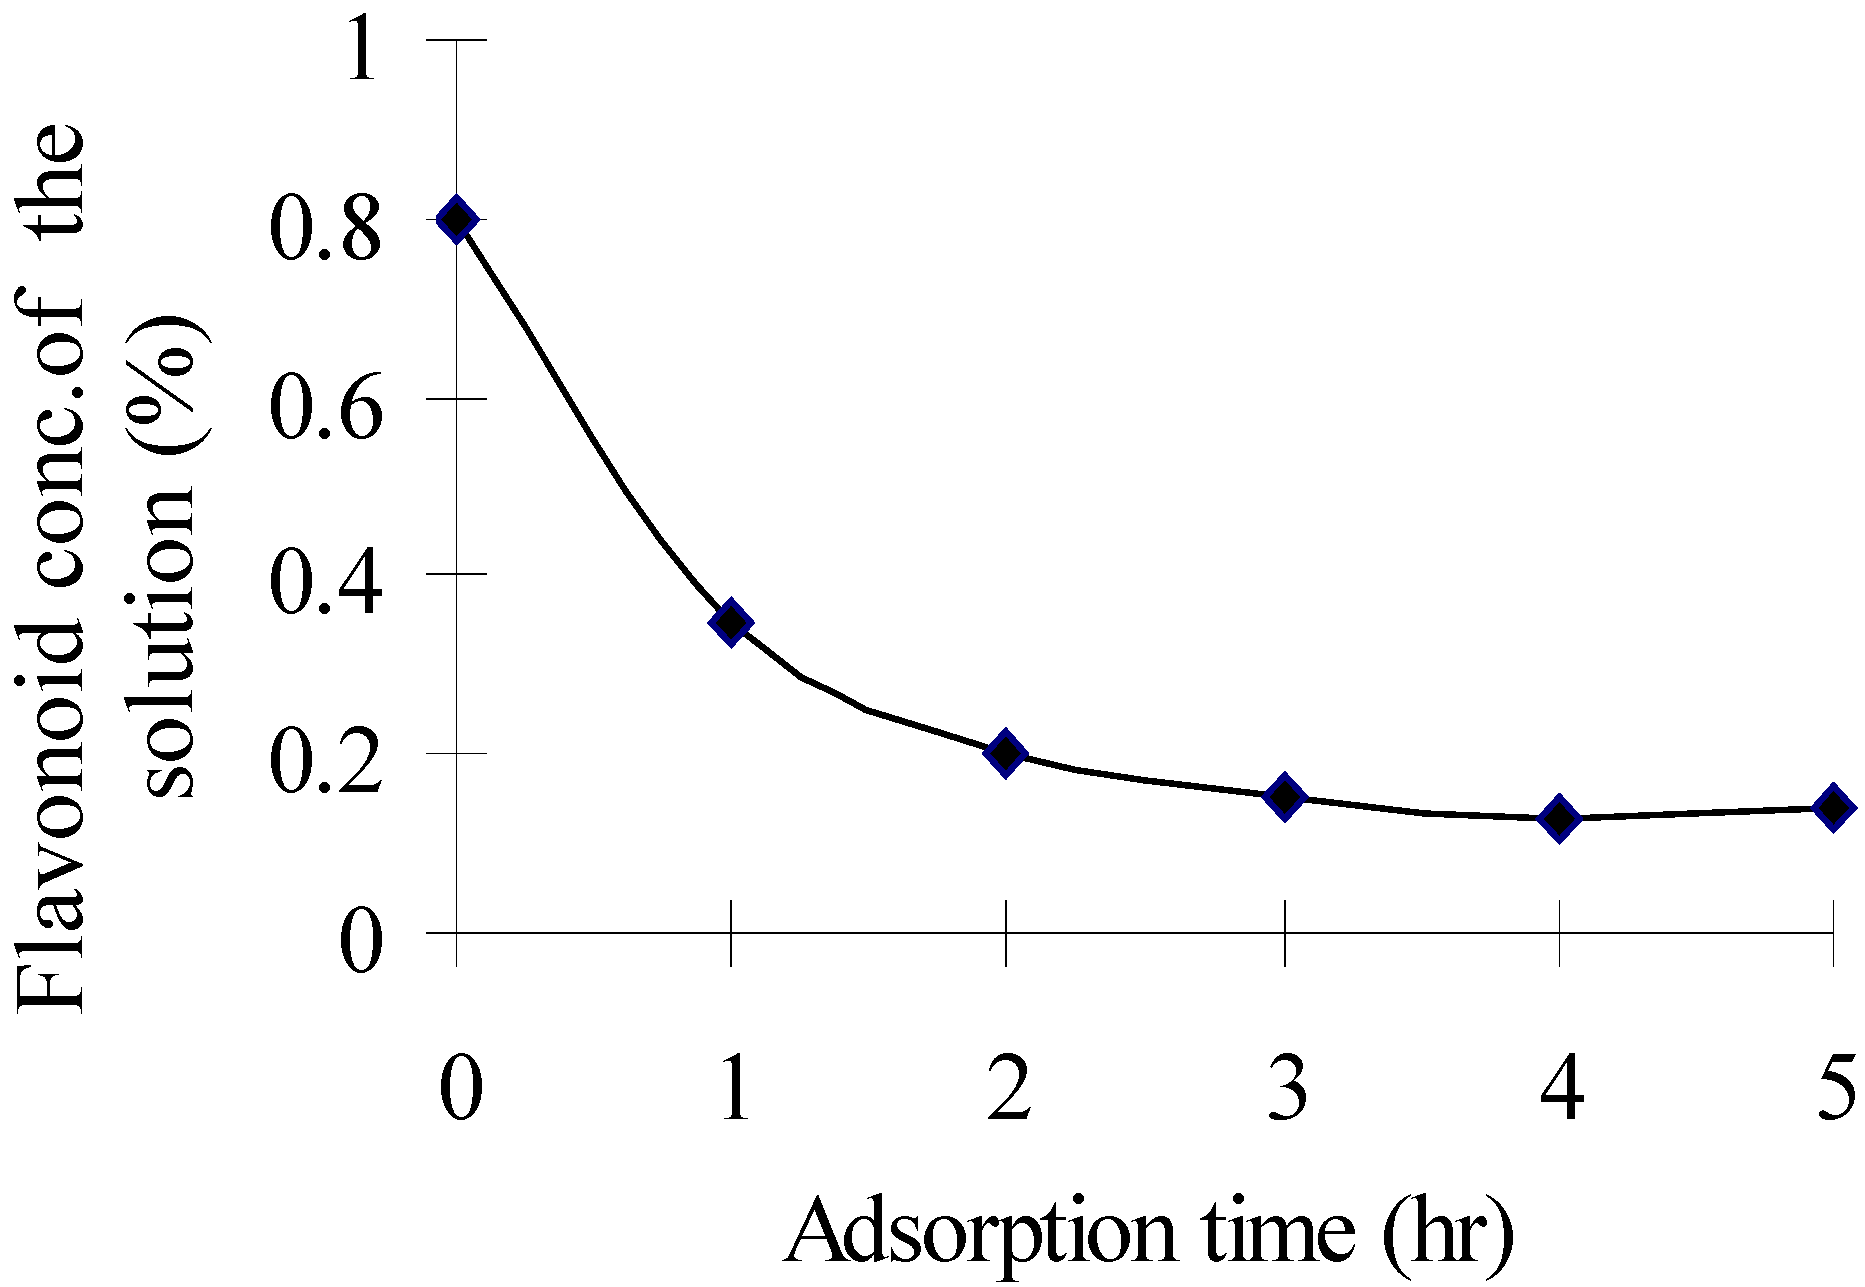
Separation of the crude extract with ADS-7 resin: effect of adsorption time
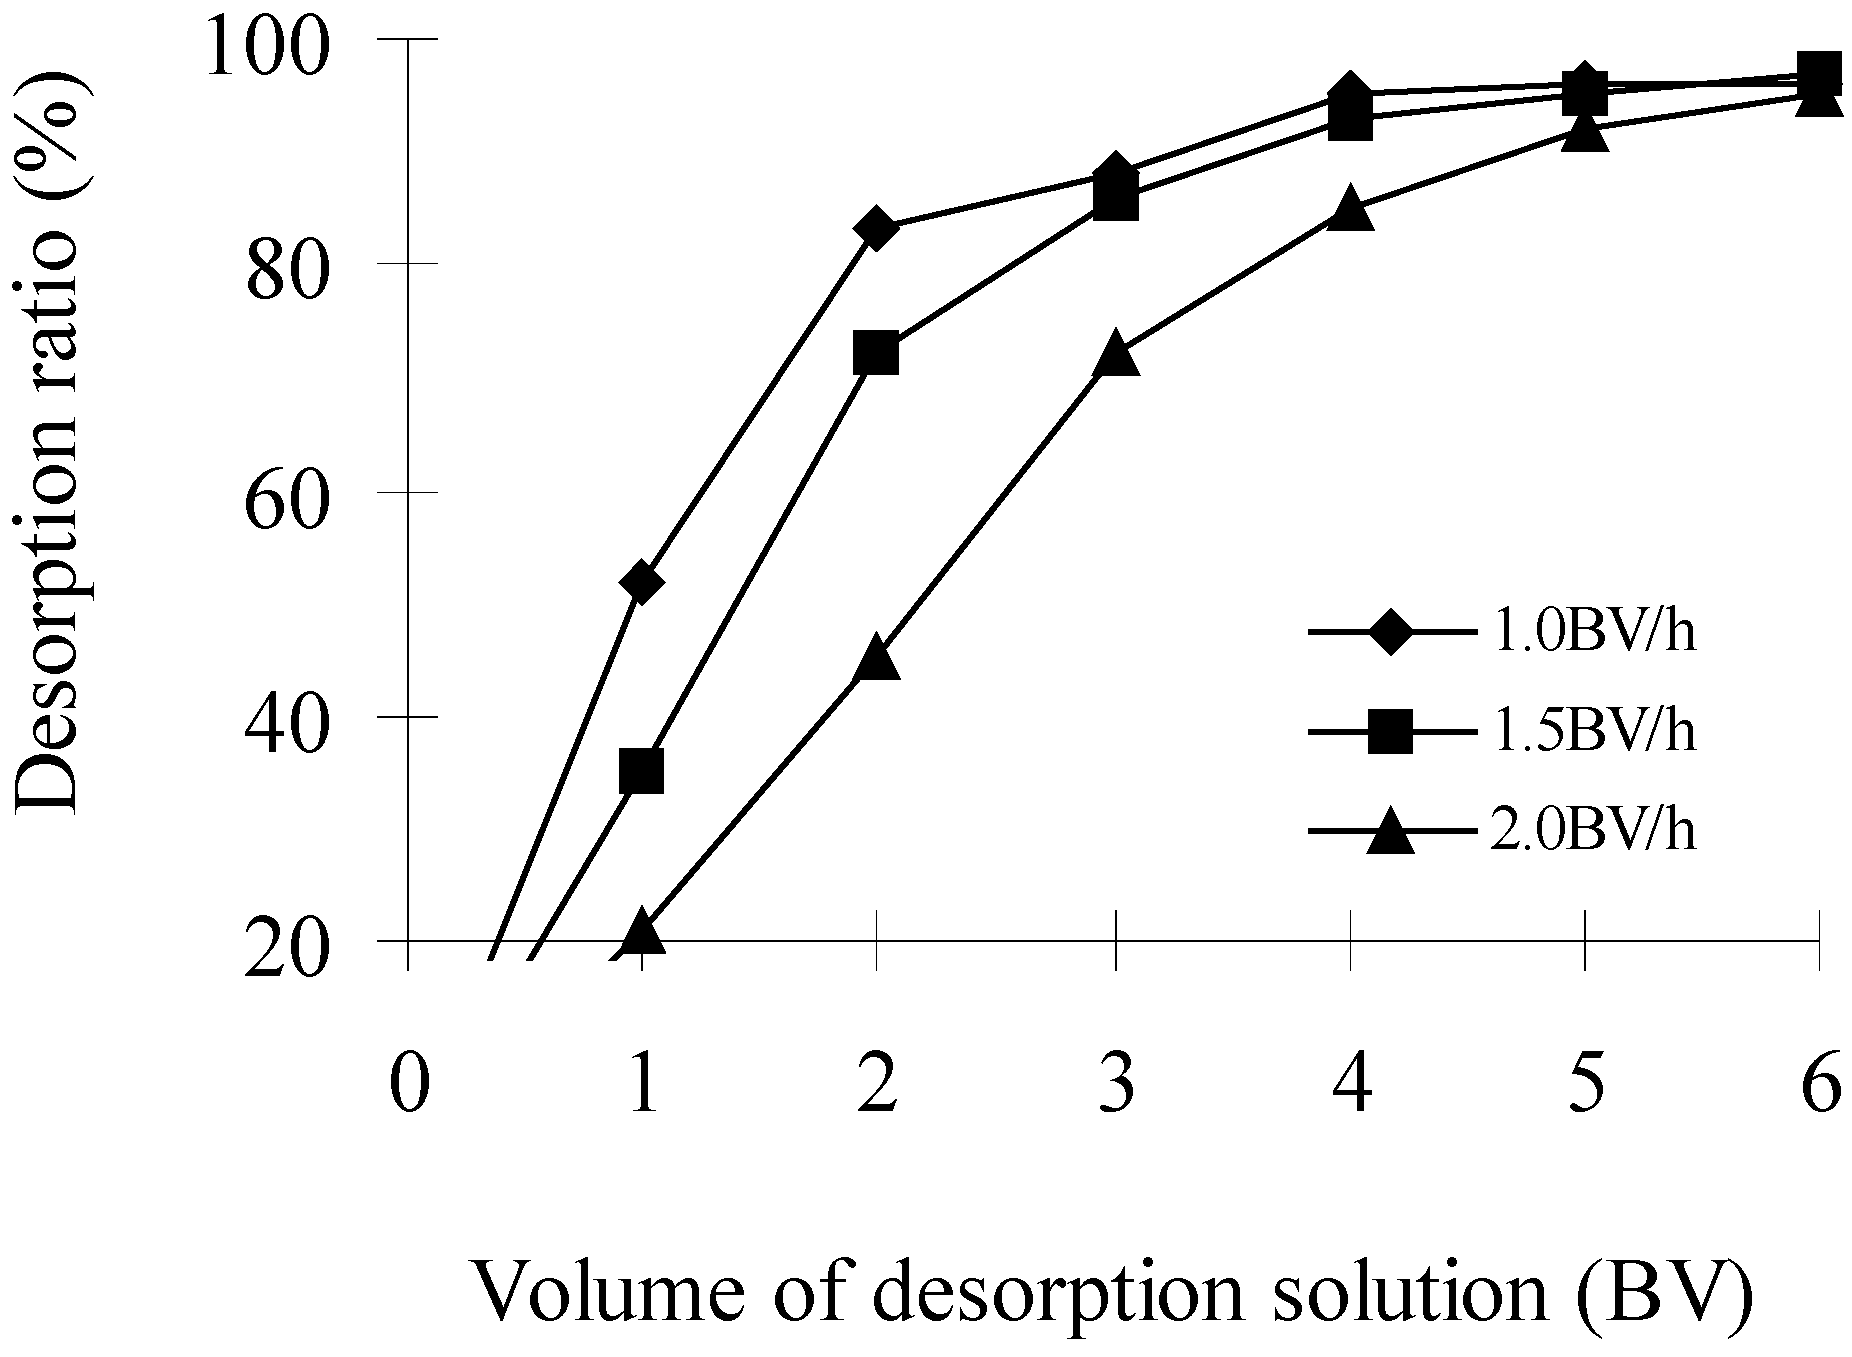
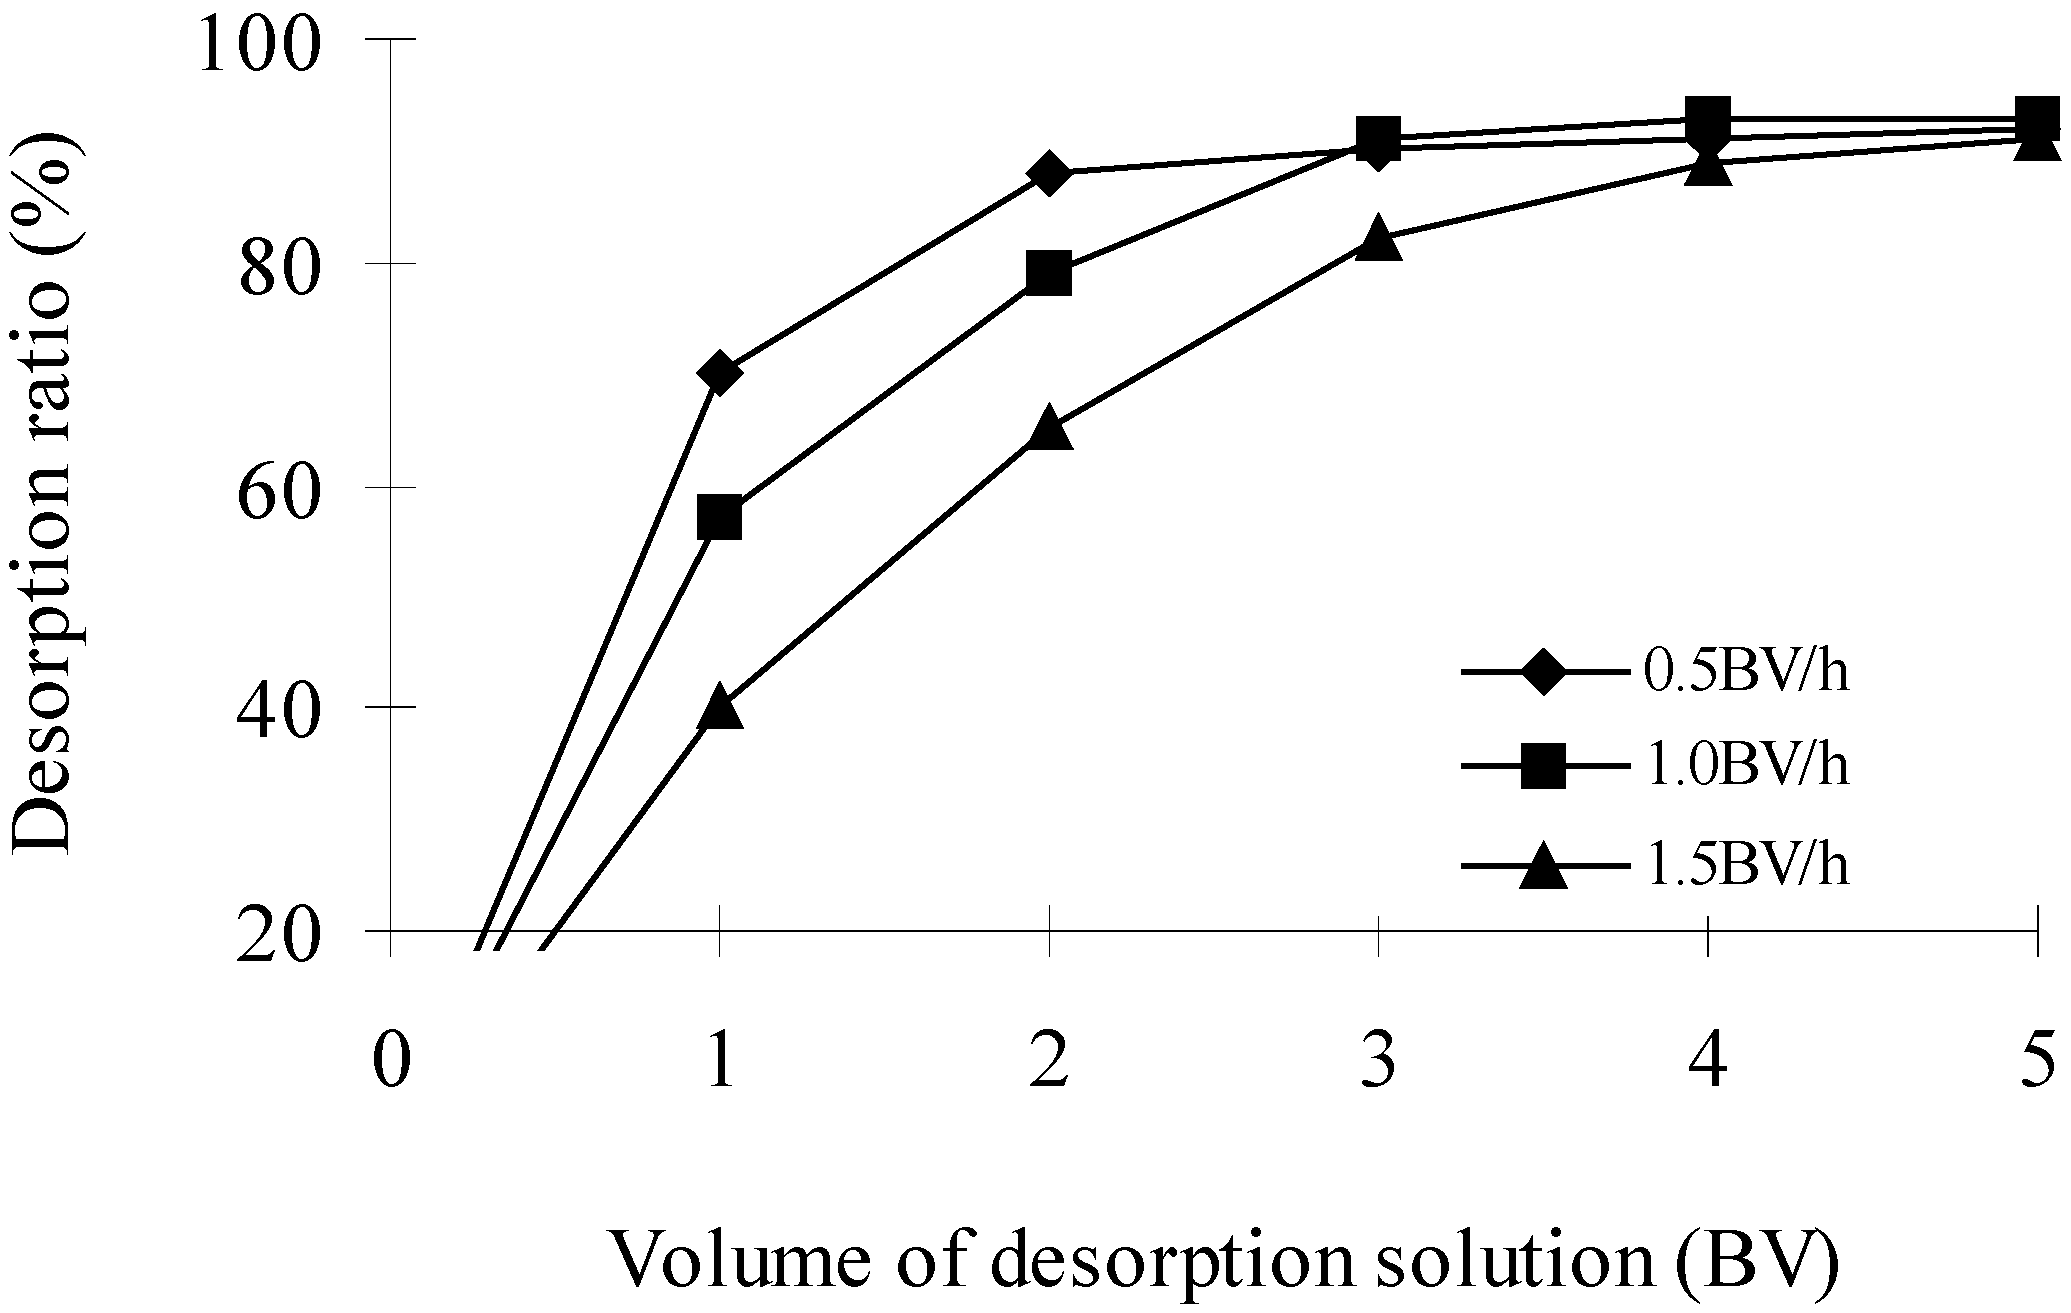
Effects of elution speed and volume of desorption solution (Bed Volume, BV) on desorption ratio (DR)

Purification of RSP by neutral alumina column
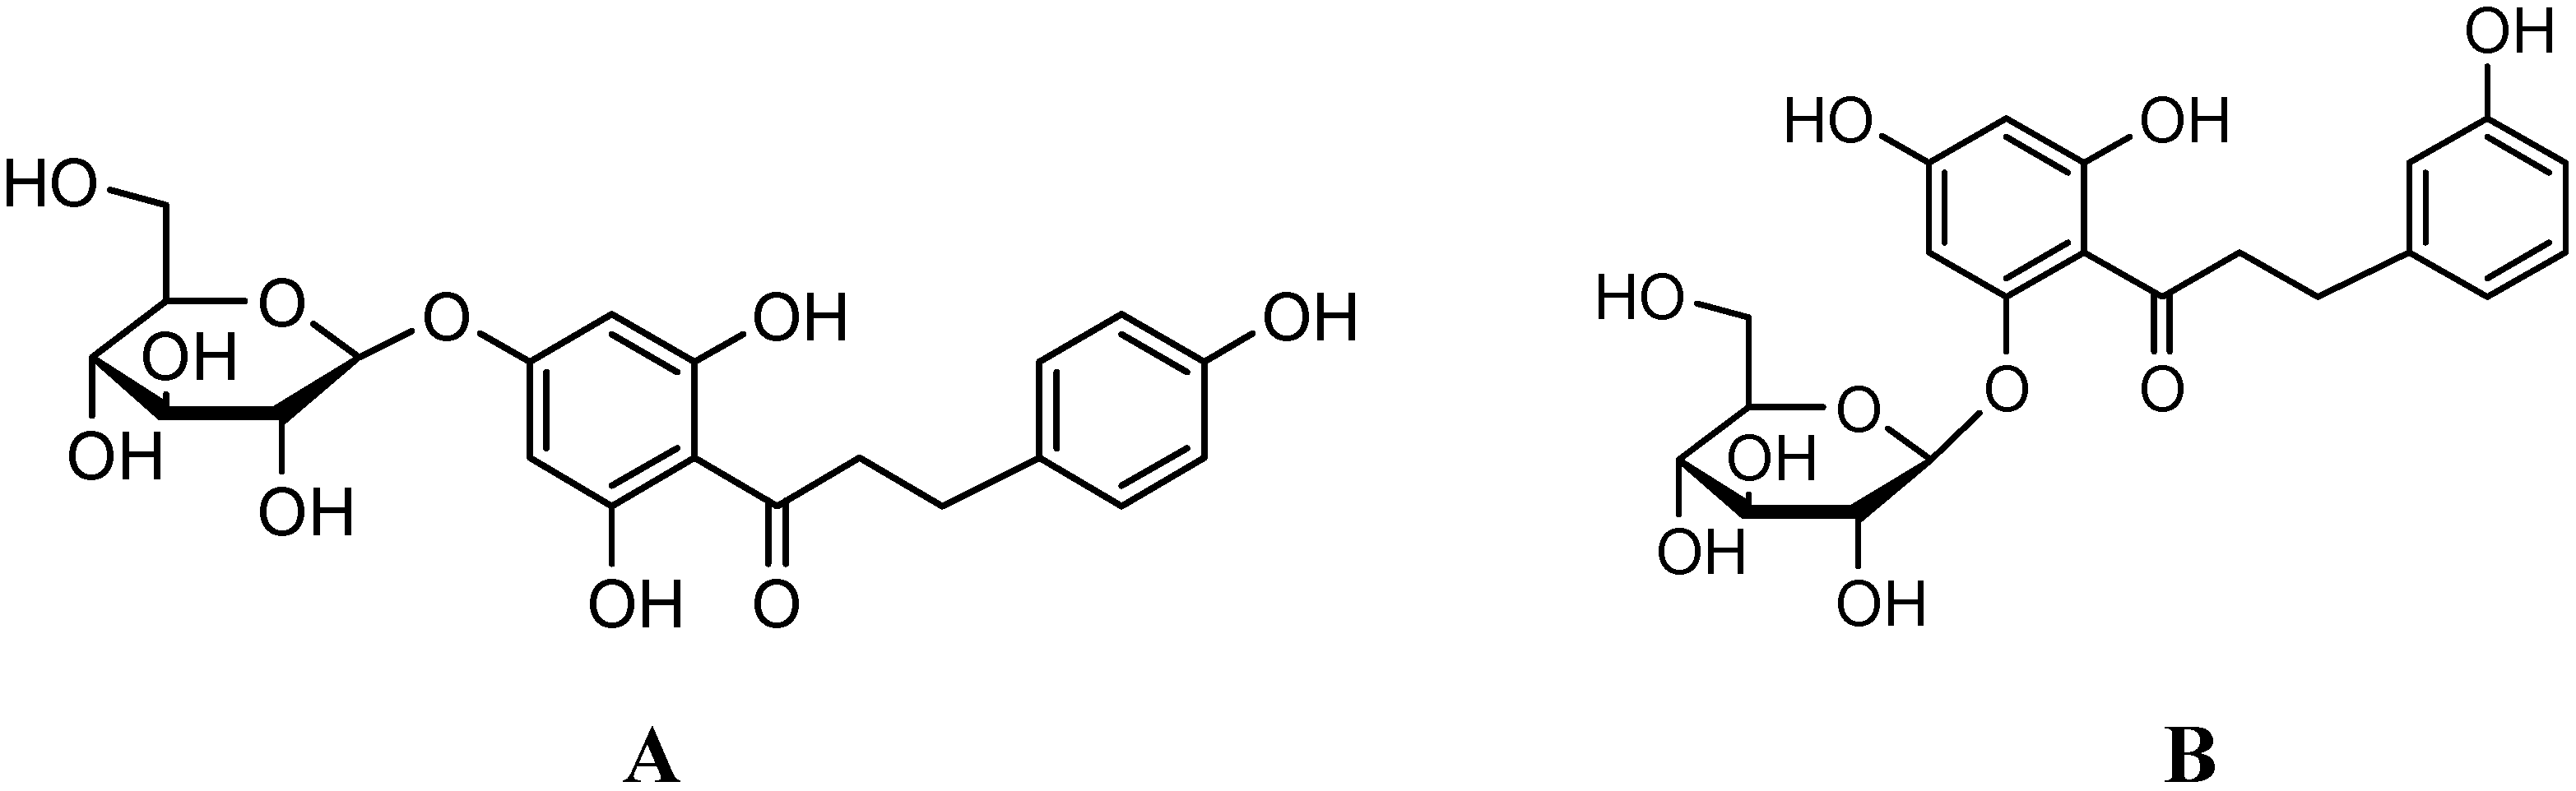
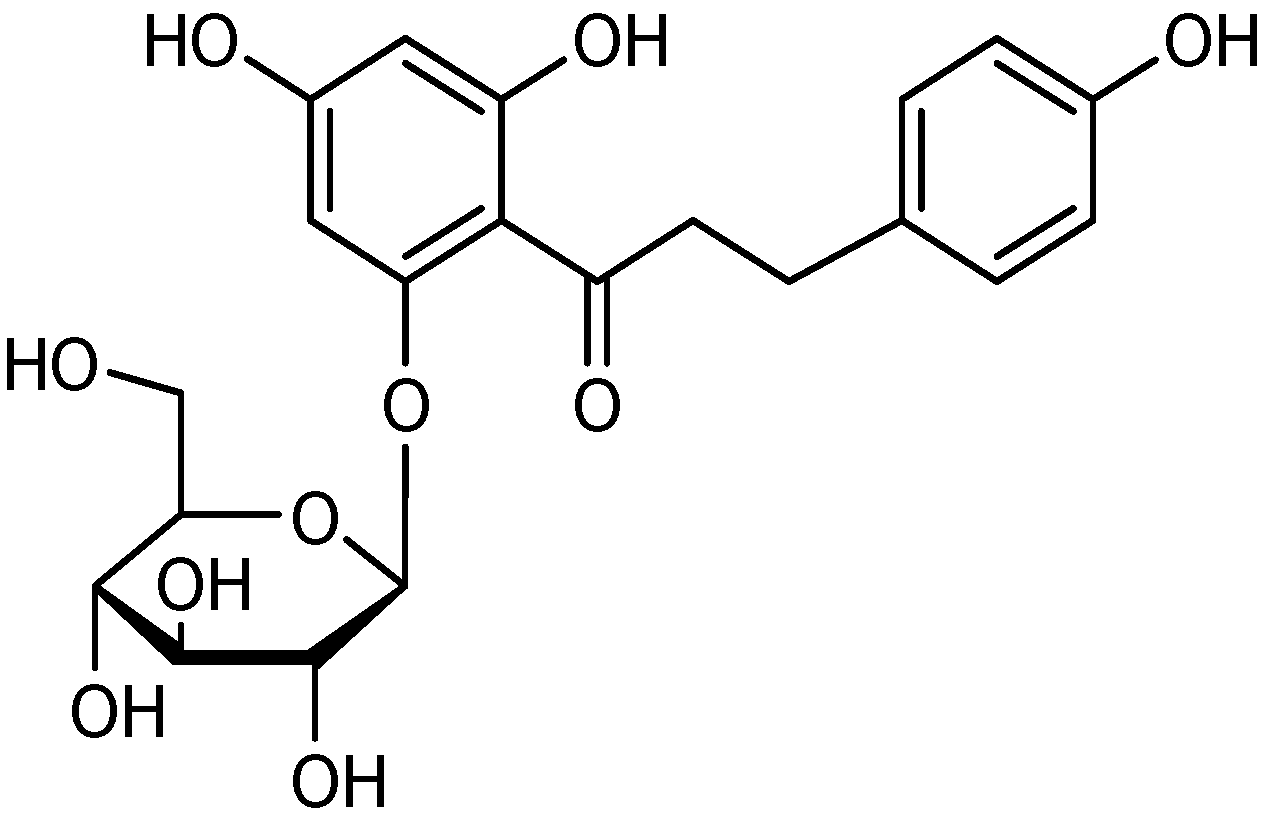
Purity and molecular identification of the target compound
TLC
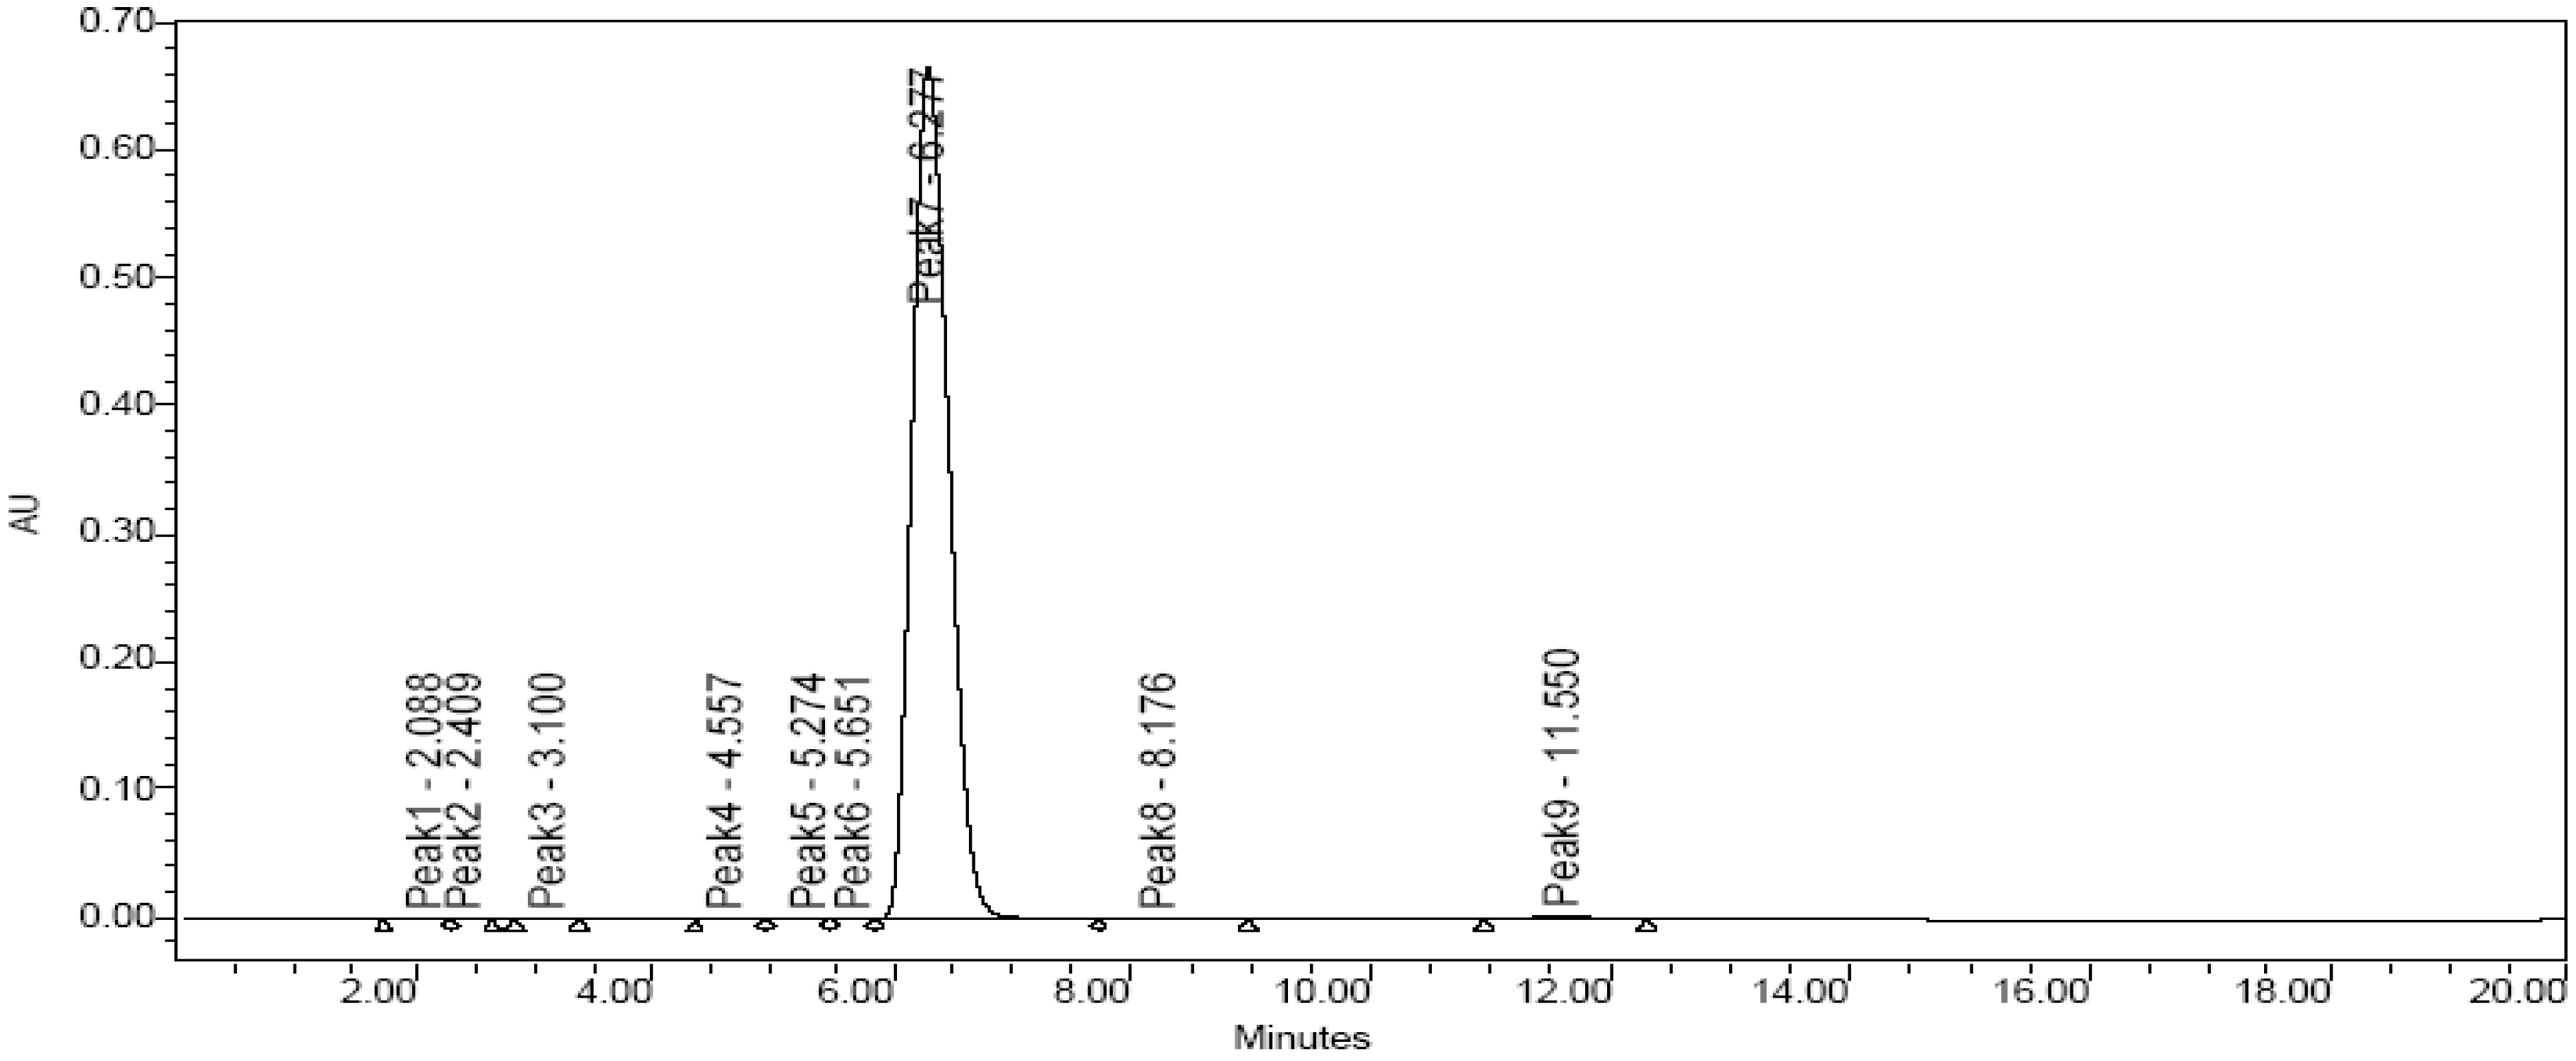
HPLC

| Peak | RT (min) | % Area | % Height |
|---|---|---|---|
| Target compound | 6.6 | 99.87 | 99.89 |
| Phlorhizin standard | 6.3 | 96.66 | 97.32 |

ESI-MS
Conclusions
Experimental
General
Crude ST extracts

Static adsorption and dynamic desorption by the resin: static adsorption
Dynamic desorption
Dynamic elution on an alumina column
Analytical methods: Determination of total flavonoid concentrations
TLC analysis
HPLC analysis
EIS-MS analysis
Acknowledgments
References
- Hutchinson, A.; Taper, C.; Towers, G. Studies of phloridzin in malus. Can. J. Med. Sci. 1959, 37, 901–910. [Google Scholar]
- Ridgway, T. Phloridzin derivatives: food additives/chemopreventative drugs of the future. Biochem. Soc. Trans. 1997, 25, 109S. [Google Scholar] [PubMed]
- Escarpa, A.; Gonzalez, M. High-performance liquid chromatography with diode-array detection for the determination of phenolic compounds in peel and pulp from different apple varieties. J. Chromatogr. 1998, 823, 331–337. [Google Scholar] [CrossRef]
- Ehrenkranz, J.R.L.; Lewis, N.G.; Kahn, C.R.; Roth, J. Phlorizin: a review. Diabetes Metab. Res. Rev. 2005, 21, 31–38. [Google Scholar] [CrossRef] [PubMed]
- Walle, T.; Walle, UK. The beta-D-glucoside and sodium-dependent glucose transporter 1 (SGLT1)-inhibitor phloridzin is transported by both SGLT1 and multidrug resistance-associated proteins 1/2. Drug Metab. Dispos. 2003, 31, 1288–1291. [Google Scholar] [CrossRef]
- Desai, SA.; Alkhalil, A.; Kang, M.; Ashfaq, U.; Nguyen, ML. Plasmodial surface anion channel-independent phloridzin resistance in Plasmodium falciparum. J. Biol. Chem. 2005, 280, 16861–16867. [Google Scholar] [CrossRef] [PubMed]
- Mandal, A; Verri, T.; Mandal, P.K.; Storelli, C.; Ahearn, GA. Expression of Na+/D-glucose cotransport in Xenopus laevis oocytes by injection of poly(A)(+) RNA isolated from lobster (Homarus americanus) hepatopancreas. Comp. Biochem. Physiol. A-Mol. Integr. Physiol. 2003, 135, 467–475. [Google Scholar]
- Dudash, J.; Zhang, X.; Zeck, R.E.; Johnson, S.G.; Cox, G.G.; Conway, B.R.; Rybczynski, P.J.; Demarest, K.T. Glycosylated dihydrochalcones as potent and selective sodium glucose co-transporter 2 (SGLT2) inhibitors. Bioorg. Med. Chem. Lett. 2004, 14, 5121–5125. [Google Scholar] [CrossRef] [PubMed]
- Ghanem, E.; Robaye, B.; Leal, T.; Leipziger, J.; Van Driessche, W.; Beauwens, R.; Boeynaems, J.M. The role of epithelial P2Y(2) and P2Y(4) receptors in the regulation of intestinal chloride secretion. Brit. J. Pharm. 2005, 146, 364–369. [Google Scholar] [CrossRef]
- McCrimmon, R.; Evans, M.; Jacob, R. AICAR and phlorizin reverse the hypoglycemia-specific defect in glucagon secretion in the diabetic BB rat. Am. J. Physiol. Endocrinol. Metab. 2002, 283, E1076–E1083. [Google Scholar] [PubMed]
- Gaisano, H.; Ostenson, C.; Sheu, L.; Wheeler, M.; Efendic, S. Abnormal expression of pancreatic islet exocytotic soluble Nethylmaleimide-sensitive factor attachment protein receptors in Got-Kakizaki rats is partially restored by phlorizin treatment and accentuated by high glucose treatment. Endocrinology 2002, 143, 4218–4226. [Google Scholar] [CrossRef] [PubMed]
- Van den Berghe, G.; Wouters, P.; Weekers, F. Intensive insulin therapy in critically ill patients. N. Engl. J. Med. 2001, 345, 1359–1367. [Google Scholar]
- Ridgway, T.; O’Reilly, J.; West, G.; Tucker, G.; Wiseman, H. Antioxidant action of novel derivatives of the apple-derived flavonoid phloridzin compared to oestrogen; relevance to potential cardioprotective action. Biochem. Soc. Trans. 1997, 106S, 25. [Google Scholar]
- Puel, C.; Quintin, A.; Mathey, J.; Obled, C.; Davicco, M. J.; Lebecque, P.; Kati-Coulibaly, S.; Horcajada, M.N.; Coxam, V. Prevention of Bone Loss by Phloridzin, an Apple Polyphenol, in Ovariectomized Rats under Inflammation Conditions. Calcif. Tiss. Int. 2005, 77, 311–318. [Google Scholar] [CrossRef]
- Hall, J.T.; Reilly, R.T.; Cottrill, K.L.; Stone, W.S.; Gold, P.E. Phlorizin enhancement of memory in rats and mice. Pharmacol. Biochem. Behav. 1992, 41, 295–299. [Google Scholar] [CrossRef]
- Boccia, M.M.; Kopf, S.R.; Baratti, C.M. Phlorizin, a competitive inhibitor of glucose transport, facilitates memory storage in mice. Neurobiol. Learn. Mem. 1999, 71, 104–112. [Google Scholar] [CrossRef] [PubMed]
- Ugocsai, K; Varga, A; Molnar, P; Antus, S; Molnar, J. Effects of selected flavonoids and carotenoids on drug accumulation and apoptosis induction in multidrug-resistant colon cancer cells expressing MDR1/LRP. In Vivo 2005, 19, 433–438. [Google Scholar]
- Veeriah, S; Kautenburger, T; Habermann, N; Sauer, J; Dietrich, H; Will, F; Pool-Zobel, BL. Apple flavonoids inhibit growth of HT29 human colon cancer cells and modulate expression of genes involved in the biotransformation of xenobiotics. Mol. Carcinogen. 2006, 45, 164–174. [Google Scholar]
- China Pharmacopoeia Committee. Pharmacopoeia of the People’s Republic of China 1999, (first part of the 2000 edition). 327–329.
- Su, X.; Chen, Z.; Jiao, B.; Huang, Q.; Li, W. Isolation and identification of active anti-allergic constituents in Lithocarpus polystachyus Rehd. J. Southwest Agric. Univ. 2000, 22, 419–420. [Google Scholar]
- Li, W.; Li, R; Nai, Z.; Na, X.; Su, X.; Chen, Z. Studies on Active Anti-allergic Constituents in Lithocarpus polystachyus (Wall) Rehd. J. Yunnan Univ. 2001, 23, 461–463. [Google Scholar]
- Zhou, W.; Shui, G.; Tian, Z. Study on sweet components of Hunan Sweet Tea. Food Sci. 1992, 13, 17–19. [Google Scholar]
- Nie, R.; Tanaka, T.; Zhou, J.; Tanaka, O. Plorizin and Trilobatin, Sweet Dihydrochalcone- Glucosides from leaves of Lithocarpus litseifolius (Hance) Rehd. (Fagaceae). Agri. Biol. Chem. 1982, 46, 1933–1934. [Google Scholar]
- Wang, R.; Li, H.; Zhang, L.; Xiong, Y. Studies on the Constant Components and the Stability of Pigment of Hunan Wild Tiancha. J. Hunan Agic. Univ. 1996, 22, 456–460. [Google Scholar]
- Xiao, K.; Liao, X. Isolation and Structural Identification of a Flavonoid from Lithocarpus polysachy Rehd. Chem. Ind. Forest Prod. 2006, 26, 85–87. [Google Scholar]
- Xiao, K.; Liao, X.; Cui, Y.; Ren, C. Study on the new extraction methods of the flavonoids in Lithocarpus Polysachyus Rehd. Food Sci. 2004, 25, 113–115. [Google Scholar]
- Liu, Z.; Yan, G.; Bu, F. Several microwave assisted extraction methods for extraction of active constituents from Acanthopanax Senticosus Harms. Chin. J. Anal. Chem. 2005, 33, 531–534. [Google Scholar]
- Sample Availability: Contact the authors.
© 2007 by MDPI (http://www.mdpi.org). Reproduction is permitted for noncommercial purposes.
Share and Cite
Dong, H.; Ning, Z.; Yu, L.; Li, L.; Lin, L.; Huang, J. Preparative Separation and Identification of the Flavonoid Phlorhizin from the Crude Extract of Lithocarpus Polystachyus Rehd. Molecules 2007, 12, 552-562. https://doi.org/10.3390/12030552
Dong H, Ning Z, Yu L, Li L, Lin L, Huang J. Preparative Separation and Identification of the Flavonoid Phlorhizin from the Crude Extract of Lithocarpus Polystachyus Rehd. Molecules. 2007; 12(3):552-562. https://doi.org/10.3390/12030552
Chicago/Turabian StyleDong, Huaqiang, Zhengxiang Ning, Lijing Yu, Lin Li, Lichao Lin, and Jianbo Huang. 2007. "Preparative Separation and Identification of the Flavonoid Phlorhizin from the Crude Extract of Lithocarpus Polystachyus Rehd" Molecules 12, no. 3: 552-562. https://doi.org/10.3390/12030552