Antioxidant Capacities and Phenolic Levels of Different Varieties of Serbian White Wines

Abstract
:
1. Introduction
2. Results and Discussion
2.1. Total phenolic and flavonoid contents

| Wine and vintage | TPa | TFb | TF/TP |
|---|---|---|---|
| (mg GAE/L) | (mg CE/L) | ||
| Zapadnomoravski wine region | |||
| Graševina (2007) | 268.8 ± 8.0 b | 46.50 ± 1.16 a | 0.17 |
| Smederevka (2007) | 238.3 ± 6.6 a | 45.30 ± 1.29 a | 0.19 |
| Chardonnay (2007) | 253.8 ± 7.8 ab | 46.29 ± 1.43 a | 0.18 |
| Terra Lazarica-Chardonnay (2007) | 358.0 ± 10.2 dc | 65.00 ± 1.86 c | 0.18 |
| Međaš beli (2007) | 420.6 ±12.0 e | 81.32 ± 2.36 d | 0.19 |
| Župski Riesling (2003) | 380.0 ± 12.1 d | 63.99 ± 1.92 c | 0.17 |
| Car Konstantin-Semillon (2003) | 261.5 ± 7.8 ab | 48.25 ± 1.38 a | 0.18 |
| Banat wine region | |||
| Traminac (2004) | 270.2 ± 7.9 b | 50.02 ± 1.55 a | 0.18 |
| Banatski Riesling (2007) | 330.2 ± 9.4 c | 56.29 ± 1.66 b | 0.17 |
| Muscat Ottonel (2007) | 252.0 ± 7.5 ab | 47.88 ± 1.35 a | 0.18 |
2.2. Total flavonoid content
| Country | TP (mg GAE/L) | Reference |
|---|---|---|
| Croatia | 161–431 (n = 15) | [8] |
| Croatia | 301–402 (n = 4) | [9] |
| Croatia | 231–273 (n = 2) | [25] |
| Croatia | 191–652 (n = 3) | [26] |
| Greece | 162–286 (n = 12) | [5] |
| Greece | 213–277 (n = 5) | [27] |
| Greece | 267 (n = 1) | [13] |
| Spain | 89–407 (n = 17) | [10] |
| Spain | 178–293(n = 5) | [28] |
| Italy | 170–260 (n = 16) | [29] |
| Italy | 96–146 (n = 3) | [30] |
| Chech Republic | 103–125 (n = 7) | [31] |
| South Africa | 242–292 (n = 4) | [13] |
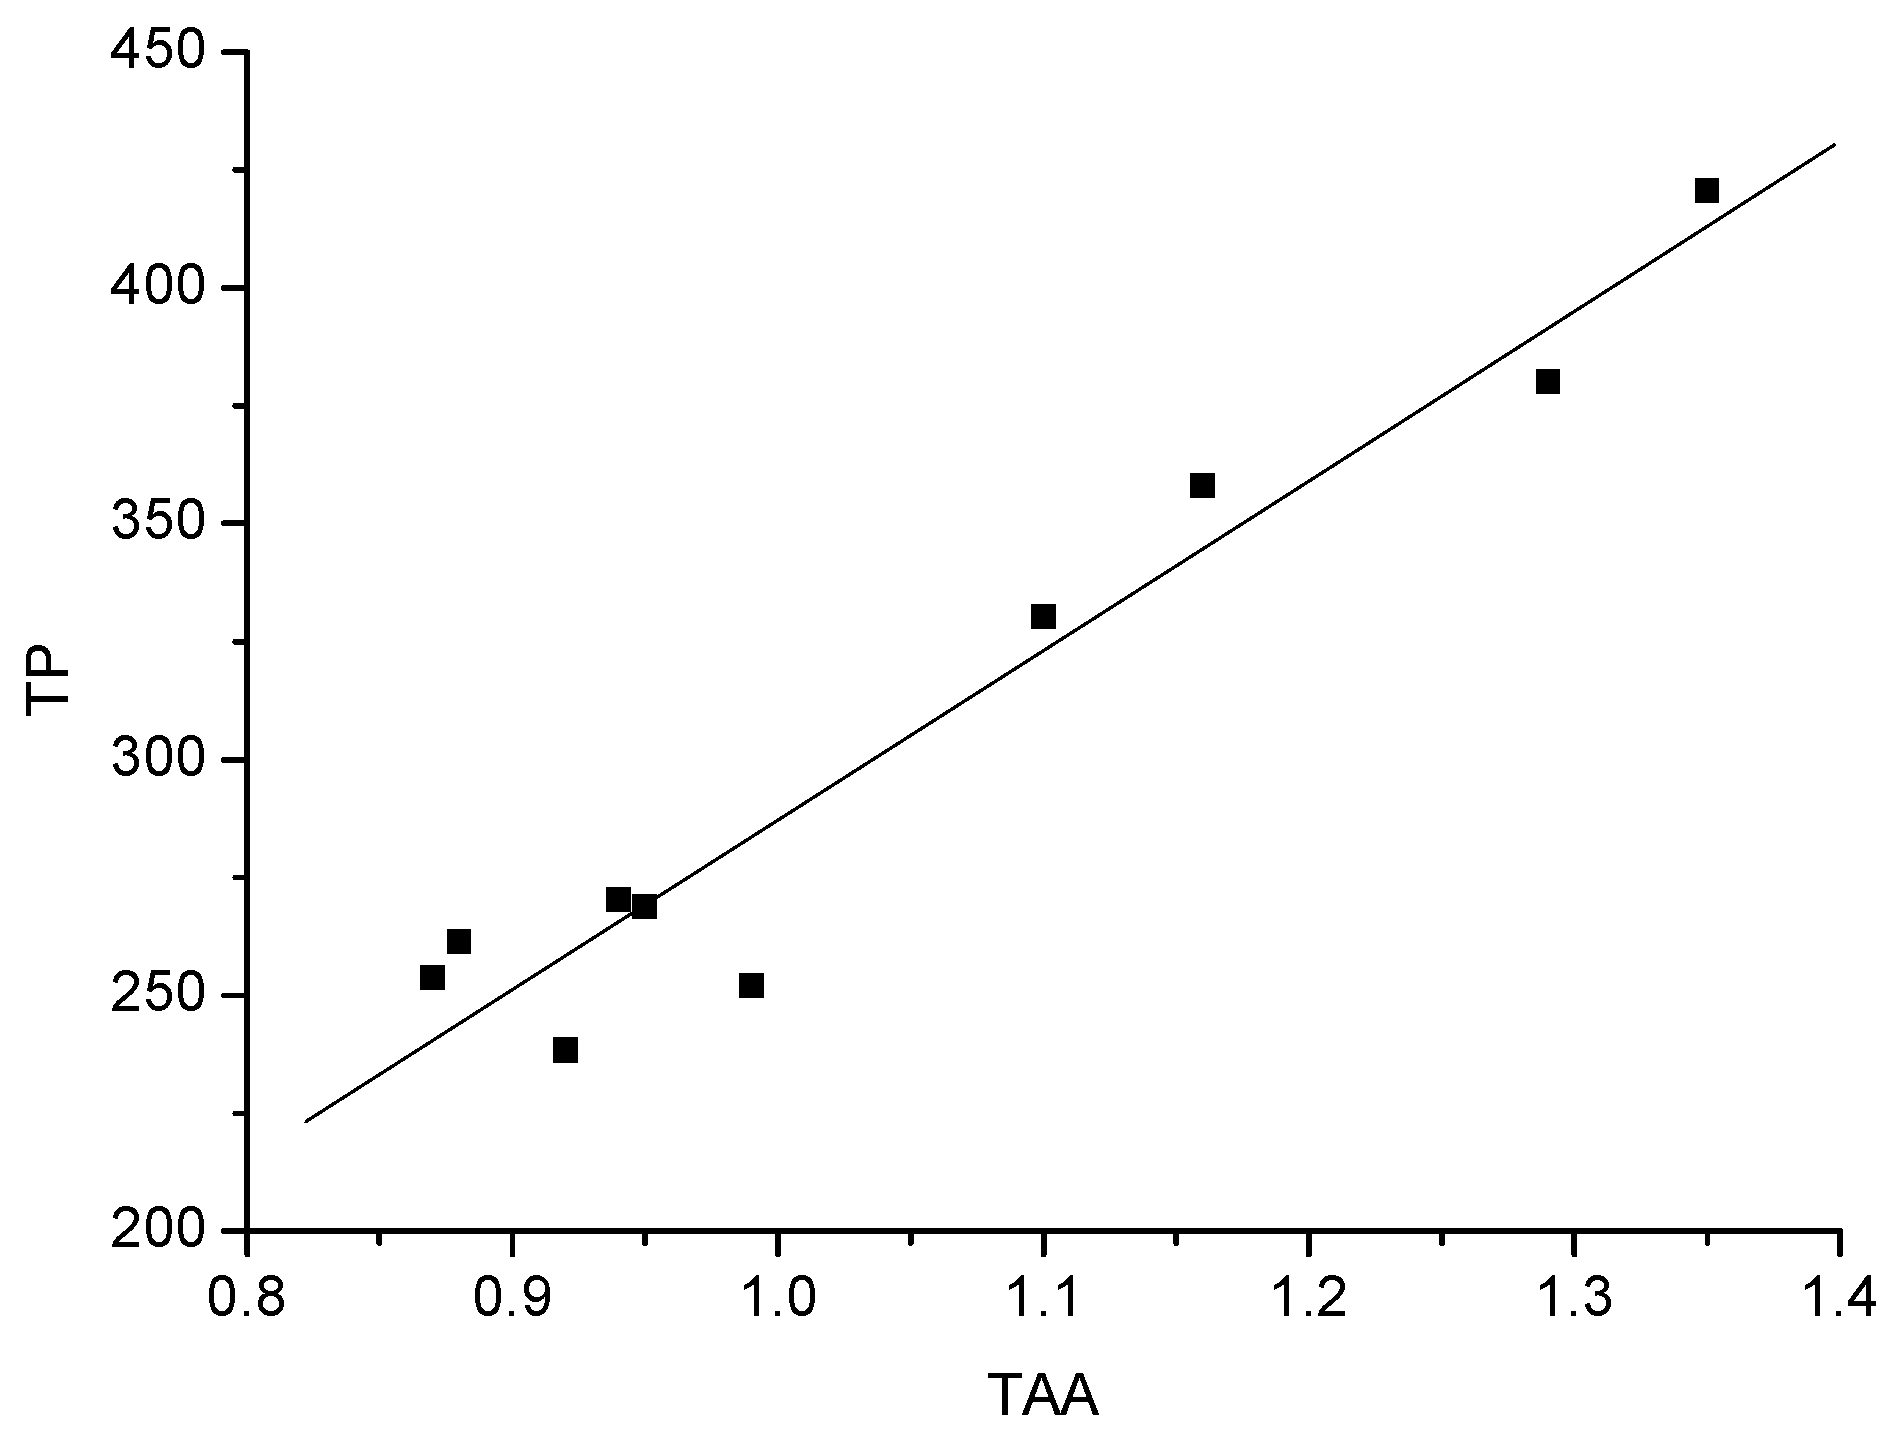
2.3. Total antioxidant activity of wines using the DPPH scavenging assays
| Wine and vintage | RSC (%) | TAAa (mM TE/L) |
|---|---|---|
| Zapadnomoravski wine region | ||
| Graševina (2007) | 14.00 | 0.95 ± 0.02 a,b |
| Smederevka (2007) | 13.50 | 0.92 ± 0.03 a |
| Chardonnay (2007) | 12.73 | 0.87 ± 0.03 a |
| Terra Lazarica-Chardonnay (2007) | 16.30 | 1.16 ± 0.05 c,d |
| Međaš beli (2007) | 19.05 | 1.35 ± 0.06 e |
| Župski Riesling (2003) | 18.64 | 1.29 ± 0.03 d,e |
| Car Konstantin-Semillon (2003) | 12.83 | 0.88 ± 0.03 a |
| Banat wine region | ||
| Traminac (2004) | 13.82 | 0.94 ± 0.05 a |
| Banatski Riesling (2007) | 16.04 | 1.10 ± 0.04 b,c |
| Muscat Ottonel (2007) | 14.95 | 0.99 ± 0.06 a,b |


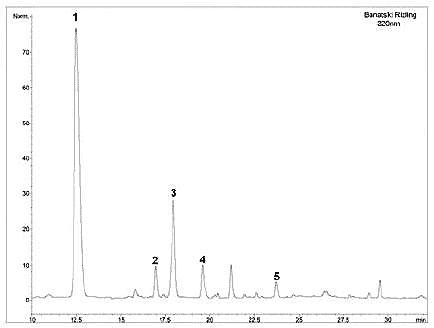
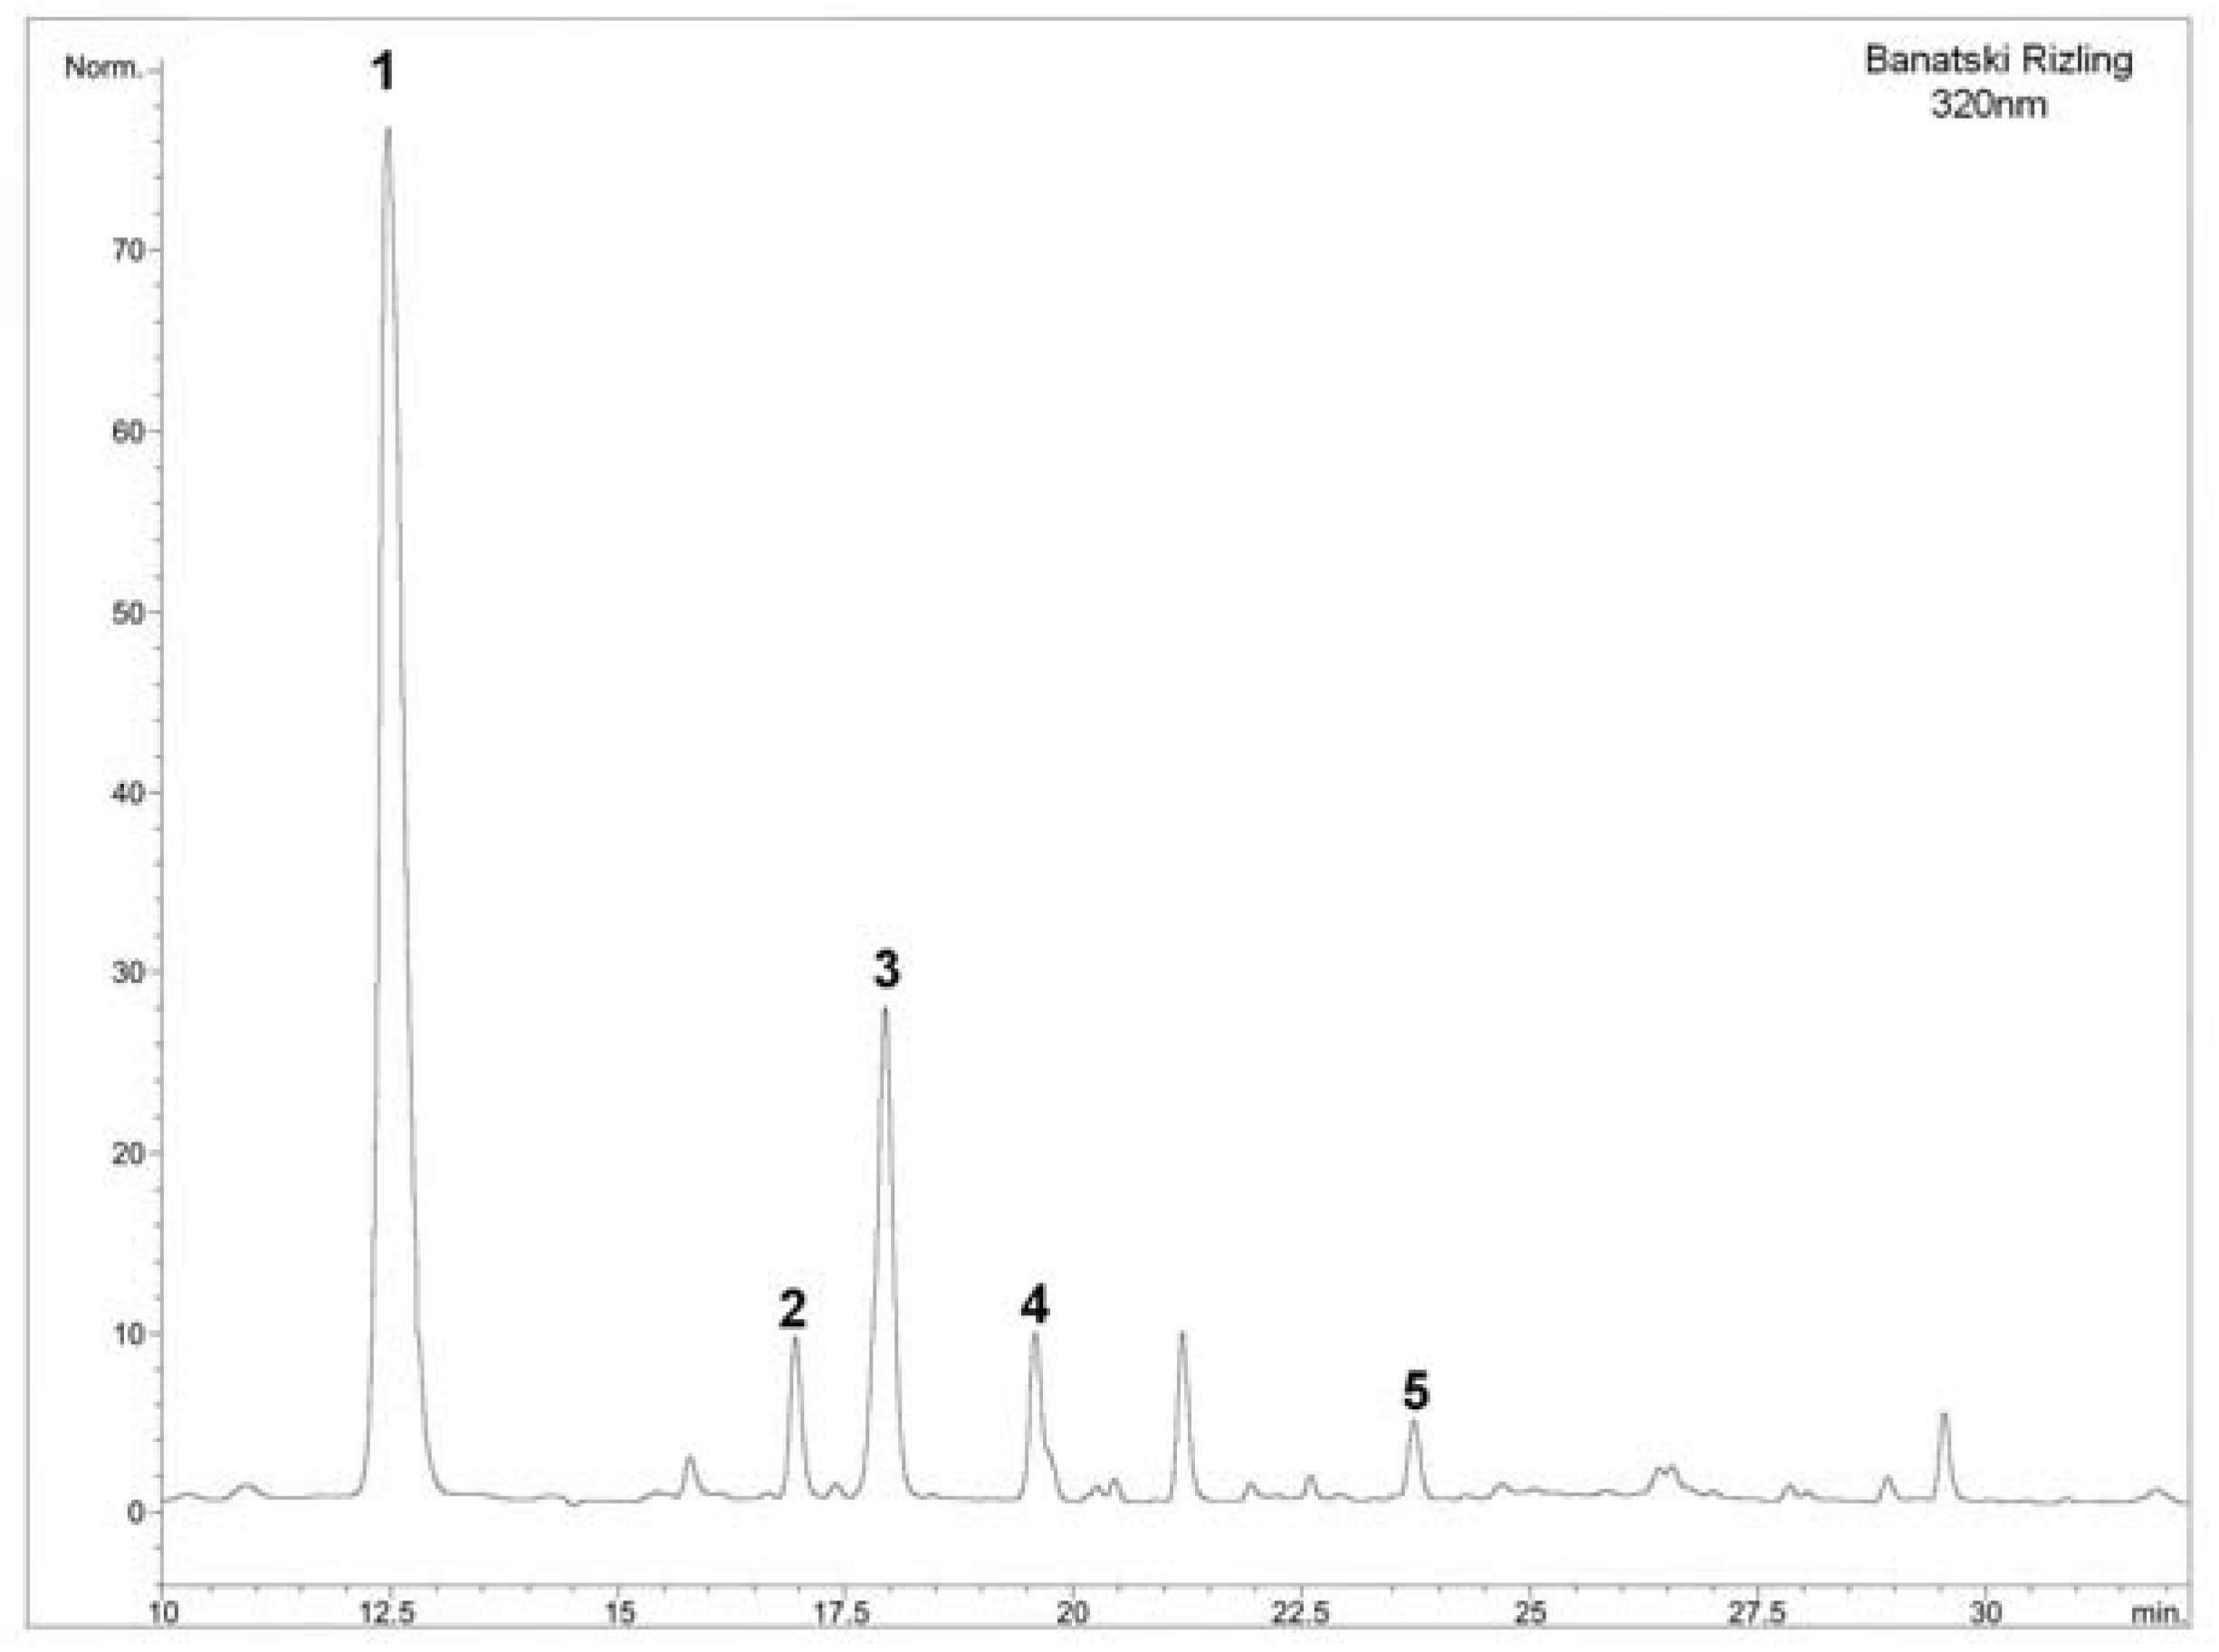
2.4. HPLC analysis

| Chardonnay | Banatski Riesling | Graševina | Traminac | Semillon | |
|---|---|---|---|---|---|
| (2007) | (2007) | (2007) | (2004) | (2003) | |
| Caffeic acid | 1.57 ± 0.18 | 3.39 ± 0.65 | 2.27 ± 0.82 | 7.70 ± 0.98 | 3.88 ± 0.80 |
| p-coumaric acid | nd | 0.62 ± 0.09 | 0.71 ± 0.08 | 2.02 ± 0.65 | 1.72 ± 0.06 |
| trans-caftaric acid | 14.71 ± 1.1 | 43.53 ± 1.5 | 21.96 ± 1.2 | 7.56 ± 0.85 | nd |
| trans-coutaric acid | 2.66 ± 0.74 | 5.74 ± 0.76 | 3.71 ± 0.90 | 1.36 ± 0.53 | 1.21 ± 0.22 |
| GRP | 1.13 ± 0.15 | 2.39 ± 0.35 | nd | 1.91 ± 0.48 | 4.14 ± 0.52 |
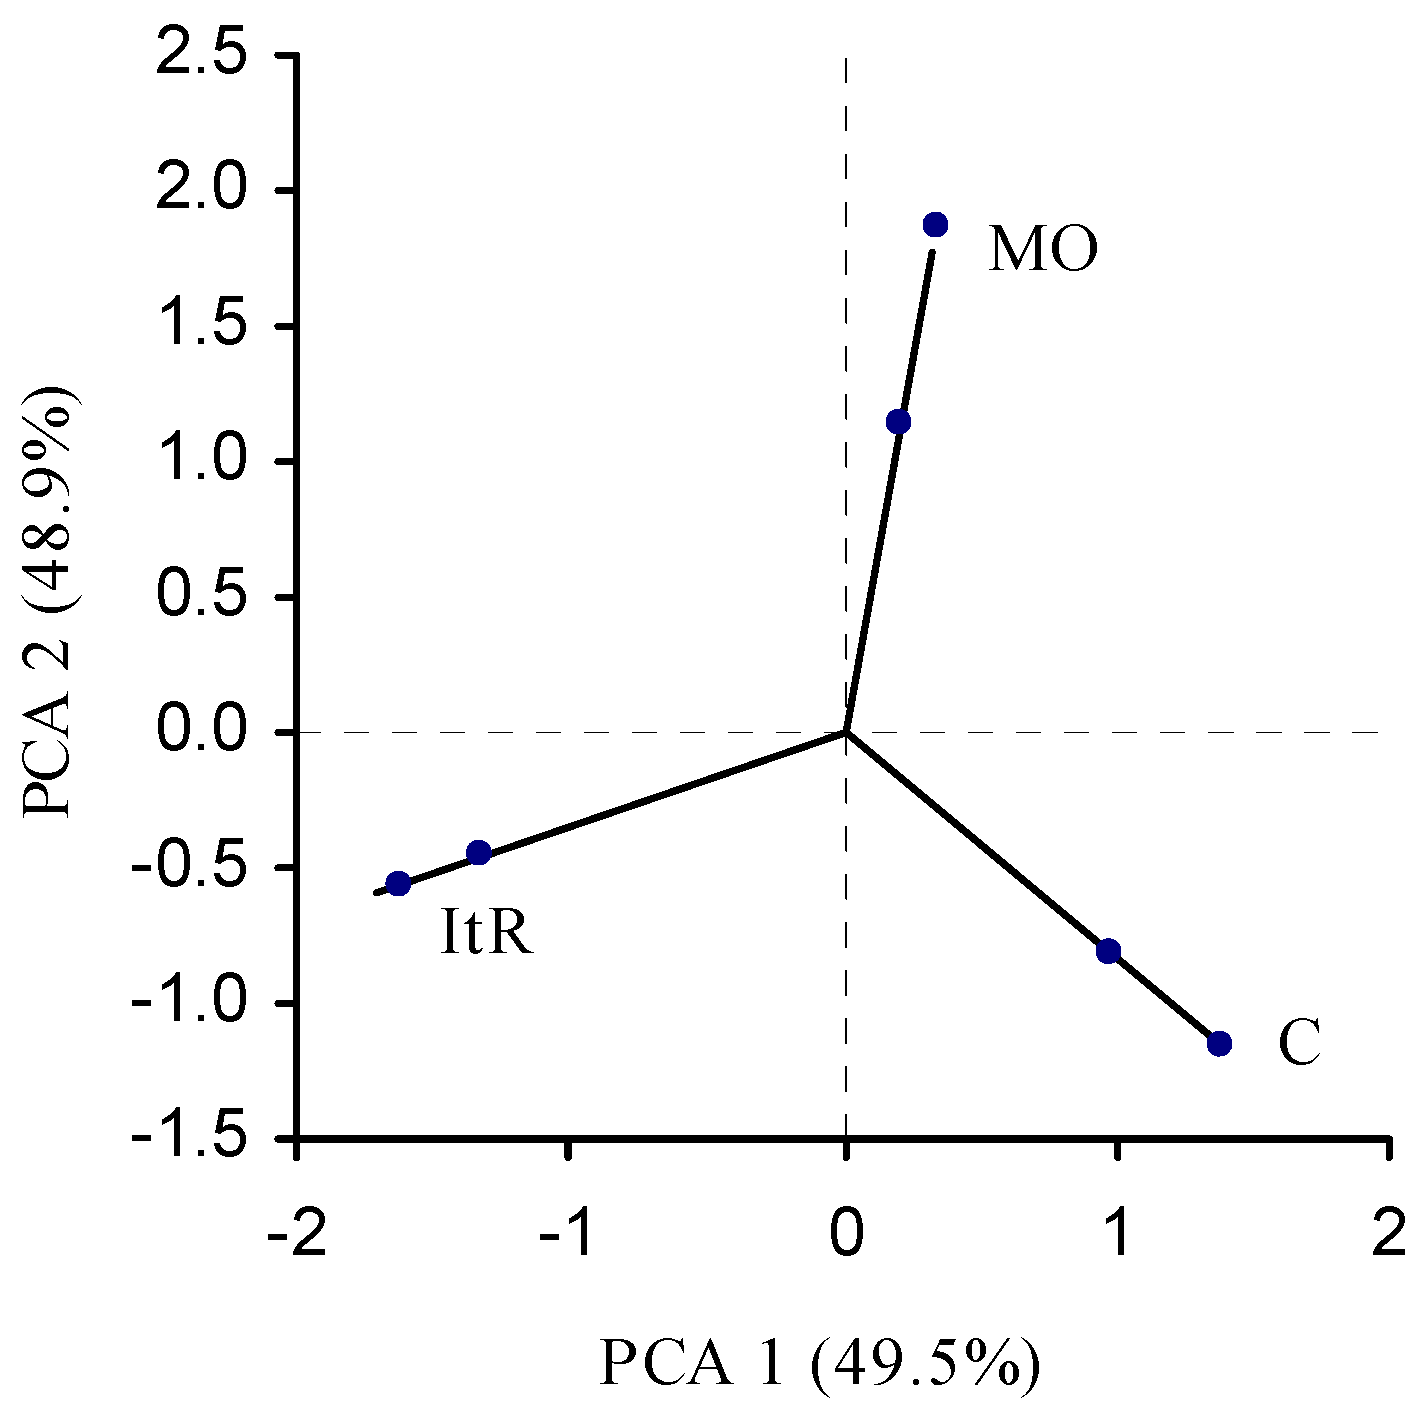
2.5. Principal component analysis
| Value | PC1 | PC2 | PC3 |
|---|---|---|---|
| Eigenvalue | 1.486 | 1.330 | 0.048 |
| % of variance | 49.544 | 48.853 | 1.603 |
| Cumulative % | 49.544 | 98.397 | 100.000 |

3. Experimental
3.1. Wine samples
| Wine and vintage | Grape varieties | Alcohol Vol. (%) | Acidity a | pH |
|---|---|---|---|---|
| Zapadnomoravski wine region | ||||
| Graševina (2007) | Italien Riesling | 11.5 | 6.93 | 3.57 |
| Smederevka (2007) | Smederevka | 10.5 | 6.83 | 3.50 |
| Chardonay (2007) | Chardonnay | 11.0 | 6.70 | 3.40 |
| Terra Lazarica-Chardonnay (2007) | Chardonnay | 12.0 | 6.72 | 3.42 |
| Međaš beli (2007) | Chardonnay, Sauvignon, Muscat Ottonel | 11.5 | 6.38 | 3.57 |
| Župski Riesling (2003) | Italian Rieling | 10.7 | 6.12 | 3.81 |
| Car Konstantin-Semillon (2003) | Semillon | 11.5 | 6.35 | 3.62 |
| Banat wine region | ||||
| Traminac (2004) | Traminer | 12.5 | 6.30 | 3.24 |
| Banatski Riesling (2007) | Italian Riesling, Smederevka, Župljanka, Kreazer | 11.3 | 5.98 | 3.22 |
| Muscat Ottonel (2007) | Muscat Ottonel | 11.5 | 6.42 | 3.38 |
3.2. Chemicals
3.3. Determination of total phenolic content (TP)
3.4. Determination of total flavonoid content (TF)
3.5. Measurement of the DPPH scavenging activity

3.6. HPLC analysis of hydroxycinnamic acids
3.7. Statistical analysis
4. Conclusions
Acknowledgements
- Sample Availability: Samples of the compounds are available from the authors
References
- Silva, R.L.; Andrade, P.B.; Valentao, P.; Seabra, R.M.; Trujillo, M.E.; Velazquez, E. Analysis of non-coloured phenolics in red wine: Effect of Dekkera bruxellensis yeast. Food Chem. 2005, 89, 185–189. [Google Scholar] [CrossRef]
- Zafrilla, P.; Morillas, J.; Mulero, J.; Cayuela, J.M.; Martinez-Cacha, A.; Pardo, F.; Nicolas, J.M.L. Changes during storage in conventional and ecological wine: Phenolic content and antioxidant activity. J. Agric. Food Chem. 2003, 51, 4694–4700. [Google Scholar]
- Andrade, P.B.; Oliveira, B.M.; Ferreira, M.A.; Ferreres, F.; Garcia-Viguera, C. Analysis of phenolic compounds in Spanish Albarino and Portuguese Alvarinho and Loureiro wines by capillary zone electrophoresis and high-performance liquid chromatography. Electrophoresis 2001, 22, 1568–1572. [Google Scholar] [CrossRef]
- Ramos, R.; Andrade, P.B.; Seabra, R.M.; Pereira, C.; Ferreira, M.A.; Faia, M. A preliminary study of non-coloured phenolics in wines of vaeietal white grapes (codega, gouveio and malvasia fina): Effects of grape variety, grape maturation and technology of winemaking. Food Chem. 1999, 67, 39–44. [Google Scholar] [CrossRef]
- Salacha, M.-I.; Kallithraka, S.; Tzourou, I. Browning of white wines: correlation with antioxidant characteristics, total polyphenolic composition and flavanol content. Int. J. Food Sci. Tech. 2008, 43, 1073–1077. [Google Scholar] [CrossRef]
- Guyot, S.; Vercauteren., J.; Cheynier, V. Structural determination of colourless and yellow dimers resulting from (+)-catechin coupling catalysed by grape polyphenoloxidase. Phytochemistry 1996, 42, 1279–1288. [Google Scholar] [CrossRef]
- Singleton, V.L.; Orthofer, R.; Lamuela-Raventos, R.M. The phenolic cinnamates of white grapes and wine. J. Sci. Food Agric. 1987, 29, 403–410. [Google Scholar]
- Katalinic, V.; Milos., M.; Modun, D.; Music, I.; Boban, M. Antioxidant effectiveness of selected wines in comparison with (+)-catechin. Food Chem. 2004, 86, 593–600. [Google Scholar] [CrossRef]
- Katalinic, V.; Ljubenkov, I.; Pezo, I.; Generalic, I.; Stricevic, O.; Milos, M.; Modun, D.; Boban, N.M. Free resveratrol monomers in varietal red and white wines from Dalmatia (Croatia). Period. Biol. 2008, 110, 77–83. [Google Scholar]
- Budic-Leto, I.; Lovric, T. Identification of phenolic acids and changes in their content during fermentation and ageing of white wines Posip and Rukatac. Food Technol. Biotechnol. 2002, 40, 221–225. [Google Scholar]
- Rastija, V.; Srecnik, G.; Medic-Saric, M. Polyphenolic composition of Croatian wines with different geographical origin. Food Chem. 2009, 115, 54–60. [Google Scholar] [CrossRef]
- Roussis, I.G.; Lambropoulos, I.; Tzimas, P.; Gkoulioti, A.; Marinos, V.; Tsoupeis, D.; Boutaris, I. Antioxidant activities of some Greek wines and wine phenolic extracts. J. Food Compos. Anal. 2008, 21, 614–621. [Google Scholar] [CrossRef]
- Roussis, I.G.; Lambropoulos, I.; Soulti, K. Scavenging Capacities of Some Wines and Wine Phenolic Extracts. Food Techol. Biotechnol. 2005, 43, 351–358. [Google Scholar]
- Fernandez-Pachon, M.S.; Villano, D.; Troncoso, A.M.; Garcia-Parrilla, M.C. (2006). Determination of phenolic composition of cherry and table white wines by liquid chromatography and their relation with antioxidant activity. Anal. Chim. Acta 2006, 563, 101–108. [Google Scholar] [CrossRef]
- Sanchez-Moreno, C.; Larrauri, J.A.; Saura-Calixto, F. Free radical scavenging capacity of selected red, rose and white wines. J. Sci. Food Agric. 1999, 79, 1301–1304. [Google Scholar] [CrossRef]
- Stevanato, R.; Fabris, S.; Momo, F. New enzymatic method for the determination of total phenolic content in tea and wine. J. Agric. Food Chem. 2004, 52, 6287–6293. [Google Scholar] [CrossRef]
- Simonetti, P.; Pietta, P.; Testolin, G. Polyphenol content and total antioxidant potential of selected Italian wines. J. Agric. Food Chem. 1997, 45, 1152–1155. [Google Scholar] [CrossRef]
- Stratil, P.; Kuban, V.; Fojtova, J. Comparison of the Phenolic Content and Total Antioxidant Activity in Wines as Determined by Spectrophotometric Methods. Czech. J. Food Sci. 2008, 26, 242–253. [Google Scholar]
- De Beer, T.; Joubert, E.; Gelderblom, W.C.A.; Manley, M. Antioxidant Activity of South African Red and White Cultivar Wines: Free Radical Scavenging. J. Agric. Food Chem. 2003, 51, 902–909. [Google Scholar] [CrossRef]
- Fernandez-Pachon, M.S.; Villano, D.; Garcia-Parrilla, M.C.; Tronoso, A.M. Antioxidant activity of wines and relation with their polyphenolic composition. Anal. Chim. Acta 2004, 513, 113–118. [Google Scholar] [CrossRef]
- Pinto, P.C.A.G.; Saraiva, M.L. M.F.S., Reis; Lima, J.L.E.C. Automatic sequential determination of the hydrogen peroxide scavenging activity and evaluation of the antioxidant potential by the 2,2-azino-bis(3-ethylbenzothiazoline-6-sulfonic acid) radical cation assay in wines by sequential injection analysis. Anal. Chim. Acta 2005, 531, 25–32. [Google Scholar] [CrossRef]
- Mozetič, B.; Tomažič, I.; Škvarč, A.; Trbše, P. Determination of Polyphenpls in White Grape Berries cv. Rebula. Acta Chim. Slov. 2006, 53, 58–64. [Google Scholar]
- Gomes-Alonso, S.; Garcia-Romero, E.; Hermosin-Gutierrez, I. HPLC analysis of diverse grape and wine phenolics using direct injection and multidetection by DAD and fluorescence. J. Food Compos. Anal. 2007, 20, 618–626. [Google Scholar] [CrossRef]
- Mayen, M.; Baron, R.; Merida, J.; Medina, M. Changes in phenolic composition during accelerated browning in white wines from cv. Pedro Ximenez and cv. Baladi grapes. Food Chem. 1997, 58, 89–95. [Google Scholar] [CrossRef]
- Recamales, A.; Sayago, A.; Gonzalez-Miret, M.L.; Hernanz, D. The effect of storage conditions on the phenolic composition and color of white wine. Food Res. Int. 2006, 39, 220–229. [Google Scholar] [CrossRef]
- Sioumis, N.; Kallithraka, S.; Makris, D.; Kefalas, P. Kinetics of browning onset in white wines: Influence of principal redox-active polyphenols and impact on the reducing capacity. Food Chem. 2006, 94, 98–104. [Google Scholar] [CrossRef]
- Kallithraka, S.; Salacha, M.I.; Tzourou, I. Changes in phenolic composition and antioxidant activity of white wine during bottle storage: Accelerated browning test versus bottle storage. Food Chem. 2009, 113, 500–505. [Google Scholar] [CrossRef]
- Singleton, V.L.; Orthofer, R.; Lamuela-Raventos, R.M. Analysis of total phenols and other oxidation substrates and antioxidants by means of Folin-ciocalteu reagent. Method Enzymol. 1999, 299, 152–178. [Google Scholar] [CrossRef]
- Zhishen, J.; Mengcheng, T.; Wu Jianming, W. The determination of flavonoids content in mulberry and scavenging effect on superoxide radicals. Food Chem. 1999, 64, 555–559. [Google Scholar] [CrossRef]
- Liu, Q.; Yao, H. Antioxidant activities of barley seeds extracts. Food Chem. 2007, 102, 732–737. [Google Scholar] [CrossRef]
- Lamuela-Raventos, R.M.; Waterhous, A.L. A direct HPLC separation of wine phenols. Am. J. Enol. Vitic. 1994, 45, 1–5. [Google Scholar]
- Monagas, M.; Carmen Gómez-Cordovés, C.; Bartolomé, B.; Olga Laureano, O.; Da Silva, J.M.R. Monomeric, Oligomeric, and Polymeric Flavan-3-ol Composition of Wines and Grapes from Vitis vinifera L. Cv. Graciano, Tempranillo, and Cabernet Sauvignon. J. Agric. Food Chem. 2003, 51, 6475–6481. [Google Scholar]
© 2010 by the authors; licensee Molecular Diversity Preservation International, Basel, Switzerland. This article is an open-access article distributed under the terms and conditions of the Creative Commons Attribution license (http://creativecommons.org/licenses/by/3.0/).
Share and Cite
Mitić, M.N.; Obradović, M.V.; Grahovac, Z.B.; Pavlović, A.N. Antioxidant Capacities and Phenolic Levels of Different Varieties of Serbian White Wines. Molecules 2010, 15, 2016-2027. https://doi.org/10.3390/molecules15032016
Mitić MN, Obradović MV, Grahovac ZB, Pavlović AN. Antioxidant Capacities and Phenolic Levels of Different Varieties of Serbian White Wines. Molecules. 2010; 15(3):2016-2027. https://doi.org/10.3390/molecules15032016
Chicago/Turabian StyleMitić, Milan N., Mirjana V. Obradović, Zora B. Grahovac, and Aleksandra N. Pavlović. 2010. "Antioxidant Capacities and Phenolic Levels of Different Varieties of Serbian White Wines" Molecules 15, no. 3: 2016-2027. https://doi.org/10.3390/molecules15032016