Article

Oak (Quercus frainetto Ten.) Honeydew Honey—Approach to Screening of Volatile Organic Composition and Antioxidant Capacity (DPPH and FRAP Assay)

by
Igor Jerković
1,* and
Zvonimir Marijanović
2
1
Faculty of Chemistry and Technology, University of Split, N. Tesle 10/V, 21000 Split, Croatia
2
Marko Marulić Polytechnic in Knin, P. Krešimira IV 30, 22300 Knin, Croatia
*
Author to whom correspondence should be addressed.
Molecules 2010, 15(5), 3744-3756; https://doi.org/10.3390/molecules15053744
Submission received: 26 April 2010 / Revised: 17 May 2010 / Accepted: 24 May 2010 / Published: 25 May 2010
(This article belongs to the Special Issue Antioxidants)

Abstract

:
Two samples of oak honeydew honey were investigated. Headspace solid-phase microextraction (HS-SPME) combined with GC and GC/MS enabled identification of the most volatile organic headspace compounds being dominated by terpenes (mainly cis- and trans-linalool oxides). The volatile and less-volatile organic composition of the samples was obtained by ultrasonic assisted extraction (USE) with two solvents (1:2 (v/v) pentane -diethyl ether mixture and dichloromethane) followed by GC and GC/MS analysis. Shikimic pathway derivatives are of particular interest with respect to the botanical origin of honey and the most abundant was phenylacetic acid (up to 16.4%). Antiradical activity (DPPH assay) of the honeydew samples was 4.5 and 5.1 mmol TEAC/kg. Ultrasonic solvent extracts showed several dozen times higher antiradical capacity in comparison to the honeydew. Antioxidant capacity (FRAP assay) of honeydew samples was 4.8 and 16.1 mmol Fe2+/kg, while the solvent mixture extracts showed antioxidant activity of 374.5 and 955.9 Fe2+/kg, respectively, and the dichloromethane extracts 127.3 and 101.5 mmol Fe2+/kg.

1. Introduction

Unlike floral honeys, which derive from the nectar of flowering plants, honeydew honey is obtained by secretions of the living parts of plants or excretions onto them produced by sap-sucking insects. Honeydew honeys differ in chemical composition from nectar honeys [1] as well in the volatile composition and/or antioxidant activity. Screening of natural organic compounds that characterize these honey types is of particular interest because palynological analysis cannot be carried out [2]. trans-β-Methyl-γ-octalactone, a characteristic volatile compound of oak wood, is proposed as a chemical marker for the plant origin of oak honeydew honeys [2]. Other compounds such as aminoacetophenone and propylanisole can be considered characteristic of holm-oak honeydew honeys. 1-(2-Furanyl)-ethanone, butane-2,3-diol, 3-hydroxy-butan-2-one and 1-hydroxy-propan-2-one were suggested compounds for discrimination among nectar and honeydew honeys [1].
Antioxidant capacity of different honeys varies by floral source [3] as well by processing and storage conditions [4,5]. Components that were identified and/or quantified as honey antioxidants included phenolic compounds, ascorbic acid, the enzymes glucose oxidase, catalase, peroxidase and others. Additional research on single phenolic and other compounds in honey indicate that the antioxidant capacity is due to combination of a wide range of honey active compounds beyond phenolics [6]. Many different methods are appropriate for assessing the antioxidant activity (FRAP assay (ferric reducing antioxidant power), DPPH (1,1-diphenyl-2-picrylhydrazyl) method, ORAC (oxygen radical absorbance capacity), TEAC (Trolox equivalent antioxidant activity) and others) and in most cases it is necessary to use several tests to obtain good reliability [7]. Little information is available on the potential antioxidant activity of the honey ultrasonic solvent extracts. In our previous research [8] we reported the scavenging ability of the series of concentrations of the Amorpha fruticosa honey ultrasonic solvent extracts and the corresponding honey samples that was tested by a DPPH assay. Approximately 25 times lower concentration ranges (up to 2 g/L) of the extracts exhibited significantly higher free radical scavenging potential with respect to the honey samples.
Quercus frainetto Ten. belongs to the oak species. The growth process of oak fruits is extremely rich in cycles of 5-8 years. At the point of natural reduction of overproduction of fruits, the sweet sap from fruits appears. Fruit sap starts to flow over the cuticle of the fruit often with a foamy appearance. Therefore, the corresponding honeydew can also be produced without the mediation of plant sucking insects. Oak honeydew volatiles from Spain were previously identified by a microscale SDE apparatus after dichloromethane extraction [2] and trans-β-methyl-γ-octalactone, a characteristic volatile compound of oak wood, was proposed as a chemical marker. This compound is well known in winemaking, because it is responsible for the oak aroma of barrel-aged wines [9].
The scope of this research is to obtain new information of oak honeydew volatile organic composition by combined use of headspace solid-phase microextraction (HS-SPME) and ultrasonic solvent extraction (USE). In addition, the obtained USE extracts were tested by DPPH and FRAP assay for the first time in order to unlock their antiradical and antioxidant potential. DPPH and FRAP assay of the USE extracts were compared to the activity of the honeydew samples to obtain data of potential extra value of the solvent extracts, not just for organic analyses.

2. Results and Discussion

The bees readily collect the plant sap on oak and Quercus frainetto Ten. is recognized as a specific source of honeydew in the region where the samples were collected. Besides sap-sucking insects that excreted exudates, sweet sap from oak fruits is noted. There were noticeably smaller amounts of honeydew elements in the sample sediments. Water content in the honeydew samples was 16.6% (sample I) and 16.2% (sample II). Electrical conductivity was 0.91 mS/cm (sample I) and 1.03 mS/cm (sample II).

2.1. Volatiles Isolated by Headspace Solid-Phase Microextraction

Headspace solid-phase microextraction (HS-SPME) combined with GC and GC/MS enabled identification of the most volatile organic headspace compounds in the samples. This approach for honey profiling is very important for obtaining reliable composition of the most volatile organic compounds.
The most abundant compounds in the headspace of samples I and II were terpenes: trans-linalool oxide (18.1%; 13.8%), cis-linalool oxide (10.8%; 14.0%), hotrienol (4.4%; 9.7%) and epoxylinalool (4.4%; 2.0%). Linalool oxides and hotrienol were already found in oak honeydew [2]. Another abundant group of organic compounds were aliphatic acids: octanoic acid (8.5%; 9.4%), nonanoic acid (2.8%; 4.7%), decanoic acid (1.5%; 2.4%) and hexadecanoic acid (3.7%; 3.8%). No specific headspace marker compounds were found. Ubiquitous benzene derivatives in all honeys were also found: 2-phenylethanol (3.5%; 6.0%), phenylacetaldehyde (2.0%; 1.5%) and benzyl alcohol (2.4%; 4.8%). High concentrations of phenyacetaldehyde and 2-phenylethanol and lower quantity of benzaldehyde were found in oak honeydew from Spain [2]. Although furan derivatives were found particularly in the sample I (2-furancarboxaldehyde (0.7%), 2-furanmethanol (1.3%), 1-(2-furanyl)-ethanone (1.1%) and 5-methyl-2-furfural (8.4%)) their percentages in Table 1 are not reliable due to high polarity and low volatility.
Table 1. Oak honeydew organic headspace volatiles composition isolated by HS-SPME.
No.CompoundRIArea percentage (%)
sample Isample II
1. Pentan-1-ola< 9000.50.9
2. 2-Methylbutan-1-ol< 9000.7-
3. 2-Furancarboxaldehyde< 9002.0-
4. 3-Methylbutanoic acid (Isovaleric acid)< 9000.8-
5. 2-Furanmethanol< 9001.35.2
6. 1,3-Dimethylbenzene**< 9000.4-
7. 1-(2-Furanyl)-ethanone9141.1-
8. 5-Methylfurfural9698.43.5
9. Hexanoic acida9740.72.2
10. 2-Ethyl-1,3-dimethylbenzene*10320.7-
11. 2-Ethylhexan-1-ol*10351.1-
12. Benzyl alcohola10372.44.8
13. Phenylacetaldehydea10482.01.5
14. trans-Linalool oxide (furan type)107618.113.8
15. Methyl 2-furoate1084-2.8
16. cis-Linalool oxide (furan type)109110.814.0
17. Hotrienol11064.49.7
18. 2-Phenylethanola11163.56.0
19. 3,5,5-Trimethyl-cyclohex-2-en-1-one (α-Isophorone)11240.6-
20. 2-Ethylhexanoic acid11402.9-
21. Neroloxide11622.1-
22. Epoxylinalool11784.42.0
23. Octanoic acida11908.59.4
24. Lilac alcohol (isomer I)12080.8-
25. Lilac alcohol (isomer II)12371.3-
26. Ethyl phenylacetate12531.2-
27. Nonanoic acida12732.84.7
28. Methyl cinnamate13121.1-
29. Decanoic acida13701.52.4
30. Hexadecanoic acida19633.73.8
Total identified89.8%86.7%
RI = retention indices on HP-5MS column; - = not identified; a – identification confirmed with reference compound; * - tentatively identified; ** - correct isomer not identified.

2.2. Volatiles Isolated by Ultrasonic Solvent Extraction

The volatile organic composition results of the samples obtained by ultrasonic assisted extraction (USE) with two solvents followed by GC and GC/MS analysis are presented in Table 2. A representative TIC chromatogram is presented in Figure 1. The most striking difference among the samples was the concentration of 5-hydroxymethylfurfural (5-HMF). Sample I collected in 2005 contained 42.5% of 5-HMF (solvent A) and 64.2% (solvent B), respectively, in contrast to sample II from 2009 with percentages of 4.7% (solvent A) and 6.2% (solvent B). The percentage of 5-HMF in both samples was higher in the more polar solvent dichloromethane. Such a high content was expected since 5-HMF is generated during honeydew storage at room temperature. Prolonged storage of the honeydew led to compositional changes due to caramelization of carbohydrates, Maillard reactions, and decomposition of fructose in relative acid medium of the honeydew [10]. These reactions lead to the formation of HMF or other furan/pyran compounds (such as 2-furanmethanol (1.7%; 0.3%), 5-methylfurfural (1.5%; 0.5%), 1-(2-furyl)-2-hydroxyethanone (5.5%; 4.6%), 2,3-dihydro-3,5-dihydroxy-6-methyl-4H-pyran-4-one (1.3%; 0.3%)). Several furan/pyran derivatives were present in the other sample such as 2-furanmethanol (3.0%; 3.7%), 1-(2-furyl)-2-hydroxyethanone (5.1%; 8.8%), 2,3-dihydro-3,5-dihydroxy-6-methyl-4H-pyran-4-one (2.8%; 4.3%). Although the percentage of 5-HMF predominated in sample I, botanical-origin important compounds were notable, as in sample II.
Figure 1. Representative TIC chromatogram of oak honeydew USE extracts of the sample II obtained with the mixture of pentane and diethyl ether 1 : 2, v/v (A) and dichloromethane (B).
Molecules 15 03744 g001
Shikimic pathway derivatives are of particular interest with respect to the botanical origin of honey since the research focus is oriented toward terpenes, benzene derivatives and norisoprenoids in the honey [2]. The most abundant derivative was phenylacetic acid in sample I (8.1%; 4.7%) and sample II (16.4%; 11.6%) with more pronounced percentages in solvent A. This compound was not found in Spain oak honeydew which may be the consequence of the use of a different extraction technique [2]. Other abundant benzene derivatives were benzoic acid, 4-hydroxybenzoic acid, 4-hydroxybenzyl alcohol, 4-hydroxybenzoic acid, 4-hydroxycinnamic acid and methyl syringate, also not identified in Spain oak honeydew. However, none of the identified benzene derivatives can be proposed as specific markers for oak honeydew since they are present in different honeys.
Table 2. Oak honey volatile organic composition isolated by USE.
Area percentage (%)
No.CompoundRIsample Isample II
ABAB
1. 3-Methylbutanoic acid< 9000.1---
2.2-Furanmethanol< 9001.70.33.03.7
3. 1,3-Dimethylbenzene**< 9000.1--0.2
4. 3-Hydroxy-pentan-2-one< 9000.2-0.5-
5.1-(2-Furanyl)-ethanone9140.3---
6. Hexane-2,5-dione9310.20.1--
7. 5-Methylfurfural9691.50.50.10.1
8. Hexanoic acida9740.1---
9. 2-Formylpyrrole10180.2-0.10.4
10. p-Cymenea10310.1-0.2-
11. 2-Hydroxy-3-methyl-cyclopent-2-en-1-one10340.30.1-0.1
12. Benzyl alcohola10371.2-1.40.6
13. Pantoic lactone1046-0.5-0.8
14. Phenylacetaldehydea10480.1---
15. 2-Acetylpyrrole10630.20.10.20.1
16. trans-Linalool oxide10760.7-0.2-
17. 4,5-Dimethyl-2-formylfuran10780.4---
18. 6-Methyl-2-pyrazinylmethanol1084-0.3-0.2
19. 1-(2-Furyl)-2-hydroxyethanone10875.54.65.18.8
20. cis-Linalool oxide10910.4-0.2-
21. Linaloola11010.3-0.2-
22. 2-Phenylethanola11160.7-0.9-
23. 3-Hydroxy-2-methyl-4H-Pyran-4-one (Maltol)1119-0.5-1.3
24. 2-Formyl-1-methylpyrrole11391.10.50.30.8
25. 2,3-Dihydro-3,5-dihydroxy-6-methyl-4H-pyran-4-one11451.30.32.84.3
26. Benzoic acida11624.51.84.33.5
27. 3,5-Dimethylphenol**11810.30.10.40.2
28. 3,7-Dimethyl-octa-1,5-dien-3,7-diol11910.40.10.50.8
29. Dodecanea12000.2-0.10.5
30. 1,2-Benzenediol12190.3-0.2-
31. 2,5-Di(hydroxymethyl)-furan*12292.2-10.917.2
32. 5-Hydroxymethylfurfural123042.564.24.76.2
33. Phenylacetic acida12698.14.716.411.6
34. Nonanoic acida1273---0.1
35. 2-Hydroxybenzoic acid13110.50.21.6-
36. 3-Methoxyacetophenone1321--0.3-
37. 3-Hydroxy-4-phenyl-butan-2-one1354-0.51.40.8
38. Tetradecanea14000.30.10.40.4
39. 4-Hydroxybenzyl alcohol14260.40.20.60.8
40. Cinnamic acid14340.20.2-0.2
41. 8-Hydroxyoctanoic acid14650.40.30.40.6
42. Pentadecanea1500--0.2-
43. 4-Methyl-2,6-bis(1,1-dimethylethyl)-phenol15141.4-3.65.7
44. 4-Hydroxybenzoic acid15581.7-2.9-
45. Vanillic acid15660.60.10.40.2
46. Hexadecane16000.8-1.50.1
47. 3-Oxo-α-ionol16560.30.2--
48. Homovanillic acid1659---0.5
49. Syringaldehyde16620.10.1-0.4
50. 8-Quinolinol17130.21.2--
51. Methyl syringatea17441.61.24.63.2
52. Octadecanea18000.1-0.2-
53. Vomifoliol18021.2-1.82.4
54. 4-Hydroxycinnamic acid18171.9-6.6-
55. Hexadecan-1-ola18821.20.82.02.9
56. Hexadecanoic acida19630.30.61.70.9
57. (Z)-Octadec-9-en-1-ol20602.72.83.98.1
58. Octadecan-1-ola20840.40.60.81.5
59. (Z)-Octadec-9-enoic acid2147-0.32.0-
60. Tricosanea23000.30.32.32.4
Total identified91.888.491.992.6
RI = retention indices on HP-5MS column; A = solvent mixture of pentane and diethyl ether (1:2 v/v); B = solvent dichloromethane; - = not identified; a – identification confirmed with reference compound; * - tentatively identified; ** - correct isomer not identified.
Another abundant group of identified compounds from Table 2 were aliphatic alcohols, acids and hydrocarbons such as (Z)-octadec-9-en-1-ol, hexadecan-1-ol, octadecan-1-ol, hexadecanoic acid, tetradecane, hexadecane, tricosane and others. These compounds can be connected with bees-wax composition [11].

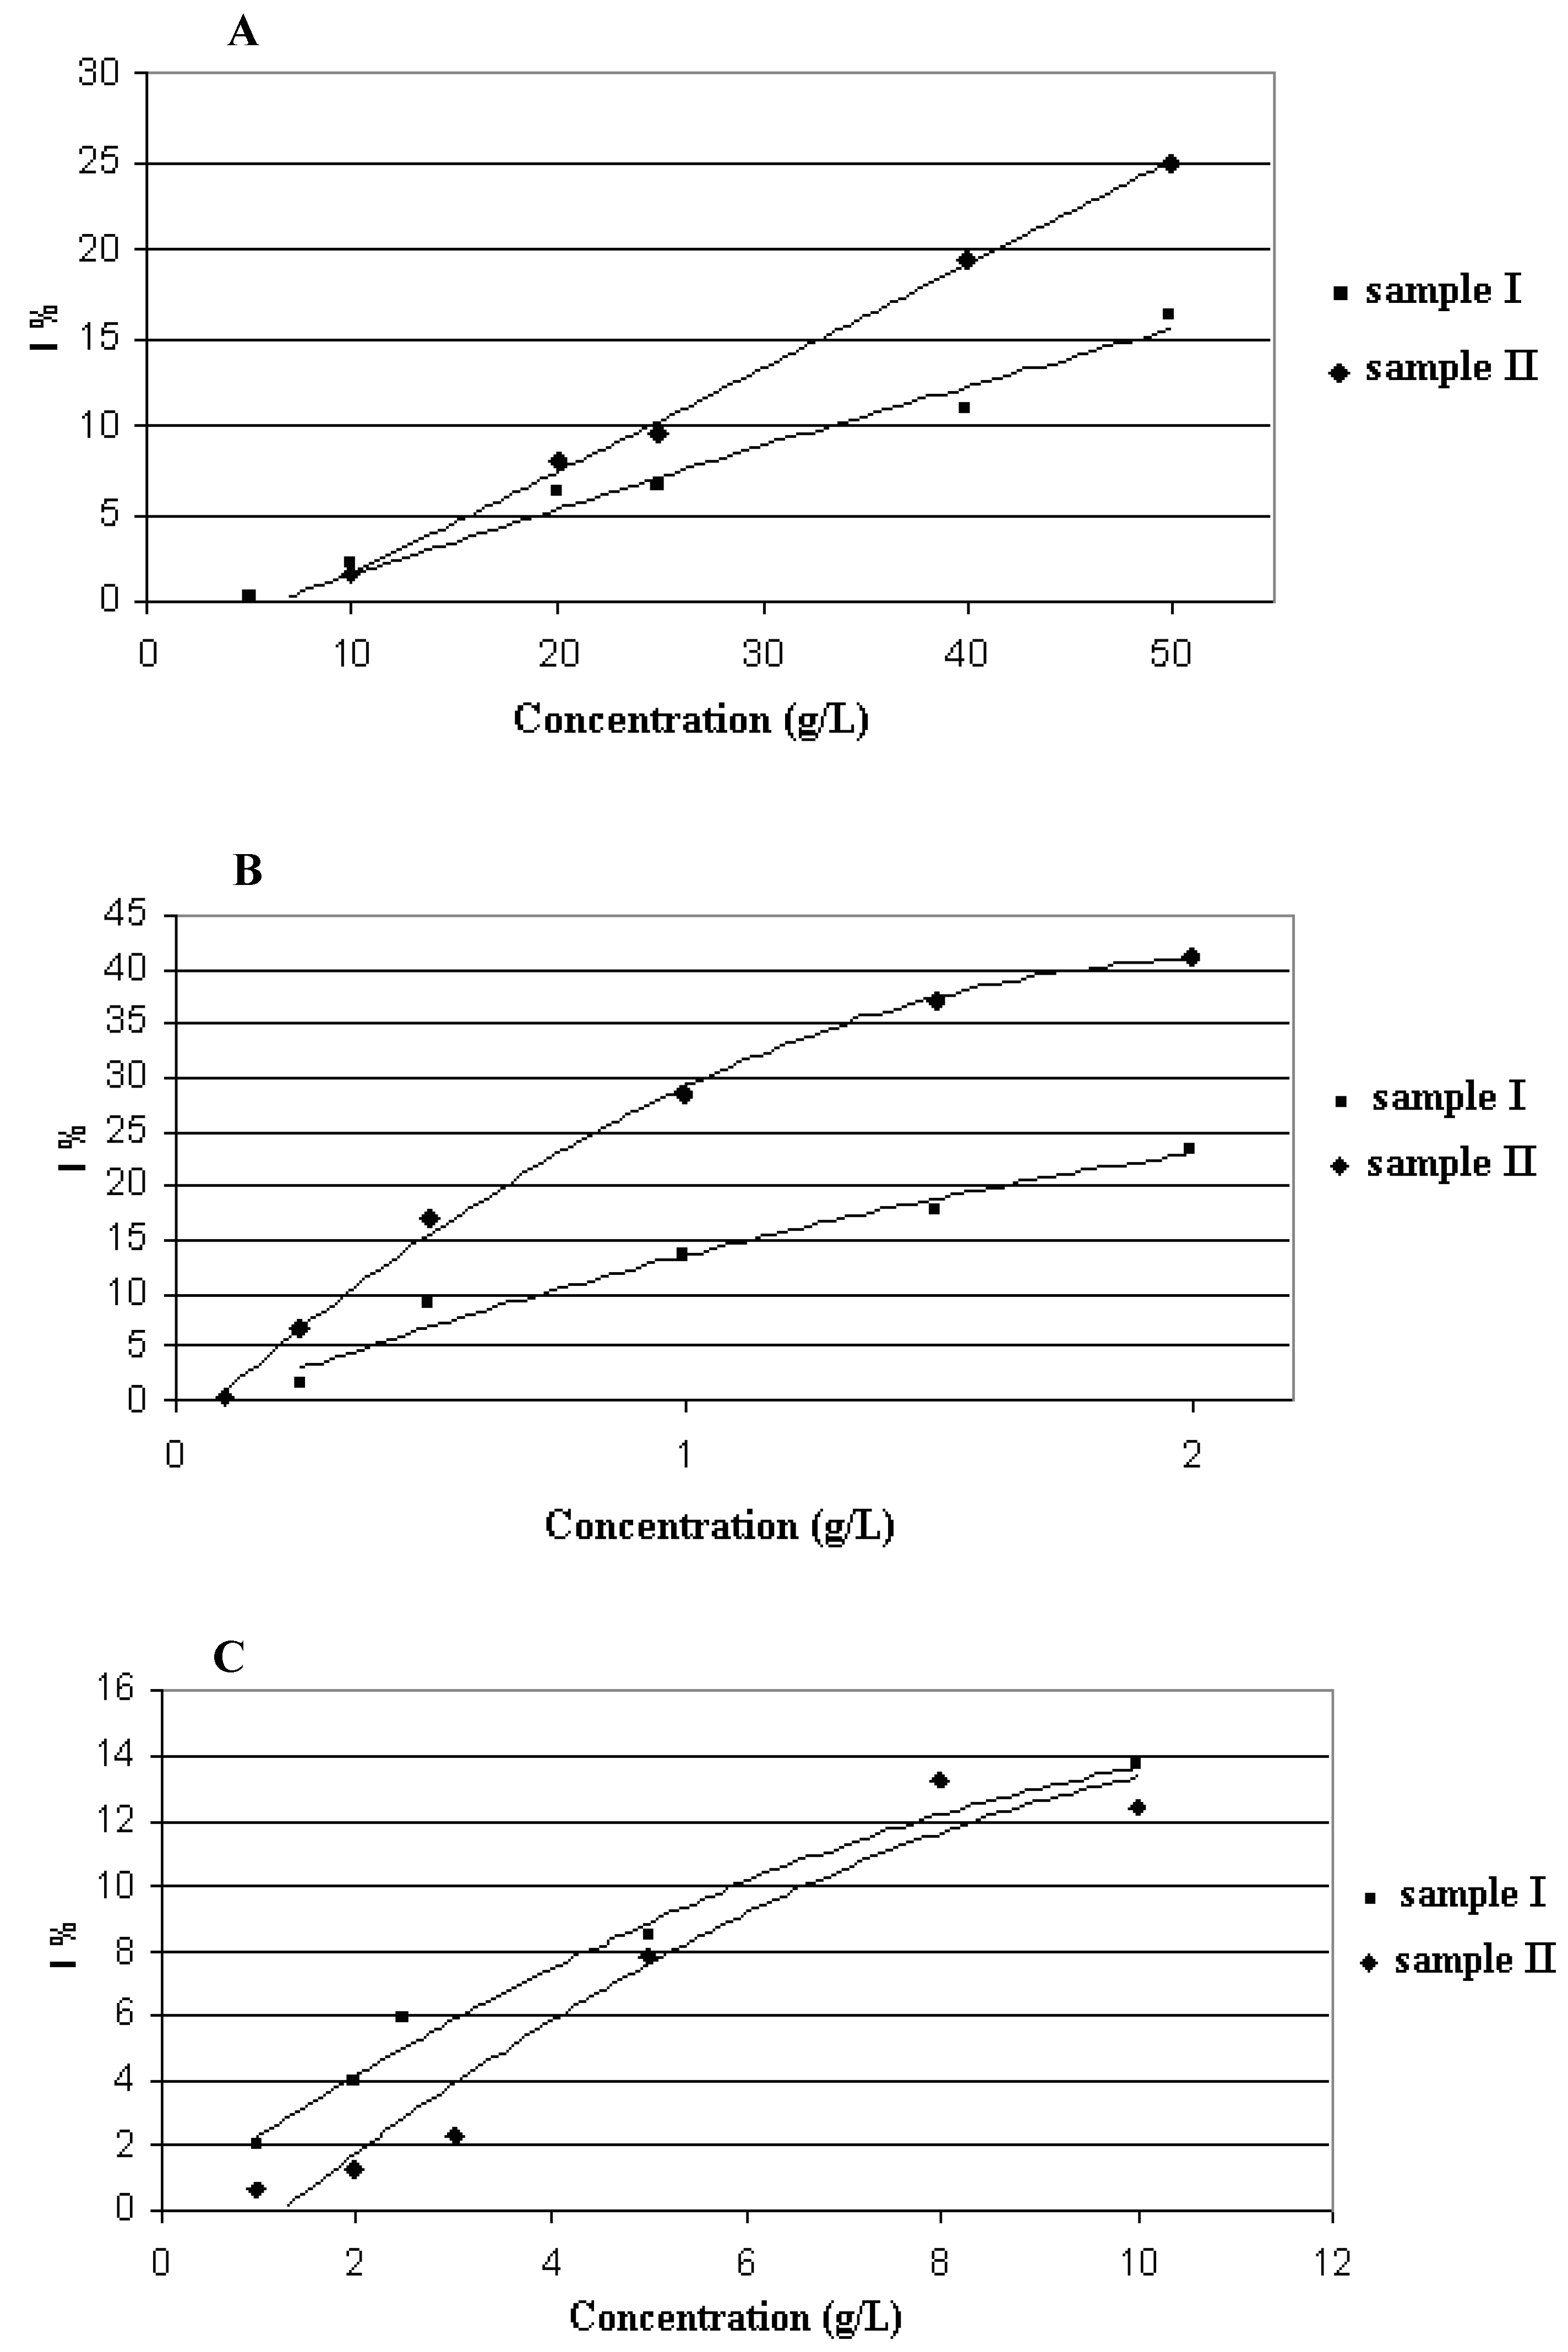
2.3. Antiradical and Antioxidant Capacity of the Honeydew and Extracts (DPPH and FRAP assay)

The antiradical activities (DPPH assay) of oak honeydew and ultrasonic solvent extracts were evaluated from a Trolox solution, Table 1. Antiradical activity was very similar for both oak honeydew samples: 4.5 mmol TEAC/kg (sample I) and 5.1 mmol TEAC/kg (sample II). Therefore it can be concluded that high concentration of 5-HMF in the sample I does not effect antiradical capacity of the honeydew. The percent inhibition of the DPPH radical as a function of the honeydew samples and their ultrasonic solvent extracts concentrations is shown in Figure 2.
Figure 2. DPPH reduction percentage against increasing concentration of oak honeydew (A), pentane - diethyl ether extract (B) and dichloromethane extract (C).
Molecules 15 03744 g002
Data from Figure 2 show that when the samples are concentrated, they could saturate DPPH. Also the IC50, corresponding to the concentration where 50% of the maximal effect on reduction of DPPH radical, is undetermined because at the maximum concentration of all the samples a maximum of 40% of DPPH inhibition was achieved. These measurements show that the ultrasonic solvent extracts exhibited similar free radical scavenging potential than the honey samples at approximately 4-10 times lower concentration ranges.
Table 3. Results of DPPH and FRAP quantitative assay for the honeydew (as mmol TEAC/kg honeydew and mmol Fe2/kg honeydew) and the extracts (as mmol TEAC/kg extract or mmol Fe2/kg extract). Solvent A and solvent B are described in Table 2.
sample Isample II
DPPHFRAPDPPHFRAP
[mmol TEAC/kg][mmol Fe2+/kg][mmol TEAC/kg][mmol Fe2+/kg]
oak honeydew4.54.85.116.1
USE extract (solvent A;
mIA = 0.0063 g;174.3374.5256.5955.9
mIIA = 0.0075 g)
USE extract (solvent B; ; 100.8127.3132.1101.5
mIB = 0.0102 g;
mIIB = 0.0167 g))
mIA - dried extract (solvent A) mass of the sample I; mIIA - dried extract (solvent A) mass of the sample II; mIB - dried extract (solvent B) mass of the sample I; mIIB - dried extract (solvent B) mass of the sample II.
Ultrasonic solvent extract with solvent A (sample I) showed cca. 38 times higher antiradical capacity in comparison to the honeydew, while the extract with solvent B (sample I) showed cca. 22 times better antiradical activity (Table 3). Antiradical capacity of the extract with solvent A from sample II was 50 times better than oak honeydew capacity, whereas the extract with solvent B (sample II) showed 26 times higher activity. The extracts (with solvent A and B) from sample II exhibited higher antioxidant activity with respect to the same extracts from sample I that can be due to higher 5-HMF concentration in sample I. FRAP antioxidant capacity of honeydew samples ranged from 4.8 to 5.7 mmol Fe2+/kg, while extracts with solvent A showed antioxidant activity of 374.5 and 955.9 Fe2+/kg, and extracts with solvent B 127.3 and 101.5 mmol Fe2+/kg, respectively

3. Experimental

3.1. Honey Samples

Two oak honeydew samples that were collected in different years were investigated: sample I (2005) and sample II (2009). The samples were obtained from professional beekeepers and no mechanical treatment or heat was used. The combs were placed in the area of wild growing Quercus frainetto Ten. Melissopalynological analysis was performed by the methods recommended by the International Commission for Bee Botany [12]. Microscopical examination was carried out on a Hund h 500 (Wetzlar, Germany) light microscope attached to a digital camera (Motic m 1000) and coupled to an image analysis system (Motic Images Plus software) for morphometry of pollen grains. Water content was determined by refractometry, measuring the refractive index, using a standard model Abeé refractometer at 20 ºC. Water content (%) was obtained from the Chataway table [13]. Electrical conductivity was measured in a solution of 20 g honeydew honey in low conductivity water at 20 ºC using conductometer (Hanna HI 8733). All the samples were stored in hermetically closed glass bottles at 4 ºC until the volatiles isolation.

3.2. Headspace Solid-Phase Microextraction (HS-SPME)

The isolation of headspace volatiles was performed using a manual SPME fiber with a layer of polydimethylsiloxane/divinylbenzene (PDMS/DVB) obtained from Supelco Co (Bellefonte, PA, USA). The fiber was conditioned prior to use according to the manufacturer’s instructions. For HS-SPME extraction, honey/saturated water solution (5 mL, 1:1 v/v; saturated with NaCl) was placed in a 15 mL glass vial and hermetically sealed with PTFE/silicone septa. The vial was maintained in a water bath at 60 ºC during equilibration (15 min) and extraction (45 min) and was partially submerged so that the liquid phase of the sample was below the water level. All the experiments were performed under constant stirring (1,000 rpm) with a magnetic stirrer. After sampling, the SPME fiber was withdrawn into the needle, removed from the vial, and inserted into the injector (250 ºC) of the GC and GC-MS for 6 min where the extracted volatiles were thermally desorbed directly to the GC column.

3.3. Ultrasonic Solvent Extraction (USE)

Ultrasound-assisted solvent extraction (USE) was performed in an ultrasound cleaning bath (Elmasonic Typ S 30 H, Germany) by the mode of indirect sonication (sweep mode), at the frequency of 37 kHz at 25 ± 3 ºC. Forty grams of each sample was dissolved in distilled water (22 mL) in a 100-mL flask. Magnesium sulfate (1.5 g) was added and each sample was extensively vortexed. A mixture of pentane-diethyl ether (1:2, v/v) and dicholoromethane were separately used as the extraction solvent for each honey sample. Sonication was maintained for 30 min. After sonication, the organic layer was separated by centrifugation and filtered over anhydrous MgSO4. The aqueous layer was returned to the flask and another batch of the same extraction solvent (20 mL) was added and extracted by ultrasound for 30 min. The organic layer was separated in the same way as the previous one and filtered over anhydrous MgSO4, and the aqueous layer was sonicated a third time for 30 min with another batch (20 mL) of the extraction solvent. Joined organic extracts were concentrated to 0.2 mL by distillation with Vigreaux column, and 1 μL was used for GC and GC/MS analyses.

3.4. Gas Chromatography and Mass Spectrometry (GC, GC/MS)

Gas chromatography analyses were performed on an Agilent Technologies (Palo Alto, CA, USA) gas chromatograph model 7890A equipped with flame ionization detector, mass selective detector, model 5975C and capillary column HP-5MS ((5%-phenyl)-methylpolysiloxane Agilent J & W GC column, 30 m, 0.25 mm i.d., coating thickness 0.25 μm). Chromatographic conditions were as follows: helium was carrier gas at 1 mL·min−1, injector temperature was 250 ºC, and FID detector temperature was 300 ºC. HP-5MS column temperature was programmed at 70 ºC isothermal for 2 min, and then increased to 200 ºC at a rate of 3 ºC·min−1 and held isothermal for 18 min. The injected volume was 1 μL and the split ratio was 1:50. MS conditions were: ionization voltage 70 eV; ion source temperature 230 ºC; mass scan range: 30–300 mass units. The analyses were carried out in duplicate.

3.5. Data Analysis and Data Evaluation

The individual peaks were identified by comparison of their retention indices (relative to C9-C25 n-alkanes for HP-5MS) to those of authentic samples and literature [14], as well as by comparing their mass spectra with the Wiley 275 MS library (Wiley, New York, NY, USA) and NIST02 (Gaithersburg, MD, USA) mass spectral database. The percentage composition of the samples was computed from the GC peak areas using the normalization method (without correction factors). The component percentages (Table 1 and Table 2) were calculated as mean values from duplicate GC and GC-MS analyses.

3.6. Antiradical Activity (DPPH Assay)

The antiradical capacity was determined by the 2,2,diphenyl-1-picrylhydrazyl (DPPH) assay [15]. Oak honeydew samples were diluted first in ultra pure water (1:10, w/v) and then in methanol with different concentrations (g/L) shown in Figure 2. Ultrasonic solvent extracts were carefully evaporated to dryness under nitrogen and dissolved in methanol with different g/L concentrations showed in Figure 2. Spectrophotometric readings were carried out with a UV-Vis Perkin-Elmer Lambda EZ 201 spectrophotometer at 517 nm. DPPH assay was carried out in triplicate for each sample.
The percent of inhibition (I%) of the DPPH radical by the samples was calculated in the following way: I% = [(AC(0) -AA(t))/AC(0)] × 100, where AC(0) is the absorbance of the control at t = 0min and AA(t) is the absorbance of the samples at t = 60 min. Pure methanol was used to zero the spectrofotometer. The absorbance of DPPH radical without the sample, i.e. the control, was determined.
Quantitative analysis was done using the external standard method (Trolox). A calibration curve in the range of 0.05-1.0 mmol/L was used for Trolox and data were expressed as Trolox equivalent antioxidant capacity (TEAC, mmol/kg). Each sample (50 μL of previously prepared concentration 2 g/L) was dissolved in 2 mL of DPPH 0.04 mmol/L in methanol. The mixtures was shaken and left for 60 min at room temperature in the dark. The absorbance was measured against a control made of 50 µL of methanol and 2 mL of DPPH (the bank was read at t = 0 min and at t = 60 min).

3.7. Total Antioxidant Activity (FRAP Assay)

The ferric reducing-antioxidant assay (FRAP) is based on the reduction at low pH of ferric 2,4,6-tris(2-pyridyl)-1,3,5-triazine [Fe(III)-TPTZ] to the ferrous complex followed by spectrophotometric analysis [15]. The reagent was prepared by mixing 10mM TPTZ with 20mM ferric chloride in acetate buffer (pH 3.6). Quantitative analysis was done using the external standard method (ferrous sulfate, 0.1–2 mmol), correlating the absorbance (λ = 593 nm, UV-Vis Perkin-Elmer Lambda EZ 201) with the concentration. The results were expressed as millimoles per kilogram of Fe2+.

4. Conclusions

Headspace solid-phase microextraction (HS-SPME) enabled identification of the most volatile organic headspace compounds being dominated by terpenes. The volatile and less-volatile organic composition of the samples was obtained by ultrasonic assisted extraction (USE) with two solvents. The most striking difference among the samples was the concentration of 5-hydroxymethylfurfural (5-HMF). Shikimic pathway derivatives are of particular interest with respect to the botanical origin of honey and the most abundant was phenylacetic acid. Despite the different concentrations of 5-HMF in the samples, the obtained DPPH and FRAP assay values for both samples were quite similar. Ultrasonic solvent extracts showed several dozen times higher antiradical capacity (DPPH assay) in comparison to the honeydew. Antioxidant capacity (FRAP assay) of both extracts were remarkably higher in comparison to honeydew samples. These findings indicate the importance of USE extracts, not just for analytical purposes, but also reveals new potential for further antioxidant and biological activity research.

Acknowledgements

This research has been funded by UKF project 25/08 (Evaluation of Unifloral Honeys – Chemical Fingerprinting and Nutritional Properties) and supported by PIP d.o.o., KONCEPT-MEDIA d.o.o. and AlphaCrom d.o.o.
  • Sample Availability: Contact the corresponding author.

References

  1. Soria, A.C.; Gonzales, M.; de Lorenzo, C.; Castro-Martinez, I.; Sanz, J. Characterization of artisanal honeys from Madrid (central Spain) on the basis of their melissopalynological, physicochemical and volatile composition data. Food Chem. 2004, 85, 121–130. [Google Scholar] [CrossRef]
  2. Castro-Vázquez, L.; Díaz-Maroto, M.C.; Pérez-Coello, M.S. Volatile composition and contribution to the aroma of Spanish honeydew honey. Identification of a new marker. J. Agric. Food Chem. 2006, 54, 4809–4813. [Google Scholar] [CrossRef]
  3. Frankel, S.; Robinson, G.E.; Berenbaum, M.R. Antioxidant capacity and correlated characteristics of 14 unifloral honeys. J. Apicultural Res. 1998, 37, 27–31. [Google Scholar]
  4. Wang, X.-H.; Gheldof, N.; Engeseth, N.J. Effect of processing and storageon antioxidant capacity of honey. J. Food Sci. 2004, 69, 96–101. [Google Scholar]
  5. Antony, S.M.; Han, I.Y.; Rieck, J.R.; Dawson, P.L. Antioxidative effect of Maillard reaction products formed fromhoney at different reaction times. J. Agric. Food Chem. 2000, 48, 3985–3989. [Google Scholar] [CrossRef]
  6. Gheldof, N.; Engeseth, N.J. Antioxidant capacity of honeys from various floral sources based on the determination of oxygen radical aborbance capacity and inhibition of in vitro lipoprotein oxidation in human serum samples. J. Agric. Food Chem. 2002, 50, 3050–3055. [Google Scholar] [CrossRef]
  7. Roginsky, V.; Lissi, E.A. Review of methods to determine chain-breaking antioxidant activity in food. Food Chem. 2005, 92, 235–254. [Google Scholar] [CrossRef]
  8. Jerković, I.; Marijanović, Z.; Kezić, J.; Gugić, M. Headspace, volatile and semi-volatile organic compoundsdiversity and radical scavenging activity of ultrasonic solventextracts from Amorpha fruticosa honey samples. Molecules 2009, 14, 2717–2728. [Google Scholar] [CrossRef]
  9. Chatonnet, P. Incidence du bois de chene sur la composition chimique et les quelités organoleptiques des vins. Aplications technologiques. Ph.D. Thesis, Université de Bordeaux II, France, 1991. [Google Scholar]
  10. Villamiel, M.; del Castillo, M.D.; Corzo, N.; Olano, A. Presence of furosine in honeys. J. Sci. Food Agric. 2001, 81, 790–793. [Google Scholar] [CrossRef]
  11. Jerković, I.; Tuberoso, C.I.G.; Marijanović, Z.; Jelić, M.; Kasum, A. Headspace, volatile and semi-volatile patterns of Paliurus spina-christi unifloral honey as markers of botanical origin. Food Chem. 2009, 112, 239–245. [Google Scholar] [CrossRef]
  12. Louveaux, J.; Maurizio, A.; Vorwohl, G. Methods of melissopalynology. Bee World 1978, 59, 39–153. [Google Scholar]
  13. Bogdanov, S.; Martin, P.; Lüllman, C. Harmonised methods of the European Honey Comission. Apidologie 1997, extra issue, 1–59. [Google Scholar]
  14. El-Sayed, A.M. The pherobase: database of insect pheromones and semiochemicals. Available online: http://www.pherobase.com/. Accessed on 25 May 2010.
  15. Tuberoso, C.I.G.; Bifulco, E.; Jerković, I.; Caboni, P.; Cabras, P.; Floris, I. Methyl syringate: a chemical marker of asphodel (Asphodelus microcarpus Salzm. et Viv.) monofloral honey. J. Agric. Food Chem. 2009, 57, 3895–3900. [Google Scholar] [CrossRef]

