1. Introduction
The use of complementary alternative medicines, such as herbal-based medicines, is becoming increasingly popular [
1,
2,
3]. The most commonly used herbal medicines are St John’s wort, echinacea, garlic, ginseng, ginkgo biloba, valerian, ephedra and kava [
4].
In recent years, use of St. John's wort (
Hypericum perforatum L.) for the treatment of premenstrual syndrome [
5,
6], as well as for problems associated with menopause, such as mood shifts, sweating, anxiety, redness of the face and insomnia [
7,
8,
9] has been increasing. In addition, standardized extracts of
Hypericum perforatum L. are now commonly used for the treatment of depressive disorders [
10,
11].
Results from early clinical studies have been mixed, with some showing beneficial effects and others suggesting no benefit from St. John's wort for the treatment of mild to moderate forms of depression [
11,
12]. However, there is evidence that St. John's wort extracts are more effective than placebo for the treatment of mild to moderately severe depressive disorders [
13].
More recently, detailed studies have been conducted comparing the effects of different extracts of
Hypericum perforatum L
. versus standard antidepressives, using well-defined patient groups over longer periods of time [
14]. Based on these studies,
Hypericum extracts L. are significantly superior to placebo, and as effective as standard tricyclic antidepressive drugs. In addition, side effects were found to occur less often in
Hypericum treated patients
versus patients administered standard antidepressants [
14,
15]. The curative action of
Hypericum perforatum L. is associated with the presence of a series of bioactive compounds. Extracts from the flowers and leaves of
Hypericum perforatum L. contain at least ten classes of pharmacologically active components: flavonol derivatives, biflavones, proanthocyanidines, xanthones, phloroglucinols and naphthodianthrones [
16,
17]. Of these, hypericin and hyperforin [
18,
19] are the most studied. Both molecules are strongly active in biological systems [
3,
20], where they display an indirect influence on transmitter systems, manifest as changes in neuron excitability. The excitability of a neuron is determined by its membrane characteristics (including its various structures and canal receptors), along with system messengers (e.g., ion type and concentration, and various neurotransmitters), which generate effects through chemical synapses or ephaptic transfer.
It is widely accepted that epileptogenesis involves the transformation of normal, functional populations of neurons into chronically excited neurons, leading to hyper-synchronic activity in the neuron population [
21]. Hyper-excitability is a manifestation of neuronal dysfunction, which can be caused by many, often unknown, factors. The associated increase in neural activity causes changes in the local ionic environment, which further changes the excitability of the neuronal population. Because the bioactive constituents of
Hypericum perforatum L. have been shown to alter the excitability of neurons, in the present study we investigated the potential influence of various
Hypericum perforatim L. extracts on epileptogenesis.
Although different animal models have been proposed to evaluate the process of epileptogenesis [
22], the kindling model of epilepsy was chosen for the present study. This was because the kindling model, first described by Goddard approximately 40 years ago [
23], is still one of the most often cited experimental models of epilepsy [
24,
25].
2. Results and Discussion
Values observed for the minimum current strength necessary for threshold after-discharge in each experimental group are presented in
Table 1. In the control group, the minimum current strength necessary for threshold after-discharge was found to be 130 ± 18.70 μA,
versus 140 ± 9.27 μA and 140.00 ± 15.36 μA in experimental groups B and W, while the lowest values were observed for group E (110 ± 11.66 μA).
Table 1.
Minimum current strength (μA) necessary for threshold after-discharge: summary statistics.
Table 1.
Minimum current strength (μA) necessary for threshold after-discharge: summary statistics.
| GROUP\VARIABLE | C | W | B | E |
|---|
| Sample size | 9 | 9 | 9 | 9 |
| Lowest value | 130.00 | 140.00 | 140.00 | 110.00 |
| Highest value | 180.00 | 190.00 | 170.00 | 150.00 |
| Arithmetic mean | 150.00 | 168.88 | 161.11 | 131.11 |
| 95% CI for the mean | 135.61 to 164.38 | 157.07 to 180.70 | 153.97 to 168.24 | 122.14 to 140.07 |
| Median | 150.00 | 170.00 | 160.00 | 130.00 |
| 95% CI for the median | 130.00 to 168.62 | 152.75 to 180.00 | 160.00 to 170.00 | 121.38 to 140.00 |
| Variance | 350.00 | 236.11 | 86.11 | 136.11 |
| Standard deviation | 18.70 | 15.36 | 9.27 | 11.66 |
| Relative standard deviation | 0.12 (12.47%) | 0.09 (9.10%) | 0.05 (5.76%) | 0.08 (8.90%) |
| Standard error of the mean | 6.23 | 5.12 | 3.09 | 3.88 |
| Coefficient of Skewness | 0.29 (p = 0.6733) | −0.82 (p = 0.2411) | −1.46 (p = 0.0424) | 0.26 (p = 0.7018) |
| Coefficient of Kurtosis | −1.33 (p =0.2981) | 0.48 (p = 0.5940) | 3.28 (p = 0.0556) | 0.54 (p = 0.5695) |
| Kolmogorov-Smirnov test for Normal distribution | accept normality (p = 0.86) | accept normality (p = 0.70) | accept normality (p = 0.99) | accept norrmality (p = 0.61) |
Correlation coefficients between the average values of minimum current strength in different groups are presented in
Table 2, while the statistical difference between mean values of discharged current strength are shown in
Table 3.
Table 2.
Pearson correlation coefficients between the average values of minimum current strength for different groups.
Table 2.
Pearson correlation coefficients between the average values of minimum current strength for different groups.
| GROUP | C | W | B | E |
|---|
| C | Correlation Coefficient | | −0.47 | 0.14 | 0.20 |
| Significance Level P | | 0.19 | 0.71 | 0.46 |
| n | | 9 | 9 | 9 |
| W | Correlation Coefficient | −0.47 | | 0.010.989 | −0.20 |
| Significance Level P | 0.19 | | | 0.60 |
| n | 9 | | | 9 |
| B | Correlation Coefficient | 0.14 | 0.010.989 | | 0.68 |
| Significance Level P | 0.71 | | | 0.04 |
| n | 9 | | | 9 |
| E | Correlation Coefficient | 0.28 | −0.20 | 0.68 | |
| Significance Level P | 0.45 | 0.60 | 0.04 | |
| n | 9 | 9 | 9 | |
Table 3.
Statistical difference between mean discharged current strength values *.
Table 3.
Statistical difference between mean discharged current strength values *.
| C | W | B | E |
|---|
| C | Difference | | 18.89 | 11.11 | −18.89 |
| Standard Error | | 8.07 | 6.96 | 7.35 |
| Test statistic t | | 2.341 | 1.596 | −2.570 |
| Significance Level p | | p = 0.0325 | p = 0.136 | p = 0.0233 |
| W | Difference | 18.89 | | 7.78 | 37.78 |
| Standard Error | 8.07 | | 5.98 | 6.43 |
| Test statistic t | 2.341 | | −1.300 | −5.874 |
| Significance Level p | p = 0.0325 | | p = 0.2121 | p < 0.0001 |
| B | Difference | 11.11 | 7.78 | | 30.00 |
| Standard Error | 6.96 | 5.98 | | 4.97 |
| Test statistic t | 1.596 | −1.300 | | 6.037 |
| Significance Level p | p = 0.136 | p= 0.2121 | | p < 0.0001 |
| E | Difference | −18.89 | −37.78 | 30.00 | |
| Standard Error | 7.35 | 6.43 | 4.97 |
| Test statistic t | −2.570 | −5.874 | 6.037 |
| Significance Level p | p = 0.0233 | p < 0.0001 | p < 0.0001 |
As can be seen, significant statistical differences were observed between groups W and E, and between groups B to E (see
Table 3).
As shown in
Table 4, the discharge duration AD lasted for an average of 9.55 ± 2.50 s in the control group, and only 8.00 ± 1.41 s in the W group, and 8.33 ± 2.69 s in the group B. In contrast, group E displayed the longest AD duration (11.22 ± 1.56 s). Following a similar trend, the shortest discharge duration time AD observed in control, W and B group animals was 5 s, while for animals from group E, a duration time of 9s was recorded. The longest duration time for the first AD in both the control group and group E was 13 s.
Table 4.
Threshold after-discharge duration times (in seconds) - summary statistics.
Table 4.
Threshold after-discharge duration times (in seconds) - summary statistics.
| GROUP\VARIABLE | C | W | B | E |
|---|
| Sample size | 9 | 9 | 9 | 9 |
| Lowest value | 5.00 | 5.00 | 5.00 | 9.00 |
| Highest value | 13.00 | 9.00 | 12.00 | 13.00 |
| Arithmetic mean | 9.55 | 8.00 | 8.33 | 11.22 |
| 95% CI for the mean | 7.62 to 11.48 | 6.91 to 9.08 | 6.26 to 10.40 | 10.02 to 12.42 |
| Median | 10.00 | 9.00 | 8.00 | 12.00 |
| 95% CI for the median | 8.00 to 11.86 | 7.00 to 9.00 | 5.13 to 11.72 | 9.13 to 12.86 |
| Variance | 6.27 | 2.00 | 7.250 | 2.44 |
| Standard deviation | 2.50 | 1.41 | 2.69 | 1.56 |
| Relative standard deviation | 0.26 (26.22%) | 0.17 (17.68%) | 0.32 (32.31%) | 0.13 (13.93%) |
| Standard error of the mean | 0.83 | 0.47 | 0.89 | 0.52 |
| Coefficient of Skewness | −0.45 (p = 0.518) | −1.36 (p = 0.058) | 0.13 (p = 0.844) | −0.46 (p = 0.503) |
| Coefficient of Kurtosis | −0.26 (p = 0.7024) | 1.32 (p = 0.3016) | −1.27 (p = 0.3124) | −1.34 (p = 0.296) |
| Kolmogorov-Smirnov test for Normal distribution | accept normality (p = 0.9135) | accept normality (p = 0.8733) | accept normality (p = 0.9895) | accept normality (p = 0.7821) |
Correlation coefficients for duration after discharge values observed for different groups are presented in
Table 5.
Table 5.
Pearson correlation coefficients for duration after discharge values observed for different groups.
Table 5.
Pearson correlation coefficients for duration after discharge values observed for different groups.
| | C | W | B | E |
|---|
| C | Correlation Coefficient | | 0.85 | 0.14 | 0.22 |
| Significance Level P | | 0.0040 | 0.7274 | 0.5698 |
| n | | 9 | 9 | 9 |
| W | Correlation Coefficient | 0.85 | | 0.56 | 0.51 |
| Significance Level P | 0.0040 | | 0.1184 | 0.1619 |
| n | 9 | | 9 | 9 |
| B | Correlation Coefficient | 0.14 | 0.56 | | 0.43 |
| Significance Level P | 0.7274 | 0.1184 | | 0.2534 |
| n | 9 | 9 | | 9 |
| E | Correlation Coefficient | 0.22 | 0.51 | 0.43 | |
| Significance Level P | 0.5698 | 0.1619 | 0.2534 | |
| n | 9 | 9 | 9 | |
Comparison of the duration of threshold AD in the analyzed groups revealed that the average discharge duration AD in group E was significantly longer than in animals from group W and group B (see
Table 6). In addition, analysis of the duration of threshold AD showed that the average discharge duration AD in group W was shorter than that observed for groups B and C, although these results were not significant.
Table 6.
Statistical differences between mean values of threshold after-discharge current strength *.
Table 6.
Statistical differences between mean values of threshold after-discharge current strength *.
| | C | W | B | E |
|---|
| C | Difference | | −1.56 | −1.22 | 1.67 |
| Standard Error 95% CI of difference | 0.96 | 1.23 | 0.98 |
| Test statistic t | −3.627 to 0.516 | −3.821 to 1.3768 | −0.460 to 3.793 |
| −1.622 | −0.997 | 1.693 |
| Significance Level p | p = 0.3336 | p = 0.1143 |
| p = 0.1288 | | |
| W | Difference | −1.56 | | 0.33 | 3.22 |
| Standard Error | 0.96 | 1.01 | 0.70 |
| 95% CI of differenceTest statistic t | −3.62 to 0.516 | −1.875 to 2.542 | 1.732 to 4.711 |
| Significance Level p | −1.622 | 0.329 | 4.585 |
| p = 0.1288 | p = 0.7480 | p = 0.0003 |
| B | Difference | −1.22 | 0.33 | | 2.89 |
| Standard Error | 1.23 | 1.01 | 1.04 |
| 95% CI of differenceTest statistic t | −3.821 to 1.37 | −1.875 to 2.542 | 0.646 to 5.131 |
| Significance Level p | −0.997 | 0.329 | 2.783 |
| p = 0.3336 | p = 0.7480 | p = 0.0155 |
| E | Difference | 1.67 | 3.22 | 2.89 | |
| Standard Error | 0.98 | 0.70 | 1.04 |
| 95% CI of differenceTest statistic t | −0.46 to 3.793 | 1.73 to 4.7119 | 0.646 to 5.131 |
| Significance Level p | 1.693 | 4.585 | 2.783 |
| p = 0.1143 | p = 0.0003 | p = 0.0155 |
The average number of electro-stimulations necessary for the development of full kindling is shown in
Table 7.
Table 7.
The average number of electro-stimulations necessary for the development of full kindling - summary statistics.
Table 7.
The average number of electro-stimulations necessary for the development of full kindling - summary statistics.
| GROUP\VARIABLE | C | W | B | E |
|---|
| Sample size | 9 | 9 | 9 | 9 |
| Lowest value | 35.00 | 33.00 | 32.00 | 28.00 |
| Highest value | 47.00 | 49.0 | 47.0 | 39.0 |
| Arithmetic mean | 41.66 | 41.88 | 41.55 | 34.66 |
| 95% CI for the mean | 38.47 to 44.85 | 37.81 to 45.96 | 37.45 to 45.66 | 31.64 to 37.69 |
| Median | 42.0 | 43.0 | 41.0 | 35.0 |
| 95% CI for the median | 37.27 to 46.58 | 38.00 to 47.72 | 35.68 to 46.86 | 29.68 to 38.00 |
| Variance | 17.25 | 28.11 | 28.52 | 15.50 |
| Standard deviation | 4.15 | 5.30 | 5.34 | 3.93 |
| Relative standard deviation | 0.09 (9.97%) | 0.12 (12.66%) | 0.12 (12.85%) | 0.11 (11.36%) |
| Standard error of the Mean | 1.38 | 1.76 | 1.78 | 1.31 |
| Coefficient of | −0.22 | −0.19 | −0.74 | −0.81 |
| Skewness | (p = 0.751) | (p = 0.776) | (p = 0.290) | (p = 0.246) |
| Coefficient of | −0.83 | −0.83 | −0.46 | −0.51 |
| Kurtosis | (p = 0.451) | (p = 0.449) | (p = 0.604) | (p = 0.580) |
| Kolmogorov-Smirnov test for | accept normality | accept normality | accept normality | accept normality |
| Normal distribution | (p = 0.9983) | (p = 0.9762) | (p = 0.8850) | (p = 0.7690) |
Pearson correlation coefficients calculated between groups for the average number of electrical stimulations necessary for the development of full kindling epilepsy were not statistically significant.
However, through application of the t test, we found that the number of electro-stimulations necessary for the development of full kindling was statistically lower in group E
versus groups C, W and B (
Table 8).
Table 8.
Statistical difference between mean values of the average number of electro-stimulations necessary for the development of kindling threshold after-discharge *.
Table 8.
Statistical difference between mean values of the average number of electro-stimulations necessary for the development of kindling threshold after-discharge *.
| | C | W | B | E |
|---|
| C | Difference | | 0.22 | −0.11 | −7.00 |
| Standard Error | | 2.25 | 2.26 | 1.91 |
| 95% CI of difference | | −4.562 to 5.007 | −4.918 to 4.696 | −11.043 to −2.95 |
| Test statistic t | | 0.0990 | −0.0493 | −3.670 |
| Significance Level P | | p = 0.9225 | p = 0.9614 | p = 0.0021 |
| W | Difference | 0.22 | | −0.33 | −7.22 |
| Standard Error | 2.25 | | 2.51 | 2.20 |
| 95% CI of difference | −4.562 to 5.007 | | −5.65 to 4.98 | −11.91 to −2.53 |
| Test statistic t | 0.0990 | | −0.133 | −3.281 |
| Significance Level P | p = 0.9225 | | p = 0.8959 | p = 0.0051 |
| B | Difference | −0.11 | −0.33 | | −6.89 |
| Standard Error | 2.26 | 2.51 | | 2.21 |
| 95% CI of difference | −4.918 to 4.696 | −5.65 to 4.98 | | −11.603 to −2.17 |
| Test statistic t | −0.0493 | −0.133 | | −3.115 |
| Significance Level P | p = 0.9614 | p = 0.895 | | p = 0.0071 |
| E | Difference | 7.00 | −7.22 | −6.89 | |
| Standard Error | 1.91 | 2.20 | 2.21 | |
| 95% CI of difference | −11.04 to −2.95 | −11.91 to −2.53 | −11.60 to −2.174 | |
| Test statistic t | −3.670 | −3.281 | −3.115 | |
| Significance Level P | p = 0.0021 | p = 0.0051 | p = 0.0071 | |
As shown in
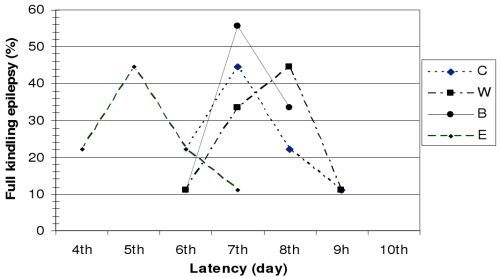
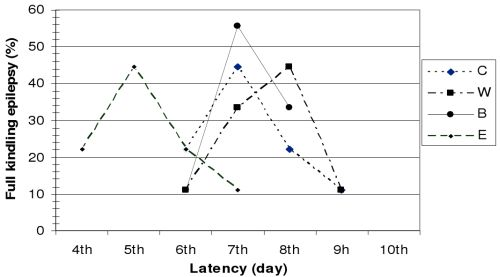
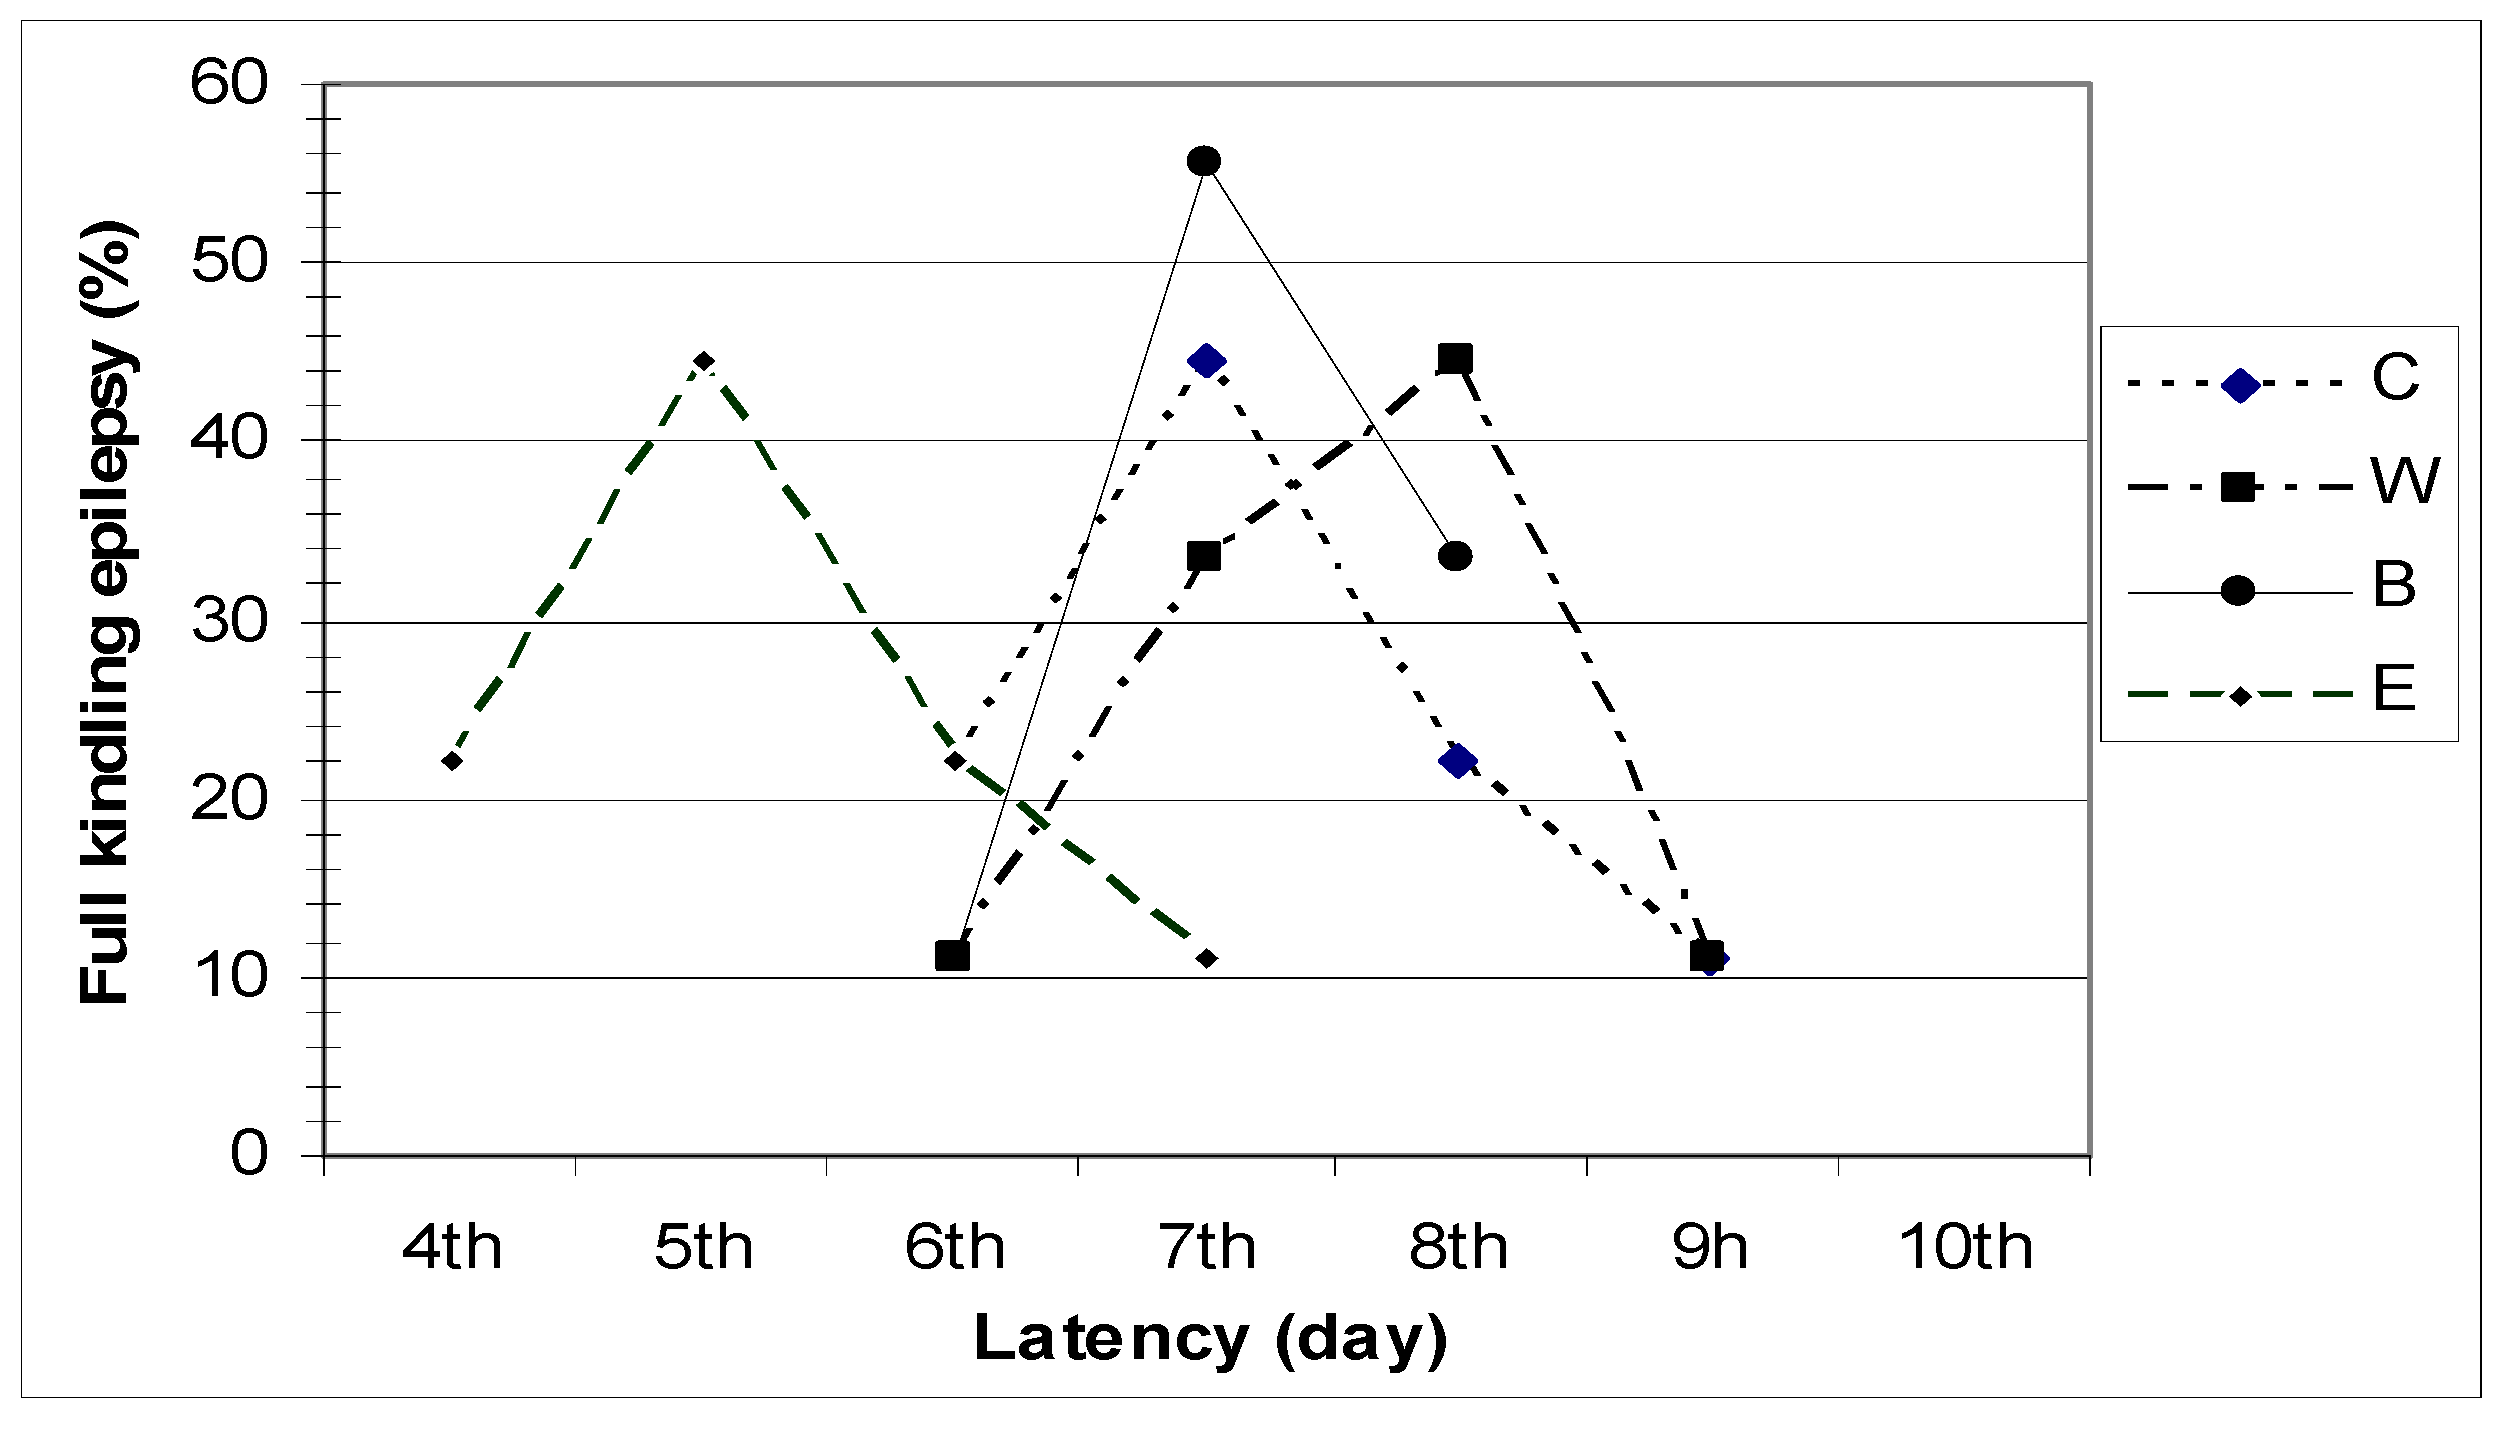
Figure 1, the latency period observed before the development of full kindling differed in animals from different groups.
Figure 1.
Latency period for the development of full kindling epilepsy.
Figure 1.
Latency period for the development of full kindling epilepsy.
Based on Racine's seizure classification, two consecutive grade 5 seizures were observed in 44.44% of control group (C) animals by the end of the 7th electro-stimulation day, and in 22.22% on the 6th and 8th day of hippocampus stimulation.
In group W, the latency period before the development of full kindling epilepsy was eight days in 44.44% of the animals, seven days in 33.33%, nine days in 11.11%, and six days in 11.11% of the animals.
In group B, the latency period before the development of full kindling epilepsy lasted six days in 11.11% of the animals, seven days in 55.55%, and eight days in 33.33% of the animals.
In group E, full kindling epilepsy was observed in 44.44% of the animals on the 5th day of hippocampal electro-stimulation, in 11.11% on the 7th day, and in 22.22% of the animals on the 4th and 6th day of stimulation.
Our results clearly show that application of the tested Hypericum perforatum L. extracts significantly influences the development of epileptogenesis and the development of full kindling epilepsy.
With respect to the intensity of electrical stimulation necessary for the development of AD discharge, we observed that threshold currents necessary for the emergence of epileptic discharge were lower in control animals then in animals administered either aqueous or butanol extracts of Hypericum perforatum L. In fact, this difference was statistically significant between groups C and W, suggesting that administration of the water extract of Hypericum perforatum L. significantly inhibits the development of epileptic discharge. In contrast, treatment of animals with the ether extract of Hypericum perforatum L. lowered the minimum current strength necessary for discharge; the mean values of current intensity in this group were significantly lower versus the mean intensity observed for the control group.
In addition to the above, the influence of the tested Hypericum perforatum L. extracts on epileptogenesis is also supported by results from our analysis of AD duration. In animals administered ether extracts, AD durations were statistically significantly longer than controls, while animals treated with water or butanol extracts displayed shorter AD duration times than control animals.
Interestingly, treatment of animals with the ether extract of Hypericum perforatum L. had the opposite effect on epileptogenesis versus water and butanol extract treatments. In fact, the above analysis suggests that etheric Hypericum perforatum L. extracts may actually have epileptic effects. This negative influence from the ether extract of Hypericum perforatum L. was also observed in analyses of the number of electrical stimulations and the duration of the latency delivery period required for the development of full kindling epilepsy. In total, these results suggest that water and butanol extracts of Hypericum perforatum L. reduce the excitability of neurons, while, in contrast, the ether extract increases neuronal excitability. In addition, our results clearly show that the effect of Hypericum perforatum L. on epileptogensis strongly depends on the type of plant extract applied.
In agreement with the results of the present study, we have previously shown that administration of different extracts of
Hypericum perforatum L. to experimental animals with already formed epilepsy has a similar effect on epileptic discharge: the non-polar ether fraction potentiates epileptic activity, while the polar fractions repress epileptic activity [
26,
27]. Similarly, in a study comparing the effects of ethanol, ethyl acetate, and water extracts of
Hypericum perforatum L., extract polarity has been shown to affect neuronal excitability [
28]. Moreover, the less polar extract fraction displayed significantly stronger analgesic activity [
28].
According to Hosseinzadeh
et al. [
29], ethanol and water extracts of the aerial part of
Hypericum perforatum L
. increased the latency of convulsions induced by pentylenetetrazole in a dose-dependent manner in a mouse model of petit mal epilepsy. In addition, both extracts increased the latency of convulsions induced by an alternating current stimulus. The authors suggest that it is possible that this anticonvulsant activity may be mediated through the nitric oxide pathway.
Based on the results of the present study, it is clear that the different extracts of St. John's wort investigated here contain different active principles, which have different activities against the processes of epileptogenesis. To date, the known active constituents of St. John's wort are napthodianthrones (hypericin, pseudohypericin), flavonoids (quercetin, amentoflavone, hyperin), phloroglucinols (hyperforin, adhyperforin) and essential oils [
14,
15,
16,
17,
30]. The concentration and composition of active constituents in the extracts tested here are different from case to case.
Interestingly, it may be possible that the same active (constituents) principles of
Hypericum perforatum L
. that have been shown to have antidepressant effects may also have pro-epileptic effects. As demonstrated in numerous works, the antidepressant activity of hypericum extracts has been attributed to the phloroglucinol derivative of hyperforin, hypericin, as well as to napthodianthrones and pseudohypericin [
18,
19,
31,
32], which acts on transmitter systems. Initial biochemical studies reported that St John's wort is only a weak inhibitor of monoamine oxidase-A and -B activity. Hyperforin has been reported to inhibit the reuptake of a variety of neurotransmitters, such as γ-aminobutyric acid (GABA), 5-hydroxytryptamine (5-HT), dopamine (DA) and noradrenalin [
33,
34]. However, other
in vitro binding assays carried out using St John's wort extract demonstrated significant affinity for adenosine, GABA A, GABA B and glutamate receptors.
In vivo, St John's wort extract leads to down-regulation of β-adrenergic receptors and up-regulation of serotonin 5-HT2 receptors in the rat frontal cortex, and causes changes in neurotransmitter concentrations in brain areas that are implicated in depression [
17]. These data clearly show that long-term, but not short-term administration of St. John’s wort and its active constituent hypericin modify the levels of neurotransmitters in brain regions involved in the pathophysiology of depression, the hippocampus and hypothalamus [
35]. One of these brain structures, the hippocampus, is also responsible for initiation of epileptic discharge in our experimental model. We hypothesize that some active principles from the
Hypericum perforatum L. extracts tested here stimulate GABA receptors, causing antiepileptic effects, while other constituents influence the level of catecholamines and act as pro-epileptics. However, it is necessary to further analyze the impact of specific active principles on epileptogenesis in different experimental models.


