17O-Dynamic NMR and DFT Investigation of Bis(acyloxy)iodoarenes

Abstract
:
1. Introduction


2. Results and Discussion
2.1. Bis(acetoxy)iodobenzene (1)


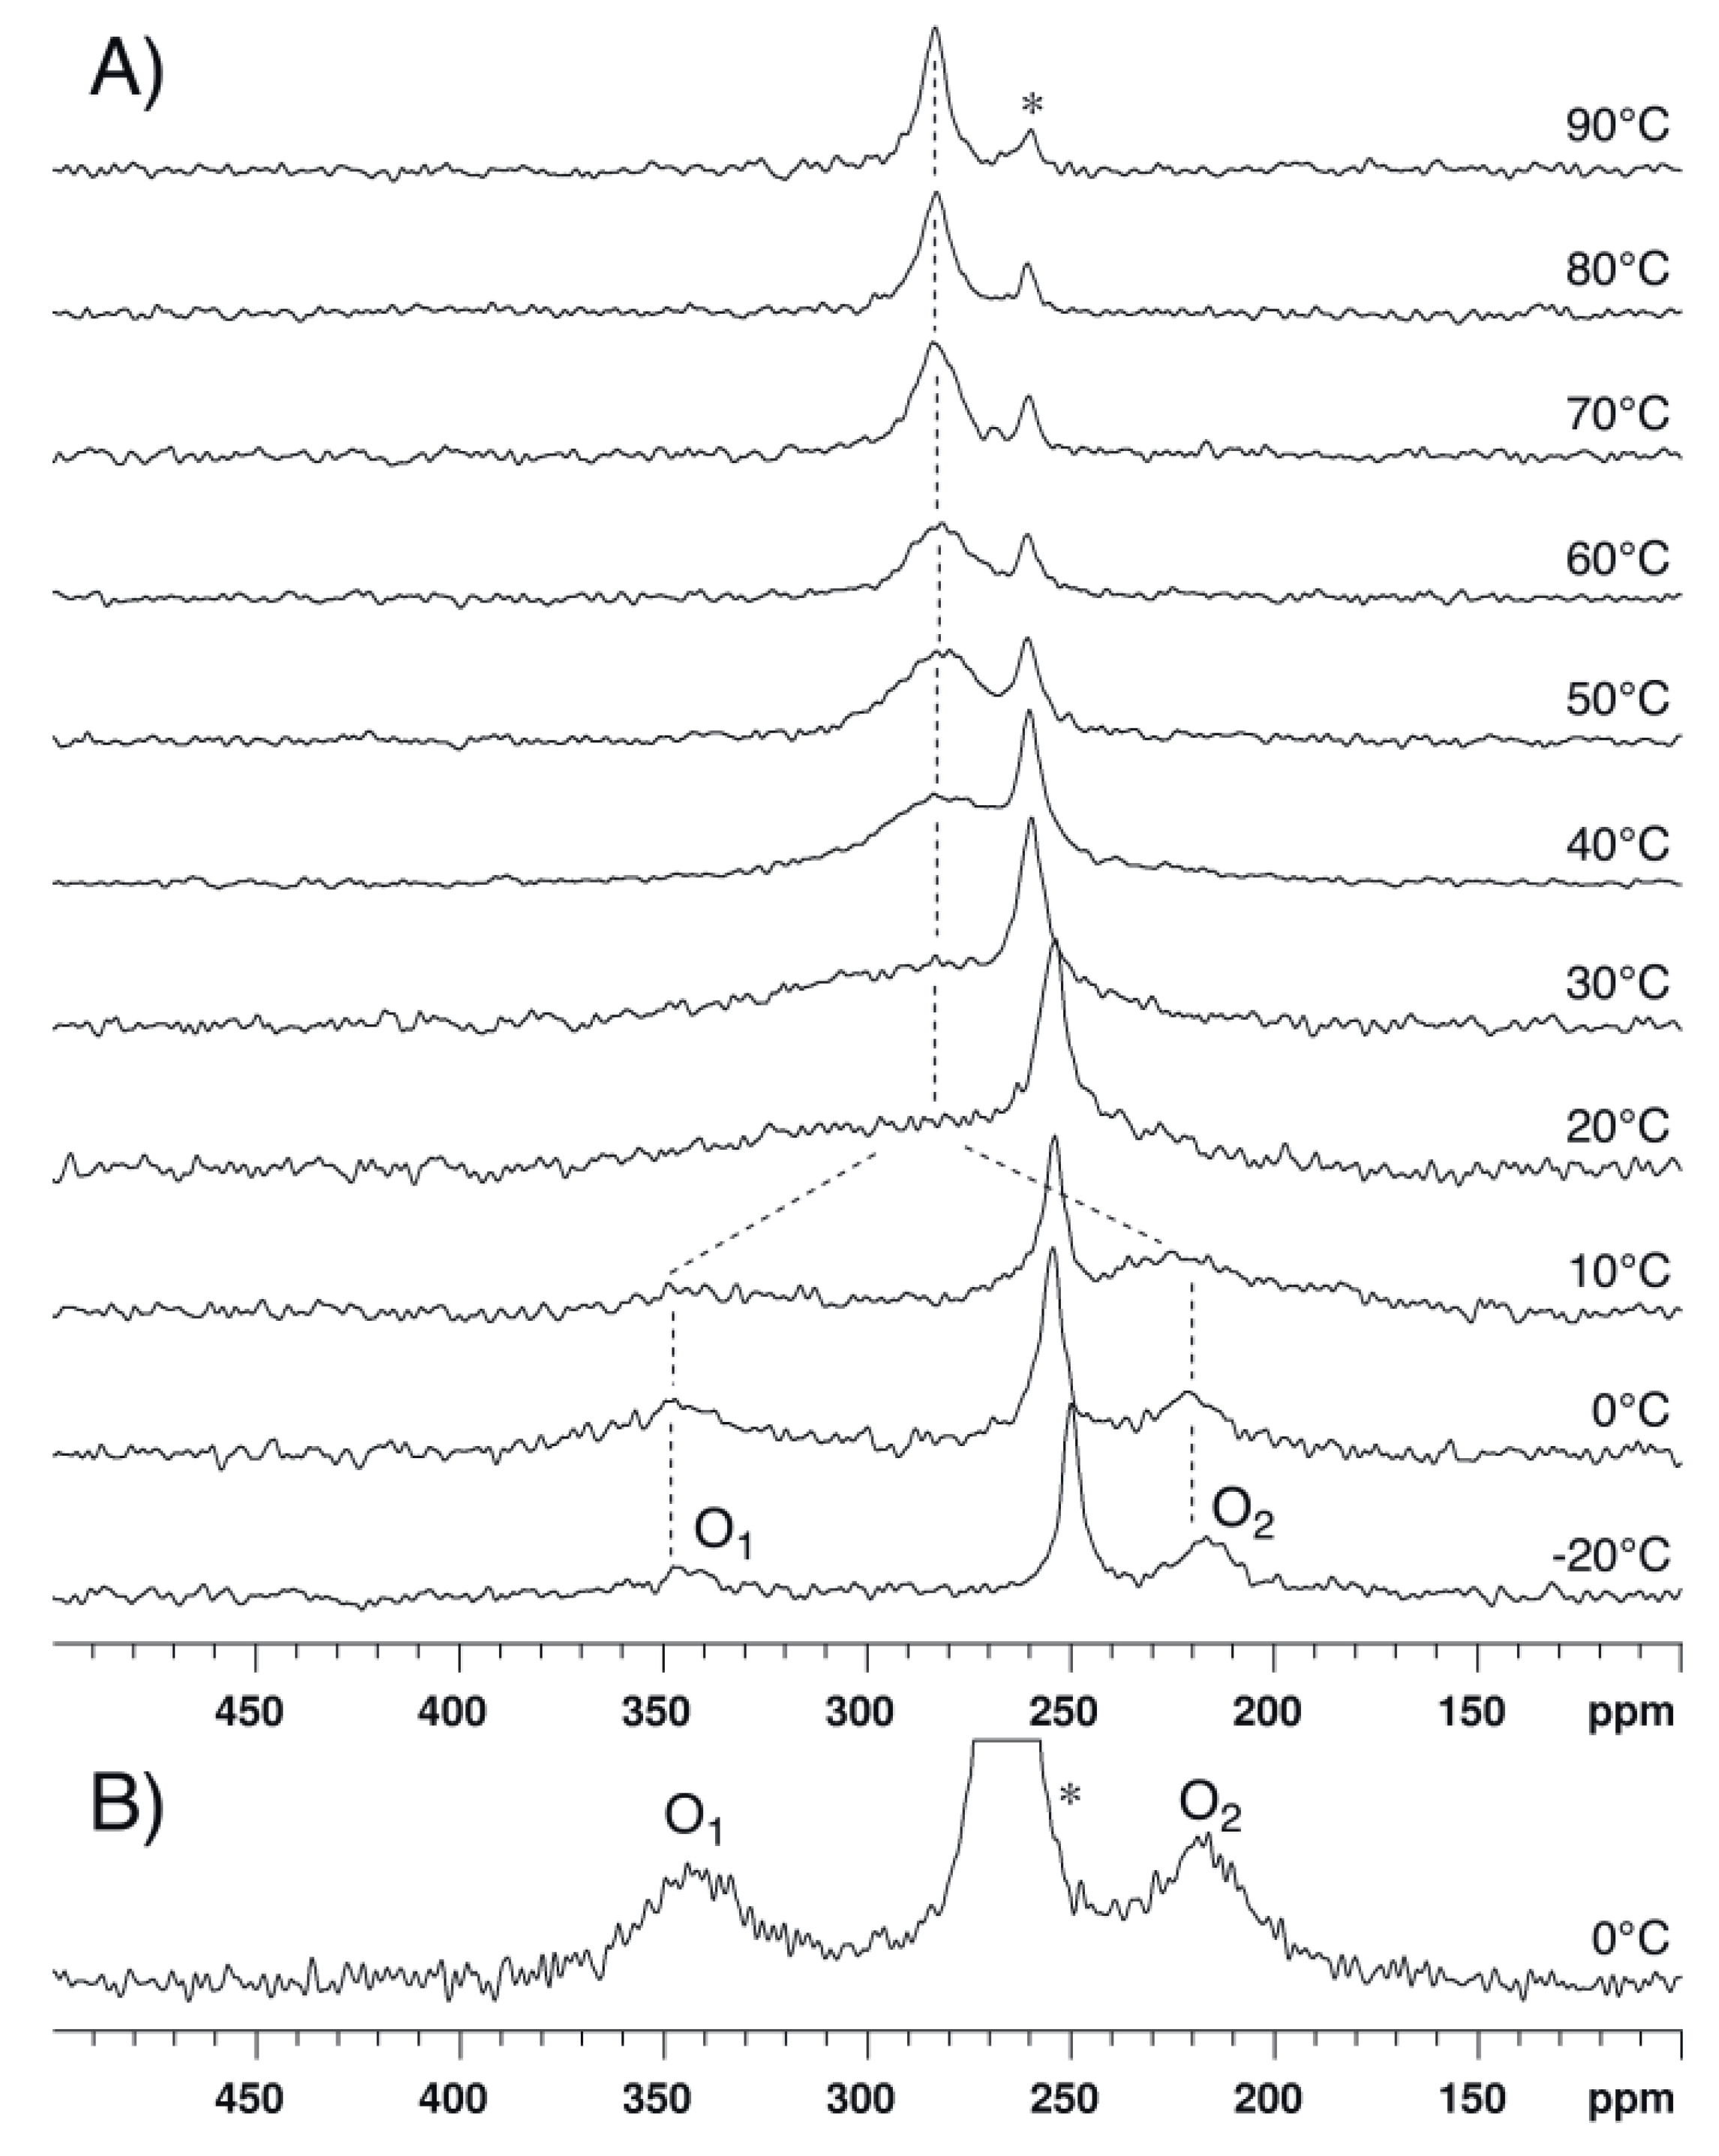
2.2. Bis(trifluoroacetoxy)iodobenzene (2)

2.3. para-Methoxy-Bis(acetoxy)iodobenzene (3) and para-Nitro-Bis(acetoxy)iodobenzene (4)

| ΔE | Solvent | δ1 | δ2 | Δδ | Tc | ΔG# | |
|---|---|---|---|---|---|---|---|
| kJ mol−1 | (ppm) | (ppm) | (ppm) | (°C) | kJ mol−1 | ||
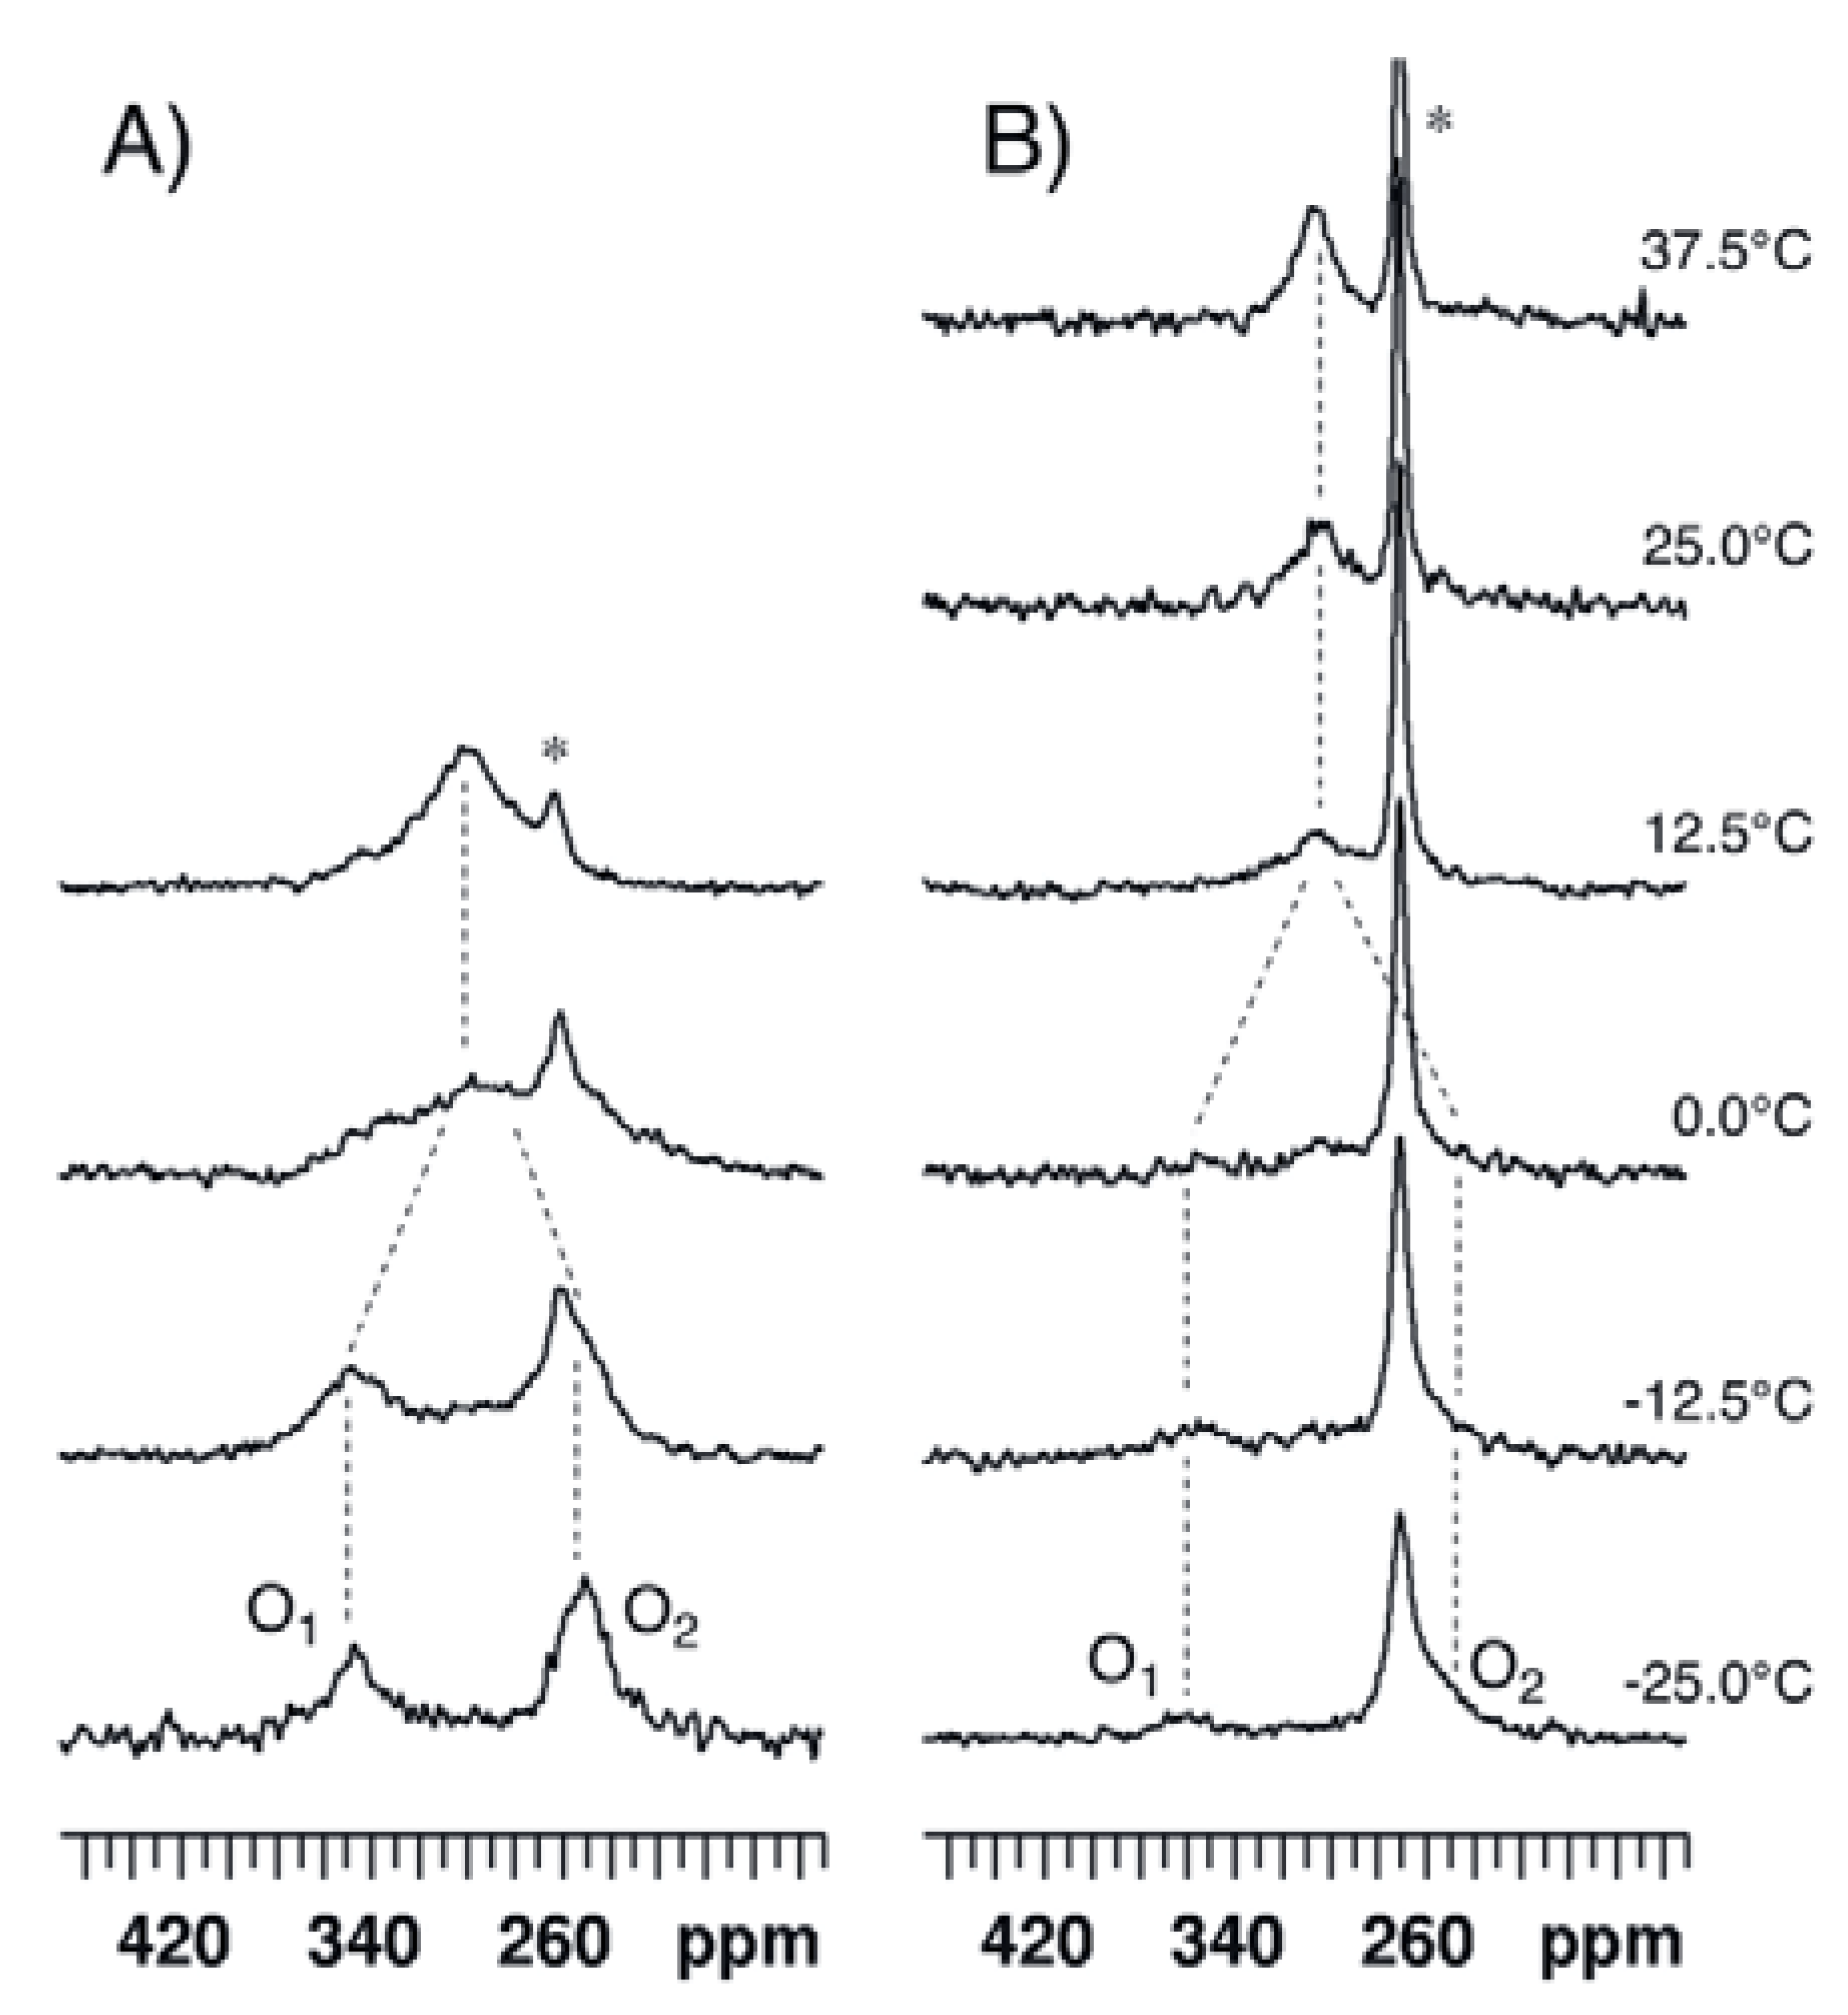
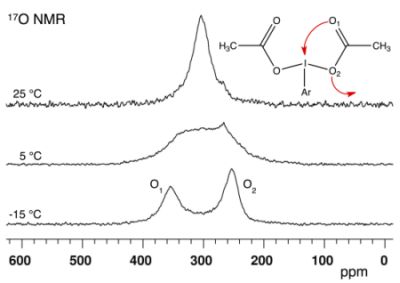
| 1 | 45.2 48.3 a | CDCl3 | 349 | 246 | 103 | 5 | 45.5 ± 0.1 b |
| CD2Cl2 | 355 | 251 | 104 | 10 | 46.0 | ||
| CD3CN | 358 | 251 | 107 | 15 | 46.8 | ||
| 2 | 48.4 | CDCl3 | 345 c | 221 c | 124 | 20 | 47.3 |
| CD3CN | 341 | 218 | 123 | n.d. | n.d. | ||
| 3 | 44.4 | CDCl3 | 349 | 254 | 95 | −5 | 43.7 |
| 4 | 45.2 | CDCl3/DMSO-d6d | 359 | ~255 e | ~104 | 5 | 45.2 |
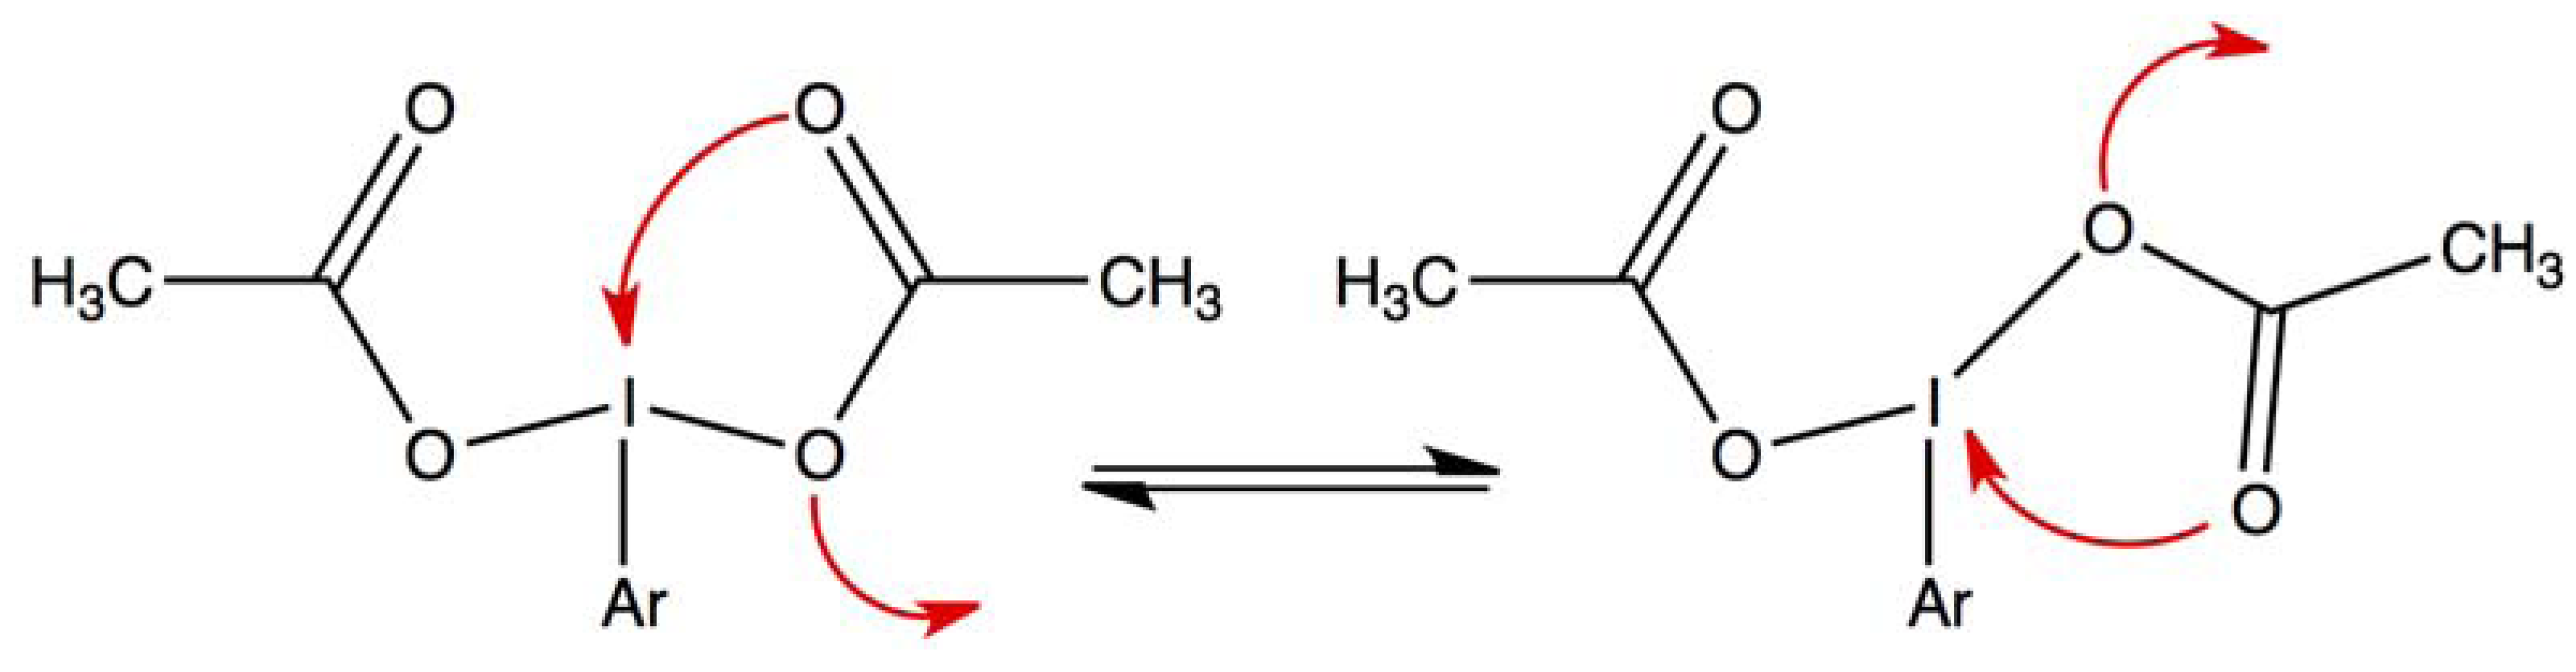
2.4. Comparisons with DFT Calculations and Discussion
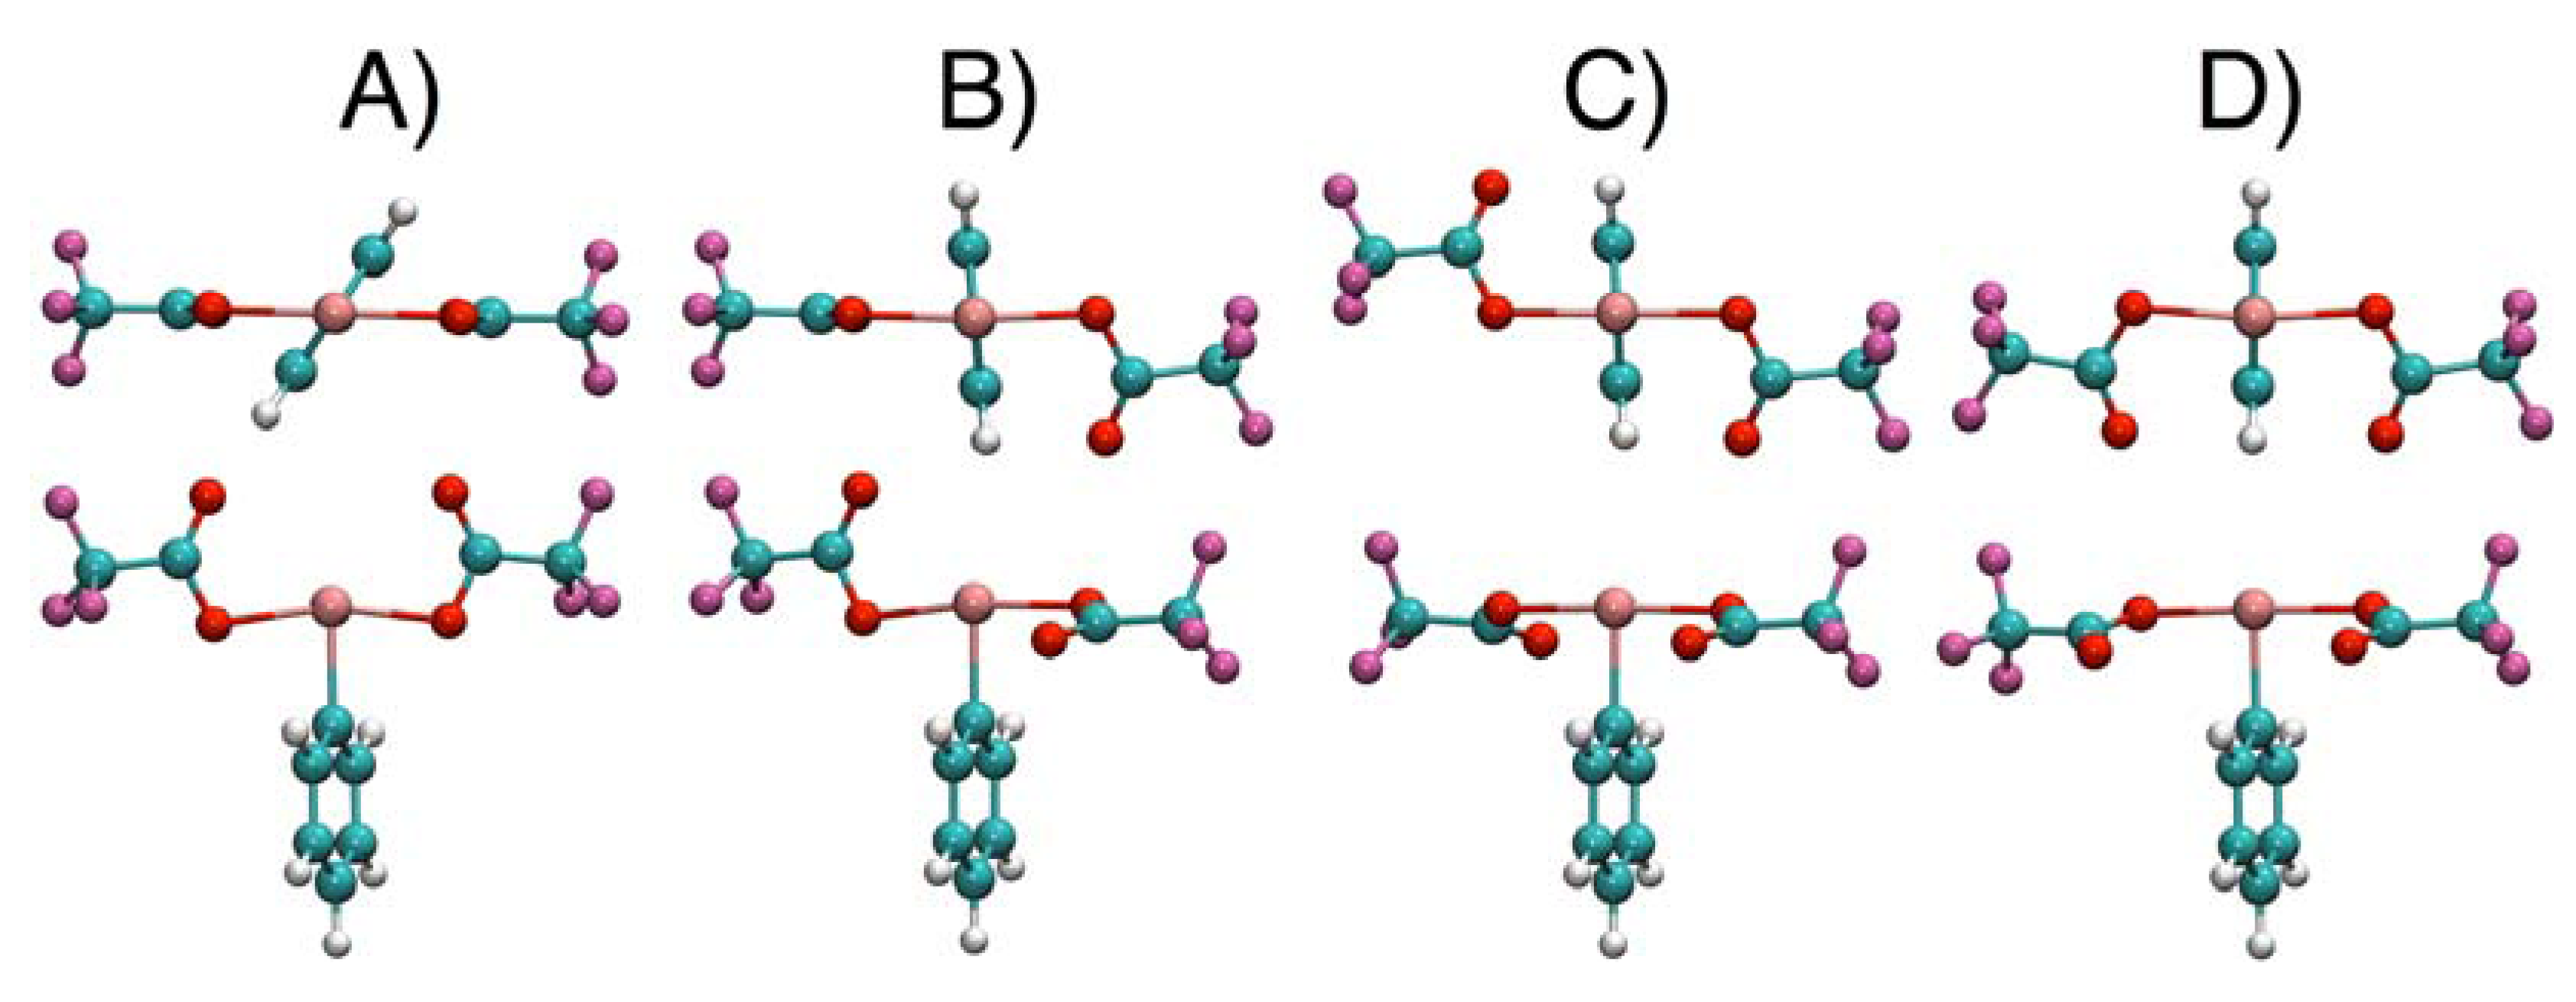
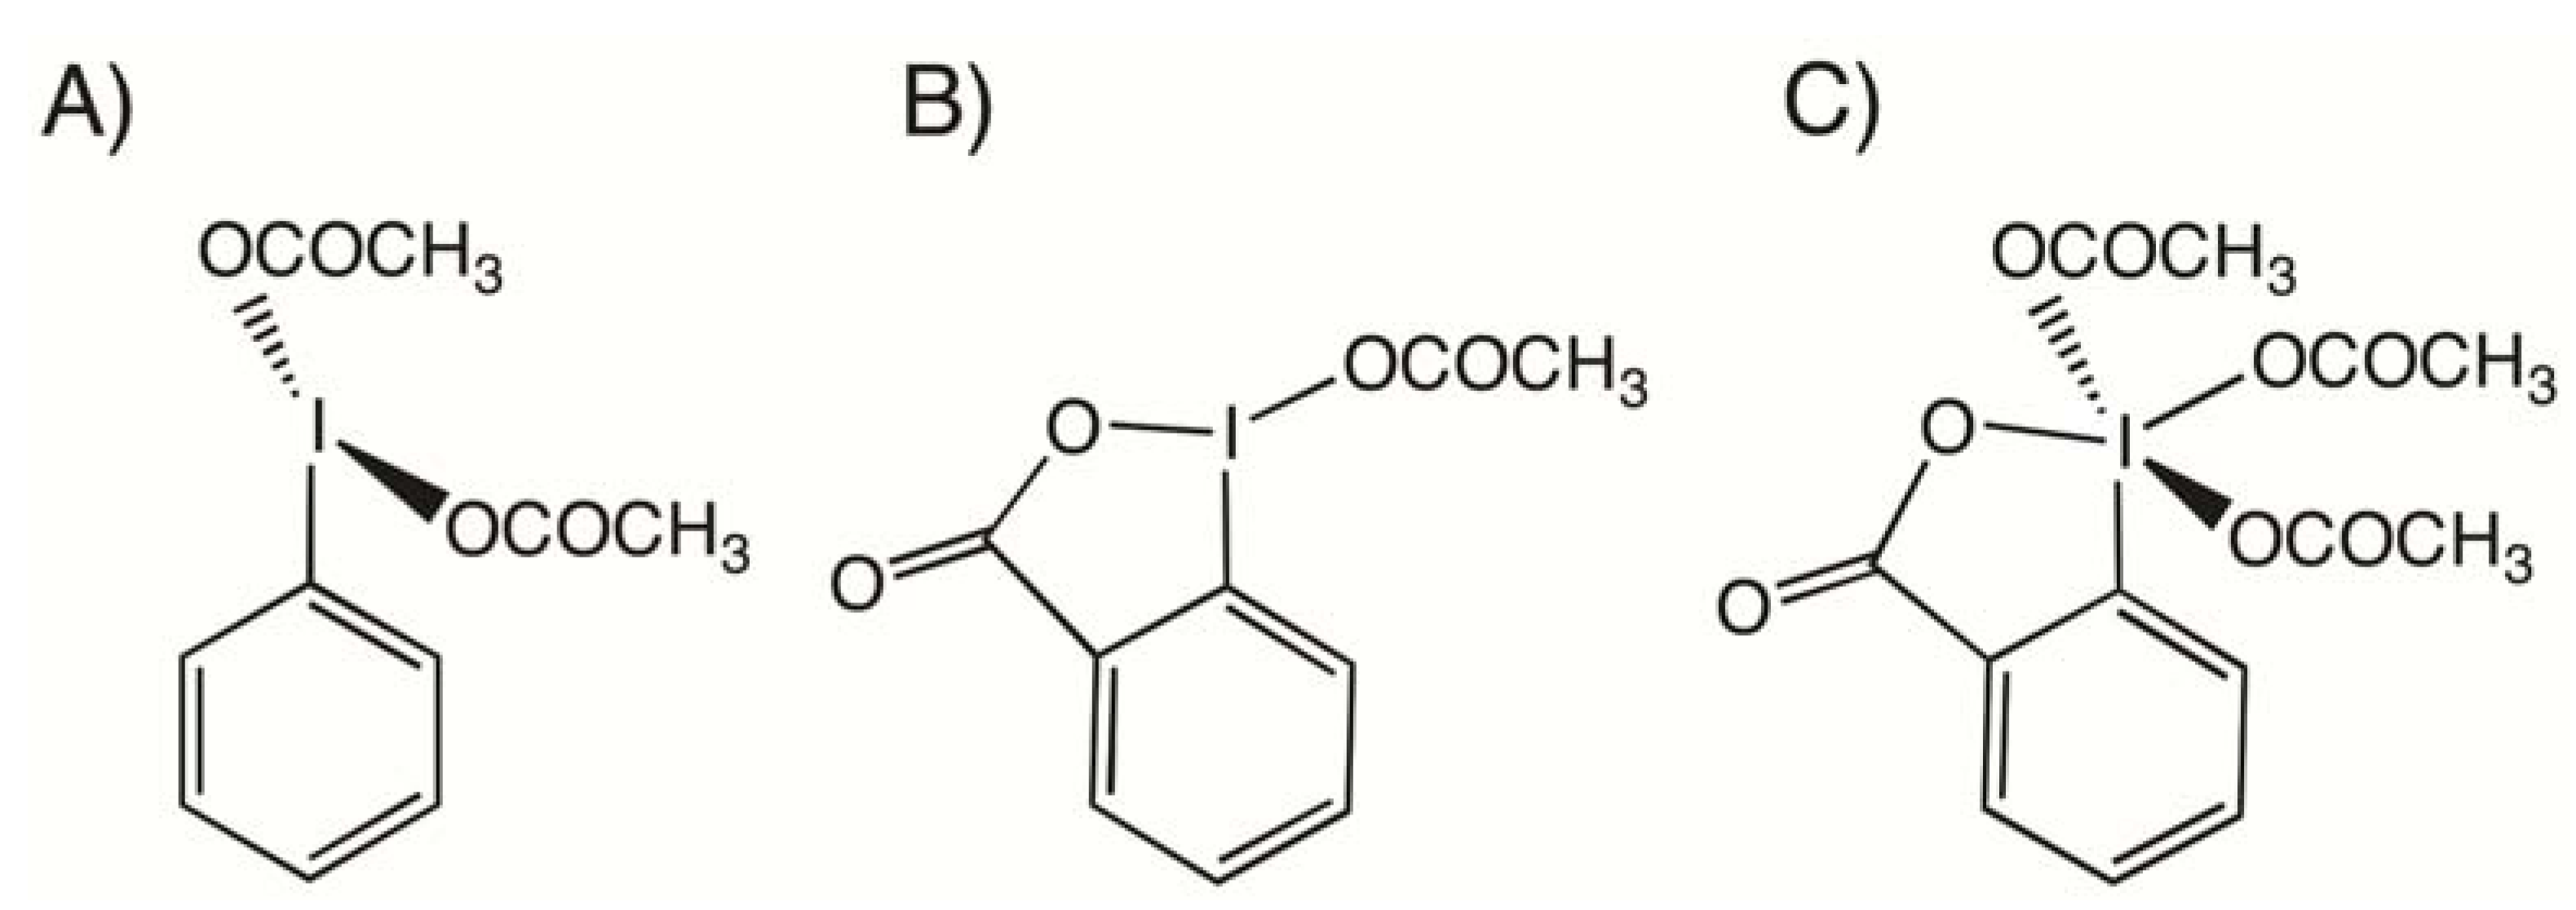
| Conformer | 1 | 2 | 3 | 4 |
|---|---|---|---|---|
| A | 0.0 | 0.4 | 0.0 | 0.0 |
| B | 1.7 | 0.0 | 0.8 | 3.7 |
| C | 5.7 | 1.6 | 8.4 | 8.1 |
| D | 9.3 | 3.2 | 7.6 | 7.7 |
| I-Cac-O1 (°) | ΔE kJ/mol | Dihedral angles (°) | |
|---|---|---|---|
| Ci-I-O1-Cac | Co-Ci-I-O2a | ||
| 80 | 0.6 | 0.2 | 58.5 |
| 75 | 3.4 | 1.3 | 62.3 |
| 70 | 10.2 | 0.0 | 90.0 |
| 65 | 22.0 | 0.0 | 90.0 |
| 60 | 38.3 | 0.0 | 90.0 |
| 55 | 26.3 | −78.2 | 90.0 |
| 50 | 13.5 | −78.5 | 90.1 |
| 45 | 3.3 | −77.9 | 92.1 |
| 40 | 0.0 | −76.7 | 96.3 |
| TS (58.3) | 48.4 | −41.9 | 76.5 |
| Compound | Global Minimum | Transition State | ||
|---|---|---|---|---|
| I-O1 | I-O2 | I-O1 | I-O2 | |
| 1 | 0.06 | 0.42 | 0.28 | 0.16 |
| 2 | 0.04 (0.02) a | 0.42 (0.42) a | 0.25 | 0.15 |
| 3 | 0.07 | 0.41 | 0.27 | 0.16 |
| 4 | 0.08 | 0.42 | 0.29 | 0.15 |
3. Experimental
3.1. NMR Measurements
3.2. Computational Details
4. Conclusions
Supplementary Materials
Acknowledgements
References and Notes
- Merritt, E.A.; Olofsson, B. Diaryliodonium salts: A journey from obscurity to fame. Angew. Chem. Int. Ed. 2009, 48, 9052–9070. [Google Scholar] [CrossRef]
- Ladziata, U.; Zhdankin, V.V. Hypervalent iodine(V) reagents in organic synthesis. ARKIVOC 2006, 9, 26–58. [Google Scholar]
- Zhu, C.; Sun, C.; Wei, Y. Direct oxidative conversion of alcohols, aldehydes and amines into nitriles using hypervalent iodine(III) reagent. Synthesis 2010, 24, 4235–4241. [Google Scholar]
- Yusubov, M.S.; Zhdankin, V.V. Hypervalent iodine reagents and green chemistry. Curr. Org. Synth. 2012, 9, 247–272. [Google Scholar]
- Dohi, T.; Maruyama, A.; Minamitsuji, Y.; Takenaga, N.; Kita, Y. First hypervalent iodine(III)-catalyzed C-N bond forming reaction: Catalytic spirocyclization of amides to N-fused spirolactams. Chem. Commun. 2007, 12, 1224–1226. [Google Scholar]
- Zagulyaeva, A.; Yusubov, M.S.; Zhdankin, V.V. A general and convenient preparation of [Bis(trifluoroacetoxy)iodo]perfluoroalkanes and [Bis(trifluoroacetoxy)iodo]arenes by oxidation of organic iodides using oxone and trifluoroacetic acid. J. Org. Chem. 2010, 75, 2119–2122. [Google Scholar]
- Cerioni, G.; Uccheddu, G. Solution structure of bis(acetoxy)iodoarenes as observed by O-17 NMR spectroscopy. Tetrahedron Lett. 2004, 45, 505–507. [Google Scholar] [CrossRef]
- Mocci, F.; Uccheddu, G.; Frongia, A.; Cerioni, G. Solution structure of some lambda(3) iodanes: An O-17 NMR and DFT study. J. Org. Chem. 2007, 72, 4163–4168. [Google Scholar]
- Fusaro, L.; Luhmer, M.; Cerioni, G.; Mocci, F. On the fluxional behavior of Dess-Martin periodinane: A DFT and O-17 NMR Study. J. Org. Chem. 2009, 74, 8818–8821. [Google Scholar] [CrossRef]
- Fusaro, L.; Mameli, G.; Mocci, F.; Luhmer, M.; Cerioni, G. Dynamic NMR of low-sensitivity fast-relaxing nuclei: 17O NMR and DFT study of acetoxysilanes. Magn. Reson. Chem. 2012, 50, 152–158. [Google Scholar]
- Lycka, A.; Holecek, J.; Handlir, K.; Pola, J.; Chvalovsky, V. 17O, 13C, and 29Si NMR spectra of some acyloxy- and diacetoxysilanes and acetoxygermanes. Collect. Czech. Chem. Commun. 1986, 51, 2582–2589. [Google Scholar]
- Boykin, D.W.; Baumstark, A.L. 17O NMR spectroscopic data for carbonyl compounds. In 17O NMR Spectroscopy in Organic Chemistry; CRC Press: Boca Raton, FL, USA, 1991; pp. 205–231. [Google Scholar]
- Saez, P.; Rittmann, B. Model-parameter estimation using least-squares. Water Res. 1992, 26, 789–796. [Google Scholar] [CrossRef]
- The errors are standard deviations provided by the analysis of a series of 1000 pseudo-experimental data sets obtained by adding random errors to the experimental LW data as well as to the temperature. These errors were generated from a Gaussian distribution considering a relative standard error on LW of 5% and an absolute standard error on the temperature of ±1 K.
- Gerothanassis, I.P. Oxygen-17 NMR spectroscopy: Basic principles and applications (Part I). Prog. Nucl. Magn. Reson. Spectrosc. 2010, 56, 95–197. [Google Scholar]
- Mennucci, B.; Tomasi, J. Continuum solvation models: A new approach to the problem of solute’s charge distribution and cavity boundaries. J. Chem. Phys. 1997, 106, 5151–5158. [Google Scholar]
- Cances, E.; Mennucci, B.; Tomasi, J. A new integral equation formalism for the polarizable continuum model: Theoretical background and applications to isotropic and anisotropic dielectrics. J. Chem. Phys. 1997, 107, 3032–3041. [Google Scholar] [CrossRef]
- Cossi, M.; Barone, V.; Mennucci, B.; Tomasi, J. Ab initio study of ionic solutions by a polarizable continuum dielectric model. Chem. Phys. Lett. 1998, 286, 253–260. [Google Scholar] [CrossRef]
- Cossi, M.; Scalmani, G.; Rega, N.; Barone, V. New developments in the polarizable continuum model for quantum mechanical and classical calculations on molecules in solution. J. Chem. Phys. 2002, 117, 43–54. [Google Scholar] [CrossRef]
- Casarini, D.; Mazzanti, A.; Lunazzi, L. Recent advances in stereodynamics and conformational analysis by dynamic nmr and theoretical calculations. Eur. J. Org. Chem. 2010, 2035–2056. [Google Scholar]
- Balakrishnan, P.; Baumstark, A.L.; Boykin, D.W. 17O NMR spectroscopy: Unusual substituent effects in para-substituted benzyl alcohols and acetates. Tetrahedron Lett. 1984, 25, 169–172. [Google Scholar] [CrossRef]
- Monti, D.; Orsini, F.; Ricca, G.S. Oxygen-17 NMR Spectroscopy: Effect of Substituents on Chemical Shifts for o− m− p− Substituted Benzoic Acids, Phenylacetic and Methyl Benzoates. Spectroscopy Lett. 1986, 19, 91–99. [Google Scholar] [CrossRef]
- Alcock, N.W.; Countryman, R.M.; Esperas, S.; Sawyer, J.F. Secondary bonding. Part 5. The crystal and molecular structures of phenyliodine(III) diacetate and bis(dichloroacetate). J. Chem. Soc. Dalton Trans. 1979, 5, 854–860. [Google Scholar]
- Kokkou, S.C.; Cheer, C.J. Structure of diacetato(m-tolyl)iodine(III). Acta Cryst. 1986, C42, 1159–1161. [Google Scholar]
- Pyykko, P. Refitted tetrahedral covalent radii for solids. Phys. Rev. B 2012, 024115. [Google Scholar]
- Bondi, A. Van der waals volumes and radii. J. Phys. Chem. 1964, 68, 441–451. [Google Scholar]
- Kotali, E.; Varvoglis, A.; Bozopoulos, A.; Rentzeperis, P. A stable dibenzoiodolyl pyrrolidinedithiocarbamate. J. Chem. Soc. Chem. Commun. 1985, 24, 1819–1820. [Google Scholar]
- Kotali, E.; Varvoglis, A. Dialkylcarbamoyl(diaryl)iodanes. J. Chem. Soc. Perkin Trans. I 1987, 12, 2759–2763. [Google Scholar] [CrossRef]
- Kiprof, P. The nature of iodine oxygen bonds in hypervalent 10-I-3 iodine compounds. ARKIVOC 2005, 4, 19–25. [Google Scholar]
- Kazmierczak, P.; Skulski, L. A simple, two-step conversion of various iodoarenes to (Diacetoxyiodo)arenes with Chromium(VI) oxide as the oxidant. Synthesis 1998, 1721–1723. [Google Scholar]
- Merkushev, E.B.; Novikov, A.N.; Makarchenko, S.S.; Moskalchuk, A.S.; Glushova, V.V.; Kogai, T.Y.; Polyakova, L.G. Organic compounds of polyvalent iodine. VIII. Simple synthesis of phenyliodosocarboxylates. Zh. Org. Khim. 1975, 11, 1259–1262. [Google Scholar]
- Kozminski, W.; Jackowski, K. Application of adiabatic inversion pulses for elimination of baseline distortions in Fourier transform NMR. A natural abundance 17O NMR spectrum for gaseous acetone. Magn. Reson. Chem. 2000, 38, 459–462. [Google Scholar]
- Adamo, C.; Barone, V. Toward reliable density functional methods without adjustable parameters: The PBE0 model. J. Chem. Phys. 1999, 110, 6158–6179. [Google Scholar]
- Perdew, J.P.; Burke, K.; Ernzerhof, M. Generalized gradient approximation made simple. Phys. Rev. Lett. 1996, 77, 3865–3868. [Google Scholar] [CrossRef]
- Frisch, M.J.; Trucks, G.W.; Schlegel, H.B.; Scuseria, G.E.; Robb, M.A.; Cheeseman, J.R.; Montgomery, J.A., Jr.; Vreven, T.; Kudin, K.N.; Burant, J.C.; et al. Gaussian 03, Revision C.02; Gaussian, Inc.: Wallingford, CT, USA, 2004. [Google Scholar]
- Dunning, T.H., Jr.; Hay, P.J. Modern Theoretical Chemistry: Methods of Electronic Structure Theory; Schaefer, H.F., III, Ed.; Plenum: New York, NY, USA, 1976; Volume 3, pp. 1–28. [Google Scholar]
- Wadt, W.R.; Hay, P.J. Ab initio effective core potentials for molecular calculations. Potentials for main group elements Na to Bi. J. Chem. Phys. 1985, 82, 284–298. [Google Scholar] [CrossRef]
- Check, C.E.; Faust, T.O.; Bailey, J.M.; Wright, B.J.; Gilbert, T.M.; Sunderlin, L.S. Addition of polarization and diffuse functions to the LANL2DZ basis set for P-Block elements. J. Phys. Chem. A 2001, 105, 8111–8116. [Google Scholar]
- Basis sets were obtained from the Extensible Computational Chemistry Environment Basis Set Database, Version 02/25/04, as developed and distributed by the Molecular Science Computing Facility, Environmental and Molecular Sciences Laboratory, which is part of the Pacific Northwest Laboratory, P.O. Box 999, Richland, Washington 99352, and funded by the U.S. Department of Energy.
- Schaftenaar, G.; Noordik, J.H. The effect of isodensity surface sampling on ESP derived charges and the effect of adding bond-centers on DMA derived charges. J. Comput. Aided Mol. Des. 2000, 14, 123–134. [Google Scholar] [CrossRef]
- Weinhold, F. Natural bond orbital methods. In Encyclopedia of Computational Chemistry; Schleyer, P.V.R., Allinger, N.L., Clark, T., Gasteiger, J., Kollman, P.A., Schaefer, H.F., III, Schreiner, P.R., Eds.; John Wiley & Sons: Chichester, UK, 1998; Volume 3, pp. 1792–1811. [Google Scholar]
- Wiberg, K.B. Application of the pople-santry-segal CNDO method to the cyclopropylcarbinyl and cyclobutyl cation and to bicyclobutane. Tetrahedron 1968, 24, 1083–1096. [Google Scholar] [CrossRef]
- Humphrey, W.; Dalke, A.; Schulten, K. VMD: Visual molecular dynamics. J. Mol. Graph. 1996, 14, 33–38. [Google Scholar] [CrossRef]
- Sample Availability: Not available.
© 2012 by the authors; licensee MDPI, Basel, Switzerland. This article is an open-access article distributed under the terms and conditions of the Creative Commons Attribution license (http://creativecommons.org/licenses/by/3.0/).
Share and Cite
Fusaro, L.; Mocci, F.; Luhmer, M.; Cerioni, G. 17O-Dynamic NMR and DFT Investigation of Bis(acyloxy)iodoarenes. Molecules 2012, 17, 12718-12733. https://doi.org/10.3390/molecules171112718
Fusaro L, Mocci F, Luhmer M, Cerioni G. 17O-Dynamic NMR and DFT Investigation of Bis(acyloxy)iodoarenes. Molecules. 2012; 17(11):12718-12733. https://doi.org/10.3390/molecules171112718
Chicago/Turabian StyleFusaro, Luca, Francesca Mocci, Michel Luhmer, and Giovanni Cerioni. 2012. "17O-Dynamic NMR and DFT Investigation of Bis(acyloxy)iodoarenes" Molecules 17, no. 11: 12718-12733. https://doi.org/10.3390/molecules171112718