Ergosterol-Induced Sesquiterpenoid Synthesis in Tobacco Cells


Abstract
:1. Introduction
2. Results and Discussion
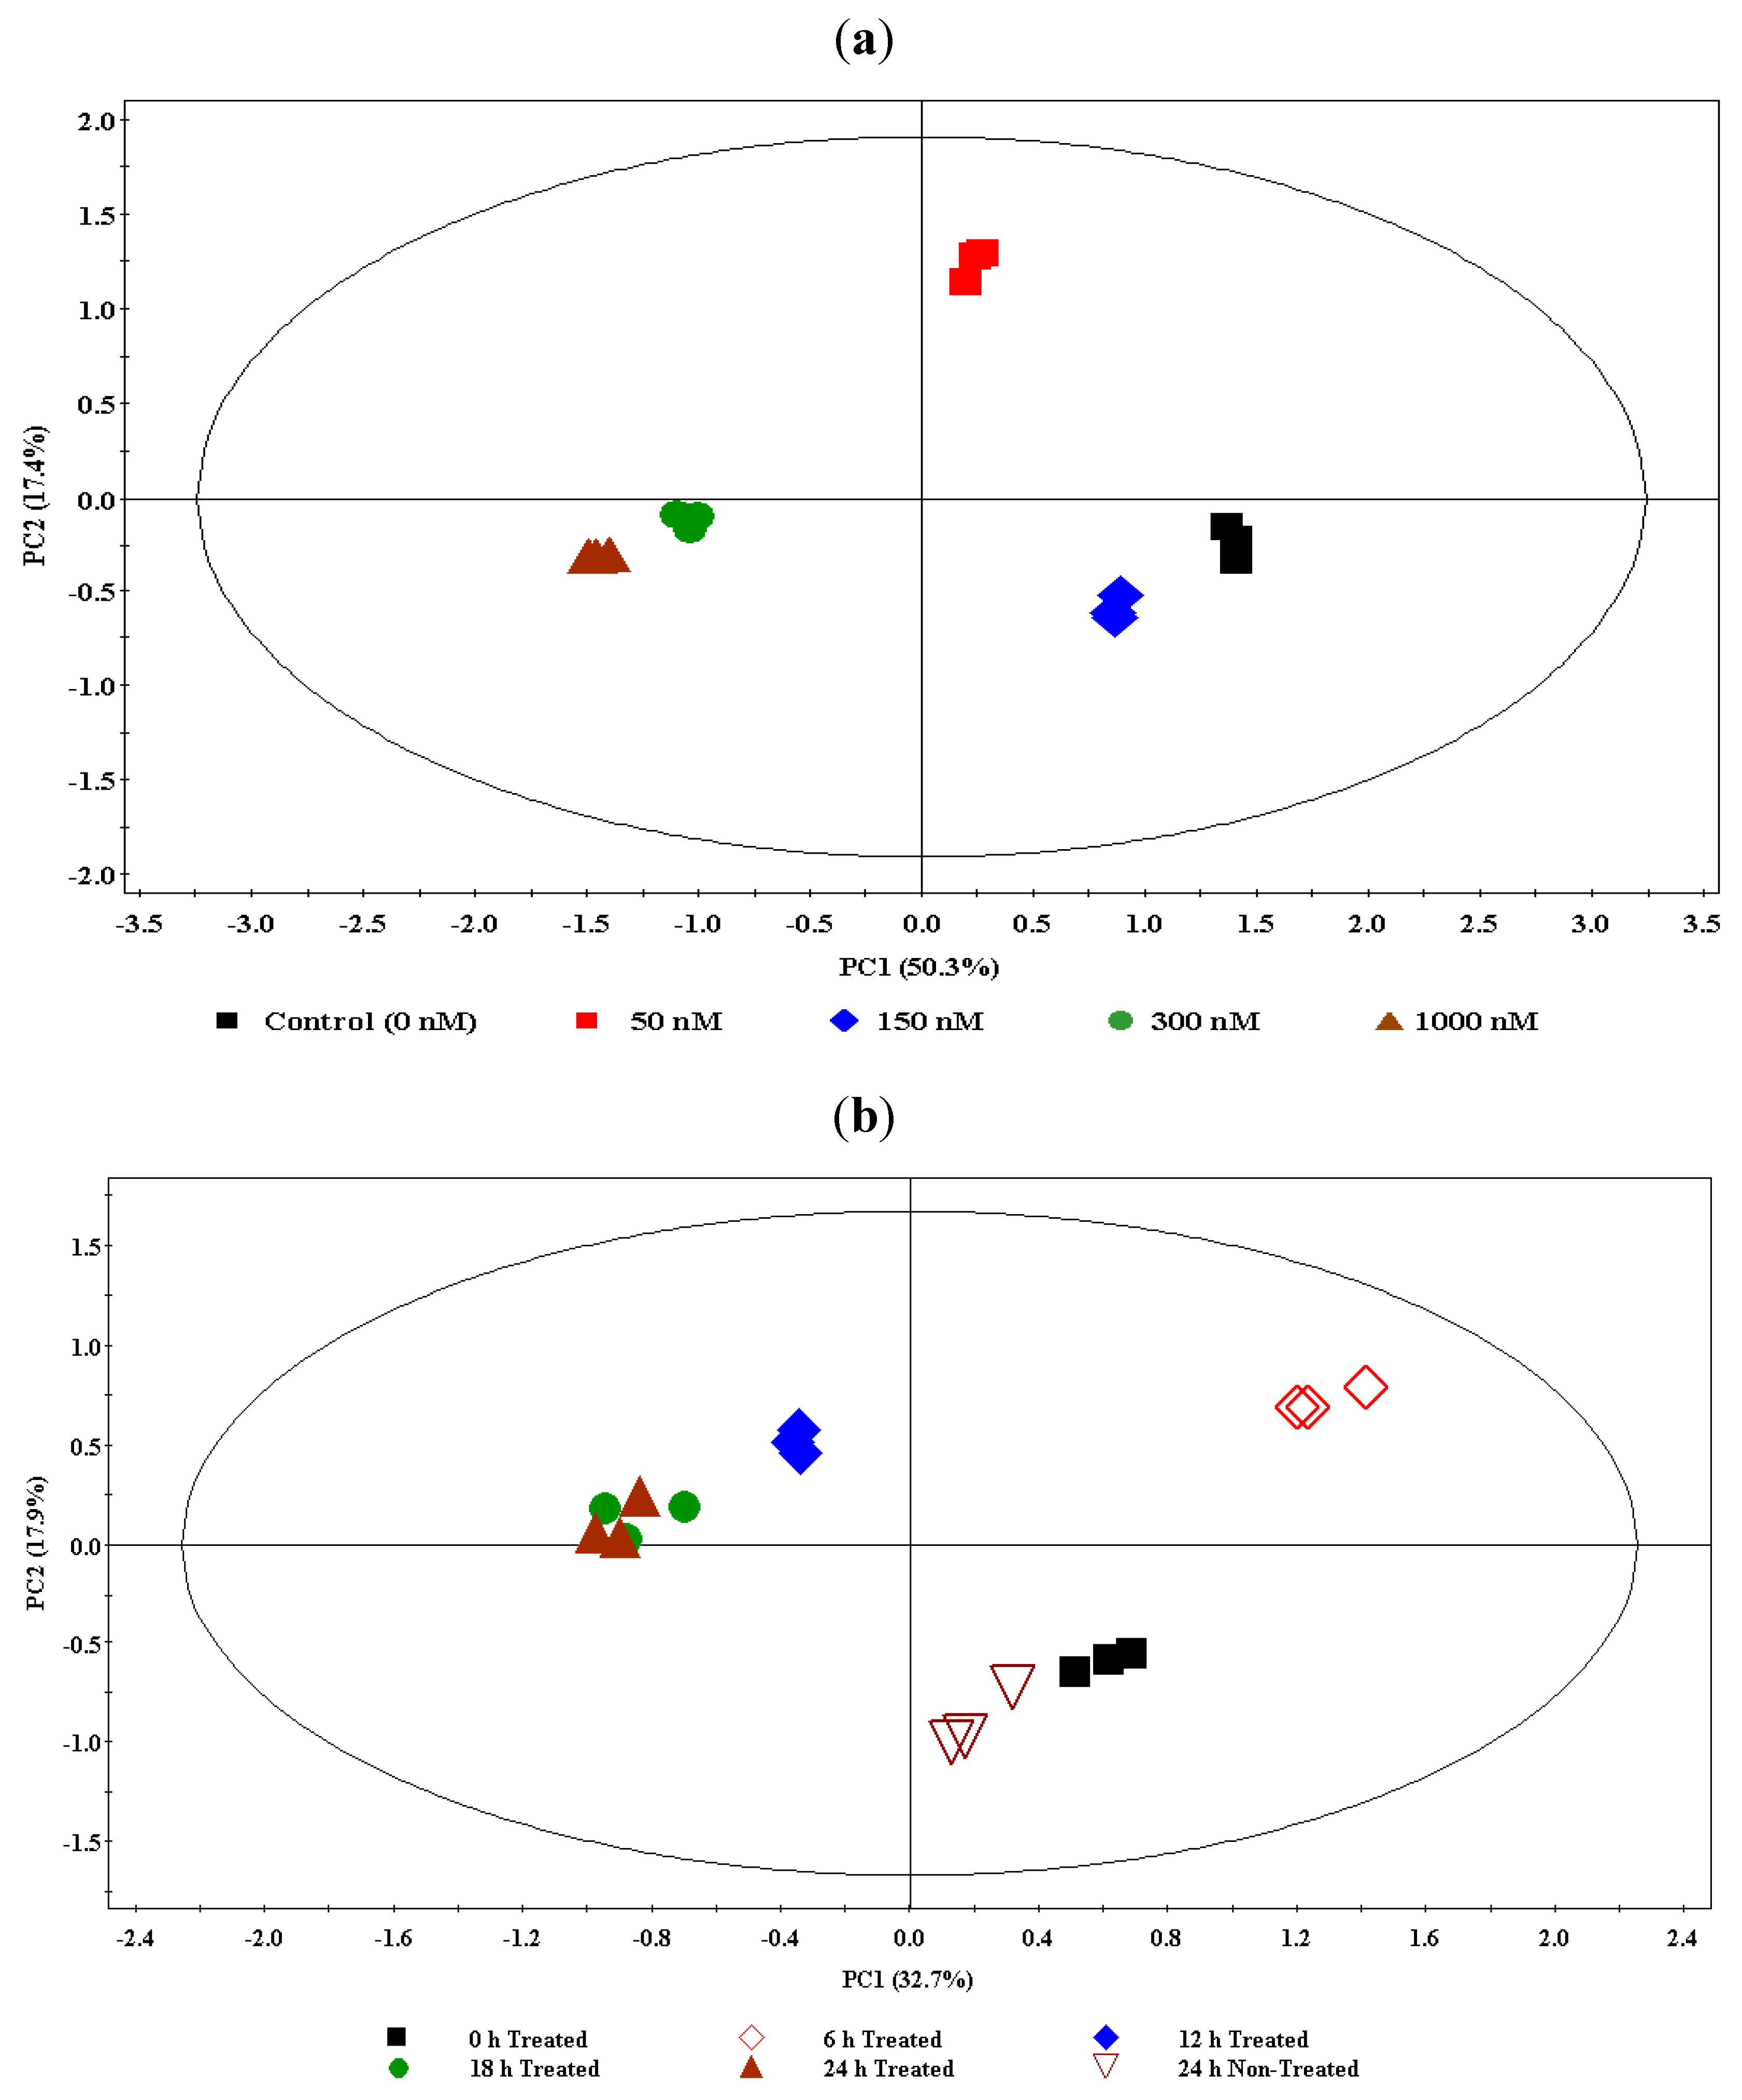
2.1. Dynamic Changes Occur in the Metabolome of Ergosterol-Treated Tobacco Cells


2.2. Ergosterol Induces Sesquiterpenoid Phytoalexins in Tobacco Cells
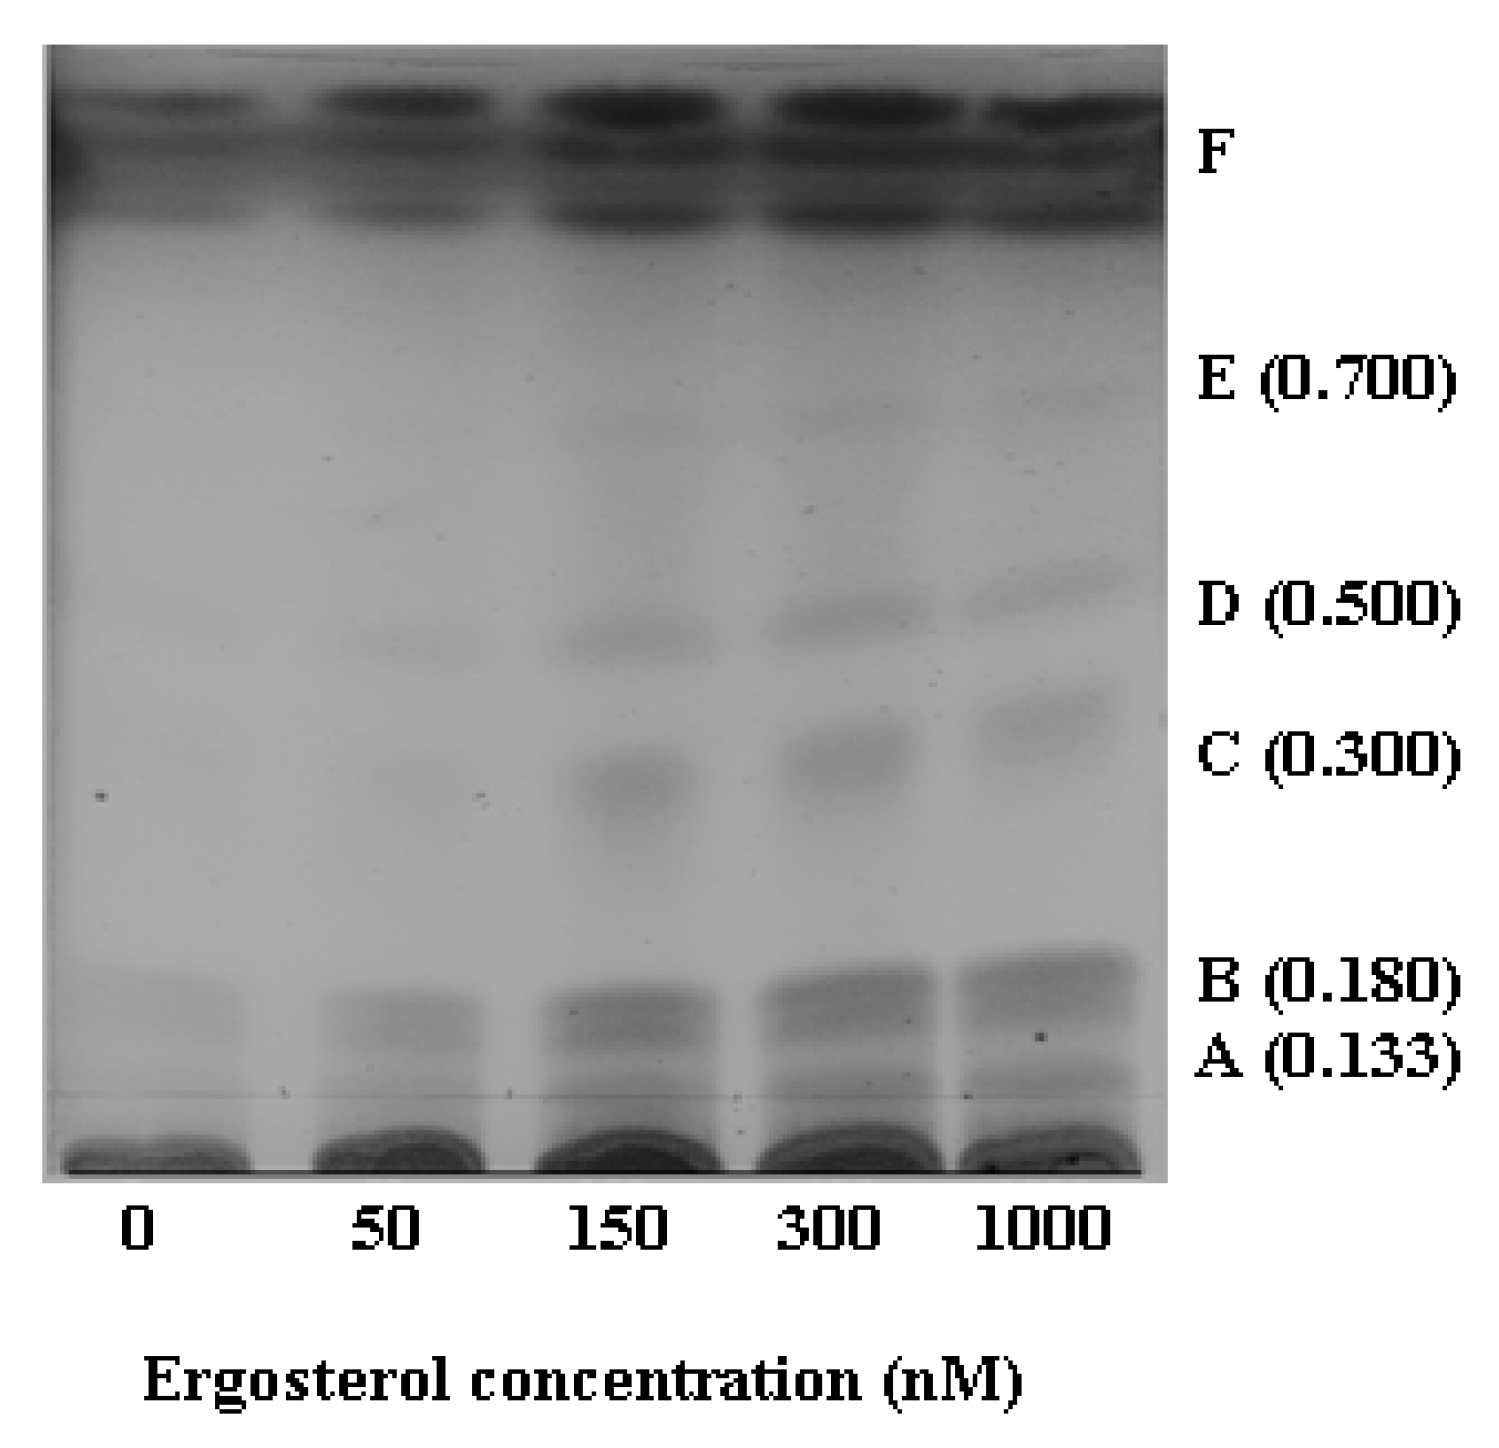
2.2.1. HPTLC Fractionation of Extracts and Initial Characterisation

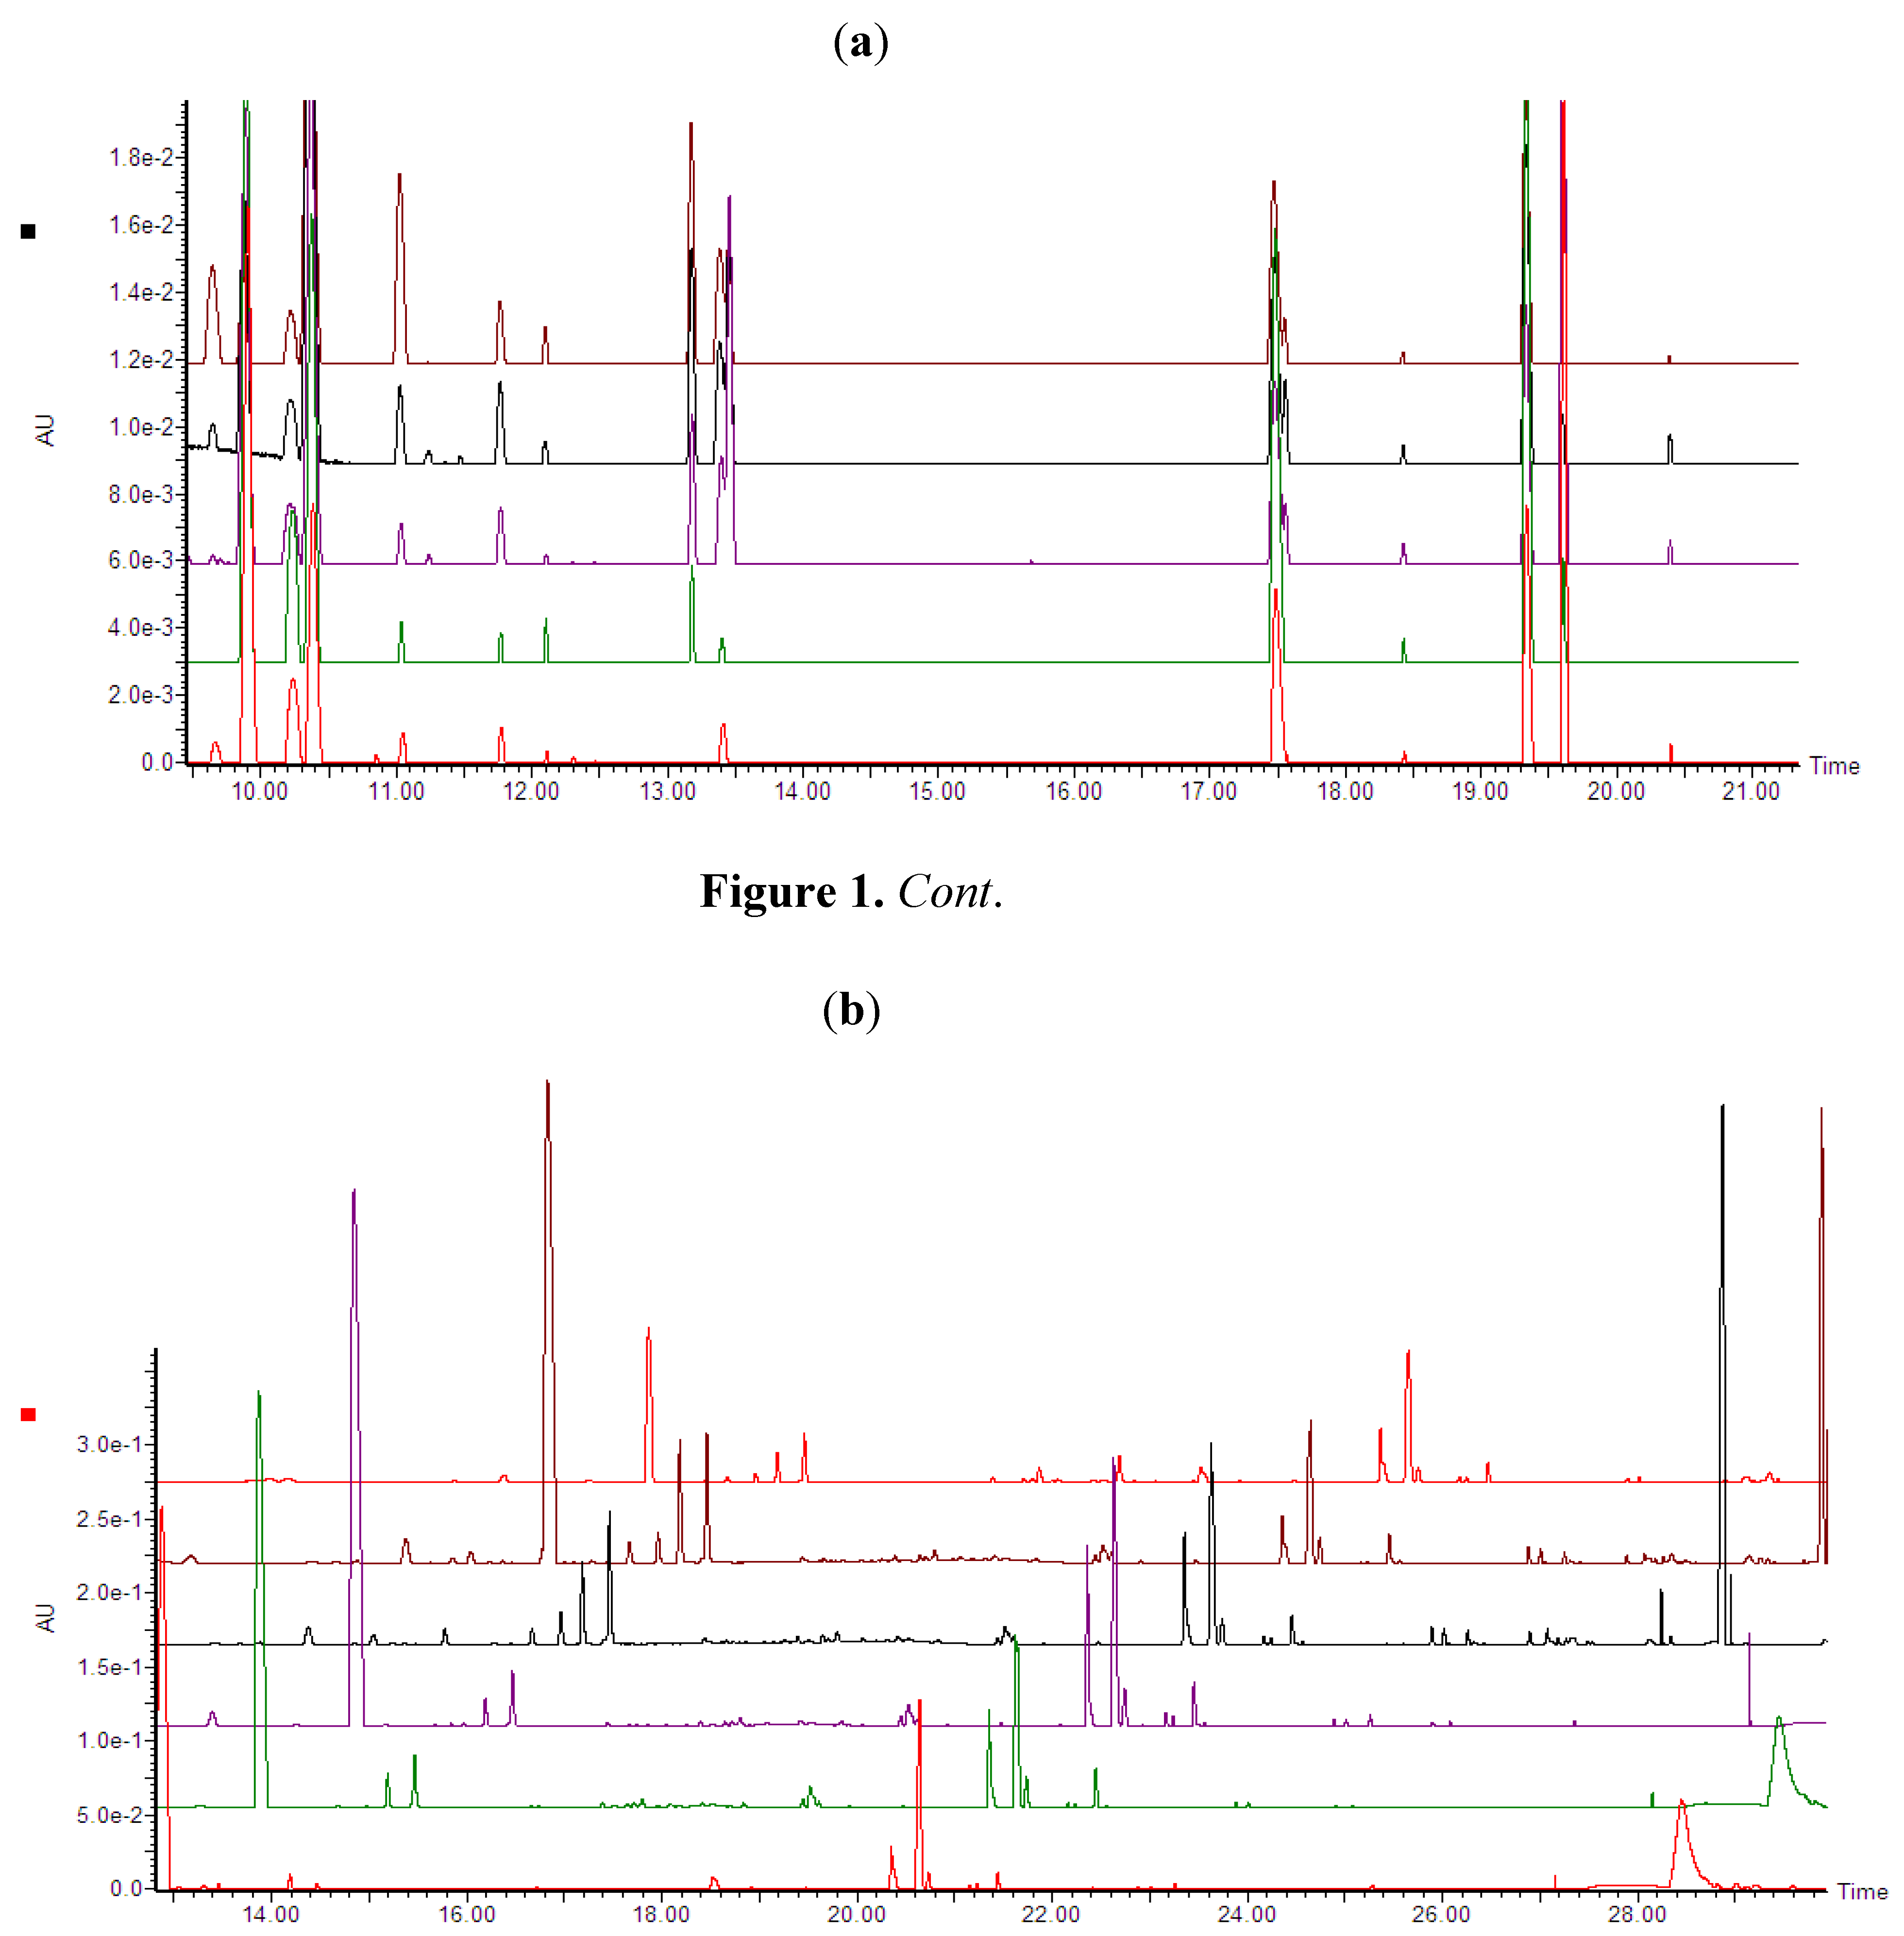
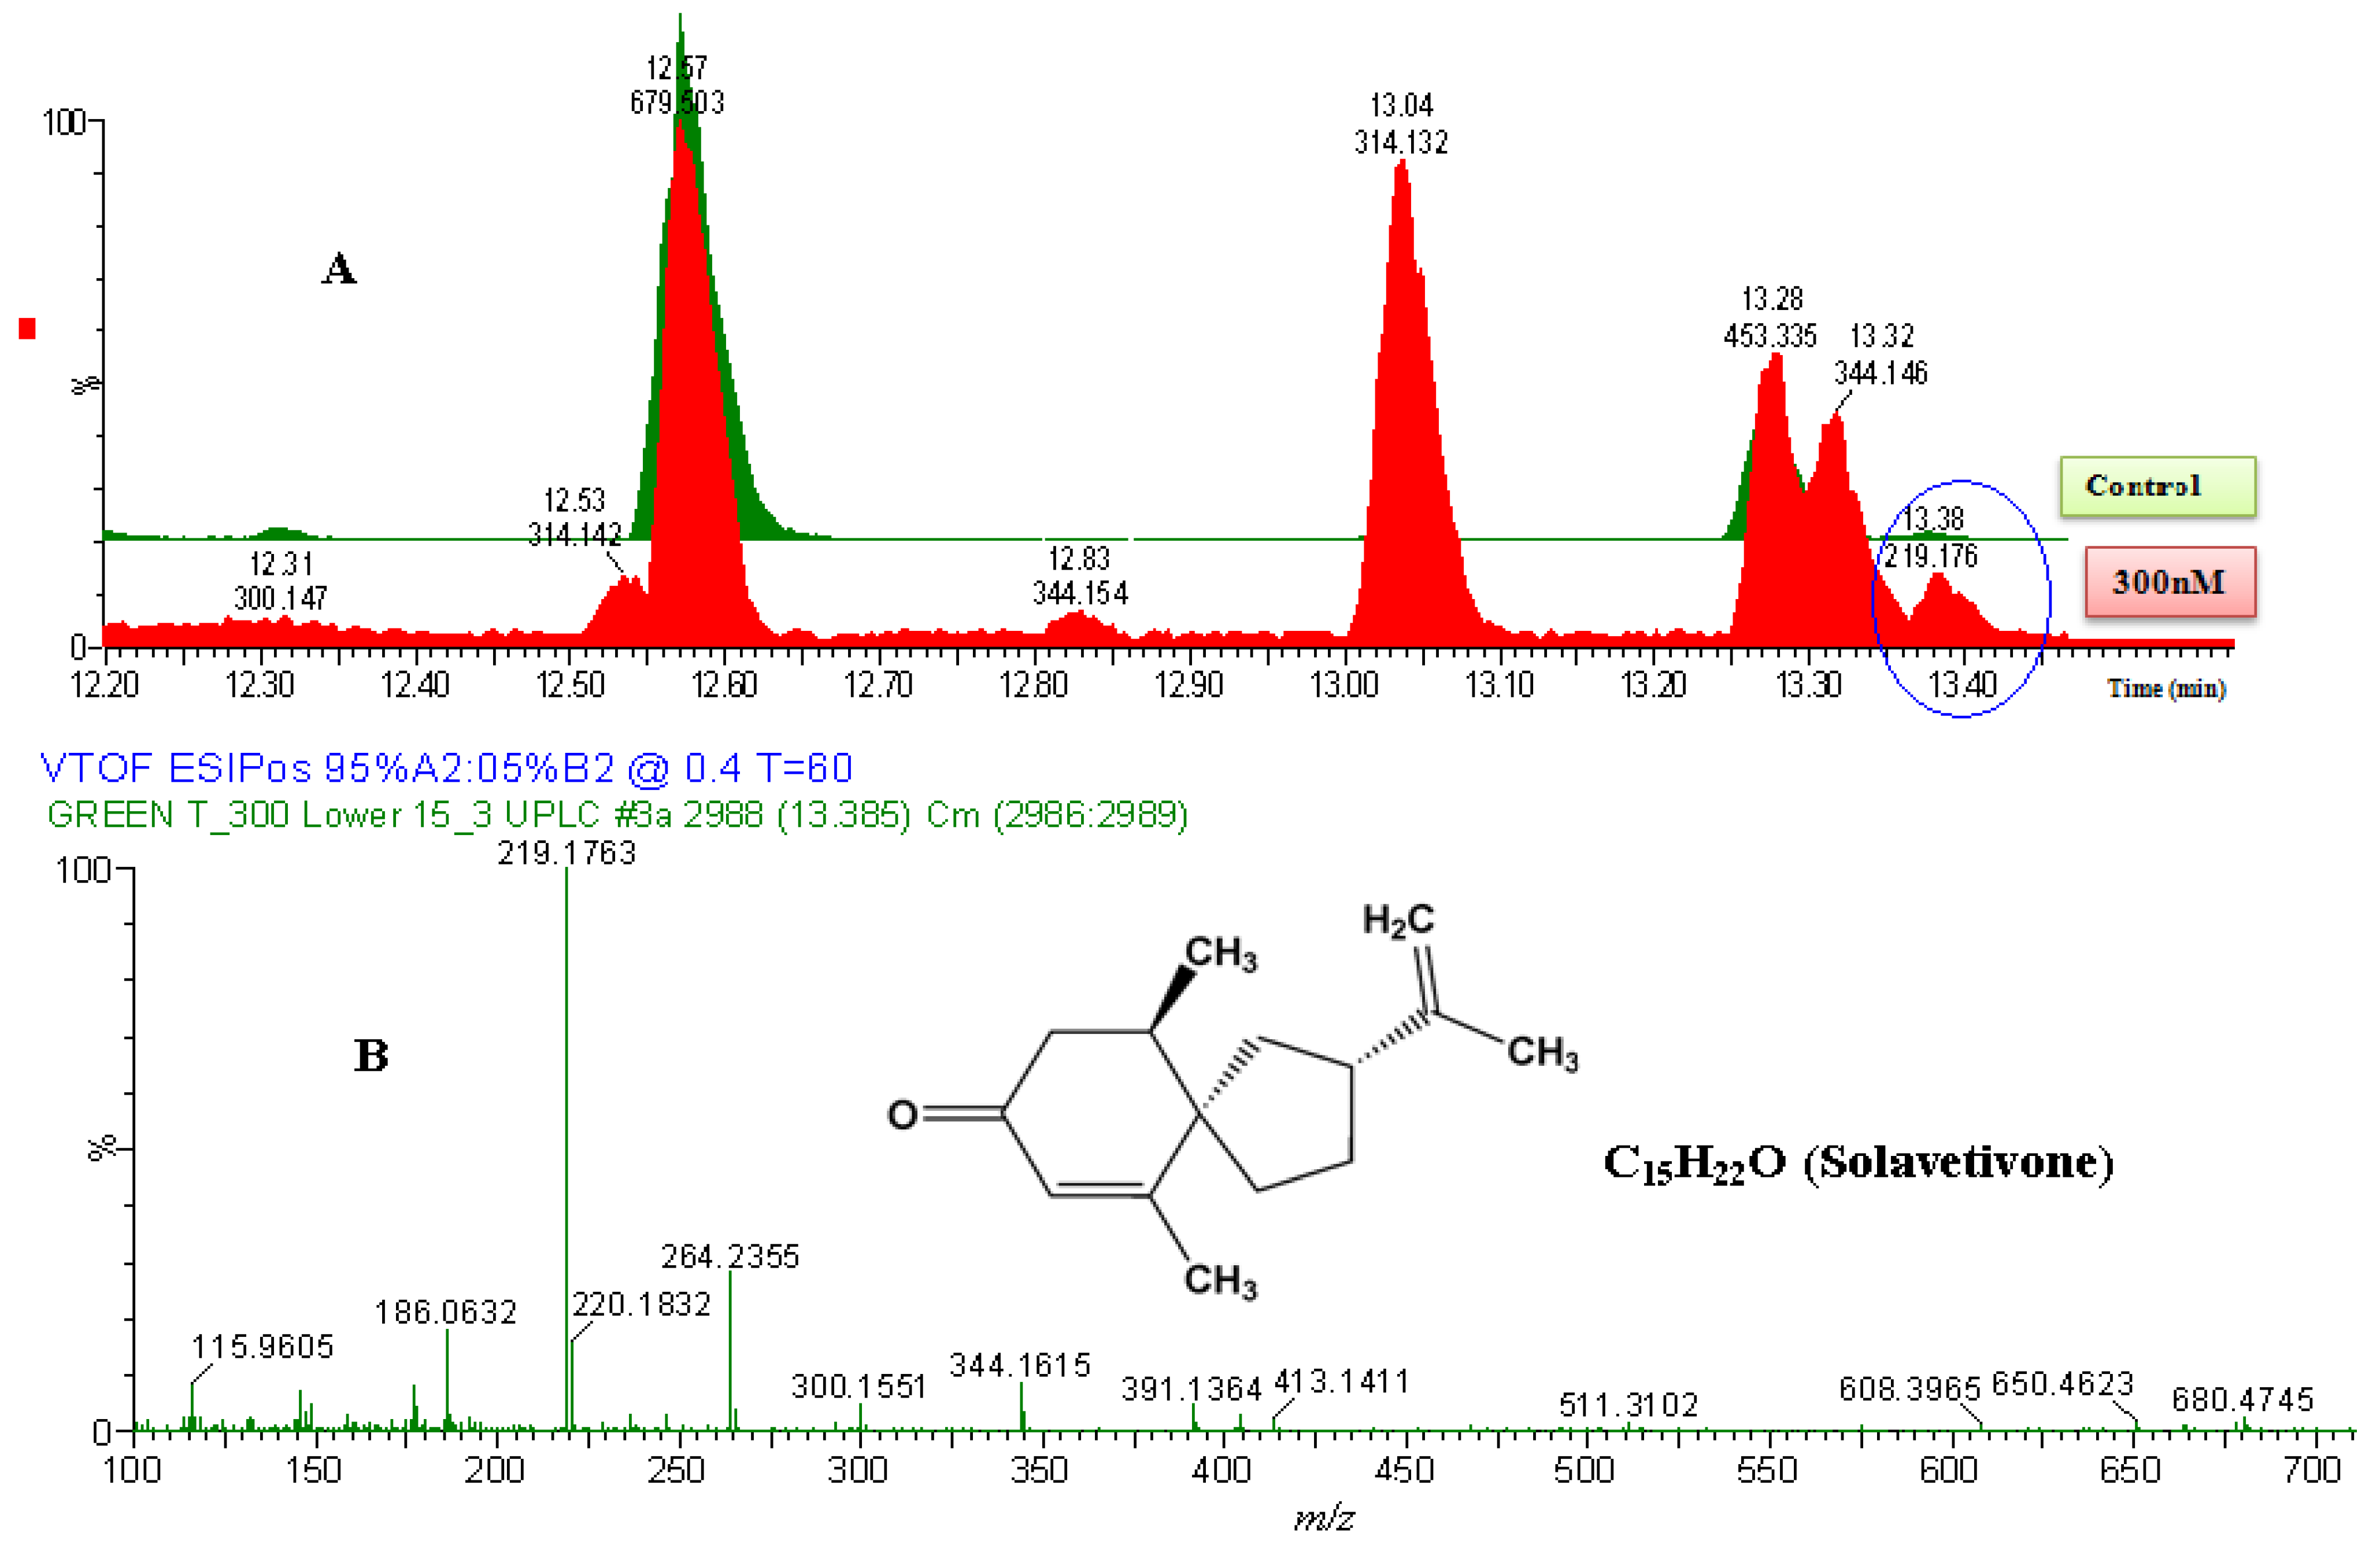
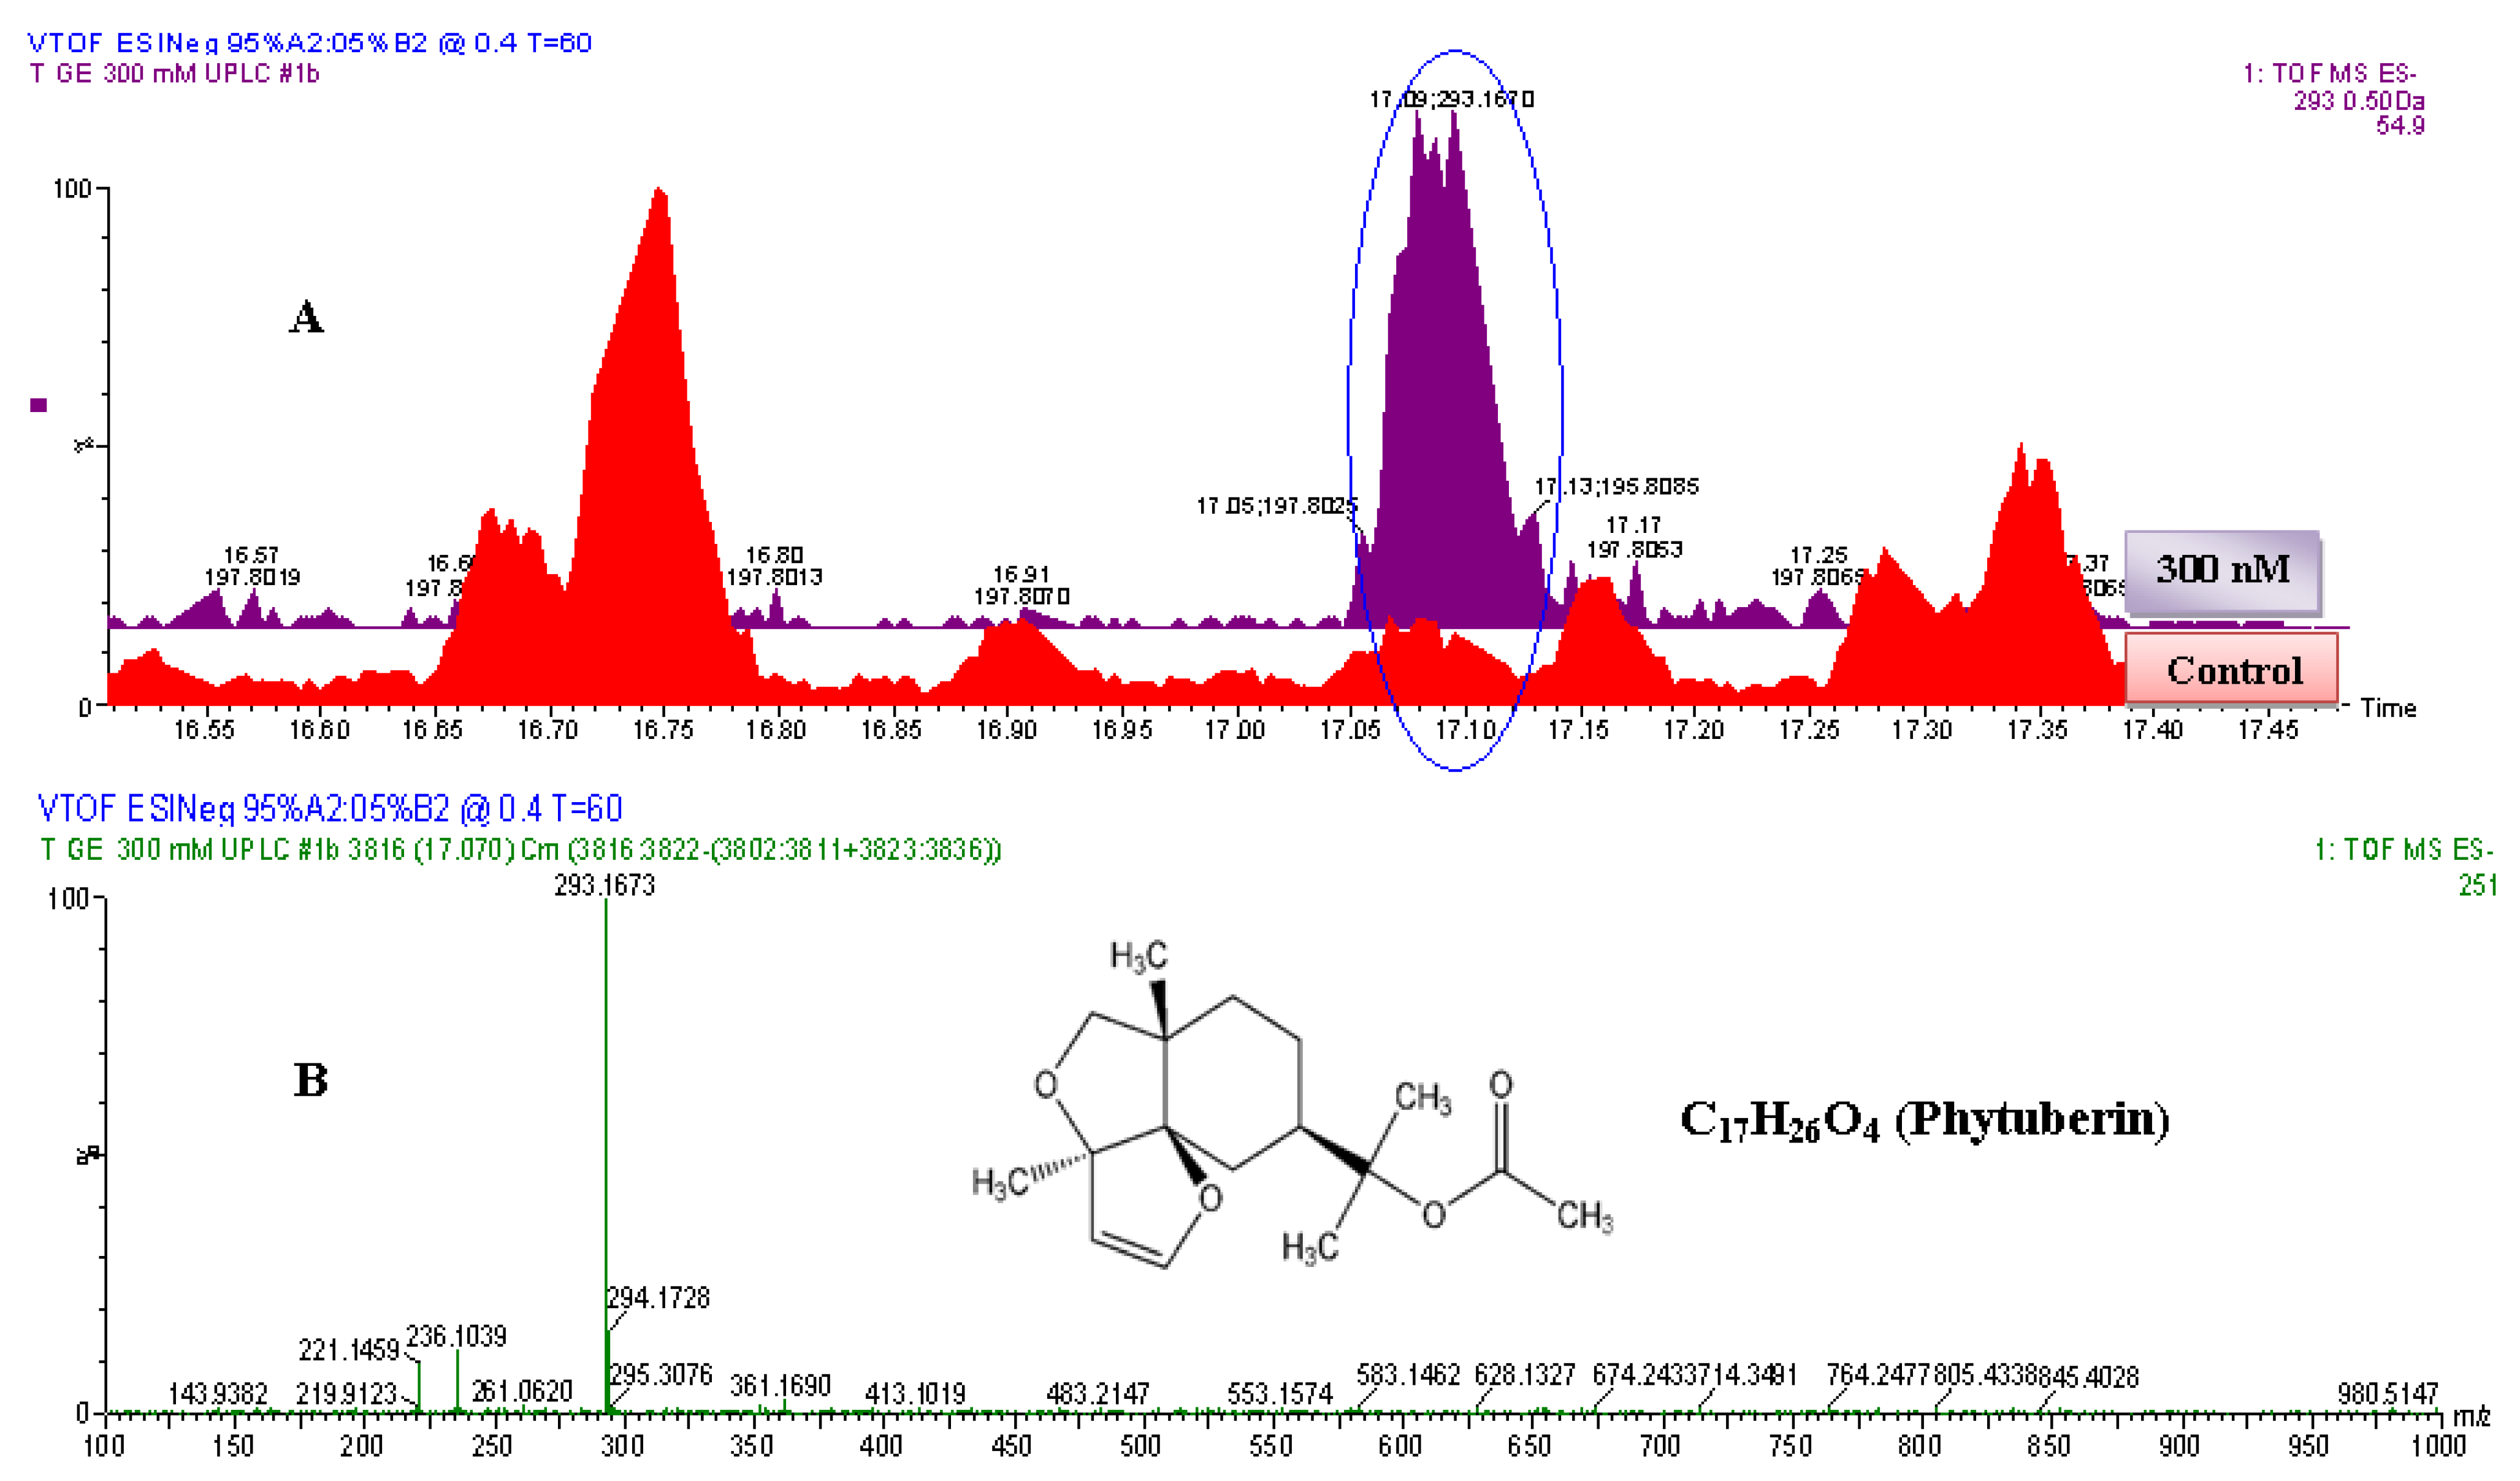
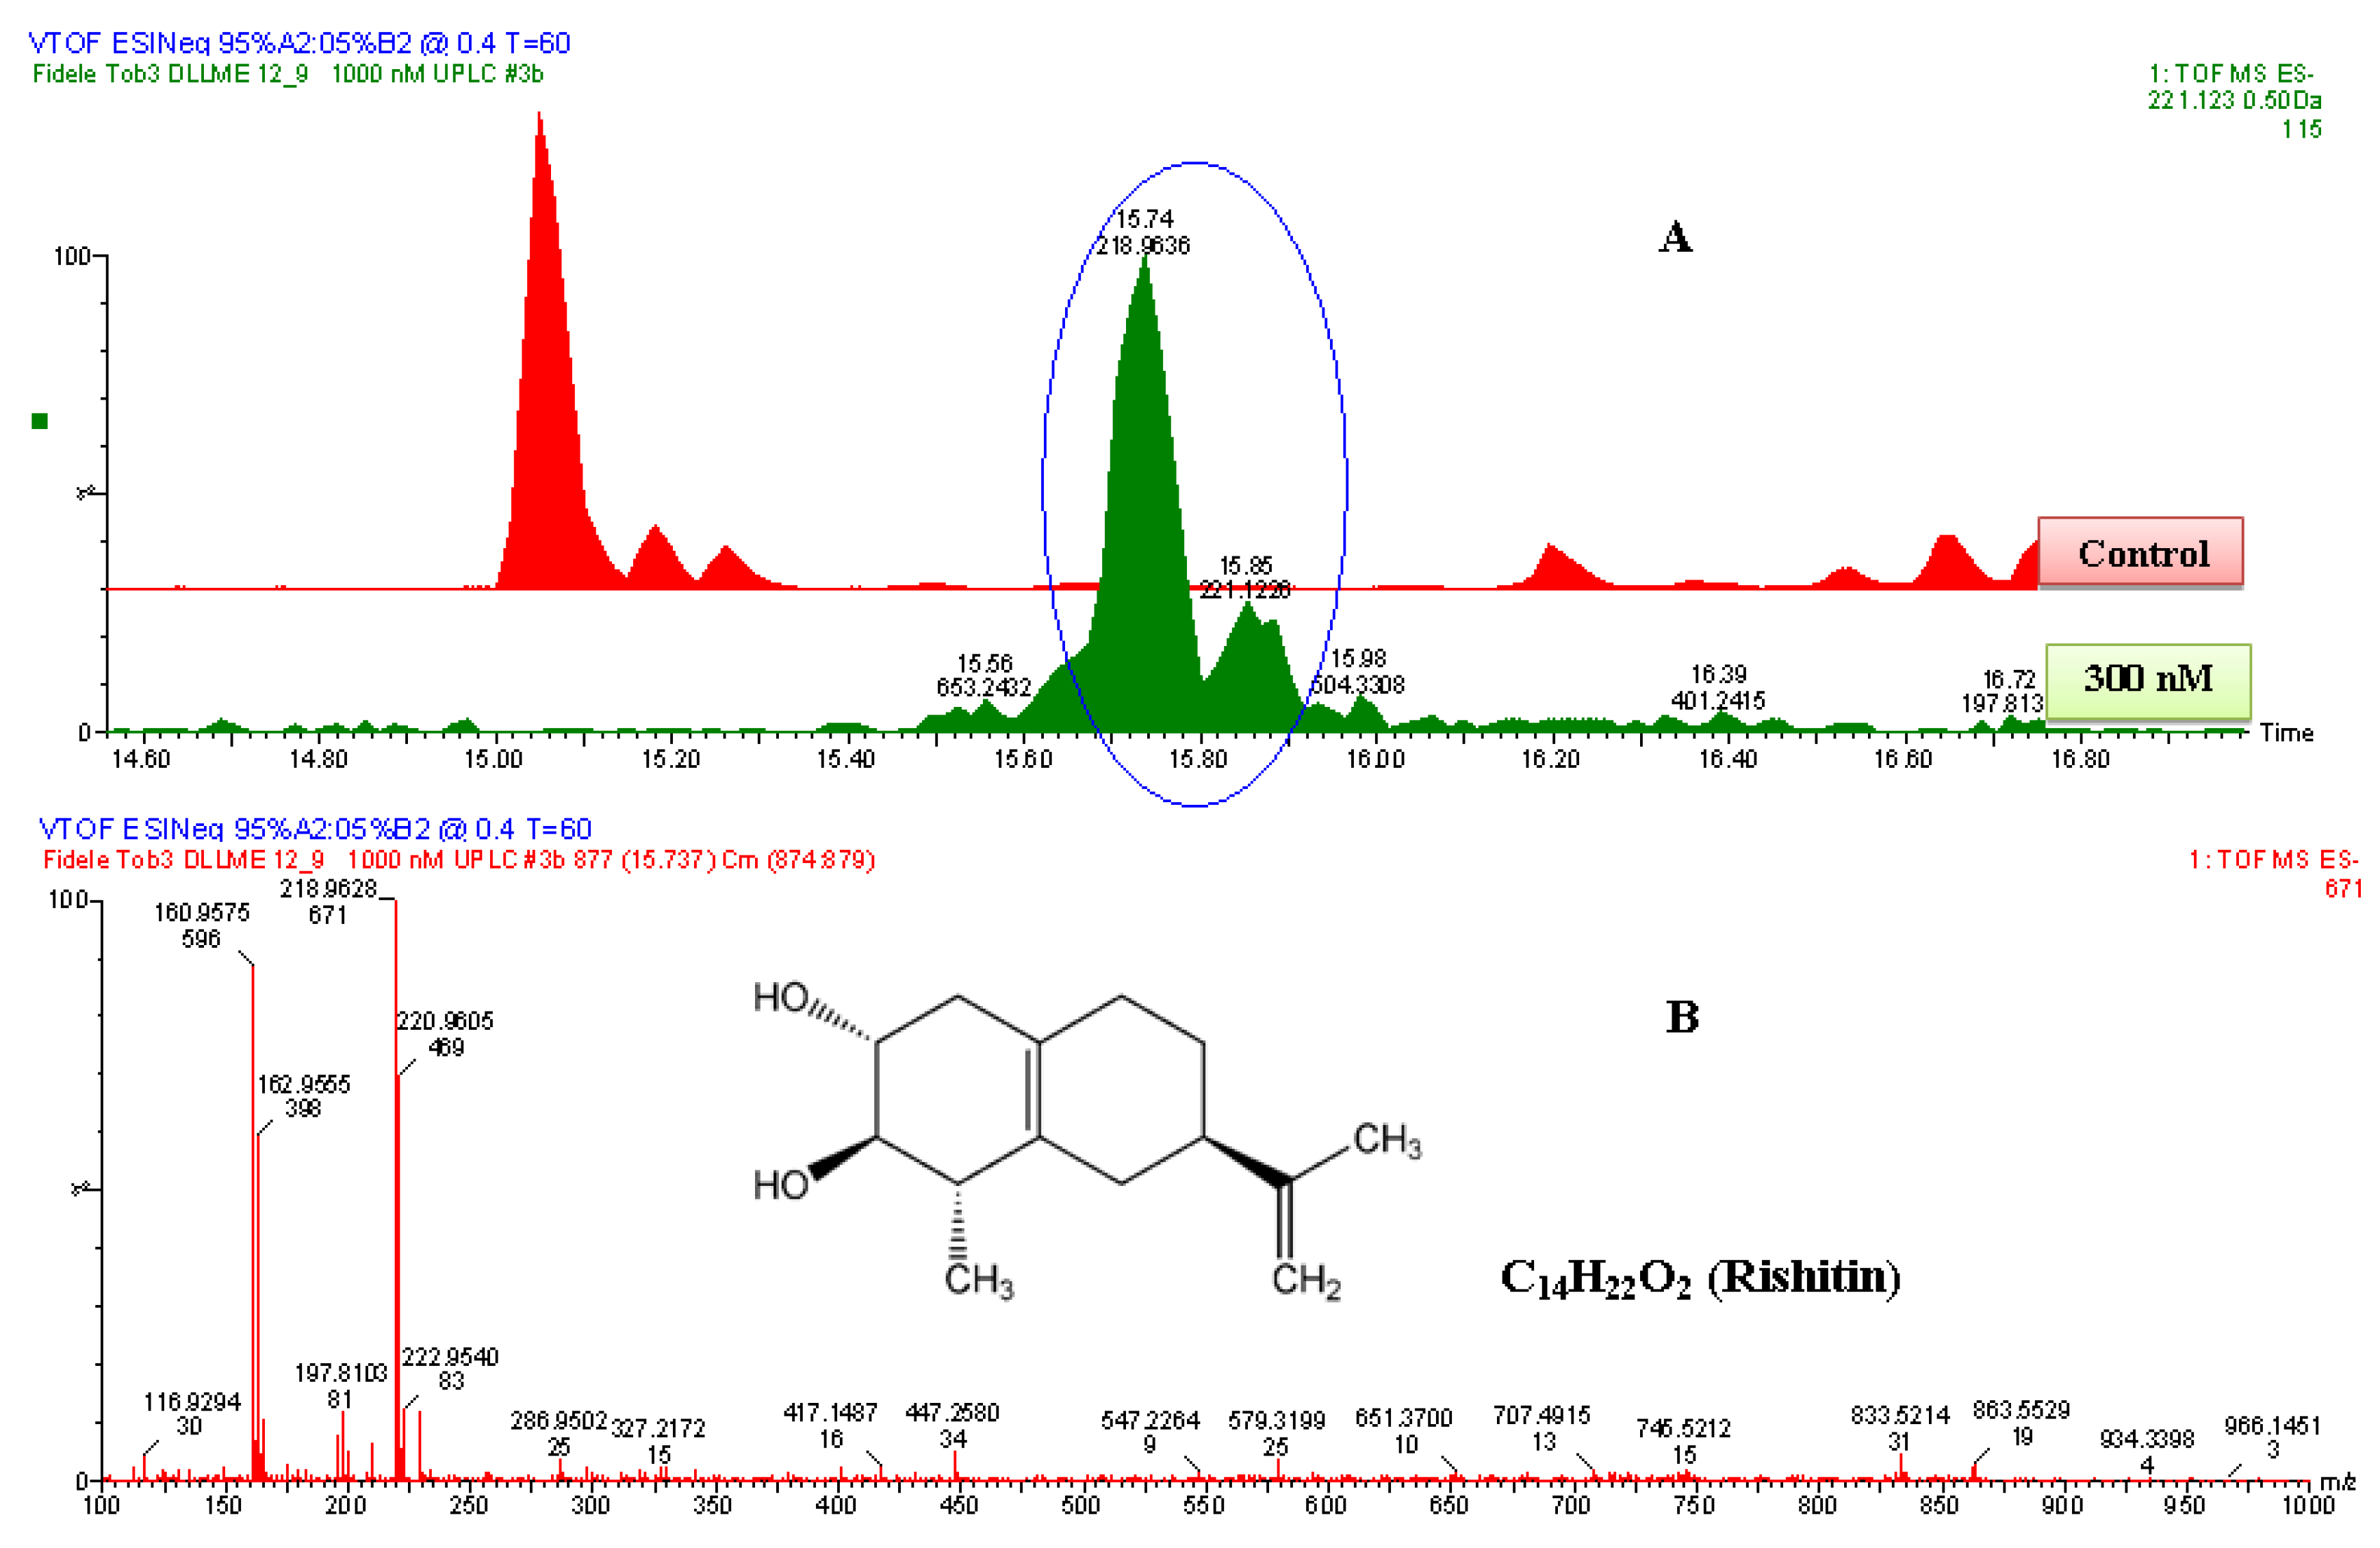
2.2.2. UPLC-QTOF-ESI-MS based Metabolites Identification
2.2.3. Ergosterol-Induced Metabolomic Reprogramming


| Name | Empirical formula | Molecular mass (Da) | Experimental mass (Da) | Extractionmethod | Identification method | i-Fit | ExperimentalRf values | CAS number | |
|---|---|---|---|---|---|---|---|---|---|
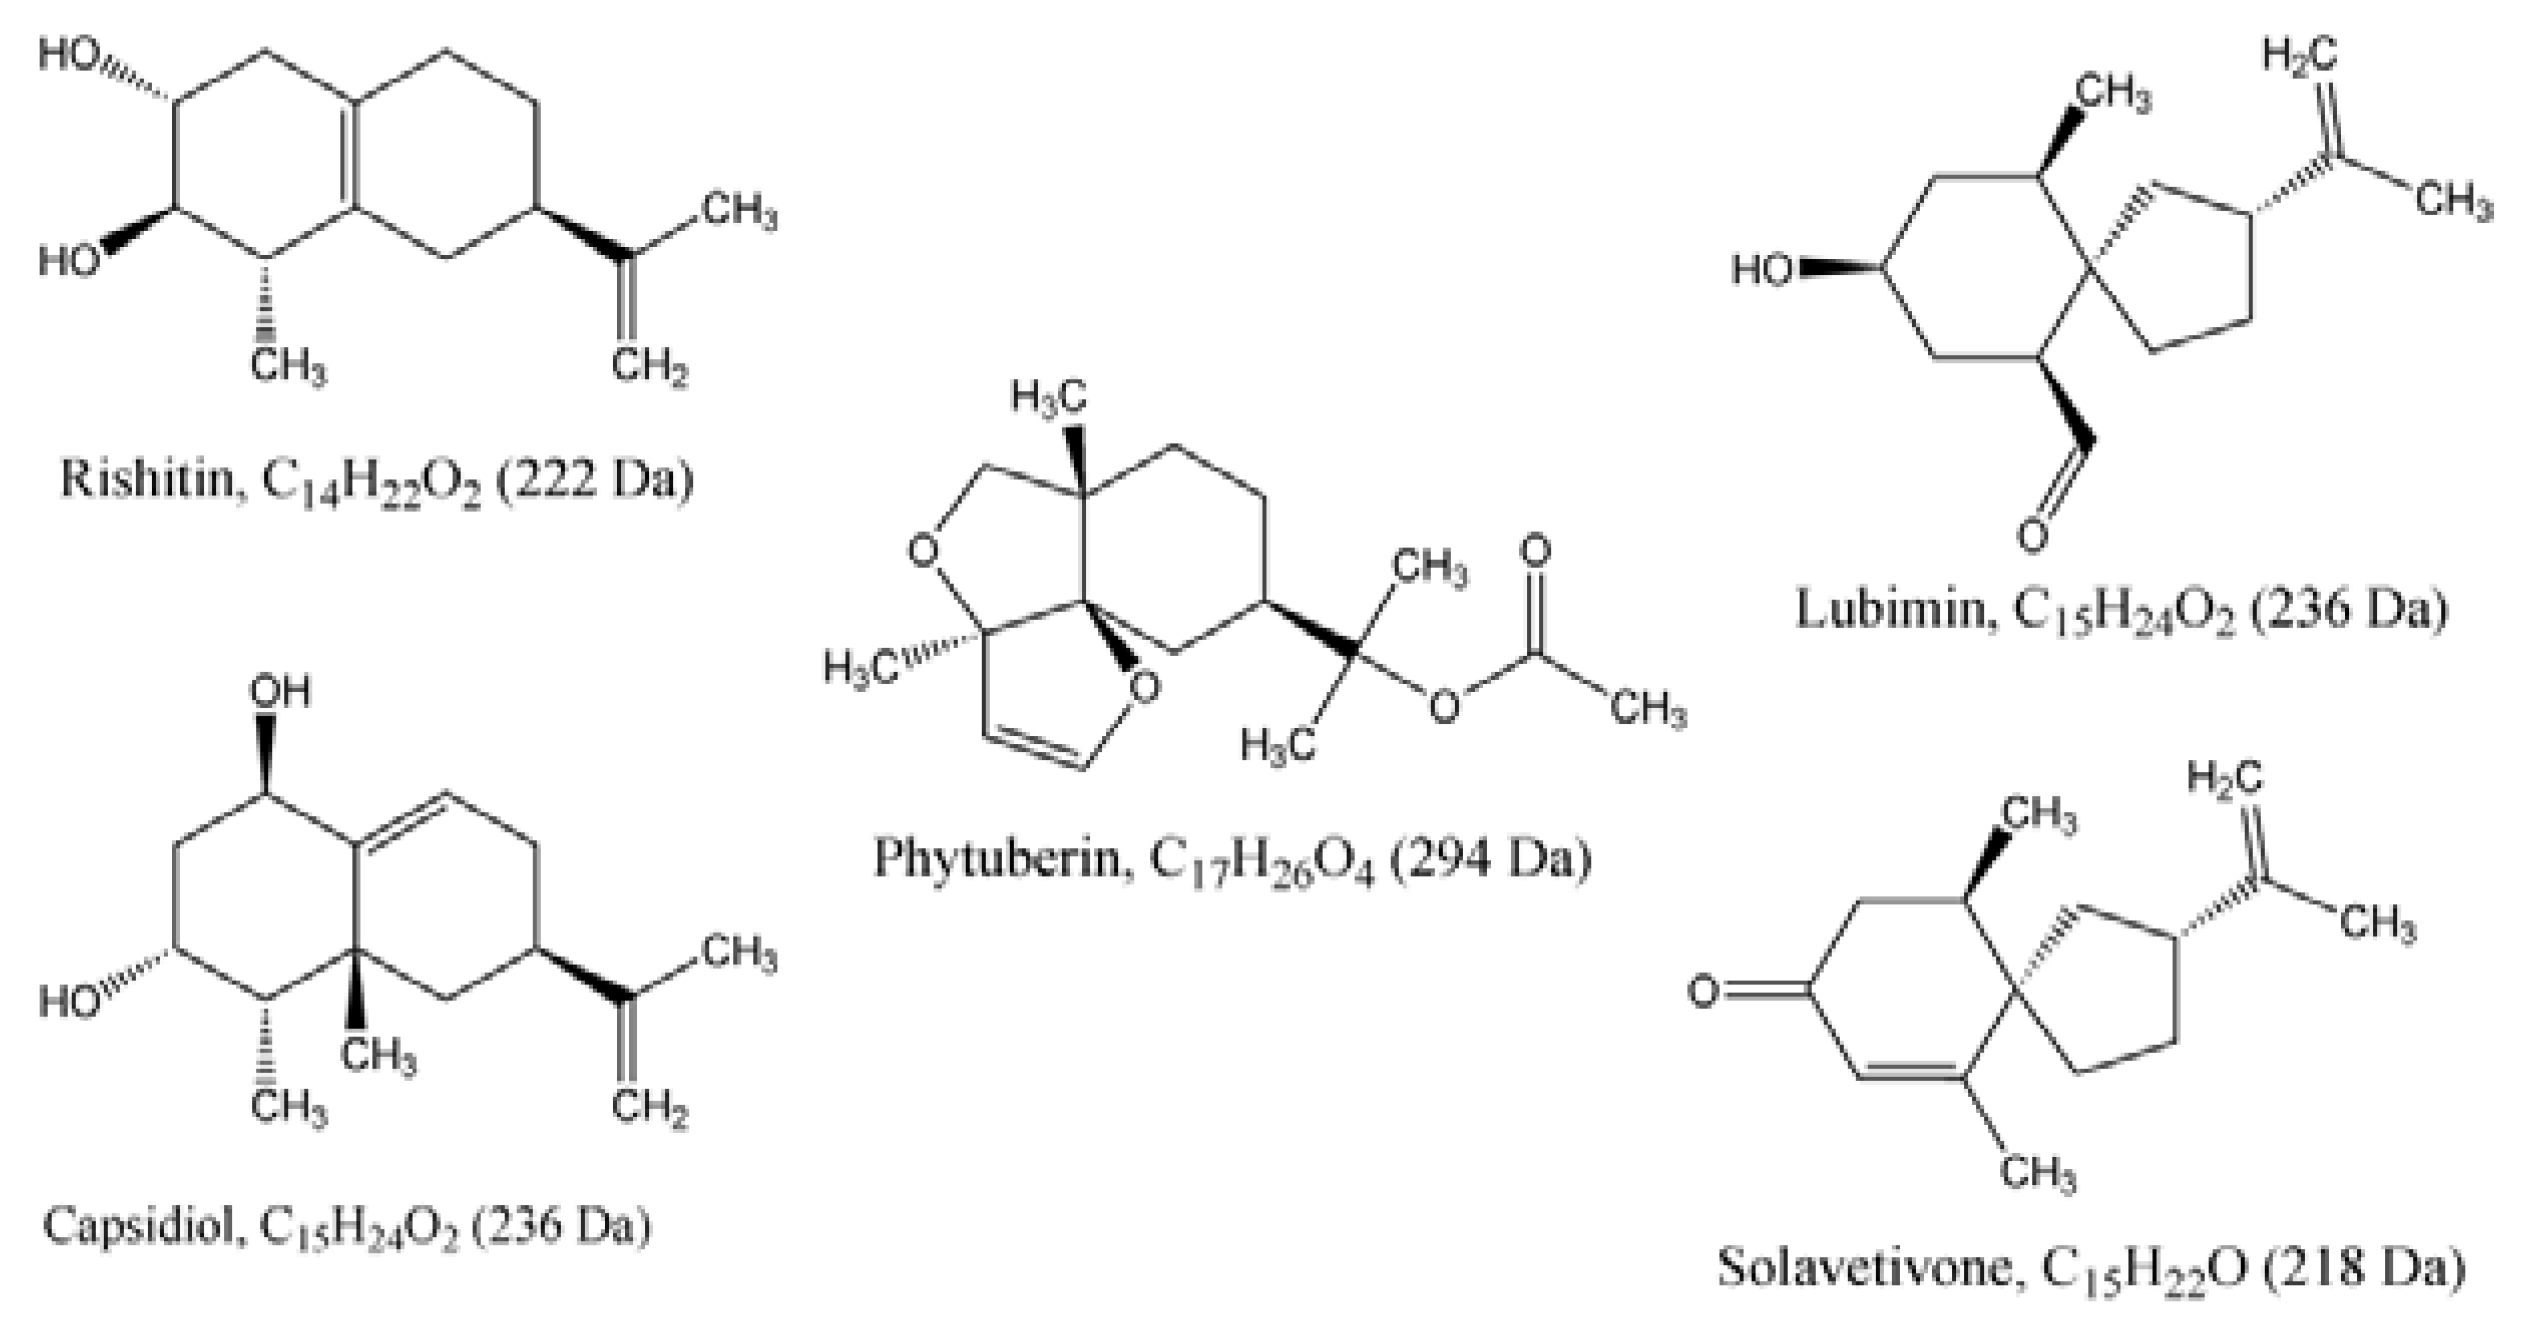
| 1 | Capsidiol | C15H24O2 | 236.178 | --- | DLLME | HPTLC | --- | 0.18 | 37208-05-2 |
| 2 | Lubimin | C15H24O2 | 236.178 | --- | DLLME | HPTLC | --- | 0.50 | 35951-50-9 |
| 3 | Phytuberin | C17H26O4 | 294.183 | 294.1673 | DLLME | UPLC-MS | 0.0 | --- | 37209-50-0 |
| 4 | Rishitin | C14H22O2 | 222.162 | 222.9768 | DLLME | HPTLC/UPLC-MS | 1.1 | 0.30 | 18178-54-6 |
| 5 | Solavetivone | C15H22O | 218.340 | 218.1763 | DLLME | HPTLC/UPLC-MS | 0.0 | 0.70 | 54878-25-0 |
3. Experimental
3.1. Reagents
3.2. Elicitation of Cells
3.3. Cell Viability Assay
3.4. Extraction of Secondary Metabolites — Phytoalexins
3.5. HPTLC Fractionation of Extracts and Initial Characterisation
3.6. Ultra Performance Liquid Chromatography-High Definition Mass Spectrometry (UPLC-HDMS) Analyses
3.7. Data Analysis
4. Conclusions
Supplementary Materials
Acknowledgements
References and Notes
- Dunn, W.B.; Ellis, D.I. Metabolomics: Current analytical platforms and methodologies. Trends Anal. Chem. 2005, 24, 285–293. [Google Scholar] [CrossRef]
- Fiehn, O. Metabolomics—The link between genotypes and phenotypes. Plant Mol. Biol. 2002, 48, 155–171. [Google Scholar] [CrossRef]
- Verpoorte, R.; Choi, Y.H.; Mustafa, N.R.; Kim, H.K. Metabolomics: Back to basics. Phytochem. Rev. 2008, 7, 525–537. [Google Scholar] [CrossRef]
- Fiehn, O.; Kopka, J.; Dormann, P.; Altmann, T.; Trethewey, R.N.; Willmitzer, L. Metabolite profiling for plant functional genomics. Nat. Biotechnol. 2000, 18, 1157–1161. [Google Scholar] [CrossRef]
- Fukusaki, E.; Kobayashi, A. Plant metabolomics: Potential for practical operation. J. Biosci. Bioeng. 2005, 100, 347–354. [Google Scholar] [CrossRef]
- Sumner, L.W.; Mendes, P.; Dixon, R.A. Plant metabolomics: Large-scale phytochemistry in the functional genomics era. Phytochemistry 2003, 62, 817–836. [Google Scholar]
- Allwood, J.W.; Goodacre, R. An introduction to liquid chromatography-mass spectrometry instrumentation applied in plant metabolomic analyses. Phytochem. Anal. 2010, 21, 33–47. [Google Scholar] [CrossRef]
- Camacho, D.; Fuente, A.; Mendes, P. The origin of correlations in metabolomics data. Metabolomics 2005, 1, 53–63. [Google Scholar] [CrossRef]
- Oksman-Caldenty, K.M.; Saito, K. Integrating genomics and metabolomics for engineering plant metabolic pathways. Curr. Opin. Biochem. 2005, 16, 174–179. [Google Scholar] [CrossRef]
- T’Kindt, R.; Morreel, K.; Deforce, D.; Boerjan, W.; Van Bocxlaer, J. Joint GC-MS and LC-MS platforms for comprehensive plant metabolomics: Repeatability and sample pre-treatment. J. Chromatogr. B 2009, 877, 3572–3580. [Google Scholar] [CrossRef]
- Allwood, J.W.; Ellis, D.I.; Goodacre, R. Metabolomic technologies and their application to the study of plants and plant-host interactions. Physiol. Plant. 2008, 132, 117–135. [Google Scholar]
- Brown, M.; Dunn, W.B.; Dobson, P.; Patel, Y.; Winder, C.L.; Francis-McIntyre, S.; Begley, P.; Carroll, K.; Broadhurst, D.; Tseng, A.; et al. Mass spectrometry tools and metabolite-specific databases for molecular identification in metabolomics. Analyst 2009, 134, 1322–1332. [Google Scholar] [CrossRef]
- Goodacre, R.; York, E.V.; Heald, J.K.; Scott, I.M. Chemometric discrimination of unfractionated plant extracts analyzed by electrospray mass spectrometry. Phytochemistry 2003, 62, 859–863. [Google Scholar]
- Goodacre, R.; Vaidyanathan, S.; Dunn, W.B.; Harrigan, G.G.; Kell, D.B. Metabolomics by numbers: Acquiring and understanding global metabolite data. Trends Biotechnol. 2004, 22, 245–252. [Google Scholar] [CrossRef]
- Richards, S.E.; Dumas, M.E.; Fonville, J.M.; Ebbels, T.M.D.; Holmes, E.; Nicholson, J.K. Intra- and inter-omic fusion of metabolic profiling data in a systems biology framework. Chemometr. Intell. Lab. Syst. 2010, 104, 121–131. [Google Scholar] [CrossRef]
- Trethewey, R.N. Metabolite profiling as an aid to metabolic engineering in plants. Curr. Opin. Plant Biol. 2004, 7, 196–201. [Google Scholar] [CrossRef]
- Croteau, R.; Kutchan, T.M.; Lewis, N.G. Natural products (secondary metabolites). In Biochemistry and Molecular Biology of Plants; Buchanan, B., Gruissem, B., Jones, R., Eds.; American Society of Plant Physiologists: Rockville, MD, USA, 2000; pp. 1250–1318. [Google Scholar]
- Jackson, A.O.; Taylor, C.B. Plant-microbe interactions: Life and death at the interface. Plant Cell 1996, 8, 1651–1668. [Google Scholar]
- Manosalva, P.M.; Park, S.; Forouhar, F.; Tong, L.; Fry, W.E.; Klessig, D.F. Methyl Esterase 1 (StMES1) is required for systemic acquired resistance in potato. Mol. Plant Microbe Interaction 2010, 23, 1151–1163. [Google Scholar] [CrossRef]
- Pieterse, C.M.J.; Leon-Reyes, A.; Van der Ent, S.; Van Wees, S. Networking by small-molecule hormones in plant immunity. Nat. Chem. Biol. 2009, 5, 308–316. [Google Scholar] [CrossRef]
- Wink, M. Plant breeding: Importance of plant secondary metabolites for protection against pathogens and herbivores. Theor. Appl. Genet. 1988, 75, 225–233. [Google Scholar] [CrossRef]
- Albert, M.; Jehle, A.K.; Lipschis, M.; Mueller, K.; Zeng, Y.; Felix, G. Regulation of cell behaviour by plant receptor kinases: Pattern recognition receptors as prototypical models. Eur. J. Cell Biol. 2010, 89, 200–207. [Google Scholar] [CrossRef]
- Jones, J.D.G.; Dangl, J.L. The plant immune system. Nature 2006, 444, 323–329. [Google Scholar]
- Monaghan, J.; Germain, H.; Weihmann, T.; Li, X. Dissecting plant defence signal transduction: Modifiers of snc1 in Arabidopsis. Can. J. Plant Pathol. 2010, 32, 35–42. [Google Scholar] [CrossRef]
- Segonzac, C.; Zipfel, C. Activation of plant pattern-recognition receptors by bacteria. Curr. Opin. Microbiol. 2011, 14, 54–61. [Google Scholar]
- Zeng, W.; Melotto, M.; He, S.Y. Plant stomata: A checkpoint of host immunity and pathogen virulence. Curr. Opin. Biotechnol. 2010, 21, 599–603. [Google Scholar] [CrossRef]
- Blumwald, E.; Aharon, G.S.; Lam, B.C. Early signal transduction pathways in plant-pathogen interactions. Trends Plant Sci. 1998, 3, 342–346. [Google Scholar] [CrossRef]
- Pritchard, L.; Birch, P. A systems biology perspective on plant-microbe interactions: Biochemical and structural targets of pathogen effectors. Plant Sci. 2011, 180, 584–603. [Google Scholar] [CrossRef]
- Lochman, J.; Mikes, V. Ergosterol treatment leads to the expression of a specific set of defence-related genes in tobacco. Plant Mol. Biol. 2006, 62, 43–51. [Google Scholar] [CrossRef]
- Granado, J.; Felix, G.; Boller, T. Perception of fungal sterols in plants—Subnanomolar concentrations of ergosterol elicits extracellular alkalinisation in tomato cells. Plant Physiol. 1995, 107, 485–490. [Google Scholar]
- Sanabria, N.M.; Huang, J.C.; Dubery, I.A. Self/non-self perception in plants in innate immunity and defense. Self/Nonself: Immu. Regul. Signal. 2009, 1, 1–15. [Google Scholar]
- Kasparovsky, T.; Blein, J.P.; Mikes, V. Ergosterol elicits oxidative burst in tobacco cells via phospholipase A2 and protein kinase C signal pathway. Plant Physiol. Biochem. 2004, 42, 429–435. [Google Scholar]
- Vatsa, P.; Chiltz, A.; Luini, E.; Vandelle, E.; Pugin, A.; Roblin, G. Cytosolic calcium rises and related events in ergosterol-treated Nicotiana cells. Plant Physiol. Biochem. 2011, 49, 764–773. [Google Scholar] [CrossRef]
- Chappell, J.; Nable, R. Induction of sesquiterpenoid biosynthesis in tobacco cell suspension cultures by fungal elicitor. Plant Physiol. 1987, 85, 468–473. [Google Scholar]
- Kuc, J. Phytoalexins from the solanaceae. In Phytoalexins; Bailey, J.A., Mansfield, J.W., Eds.; Blackie: London, UK, 1982; pp. 81–105. [Google Scholar]
- Zook, M.; Hohn, T.; Bonnen, A.; Tsuji, J.; Hammerschmidt, R. Characterization of novel sesquiterpenoid biosynthesis in tobacco expressing a fungal sesquiterpene synthase. Plant Physiol. 1996, 112, 311–318. [Google Scholar]
- Towill, L.E.; Mazur, P. Studies on the reduction of 2,3,5-triphenyltetrazolium chloride as a viability assay for plant tissue cultures. Can. J. Bot. 1975, 53, 1097–1102. [Google Scholar] [CrossRef]
- Berg, R.A.; Rubingh, C.M.; Westerhuis, J.A.; Werf, M.J.; Smilde, A.K. Metabolomics data exploration guided by prior knowledge. Anal. Chim. Acta 2009, 651, 173–181. [Google Scholar] [CrossRef]
- Bylesjo, M. Latent Variable based Computational Methods for Applications in Life Sciences: Analysis and Integration of Omics Data Sets; Umea University: Umea, Sweden, 2008; pp. 6–16. [Google Scholar]
- Jansen, J.J.; Smit, S.; Hoefsloot, H.C.J.; Smilde, A.K. The photographer and the greenhouse: How to analyse plant metabolomics data. Phytochem. Anal. 2010, 21, 48–60. [Google Scholar] [CrossRef]
- Stenlund, H. Improving Interpretation by Orthogonal Variation: Multivariate Analysis of Spectroscopic Data; Umea University: Umea, Sweden, 2011; pp. 12–35. [Google Scholar]
- Berg, R.A.; Hoefsloot, H.C.; Westerhuis, J.A.; Smilde, A.K.; Werf, M.J. Centering, scaling, and transformations: Improving the biological information content of metabolomics data. BMC Genomics 2006, 15, 1–15. [Google Scholar]
- Boccard, J.; Grata, E.; Thiocone, A.; Gauvrit, J.Y.; Lanteri, P.; Carrupt, P.A.; Wolfender, J.L.; Rudaz, S. Multivariate data analysis of rapid LC-TOF/MS experiments from Arabidopsis thaliana stressed by wounding. Chemometr. Intell. Lab. Syst. 2007, 86, 189–197. [Google Scholar] [CrossRef]
- Grata, E.; Boccard, J.; Guillarme, D.; Glauser, G.; Carrupt, P.A.; Rarmer, E.E.; Wolfender, J.L.; Rudaz, S. UPLC-TOF-MS for plant metabolomics: A sequential approach for wound marker analysis in Arabidopsis thaliana. J. Chromatogr. B 2008, 871, 261–270. [Google Scholar] [CrossRef]
- Kuc, J.; Rush, J.S. Phytoalexins. Arch. Biochem. Biophys. 1985, 236, 455–472. [Google Scholar] [CrossRef]
- Guedes, M.E.; Kuc, R.; Hammerschmidt, R.; Bostock, R. Accumulation of six sesquiterpenoid phytoalexins in tobacco leaves infiltrated with Pseudomomas lachrymans. Phytochemistry 1980, 21, 2987–2988. [Google Scholar] [CrossRef]
- Stoessl, A.; Stothers, J.B.; Ward, E.W.B. Sesquiterpenoid stress compounds of the Solanaceae. Phytochemistry 1976, 15, 855–872. [Google Scholar]
- Henfling, J.M.; Kuc, J. A Semi-micro method for the quantitation of sesquiterpenoid stress metabolites in potato tuber tissue. Phytopathology 1979, 69, 609–611. [Google Scholar] [CrossRef]
- Dixon, R.A.; Dey, P.M.; Lamb, C.J. Phytoalexins: enzymology and molecular biology. In Advances in Enzymology and Related Areas of Molecular Biology; Meister, A., Ed.; John Wiley: New York, NY, USA, 1983; Volume 55, pp. 1–137. [Google Scholar]
- Chen, F.; Tholl, D.; Bohlmann, J.; Pichersky, E. The family of terpene synthases in plants: A mid-size family of genes for specialized metabolism that is highly diversified throughout the kingdom. Plant J. 2011, 66, 212–229. [Google Scholar] [CrossRef]
- McGarvey, D.J.; Croteau, R. Terpenoid metabolism. Plant Cell 1995, 7, 1015–1026. [Google Scholar]
- Verpoorte, R. Secondary metabolism. In Metabolic Engineering of Plant Secondary Metabolism; Verpoorte, R., Alfermann, A.W., Eds.; Kluwer Academic Publishers: Dortrecht, The Netherlands, 2000; pp. 1–29. [Google Scholar]
- Cane, D.E.; Bowser, T.E. Trichodiene synthase: Mechanism-based inhibition of a sesquiterpene cyclase. Bioorg. Med. Chem. Lett. 1999, 9, 1127–1132. [Google Scholar]
- Chappell, J.; Von Lanken, C.; Vogeli, U.; Bhatt, P. Sterol and sesquiterpenoid biosynthesis during a growth cycle of tobacco cell suspension cultures. Plant Cell Rep. 1989, 8, 48–52. [Google Scholar] [CrossRef]
- Nugroho, L.H.; Peltenburg-Looman, A.M.G.; Verberne, M.C.; Verpoorte, R. Is accumulation of sesquiterpenoid phytoalexins induced in tobacco plants constitutively producing salicylic acid? Plant Sci. 2002, 162, 989–993. [Google Scholar] [CrossRef]
- Hanley, K.M.; Vogeli, U.; Chappell, J. A study of the isoprenoid pathway in elicitor-treated tobacco cell suspension cultures. In Secondary-Metabolite Biosynthesis and Metabolism; Petroski, R.J., McCormick, S.P., Eds.; Plenum Press: New York, NY, USA, 1992; pp. 329–336. [Google Scholar]
- Keller, H.; Czernic, P.; Ponchet, M.; Ducrot, P.H.; Chappell, J.; Ricci, P.; Marco, Y. Sesquiterpene cyclase is not a determining factor for elicitor and pathogen-induced capsidiol accumulation in tobacco. Planta 1998, 205, 467–476. [Google Scholar] [CrossRef]
- Vogeli, U.; Freeman, J.W.; Chappell, J. Purification and characterization of an inducible sesquiterpene cyclase from elicitor-treated tobacco cell suspension cultures. Plant Physiol. 1990, 93, 182–187. [Google Scholar] [CrossRef]
- Brooks, C.J.W.; Watson, D.G.; Rycroft, D.S.; Freer, I.M. The biosynthesis of sesquiterpenoid phytoalexins in suspended callus cultures of Nicotiana tabacum. Phytochemistry 1987, 26, 2243–2245. [Google Scholar] [CrossRef]
- Fuchs, A.; Slobbe, W.; Mol, M.C.; Posthumus, M.A. GC/MS analysis of fungitoxic terpenoids from tobacco. Phytochemistry 1983, 22, 1197–1199. [Google Scholar]
- Uegaki, R.; Fujimori, T.; Kubo, S.; Kato, K. Sesquiterpenoid stress compounds from Nicotiana species. Phytochemistry 1981, 20, 1567–1568. [Google Scholar]
- Dixon, R.A. The phytoalexin response: Elicitation, signalling and control of host gene expression. Biol. Rev. 1986, 61, 239–291. [Google Scholar] [CrossRef]
- Gerber, I.B.; Dubery, I.A. Protein phosphorylation in Nicotiana tabacum cells in response to perception of lipopolysaccharides from Burkholderia cepacia. Phytochemistry 2004, 65, 2957–2966. [Google Scholar]
- Zang, X.H.; Wu, Q.H.; Zhang, M.Y.; Xi, G.H.; Wang, Z. Developments of dispersive liquid-liquid microextraction technique. Chin. J. Anal. Chem. 2009, 37, 161–168. [Google Scholar] [CrossRef]
- Trygg, J.; Holmes, E.; Lundstedt, T. Chemometrics in metabonomics. J. Proteome Res. 2007, 6, 469–479. [Google Scholar] [CrossRef]
- Sample Availability: Not available.
© 2012 by the authors; licensee MDPI, Basel, Switzerland. This article is an open-access article distributed under the terms and conditions of the Creative Commons Attribution license (http://creativecommons.org/licenses/by/3.0/).
Share and Cite
Tugizimana, F.; Steenkamp, P.A.; Piater, L.A.; Dubery, I.A. Ergosterol-Induced Sesquiterpenoid Synthesis in Tobacco Cells. Molecules 2012, 17, 1698-1715. https://doi.org/10.3390/molecules17021698
Tugizimana F, Steenkamp PA, Piater LA, Dubery IA. Ergosterol-Induced Sesquiterpenoid Synthesis in Tobacco Cells. Molecules. 2012; 17(2):1698-1715. https://doi.org/10.3390/molecules17021698
Chicago/Turabian StyleTugizimana, Fidele, Paul A. Steenkamp, Lizelle A. Piater, and Ian A. Dubery. 2012. "Ergosterol-Induced Sesquiterpenoid Synthesis in Tobacco Cells" Molecules 17, no. 2: 1698-1715. https://doi.org/10.3390/molecules17021698