Response Surface Modeling and Optimization of Accelerated Solvent Extraction of Four Lignans from Fructus Schisandrae

Abstract
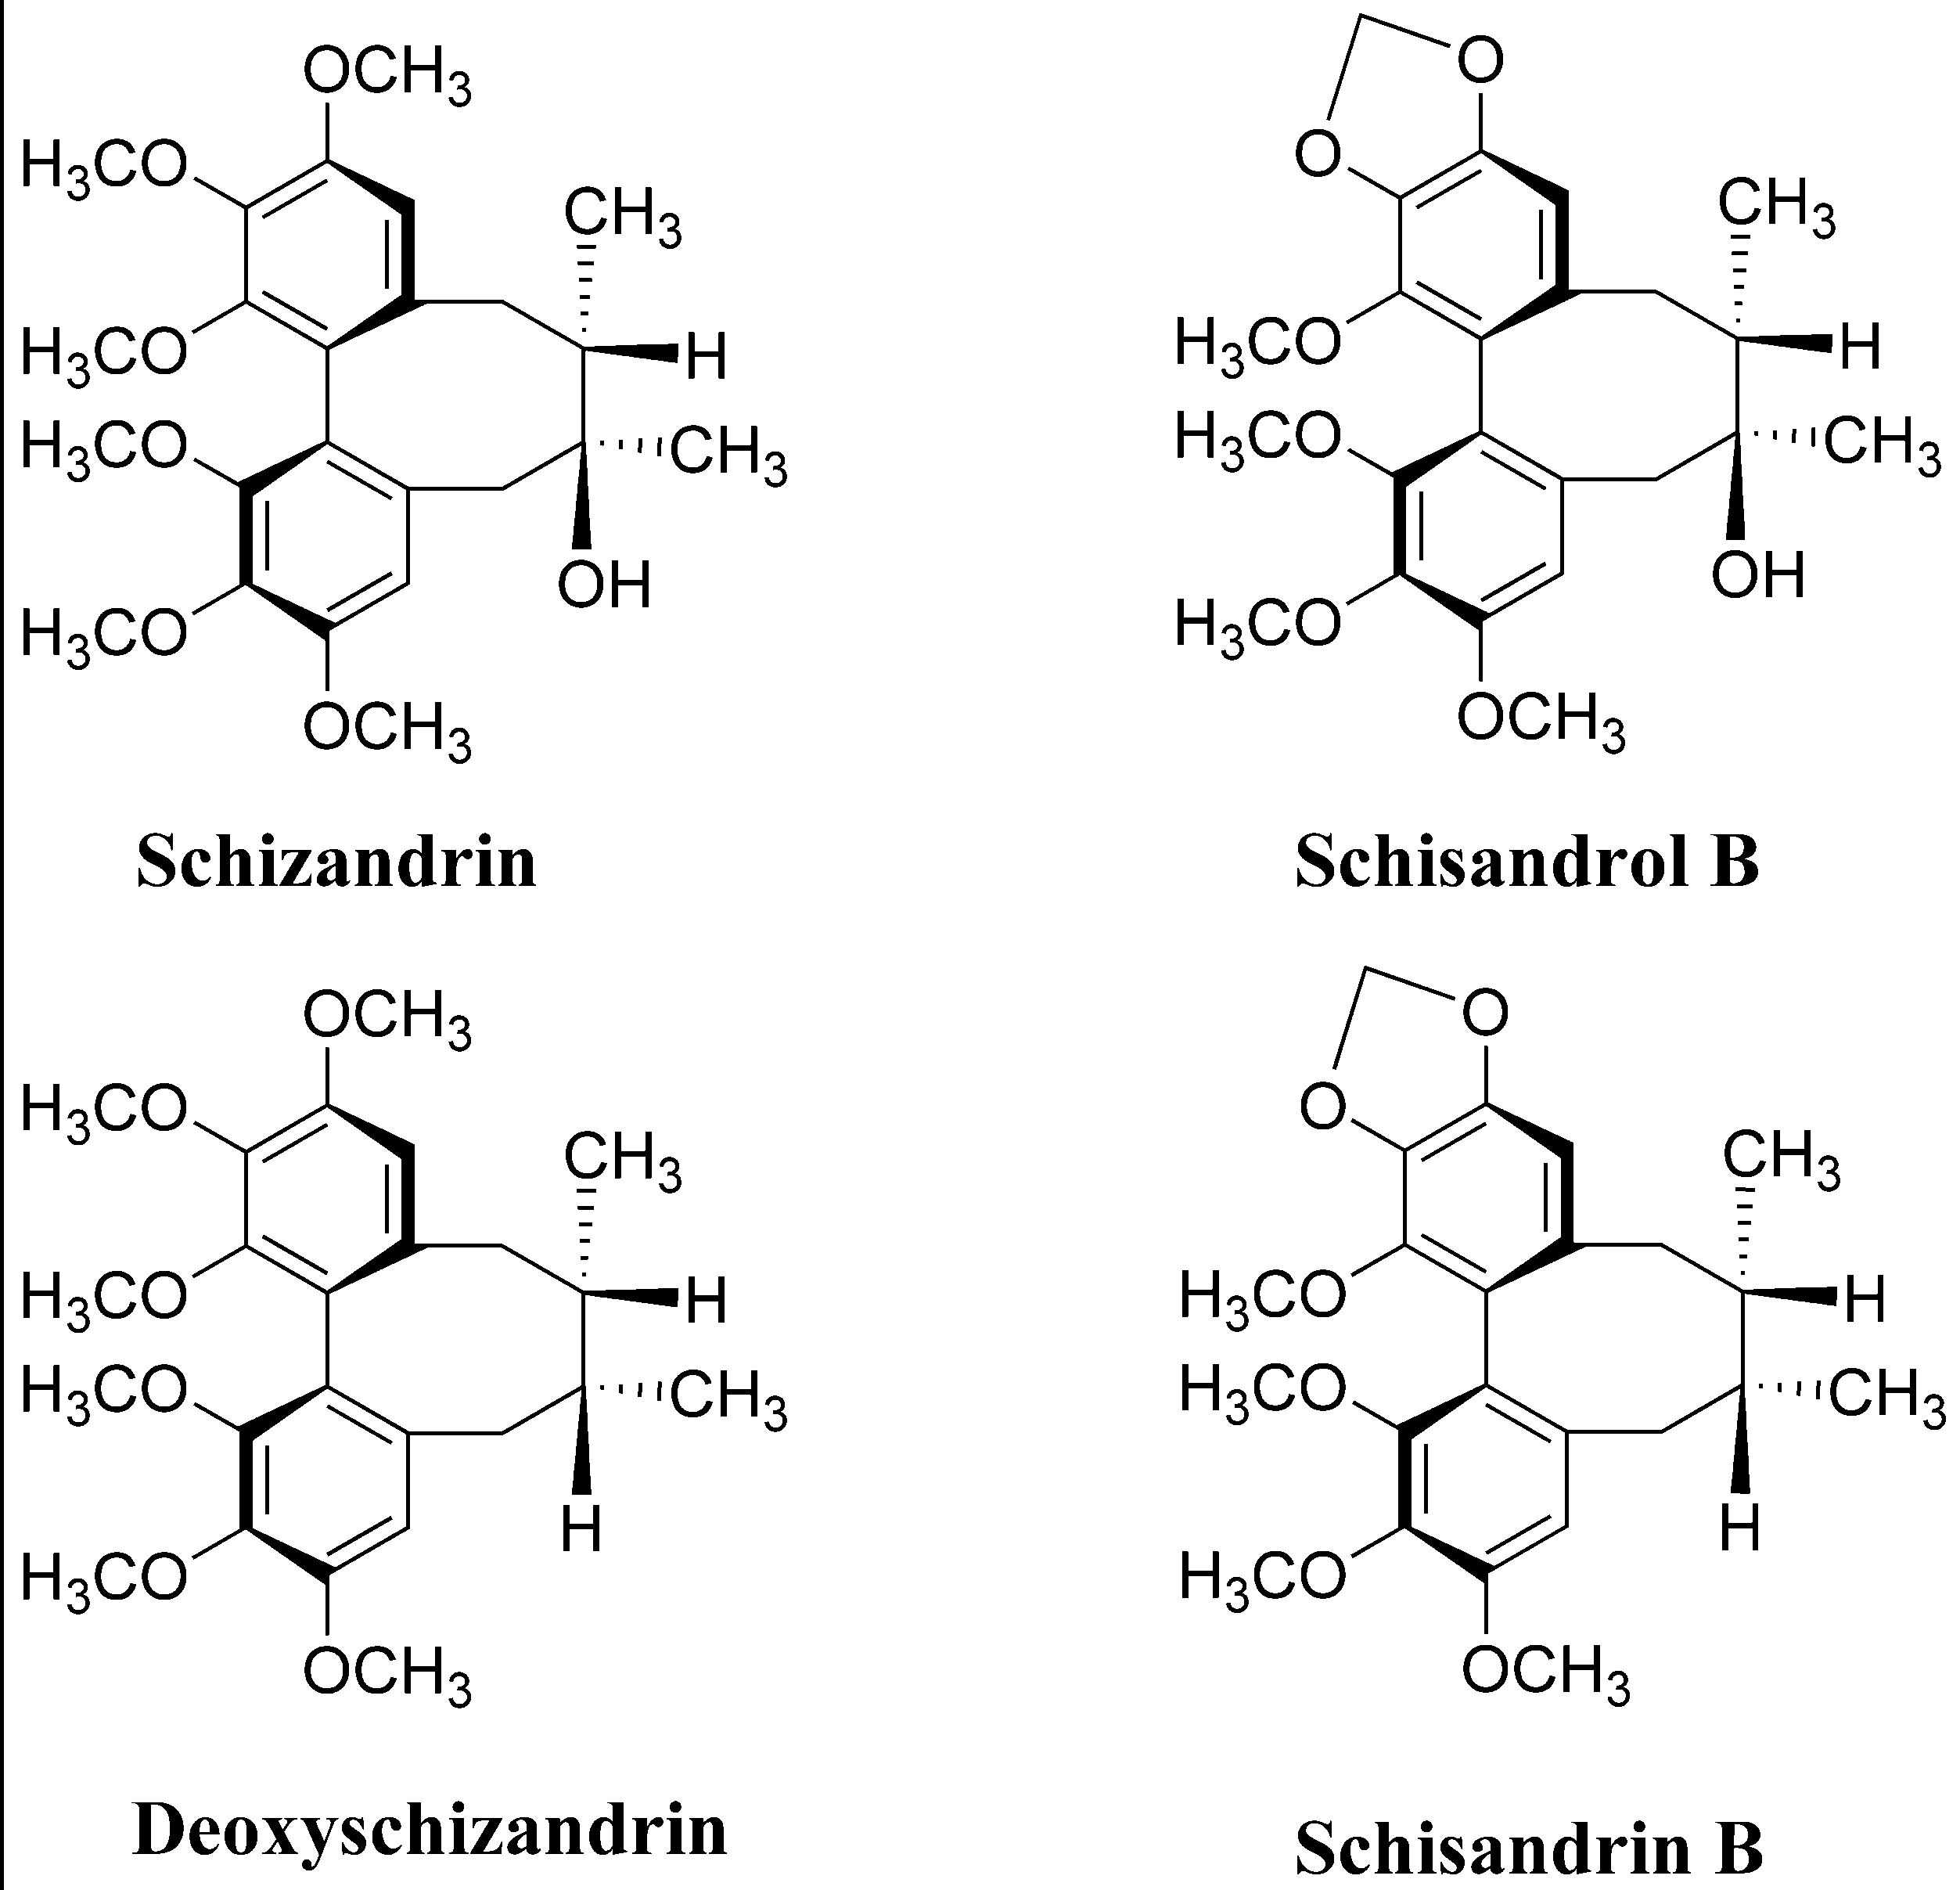
:1. Introduction
2. Results and Discussion
2.1. Predicted Model and Statistical Analysis


| Run | Coded and Uncoded Variables Levels | Yield of Lignans (mg/g) | |||
|---|---|---|---|---|---|
| X1/ethanol (%) | X2/time (min) | X3/temperature (°C) | Actual Values | Predicted Values | |
| 1 | −1 (50) | −1 (5) | 0 (130) | 9.96 ± 0.32 | 9.94 |
| 2 | 1 (100) | −1 (5) | 0 (130) | 11.34 ± 0.25 | 11.15 |
| 3 | −1 (50) | 1 (12) | 0 (130) | 12.65 ± 0.34 | 12.85 |
| 4 | 1 (100) | 1 (12) | 0 (130) | 13.99 ± 0.45 | 14.01 |
| 5 | −1 (50) | 0 (8.5) | −1 (80) | 11.80 ± 0.26 | 11.69 |
| 6 | 1 (100) | 0 (8.5) | −1 (80) | 12.77 ± 0.23 | 12.83 |
| 7 | −1 (50) | 0 (8.5) | 1 (180) | 12.88 ± 0.33 | 12.81 |
| 8 | 1 (100) | 0 (8.5) | 1 (180) | 13.91 ± 0.29 | 14.03 |
| 9 | 0 (75) | −1 (5) | −1 (80) | 9.90 ± 0.22 | 10.03 |
| 10 | 0 (75) | 1 (12) | −1 (80) | 12.99 ± 0.21 | 12.91 |
| 11 | 0 (75) | −1 (5) | 1 (180) | 11.10 ± 0.22 | 11.19 |
| 12 | 0 (75) | 1 (12) | 1 (180) | 14.21 ± 0.31 | 14.08 |
| 13 | 0 (75) | 0 (8.5) | 0 (130) | 14.12 ± 0.28 | 14.00 |
| 14 | 0 (75) | 0 (8.5) | 0 (130) | 13.89 ± 0.23 | 14.00 |
| 15 | 0 (75) | 0 (8.5) | 0 (130) | 13.99 ± 0.27 | 14.00 |
| Source | SS | DF | MS | F-value | p-value | |
|---|---|---|---|---|---|---|
| Model | 34.27 | 9 | 3.81 | 125.80 | <0.0001 | significant |
| Residual | 0.21 | 7 | 0.030 | |||
| Lack of fit | 0.16 | 3 | 0.054 | 4.38 | 0.0938 | insignificant |
| Experimental error | 0.049 | 4 | 0.012 |
| Variables | DF | SS | MS | F-values | p-value |
|---|---|---|---|---|---|
| X1 | 1 | 2.79 | 2.79 | 92.25 | <0.0001 |
| X2 | 1 | 16.65 | 16.65 | 550.04 | <0.0001 |
| X3 | 1 | 2.70 | 2.70 | 89.15 | <0.0001 |
| X21 | 1 | 1.59 | 1.59 | 52.41 | 0.0002 |
| X22 | 1 | 8.28 | 8.28 | 273.56 | <0.0001 |
| X23 | 1 | 1.27 | 1.27 | 41.97 | 0.0003 |
| X1X2 | 1 | 4.41E-004 | 4.41E-004 | 0.015 | 0.9073 |
| X1X3 | 1 | 1.23E-003 | 1.23E-003 | 0.040 | 0.8463 |
| X2X3 | 1 | 4.90E-005 | 4.90E-005 | 1.62E-003 | 0.9690 |
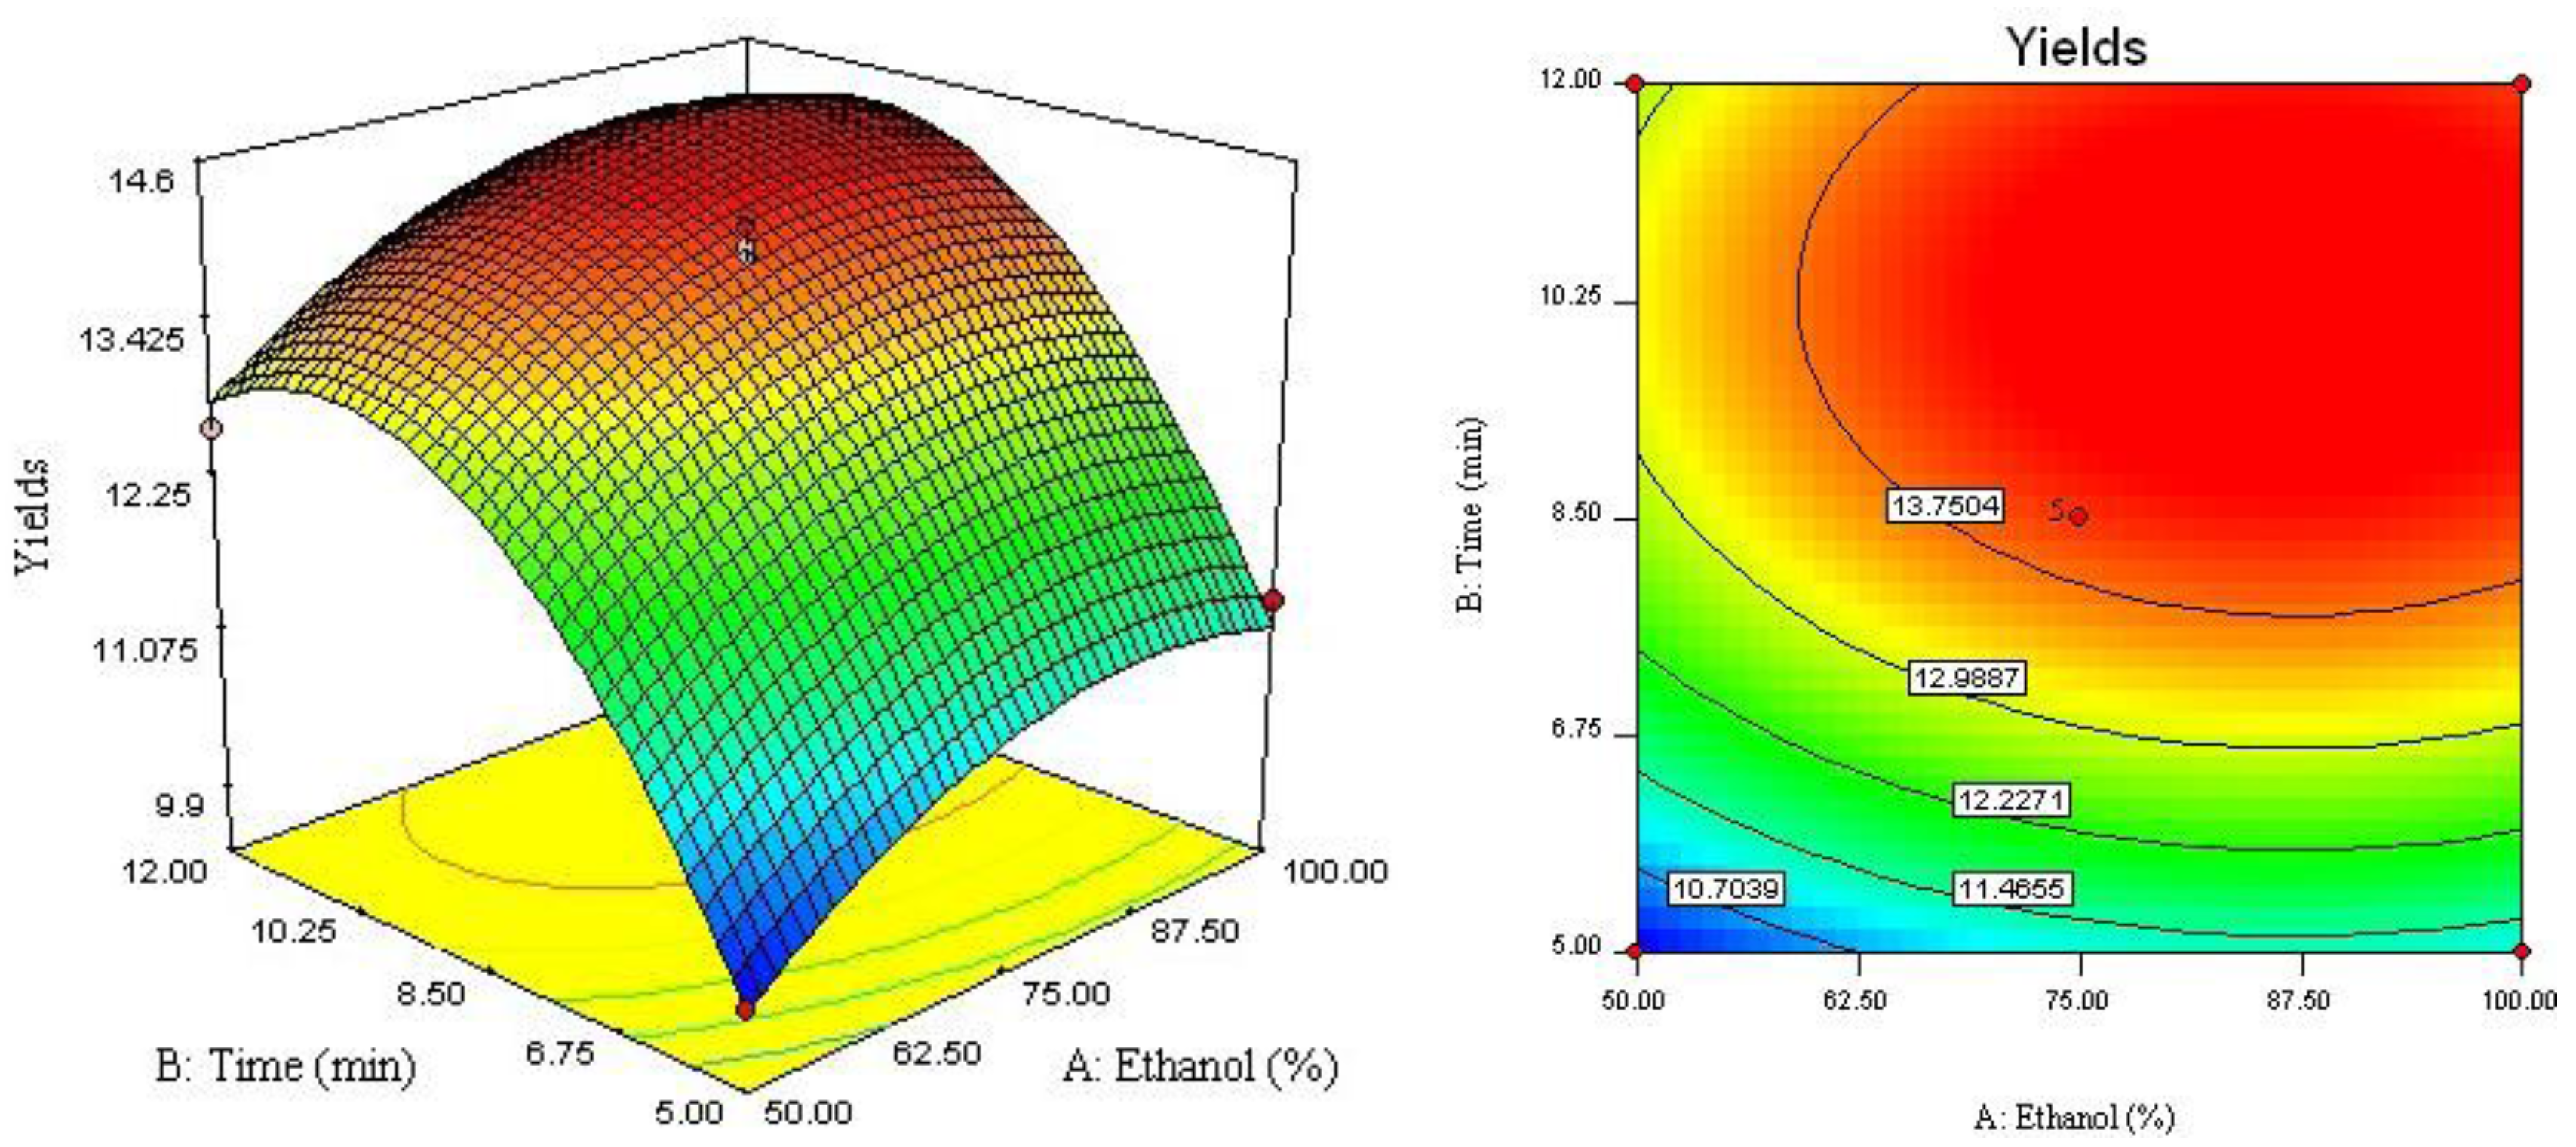
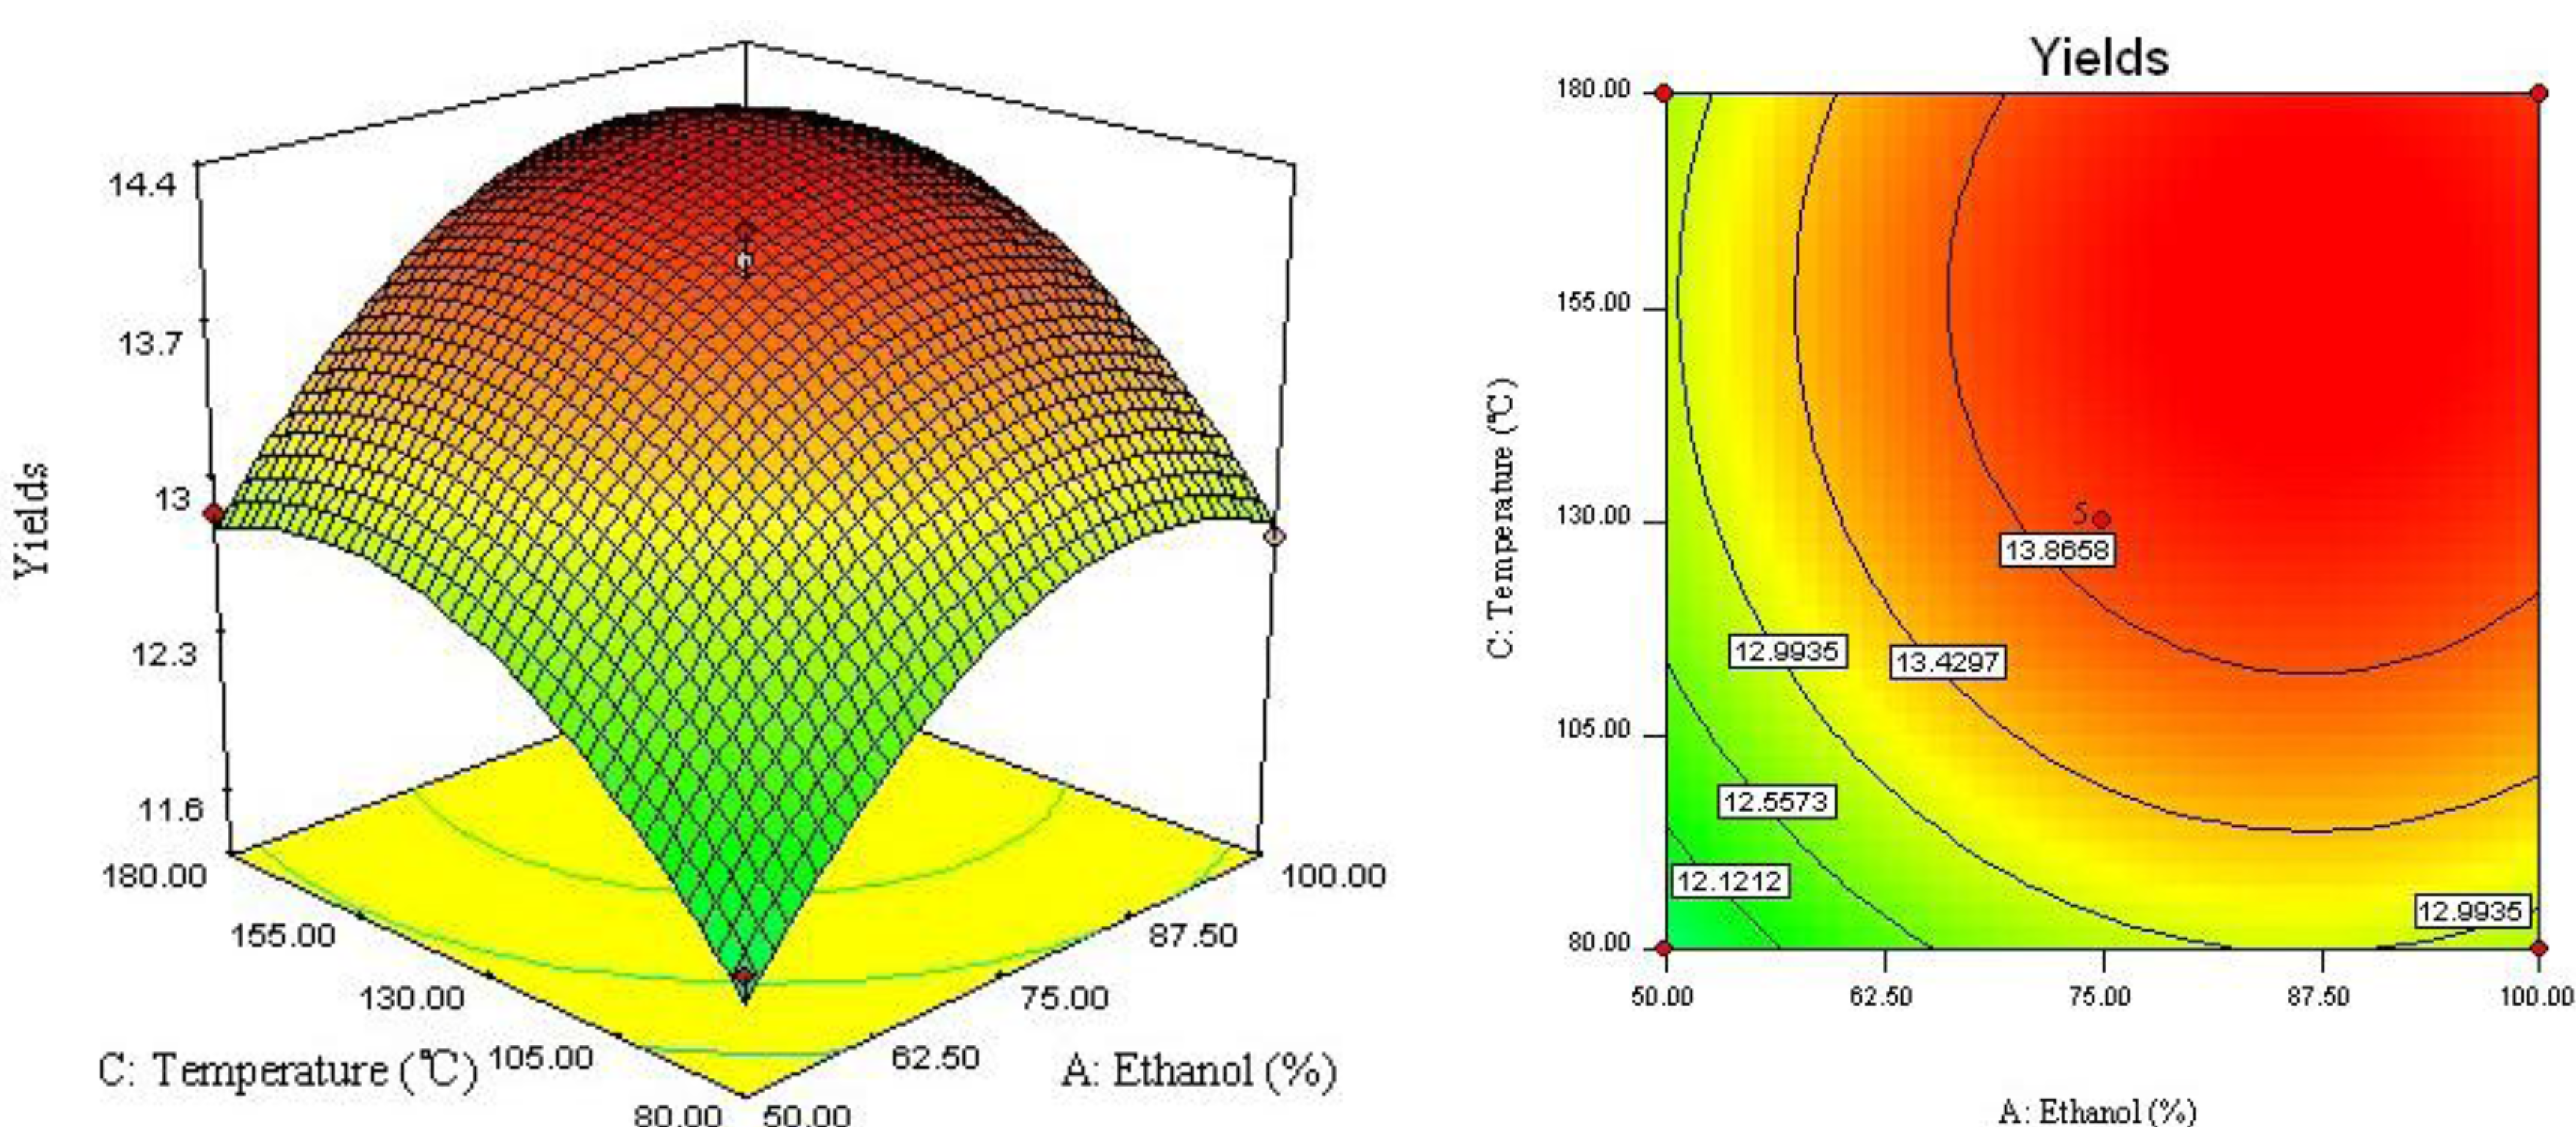
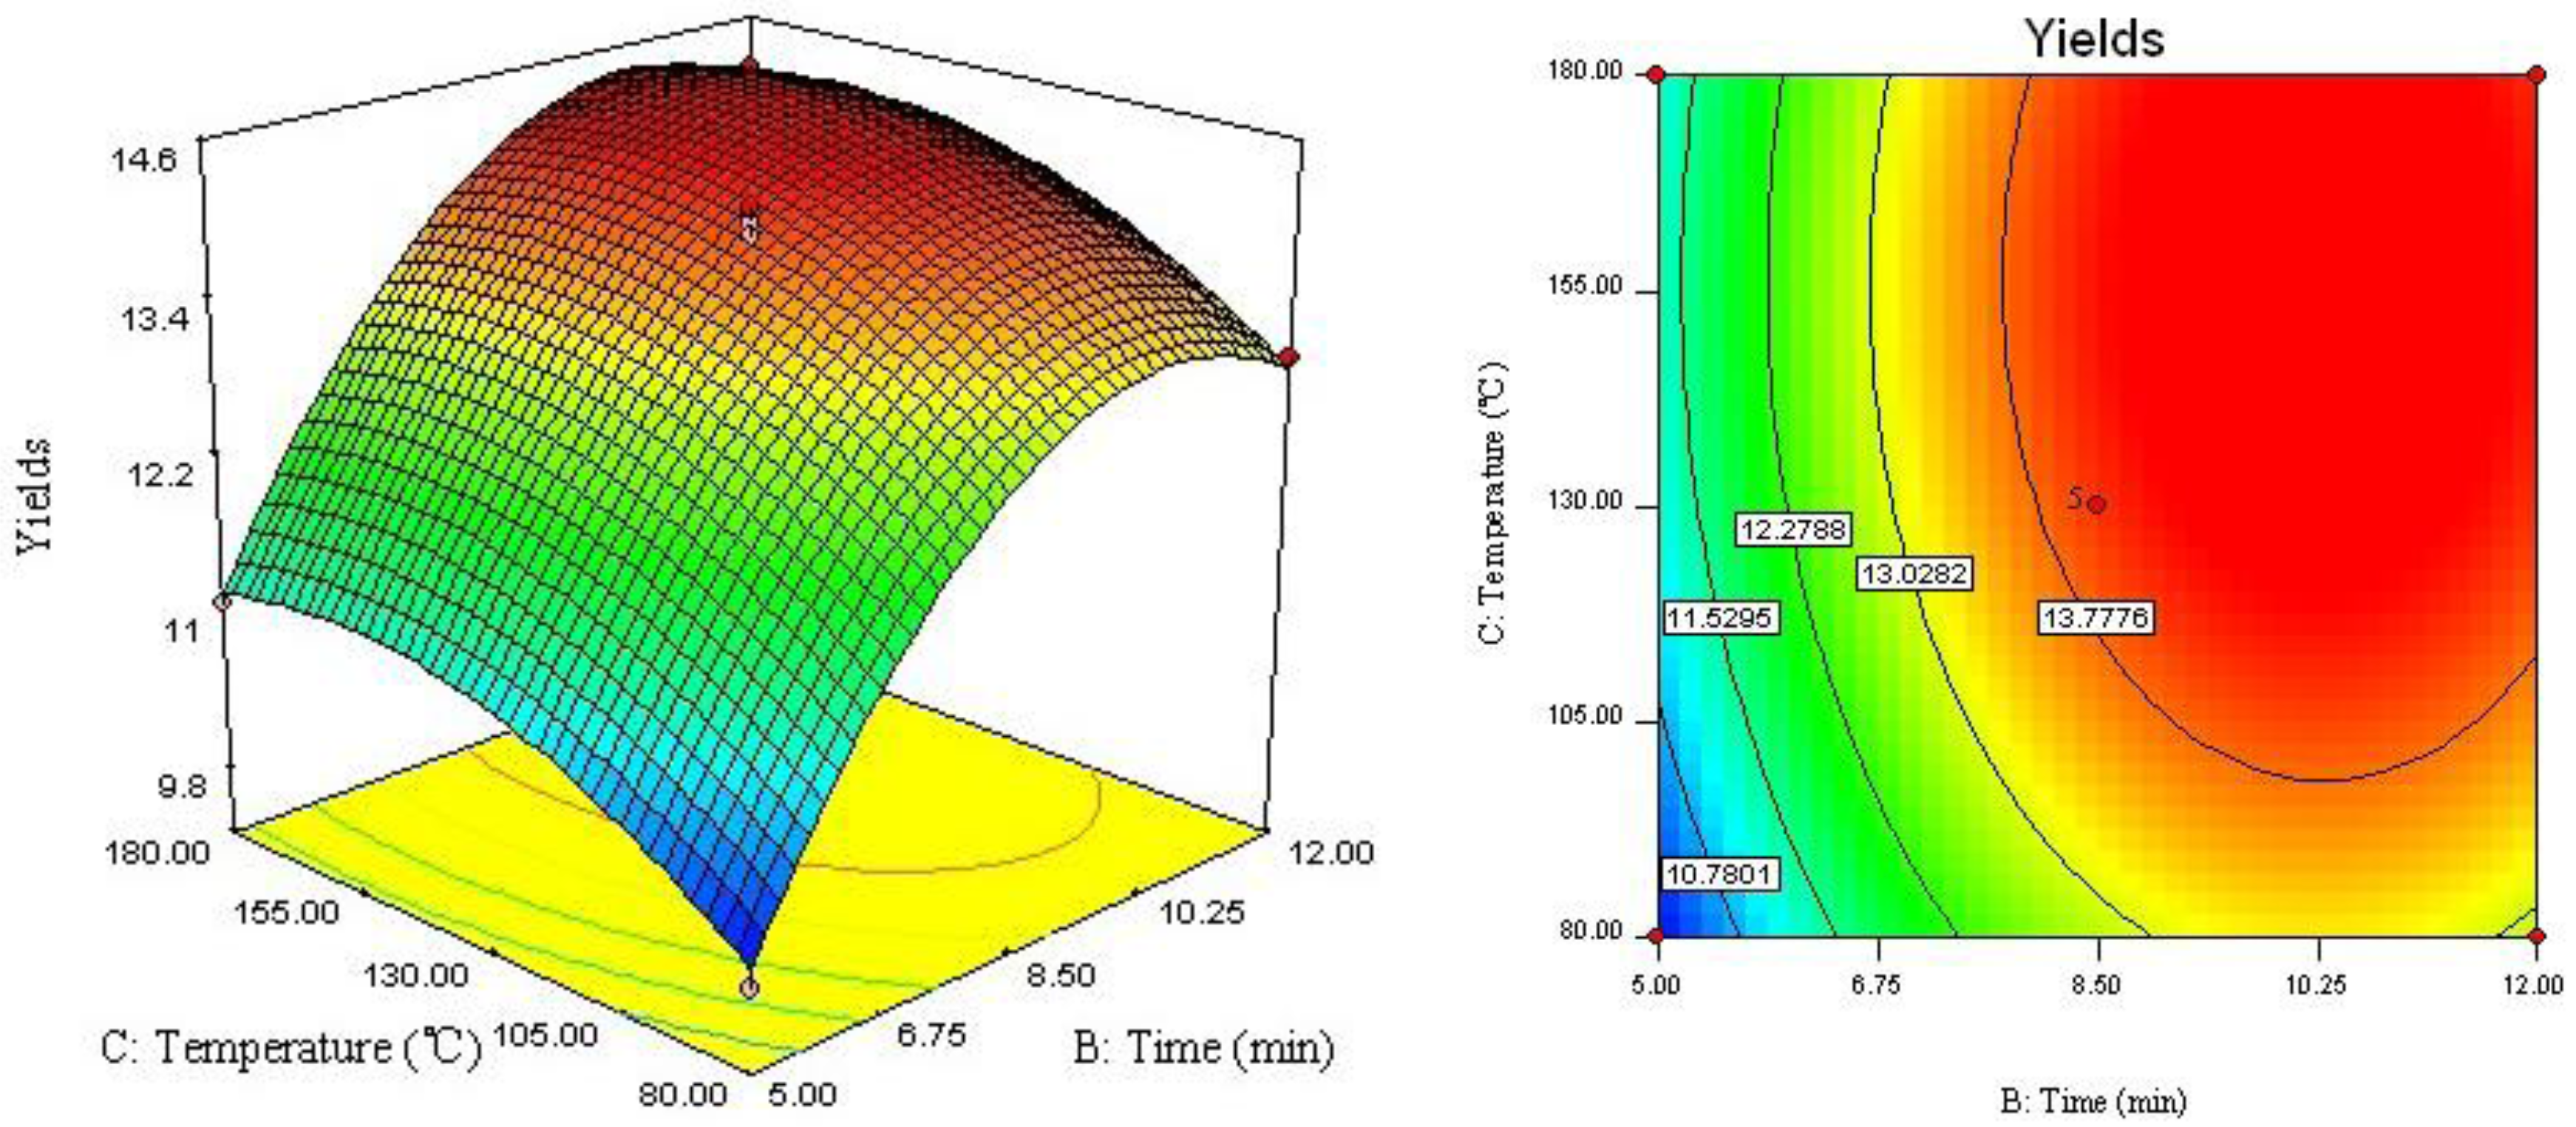
2.2. Optimization of Extraction Parameters of Lignans


2.3. Selection of Extraction Cycles and Flush Volume
2.4. Verification of Predictive Model
| Ethanol (%) | Extraction time (min) | Temperature (°C) | Yield of Lignans (mg/g) | |
|---|---|---|---|---|
| Optimum conditions (predicted) | 87.09 | 10.30 | 156.94 | 14.67 |
| Modified conditions (actual) | 87.00 | 10.00 | 160.00 | 14.72 ± 0.77 |
2.5. Comparison with Conventional Extractions
3. Experimental
3.1. Plant Material
3.2. Chemicals and Reagents
3.3. Accelerated Solvent Extraction
3.4. Conventional Extraction
3.5. HPLC Analysis of Four Lignans

3.6. Experimental Design and Statistical Analyses

4. Conclusions
- Sample Availability: Samples of the compounds are available from the authors.
References and Notes
- Khayet, M.; Cojocaru, C.; Essalhi, M. Artifcial neural network modeling and response surface methodology of desalination by reverse osmosis. J. Memb. Sci. 2011, 368, 202–214. [Google Scholar]
- Liu, F.F.; Ang, C.Y.; Springer, D. Optimization of extraction conditions for active components in Hypericum perforatum using response surface methodology. J. Agric. Food Chem. 2000, 48, 3364–3371. [Google Scholar]
- Kwon, J.H.; Belanger, J.M.; Pare, J.R. Optimization of microwave-assisted extraction (MAP) for ginseng components by response surface methodology. J. Agric. Food Chem. 2003, 51, 1807–1810. [Google Scholar]
- Li, W.; Wang, Z.; Sun, Y.S.; Chen, L.; Han, L.K.; Zheng, Y.N. Application of response surface methodology to optimise ultrasonic-assisted extraction of four chromones in Radix Saposhnikoviae. Phytochem. Anal. 2011, 22, 313–321. [Google Scholar]
- Zhao, L.C.; Liang, J.; Li, W.; Cheng, K.M.; Xia, X.; Deng, X.; Yang, G.L. The use of response surface methodology to optimize the ultrasound-assisted extraction of five anthraquinones from Rheum palmatum L. Molecules 2011, 16, 5928–5937. [Google Scholar]
- Yang, L.; Jiang, J.G.; Li, W.F.; Chen, J.; Wang, D.Y.; Zhu, L. Optimum extraction process of polyphenols from the bark of Phyllanthus emblica L. based on the response surface methodology. J. Sep. Sci. 2009, 32, 1437–1444. [Google Scholar]
- Ballard, T.S.; Mallikarjunan, P.; Zhou, K.; O'Keefe, S.F. Optimizing the extraction of phenolic antioxidants from peanut skins using response surface methodology. J. Agric. Food Chem. 2009, 57, 3064–3072. [Google Scholar]
- Mylonaki, S.; Kiassos, E.; Makris, D.P.; Kefalas, P. Optimisation of the extraction of olive (Olea europaea) leaf phenolics using water/ethanol-based solvent systems and response surface methodology. Anal. Bioanal. Chem. 2008, 392, 977–985. [Google Scholar]
- Xie, J.H.; Xie, M.Y.; Shen, M.Y.; Nie, S.P.; Li, C.; Wang, Y.X. Optimisation of microwave-assisted extraction of polysaccharides from Cyclocarya paliurus (Batal.) Iljinskaja using response surface methodology. J. Sci. Food Agric. 2010, 90, 1353–1360. [Google Scholar] [CrossRef]
- Hou, J.G.; He, S.Y.; Ling, M.S.; Li, W.; Dong, R.; Pan, Y.; Zheng, Y.N. A method of extracting ginsenosides from Panax ginseng by pulsed electric field. J. Sep. Sci. 2010, 33, 2707–2713. [Google Scholar]
- Li, W.; Liu, Z.B.; Wang, Z.; Chen, L.; Sun, Y.S.; Hou, J.G.; Zheng, Y.N. Application of accelerated solvent extraction to the investigation of saikosaponins from the roots of Bupleurum falcatum. J. Sep. Sci. 2010, 33, 1870–1876. [Google Scholar]
- Gao, X.; Yang, X.W.; Marriott, P.J. Simultaneous analysis of seven alkaloids in Coptis-Evodia herb couple and Zuojin Pill by UPLC with accelerated solvent extraction. J. Sep. Sci. 2010, 33, 2714–2722. [Google Scholar]
- Barri, T.; Bergstrom, S.; Hussen, A.; Norberg, J.; Jonsson, J.A. Extracting syringe for determination of organochlorine pesticides in leachate water and soil-water slurry: A novel technology for environmental analysis. J. Chromatogr. A 2006, 1111, 11–20. [Google Scholar]
- Zhang, Y.; Liu, C.; Yu, M.; Zhang, Z.; Qi, Y.; Wang, J.; Wu, G.; Li, S.; Yu, J.; Hu, Y. Application of accelerated solvent extraction coupled with high-performance counter-current chromatography to extraction and online isolation of chemical constituents from Hypericum perforatum L. J. Chromatogr. A 2011, 1218, 2827–2834. [Google Scholar]
- Bergeron, C.; Gafner, S.; Clausen, E.; Carrier, D.J. Comparison of the chemical composition of extracts from Scutellaria lateriflora using accelerated solvent extraction and supercritical fluid extraction versus standard hot water or 70% ethanol extraction. J. Agric. Food Chem. 2005, 53, 3076–3080. [Google Scholar]
- Ullah, S.M.; Murphy, B.; Dorich, B.; Richter, B.; Srinivasan, K. Fat extraction from acid- and base-hydrolyzed food samples using accelerated solvent extraction. J. Agric. Food Chem. 2011, 59, 2169–2174. [Google Scholar]
- Gentili, A.; Perret, D.; Marchese, S.; Sergi, M.; Olmi, C.; Curini, R. Accelerated solvent extraction and confirmatory analysis of sulfonamide residues in raw meat and infant foods by liquid chromatography electrospray tandem mass spectrometry. J. Agric. Food Chem. 2004, 52, 4614–4624. [Google Scholar]
- Wang, G.; Lee, A.S.; Lewis, M.; Kamath, B.; Archer, R.K. Accelerated solvent extraction and gas chromatography/mass spectrometry for determination of polycyclic aromatic hydrocarbons in smoked food samples. J. Agric. Food Chem. 1999, 47, 1062–1066. [Google Scholar]
- Zhu, M.; Lin, K.F.; Yeung, R.Y.; Li, R.C. Evaluation of the protective effects of Schisandra chinensis on Phase I drug metabolism using a CCl4 intoxication model. J. Ethnopharmacol. 1999, 67, 61–68. [Google Scholar]
- Chien, C.F.; Wu, Y.T.; Tsai, T.H. Biological analysis of herbal medicines used for the treatment of liver diseases. Biomed. Chromatogr. 2011, 25, 21–38. [Google Scholar]
- Song, J.X.; Lin, X.; Wong, R.N.; Sze, S.C.; Tong, Y.; Shaw, P.C.; Zhang, Y.B. Protective effects of dibenzocyclooctadiene lignans from Schisandra chinensis against beta-amyloid and homocysteine neurotoxicity in PC12 cells. Phytother. Res. 2011, 25, 435–443. [Google Scholar]
- Guo, L.Y.; Hung, T.M.; Bae, K.H.; Shin, E.M.; Zhou, H.Y.; Hong, Y.N.; Kang, S.S.; Kim, H.P.; Kim, Y.S. Anti-inflammatory effects of schisandrin isolated from the fruit of Schisandra chinensis Baill. Eur. J. Pharmacol. 2008, 591, 293–299. [Google Scholar]
- Hancke, J.L.; Burgos, R.A.; Ahumada, F. Schisandra chinensis (Turcz.) Baill. Fitoterapia 2011, 70, 451–471. [Google Scholar]
- Hossain, M.B.; Brunton, N.P.; Patras, A.; Tiwari, B.; O'Donnell, C.P.; Martin-Diana, A.B.; Barry-Ryan, C. Optimization of ultrasound assisted extraction of antioxidant compounds from marjoram (Origanum majorana L.) using response surface methodology. Ultrason. Sonochem. 2012, 19, 582–590. [Google Scholar] [CrossRef]
- Kim, H.K.; Do, J.R.; Lim, T.S.; Akram, K.; Yoon, S.R.; Kwon, J.H. Optimisation of microwave-assisted extraction for functional properties of Vitis coignetiae extract by response surface methodology. J. Sci. Food Agric. 2012. [Google Scholar] [CrossRef]
- Rodrigues, R.C.; Kenealy, W.R.; Dietrich, D.; Jeffries, T.W. Response surface methodology (RSM) to evaluate moisture effects on corn stover in recovering xylose by DEO hydrolysis. Bioresour. Technol. 2012, 108, 134–139. [Google Scholar] [Green Version]
- Li, W.; Wang, Z.; Chen, L.; Zhang, J.; Han, L.K.; Hou, J.G.; Zheng, Y.N. Pressurized liquid extraction followed by LC-ESI/MS for analysis of four chromones in Radix Saposhnikoviae. J. Sep. Sci. 2010, 33, 2881–2887. [Google Scholar]
- Yang, B.; Chen, T.; Li, X.L.; Xu, P.; He, S.P.; Yu, H.S.; Jin, F.X. Determination of lignans in Fructus schisandrae sphenantherae and Fructus schisandrae shinensis by high performance liquid chromatography. J. Dalian Polytechnic Univ. 2009, 28, 102–106. [Google Scholar]
© 2012 by the authors; licensee MDPI, Basel, Switzerland. This article is an open-access article distributed under the terms and conditions of the Creative Commons Attribution license (http://creativecommons.org/licenses/by/3.0/).
Share and Cite
Zhao, L.-C.; He, Y.; Deng, X.; Yang, G.-L.; Li, W.; Liang, J.; Tang, Q.-L. Response Surface Modeling and Optimization of Accelerated Solvent Extraction of Four Lignans from Fructus Schisandrae. Molecules 2012, 17, 3618-3629. https://doi.org/10.3390/molecules17043618
Zhao L-C, He Y, Deng X, Yang G-L, Li W, Liang J, Tang Q-L. Response Surface Modeling and Optimization of Accelerated Solvent Extraction of Four Lignans from Fructus Schisandrae. Molecules. 2012; 17(4):3618-3629. https://doi.org/10.3390/molecules17043618
Chicago/Turabian StyleZhao, Li-Chun, Ying He, Xin Deng, Geng-Liang Yang, Wei Li, Jian Liang, and Qian-Li Tang. 2012. "Response Surface Modeling and Optimization of Accelerated Solvent Extraction of Four Lignans from Fructus Schisandrae" Molecules 17, no. 4: 3618-3629. https://doi.org/10.3390/molecules17043618