A Monoclonal Antibody-Based ELISA for Multiresidue Determination of Avermectins in Milk

Abstract
:1. Introduction

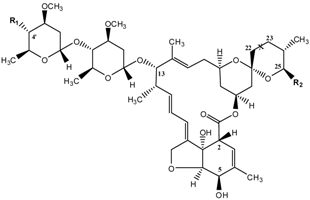
| Substance | Abbreviation | X(C22 – C23) | R1 | R2 |
|---|---|---|---|---|
| Abamectin | ABM | –CH=CH– | OH | CH(CH3)Y b |
| Ivermectin | IVM | –CH2–CH2– | OH | CH(CH3)Y b |
| Eprinomectin | EPR | –CH=CH– | NHC(O)CH3 | CH(CH3)Y b |
| Doramectin | DOR | –CH=CH– | OH | C6H5 |
| Emamectin | EMA | –CH=CH– | NH–CH3 | CH(CH3)Y b |
2. Results and Discussion
2.1. Antigen Synthesis
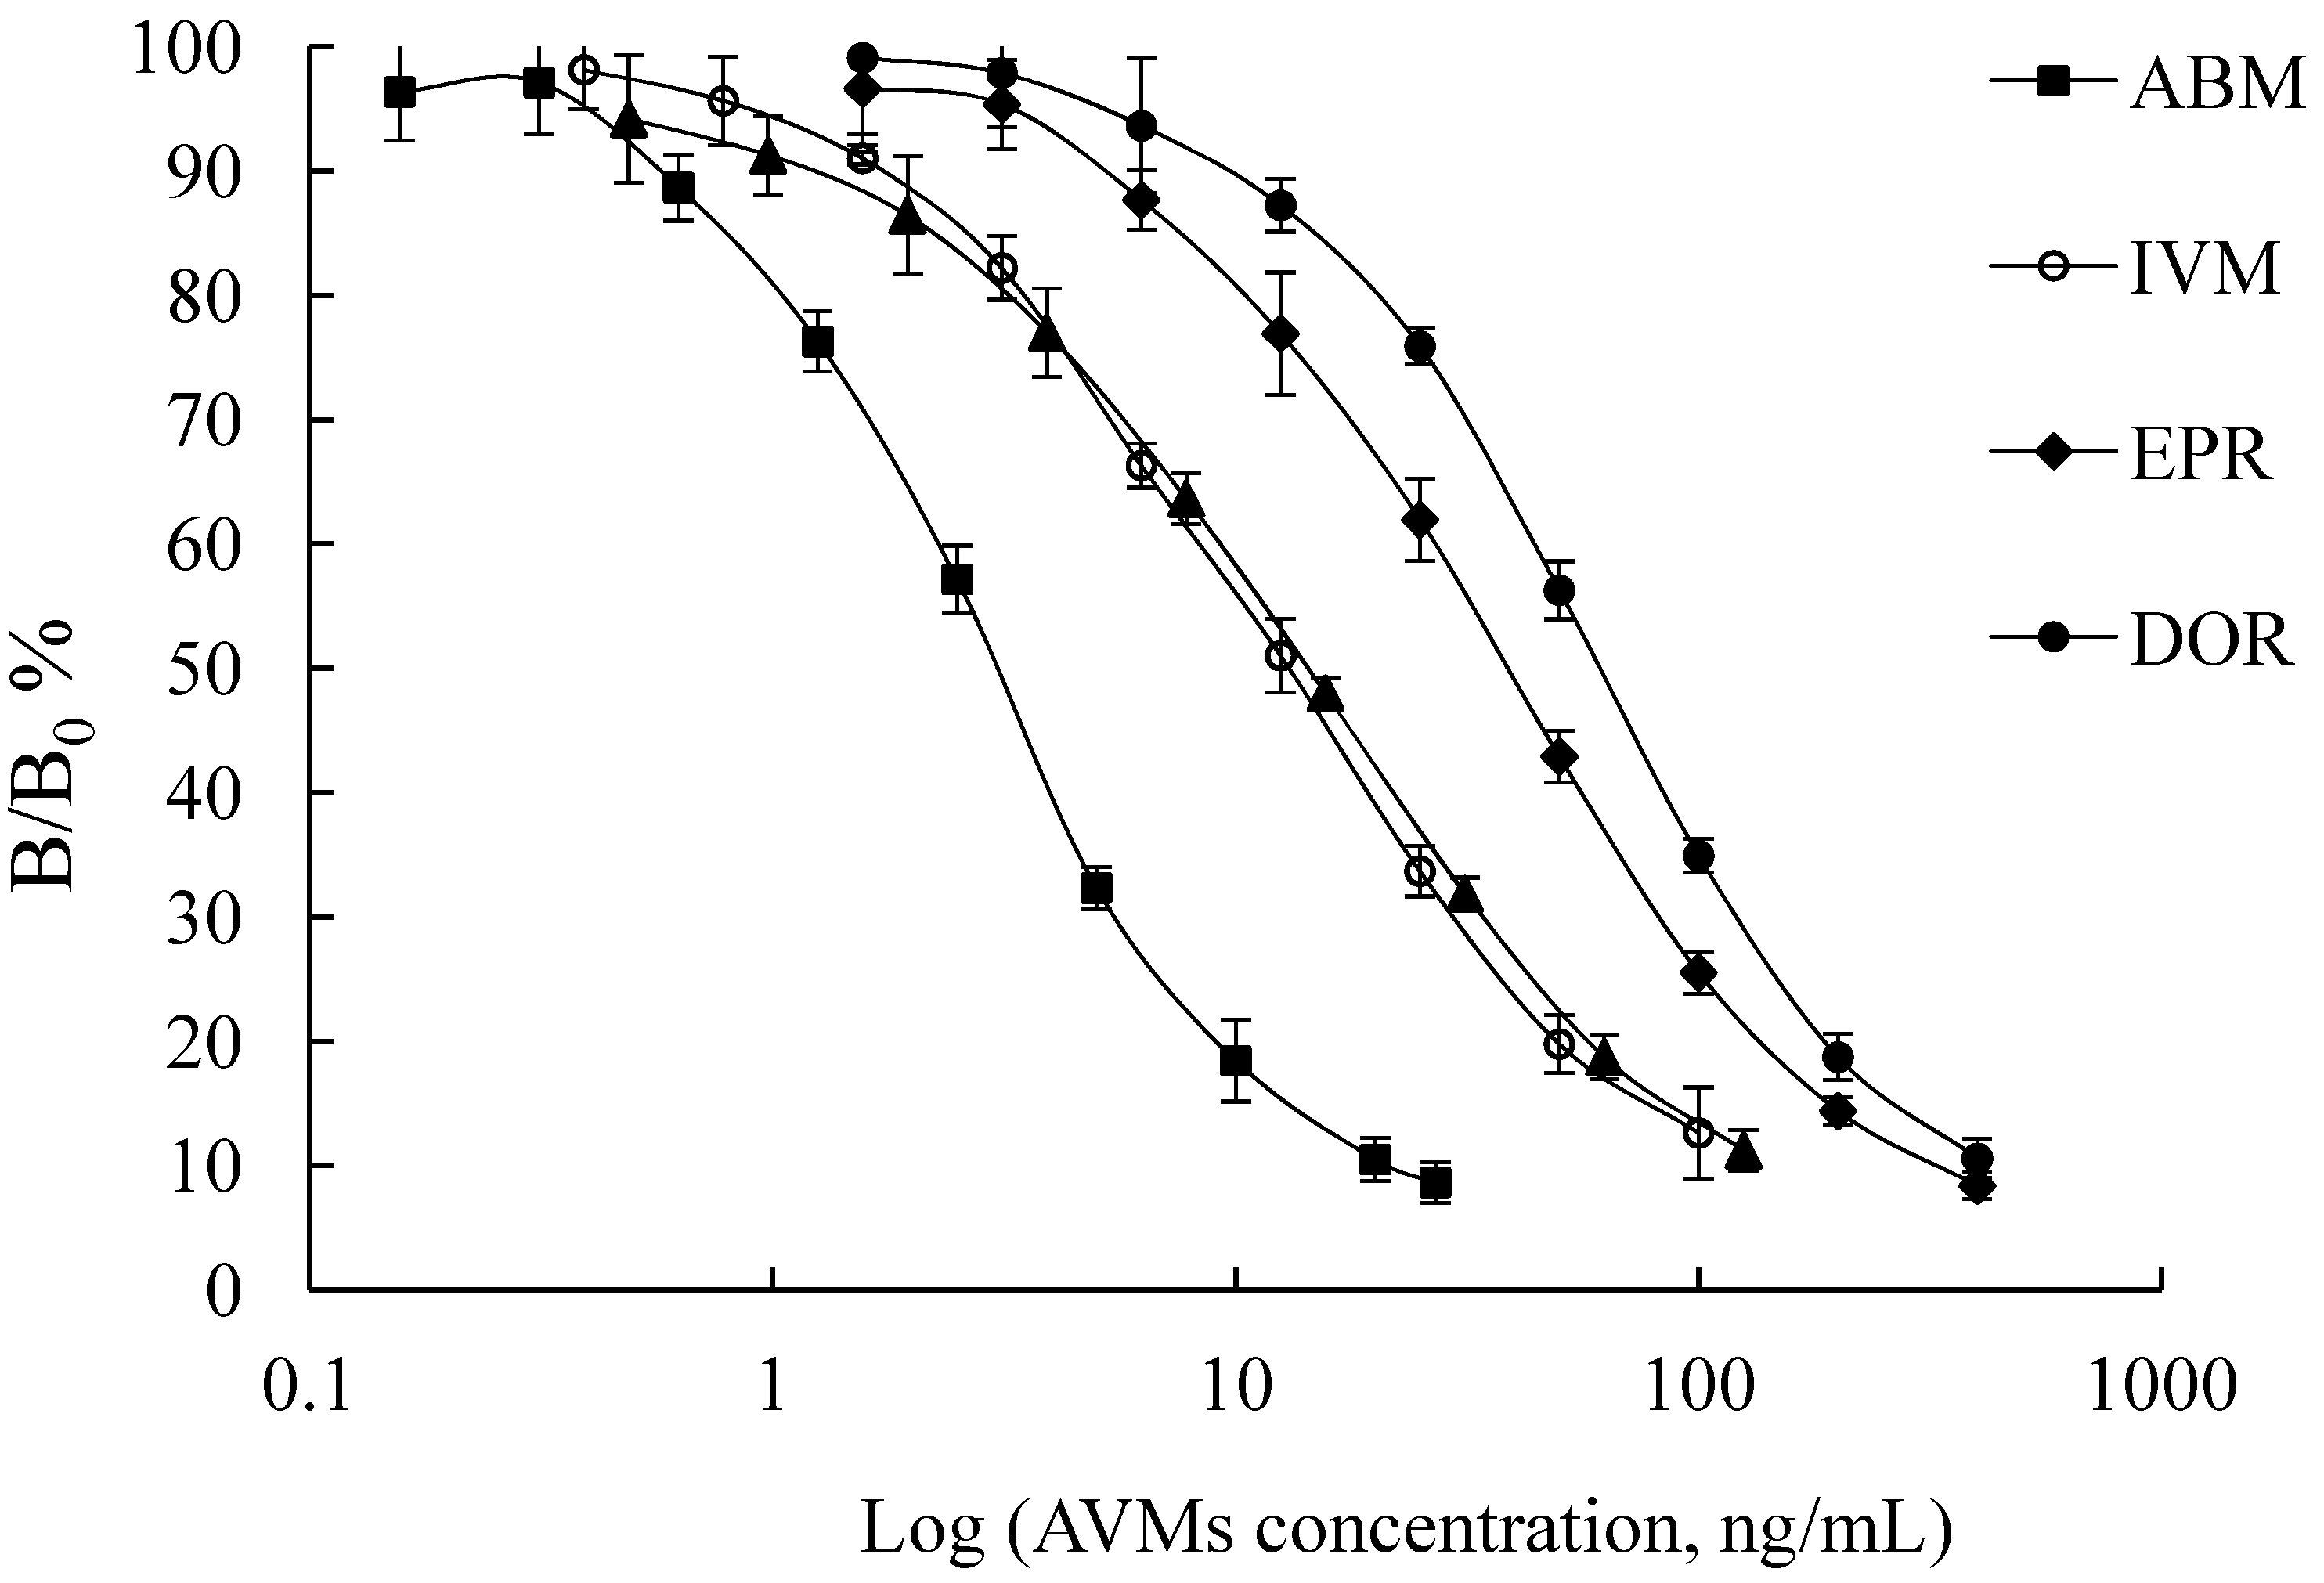
2.2. Mab Production and Characterization
| Mab | Coating antigen | IC50 (ng/mL) | Cross reactivity (%) | |||
|---|---|---|---|---|---|---|
| ABM | IVM | EPR | DOR | EMA benzoate | ||
| 2C11 | 4′- O-succinoyl-ABM-OVA | 45.13 | 50.46 | 14.17 | 19.82 | 47.81 |
| 2C11 | 5-ABM-OVA | 38.97 | 37.69 | 10.33 | 14.55 | 30.66 |
| 2C11 | 5-ABM oxime-OVA | 65.54 | 47.07 | 16.98 | 19.12 | 50.11 |
| 3A9 | 4′- O-succinoyl-ABM-OVA | 50.36 | 26.84 | 7.89 | 21.48 | 25.43 |
| 3A9 | 5-ABM-OVA | 54.31 | 61.20 | 7.11 | 10.86 | 32.75 |
| 3A9 | 5-ABM oxime-OVA | 65.62 | 16.85 | 10.93 | 13.87 | 19.17 |
2.3. Assay Optimization
2.3.1. Assay Buffer
| Mab dilution buffer | Standard preparation buffer | Amaxa (OD450nm) | IC50 (ng/mL) |
|---|---|---|---|
| PBS | PBS | 1.98 | 42.34 |
| PB | PBS | 2.10 | 27.94 |
| PBS | PB | 1.81 | 8.31 |
| PB | PB | 1.78 | 4.82 |
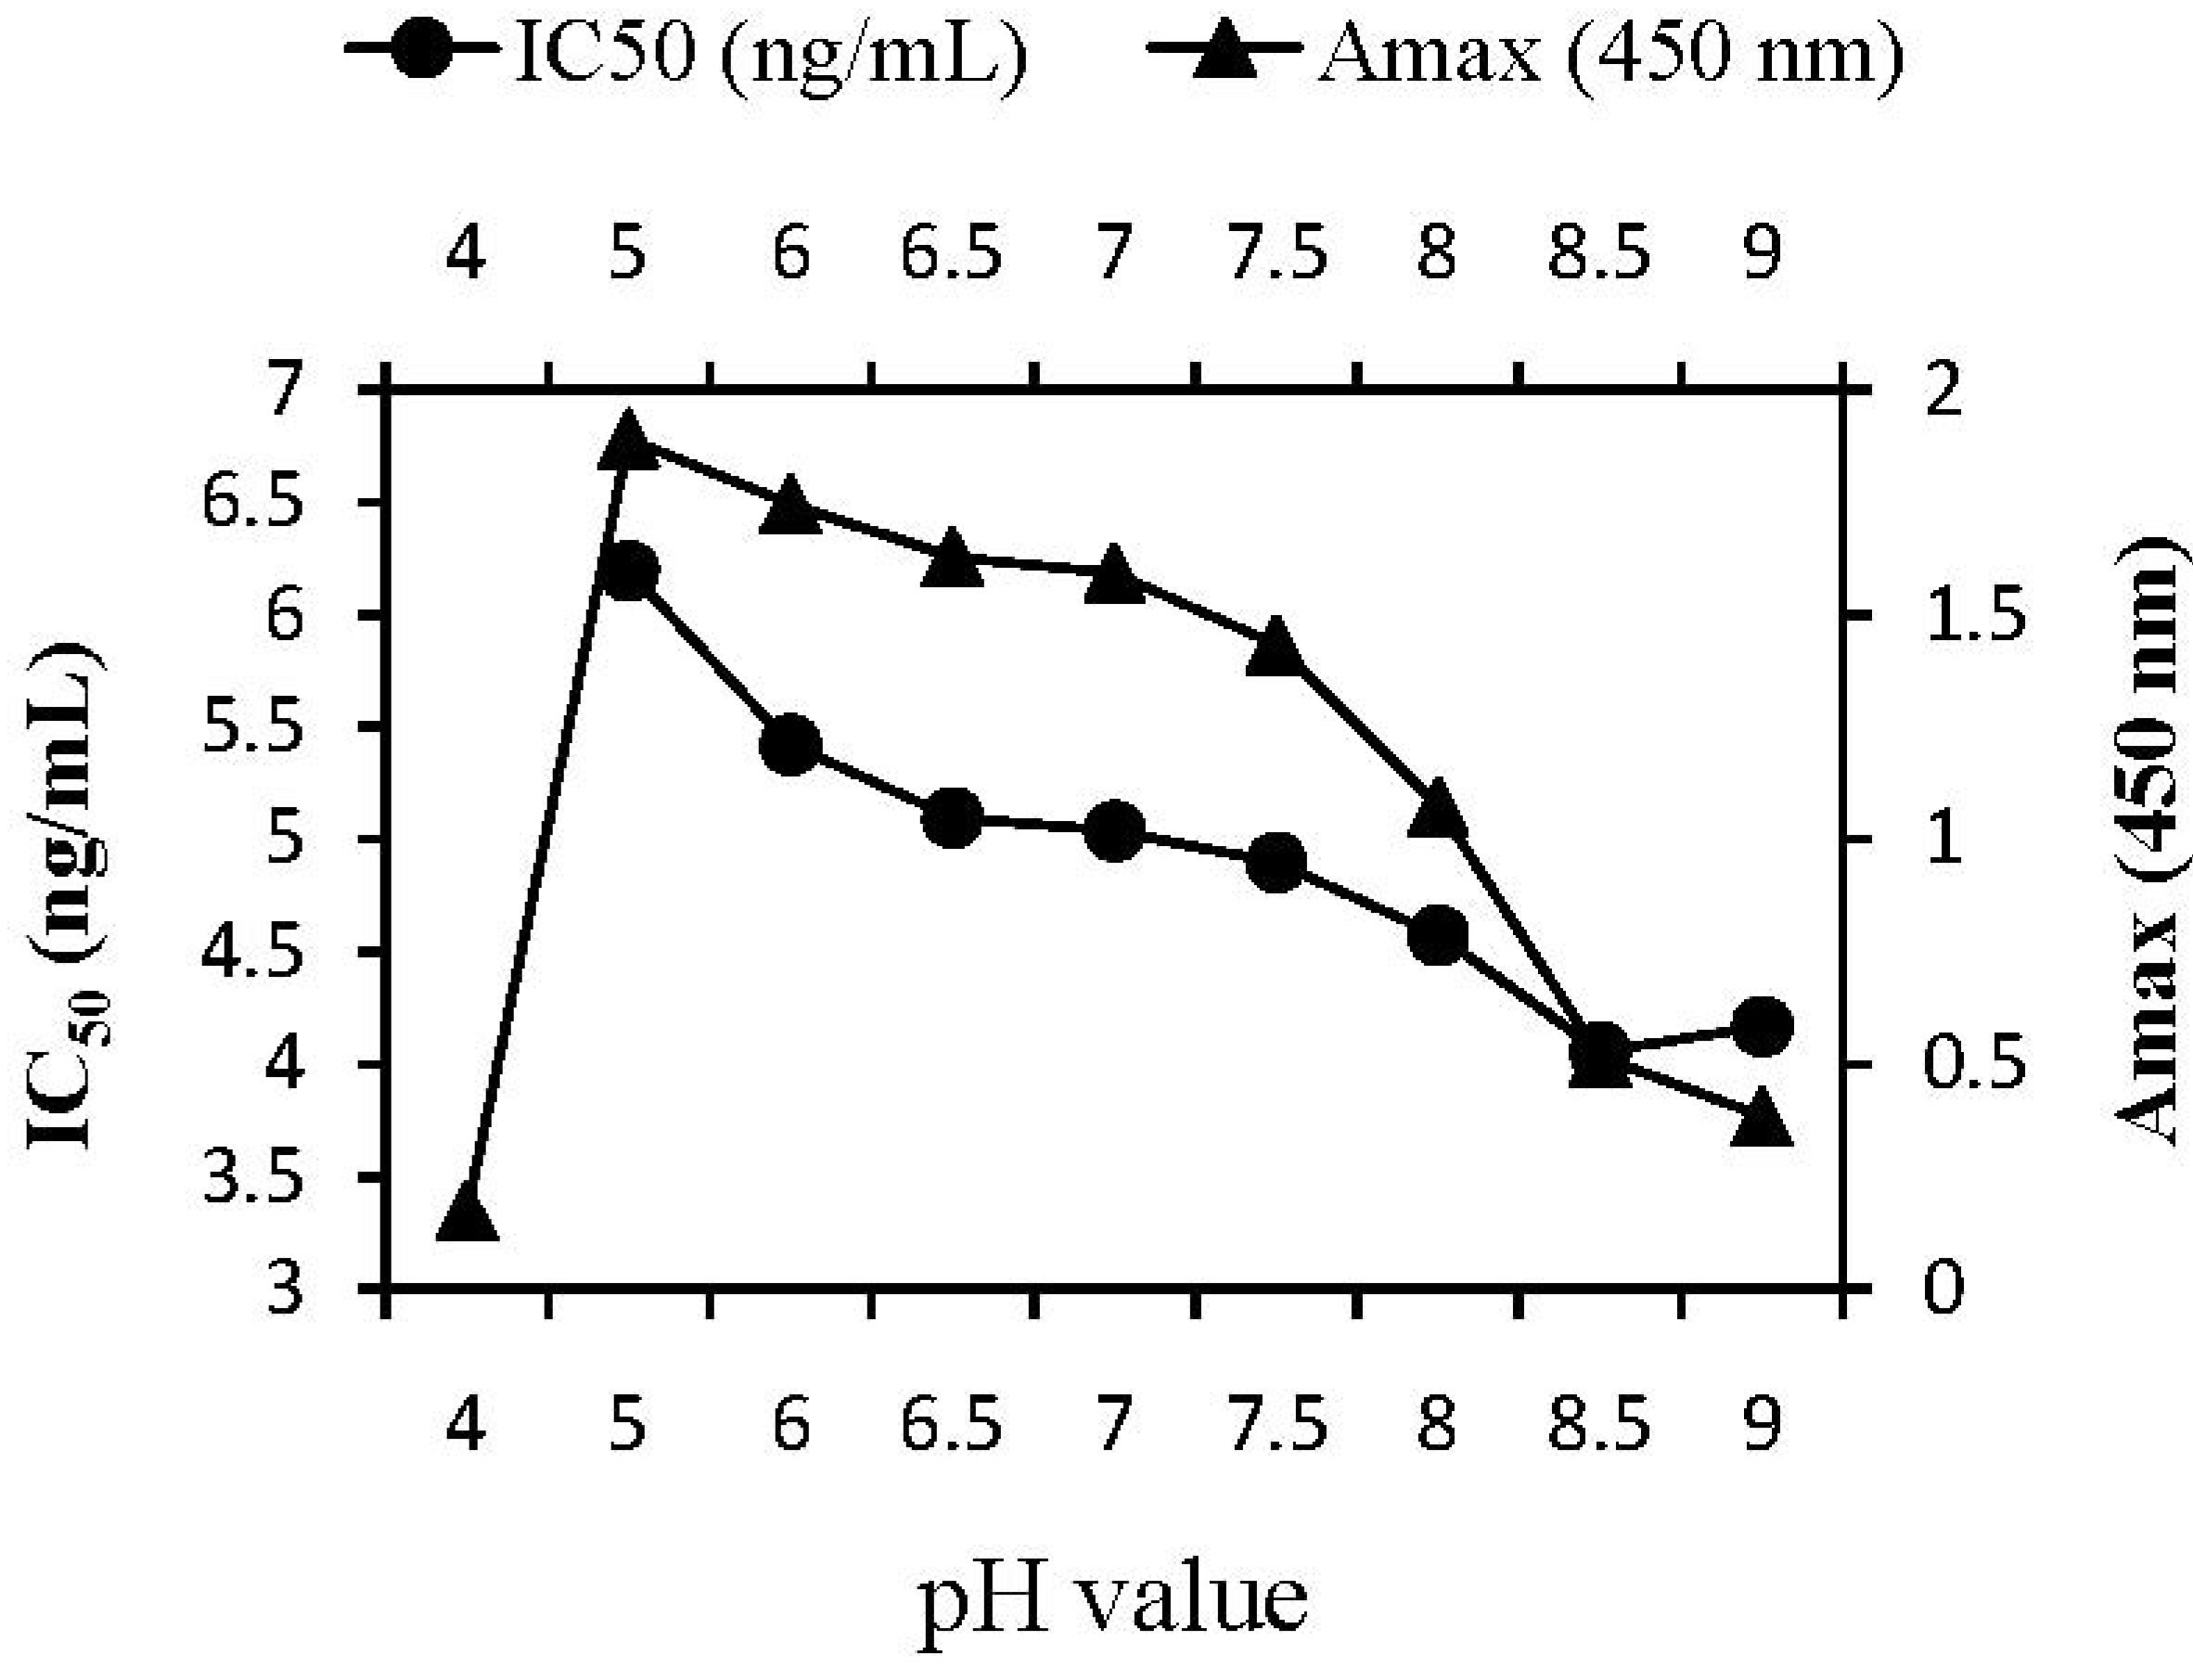
2.3.2. pH Effect

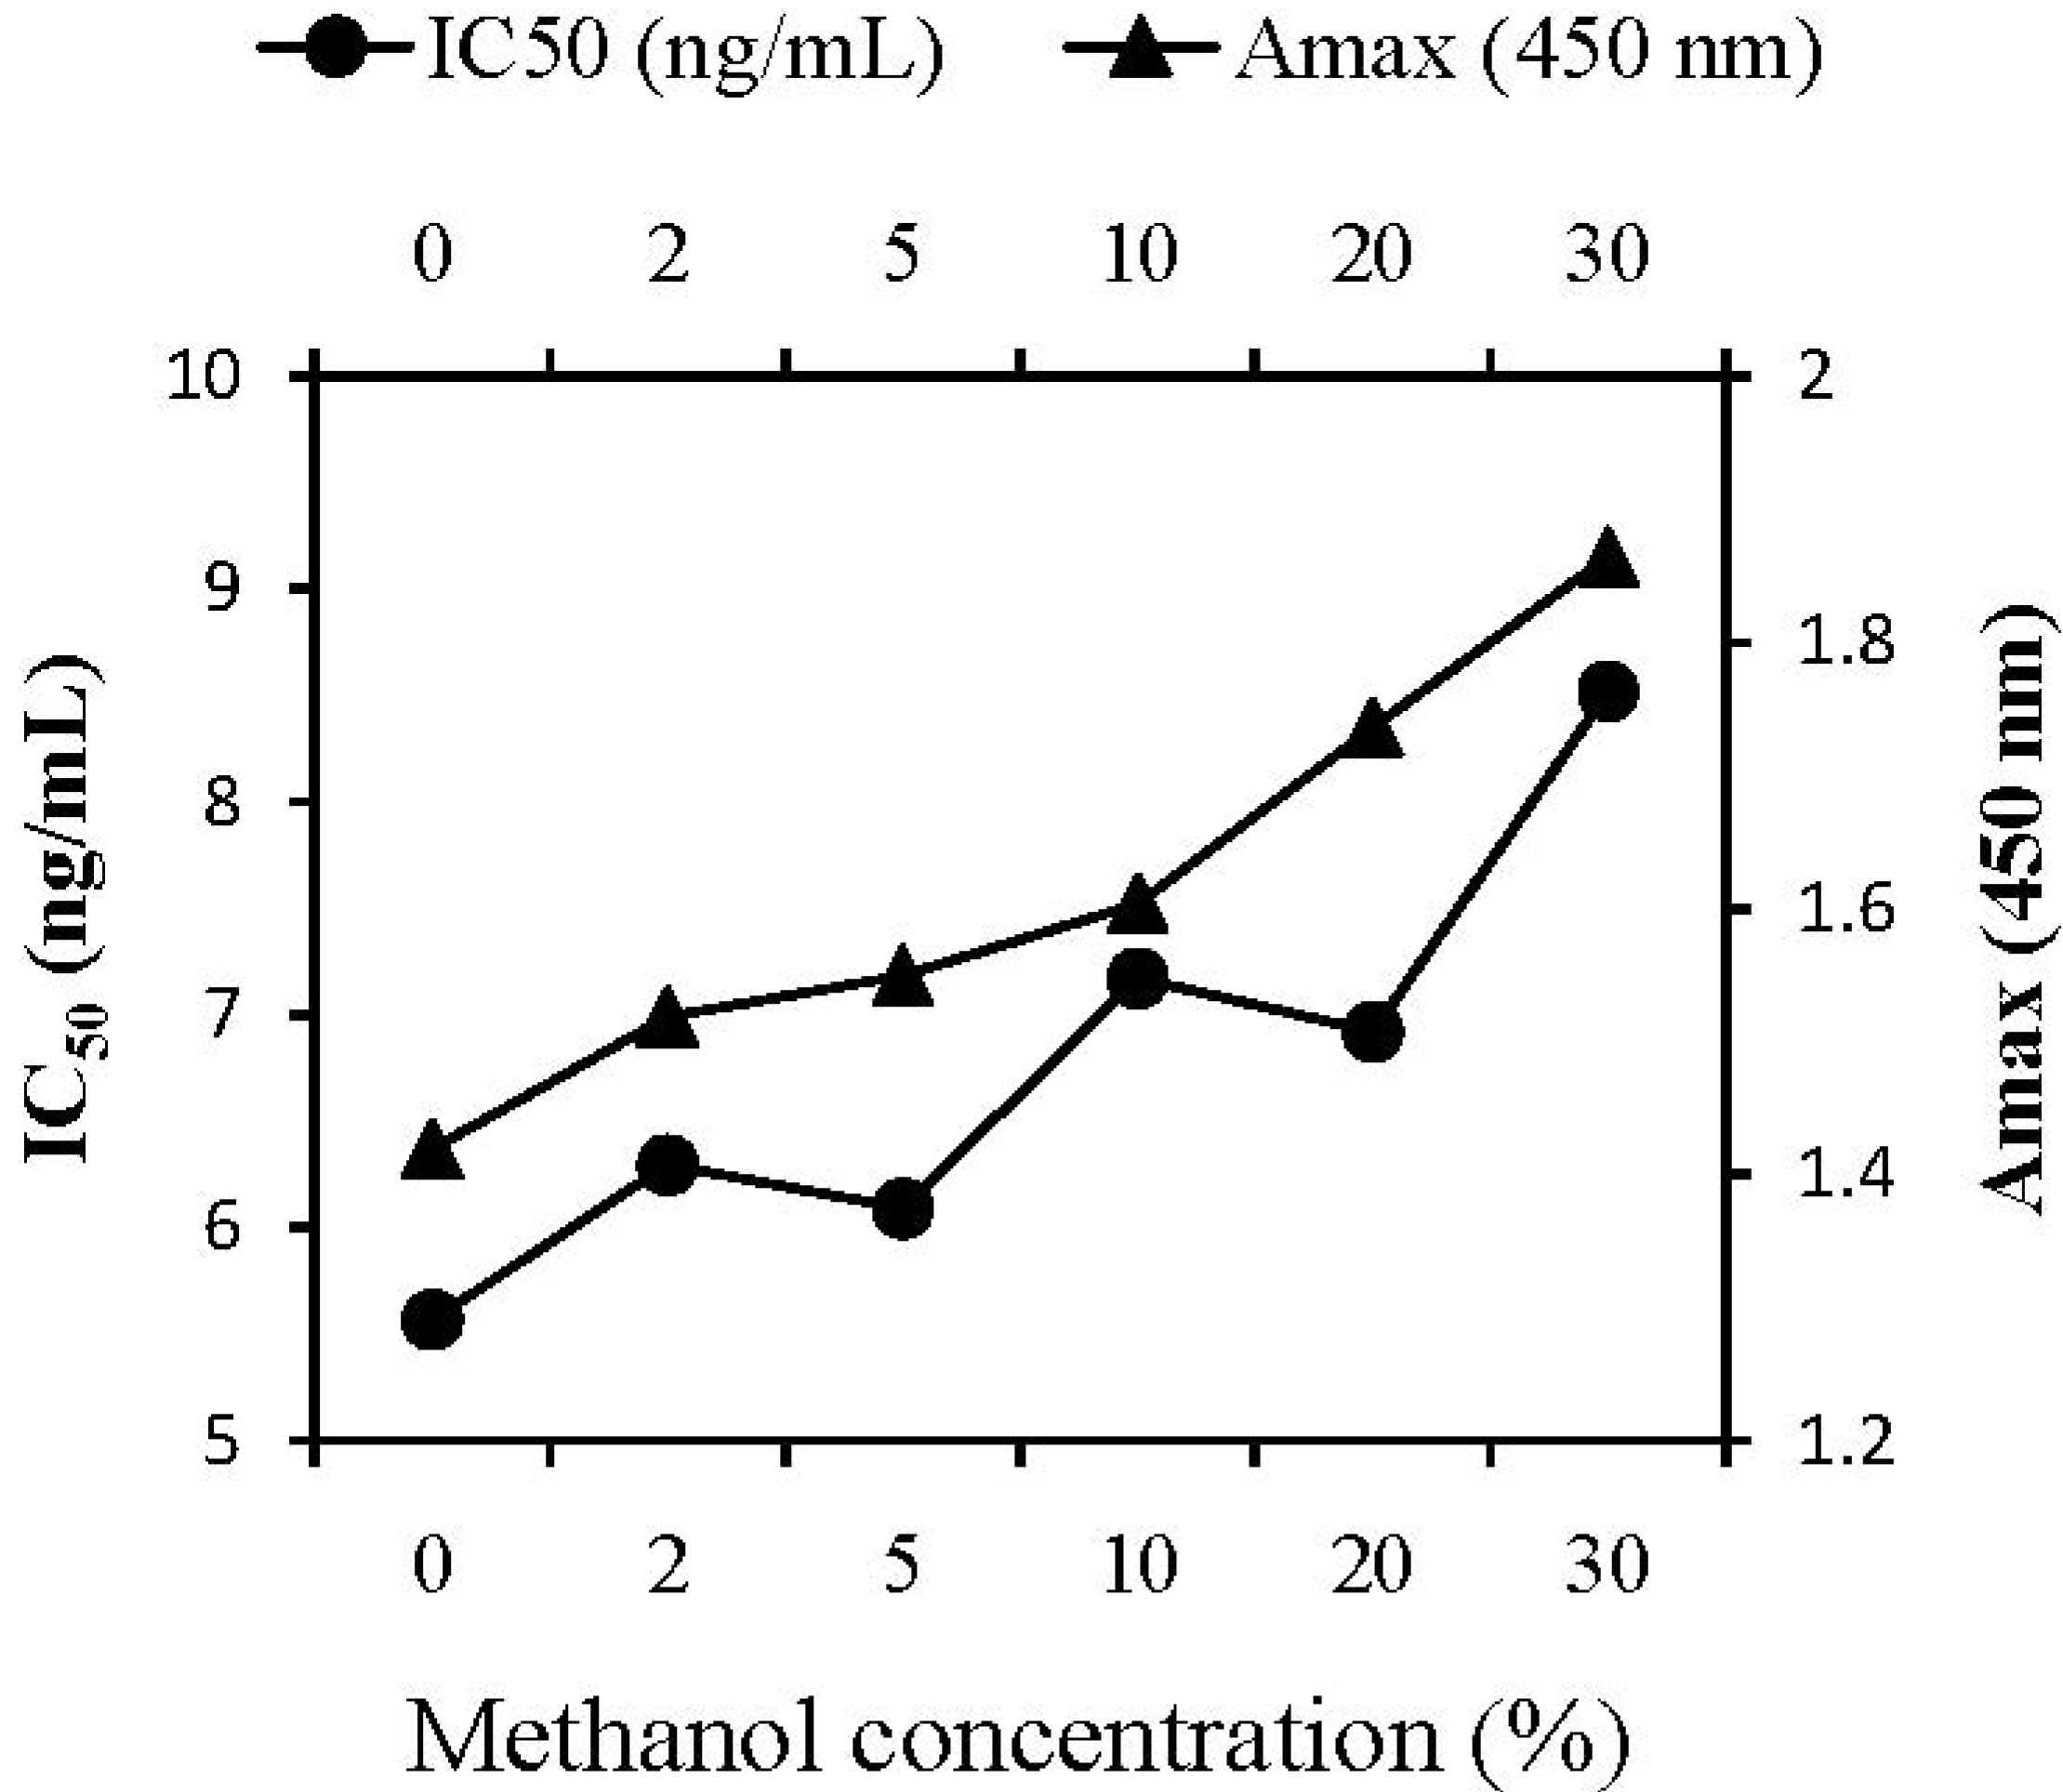
2.3.3. Methanol Concentration
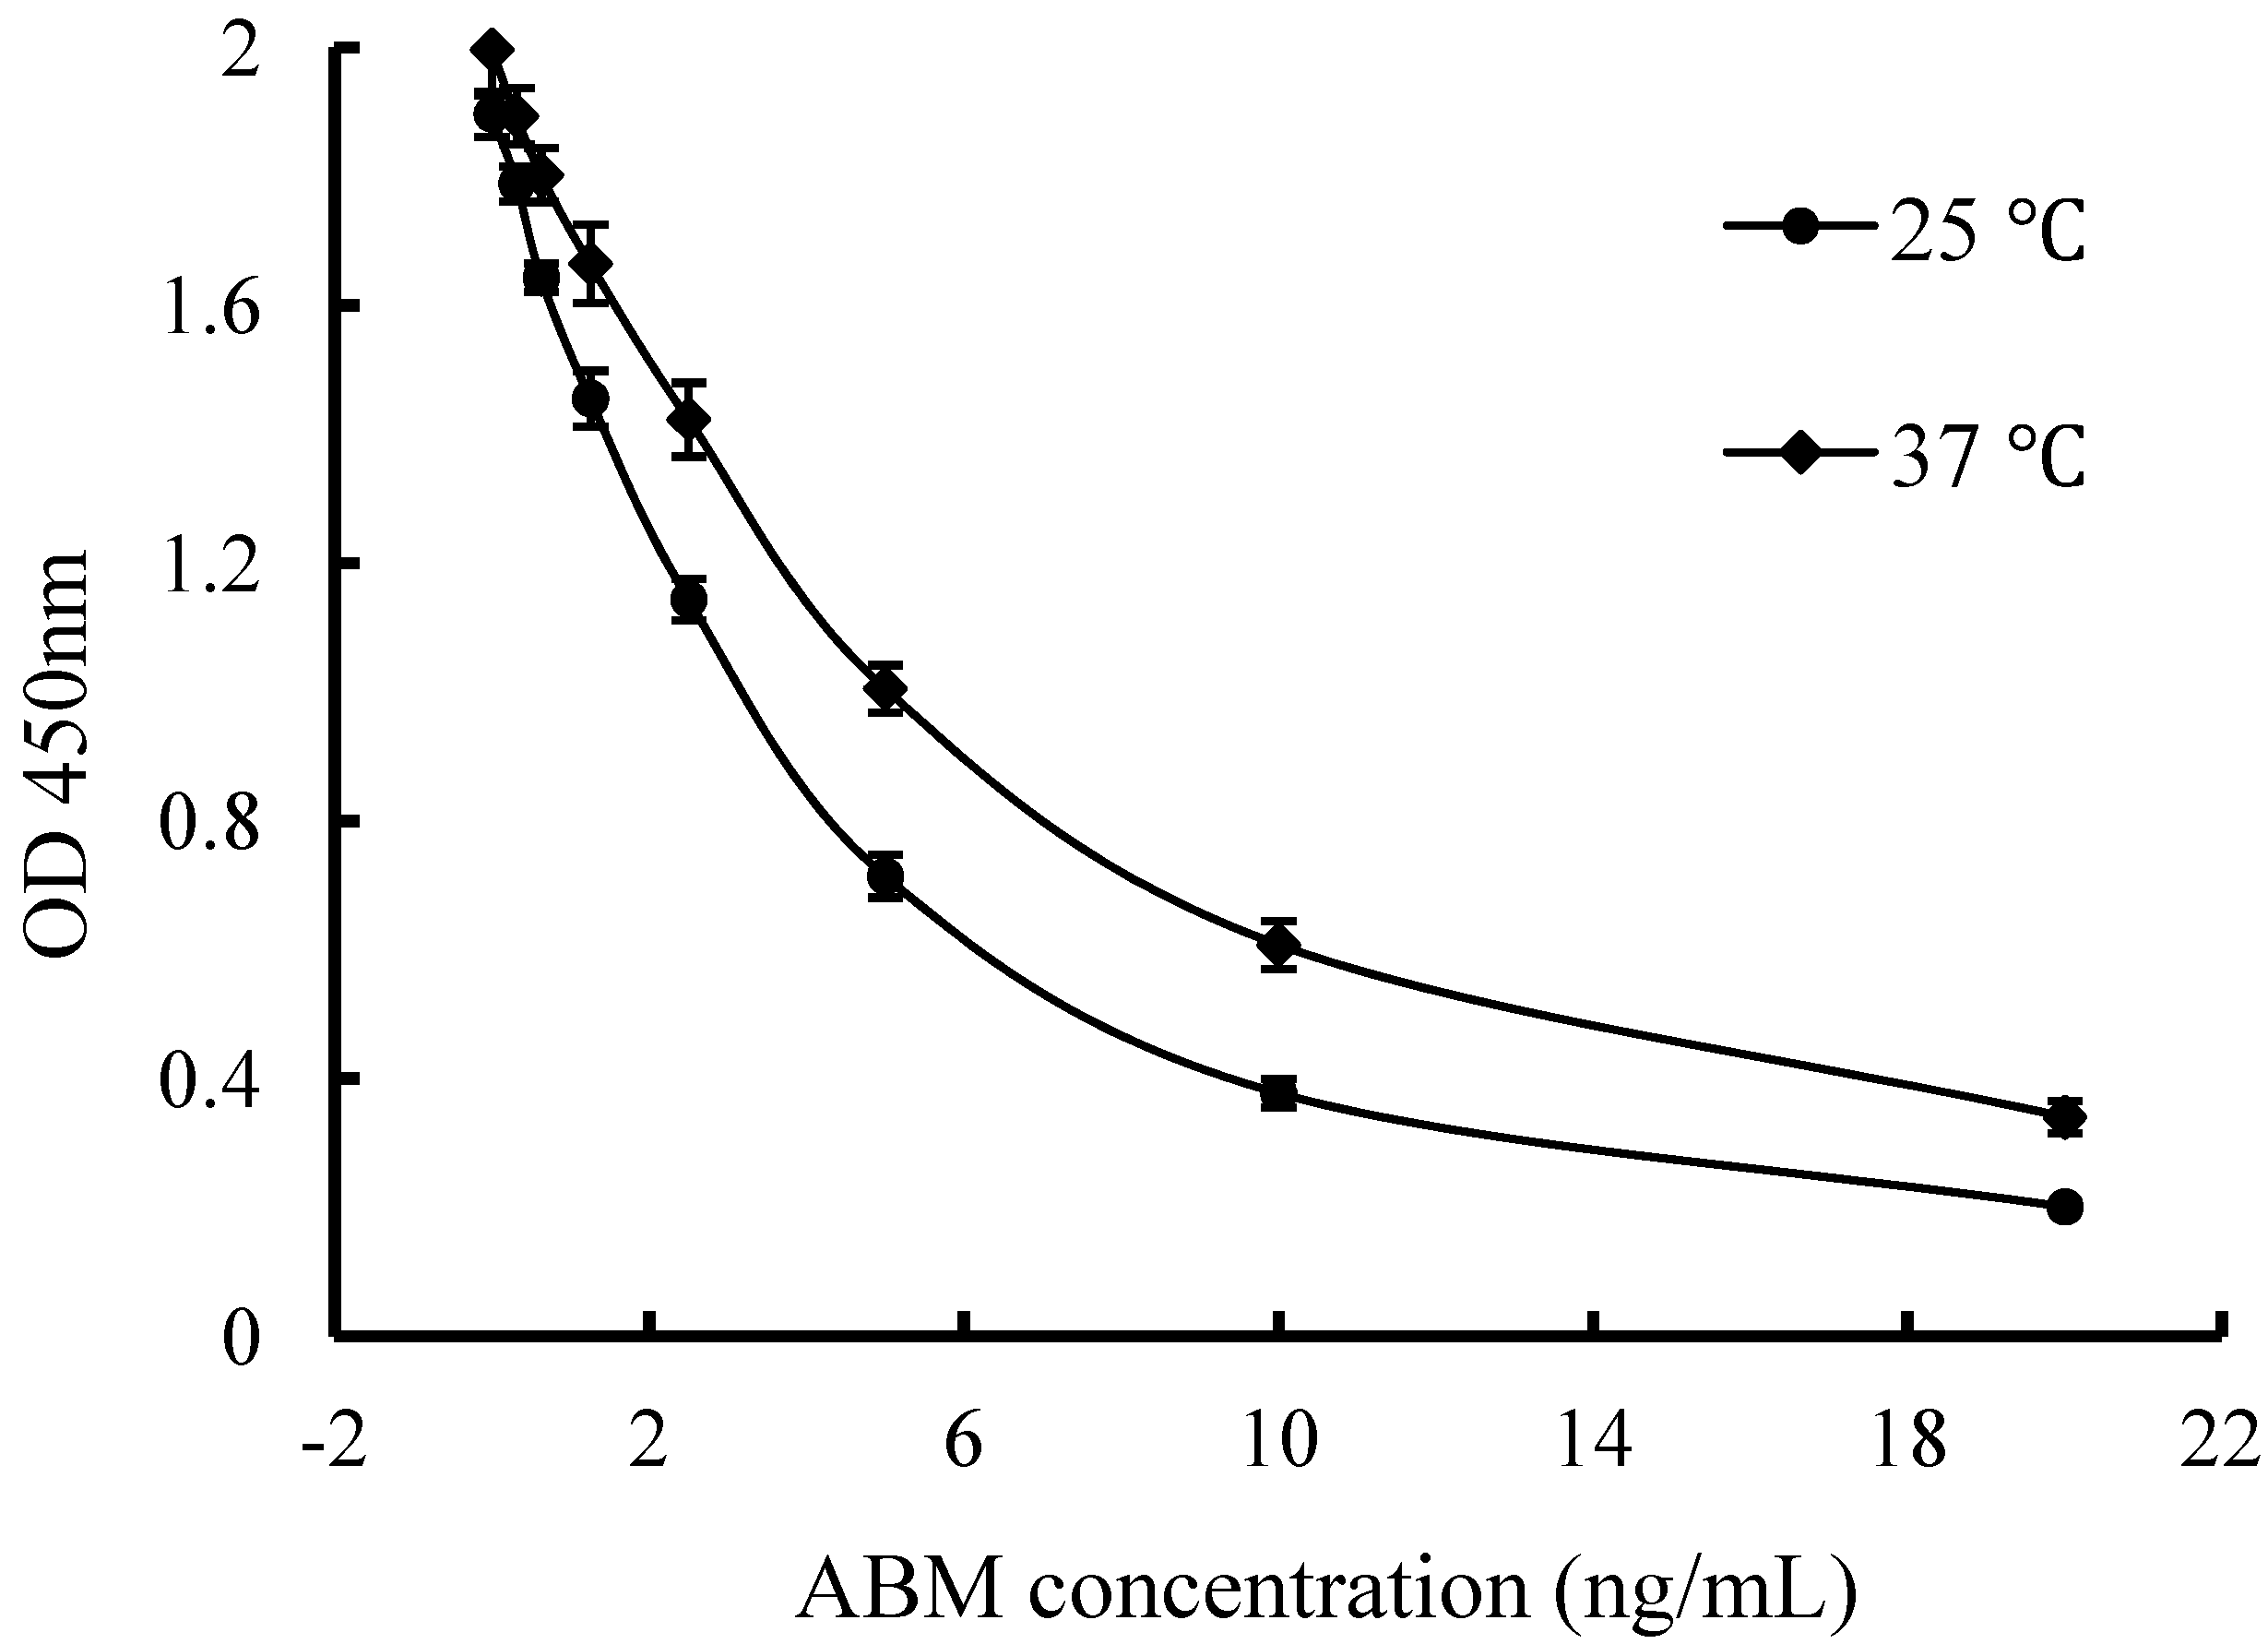
2.3.4. Incubation Temperature


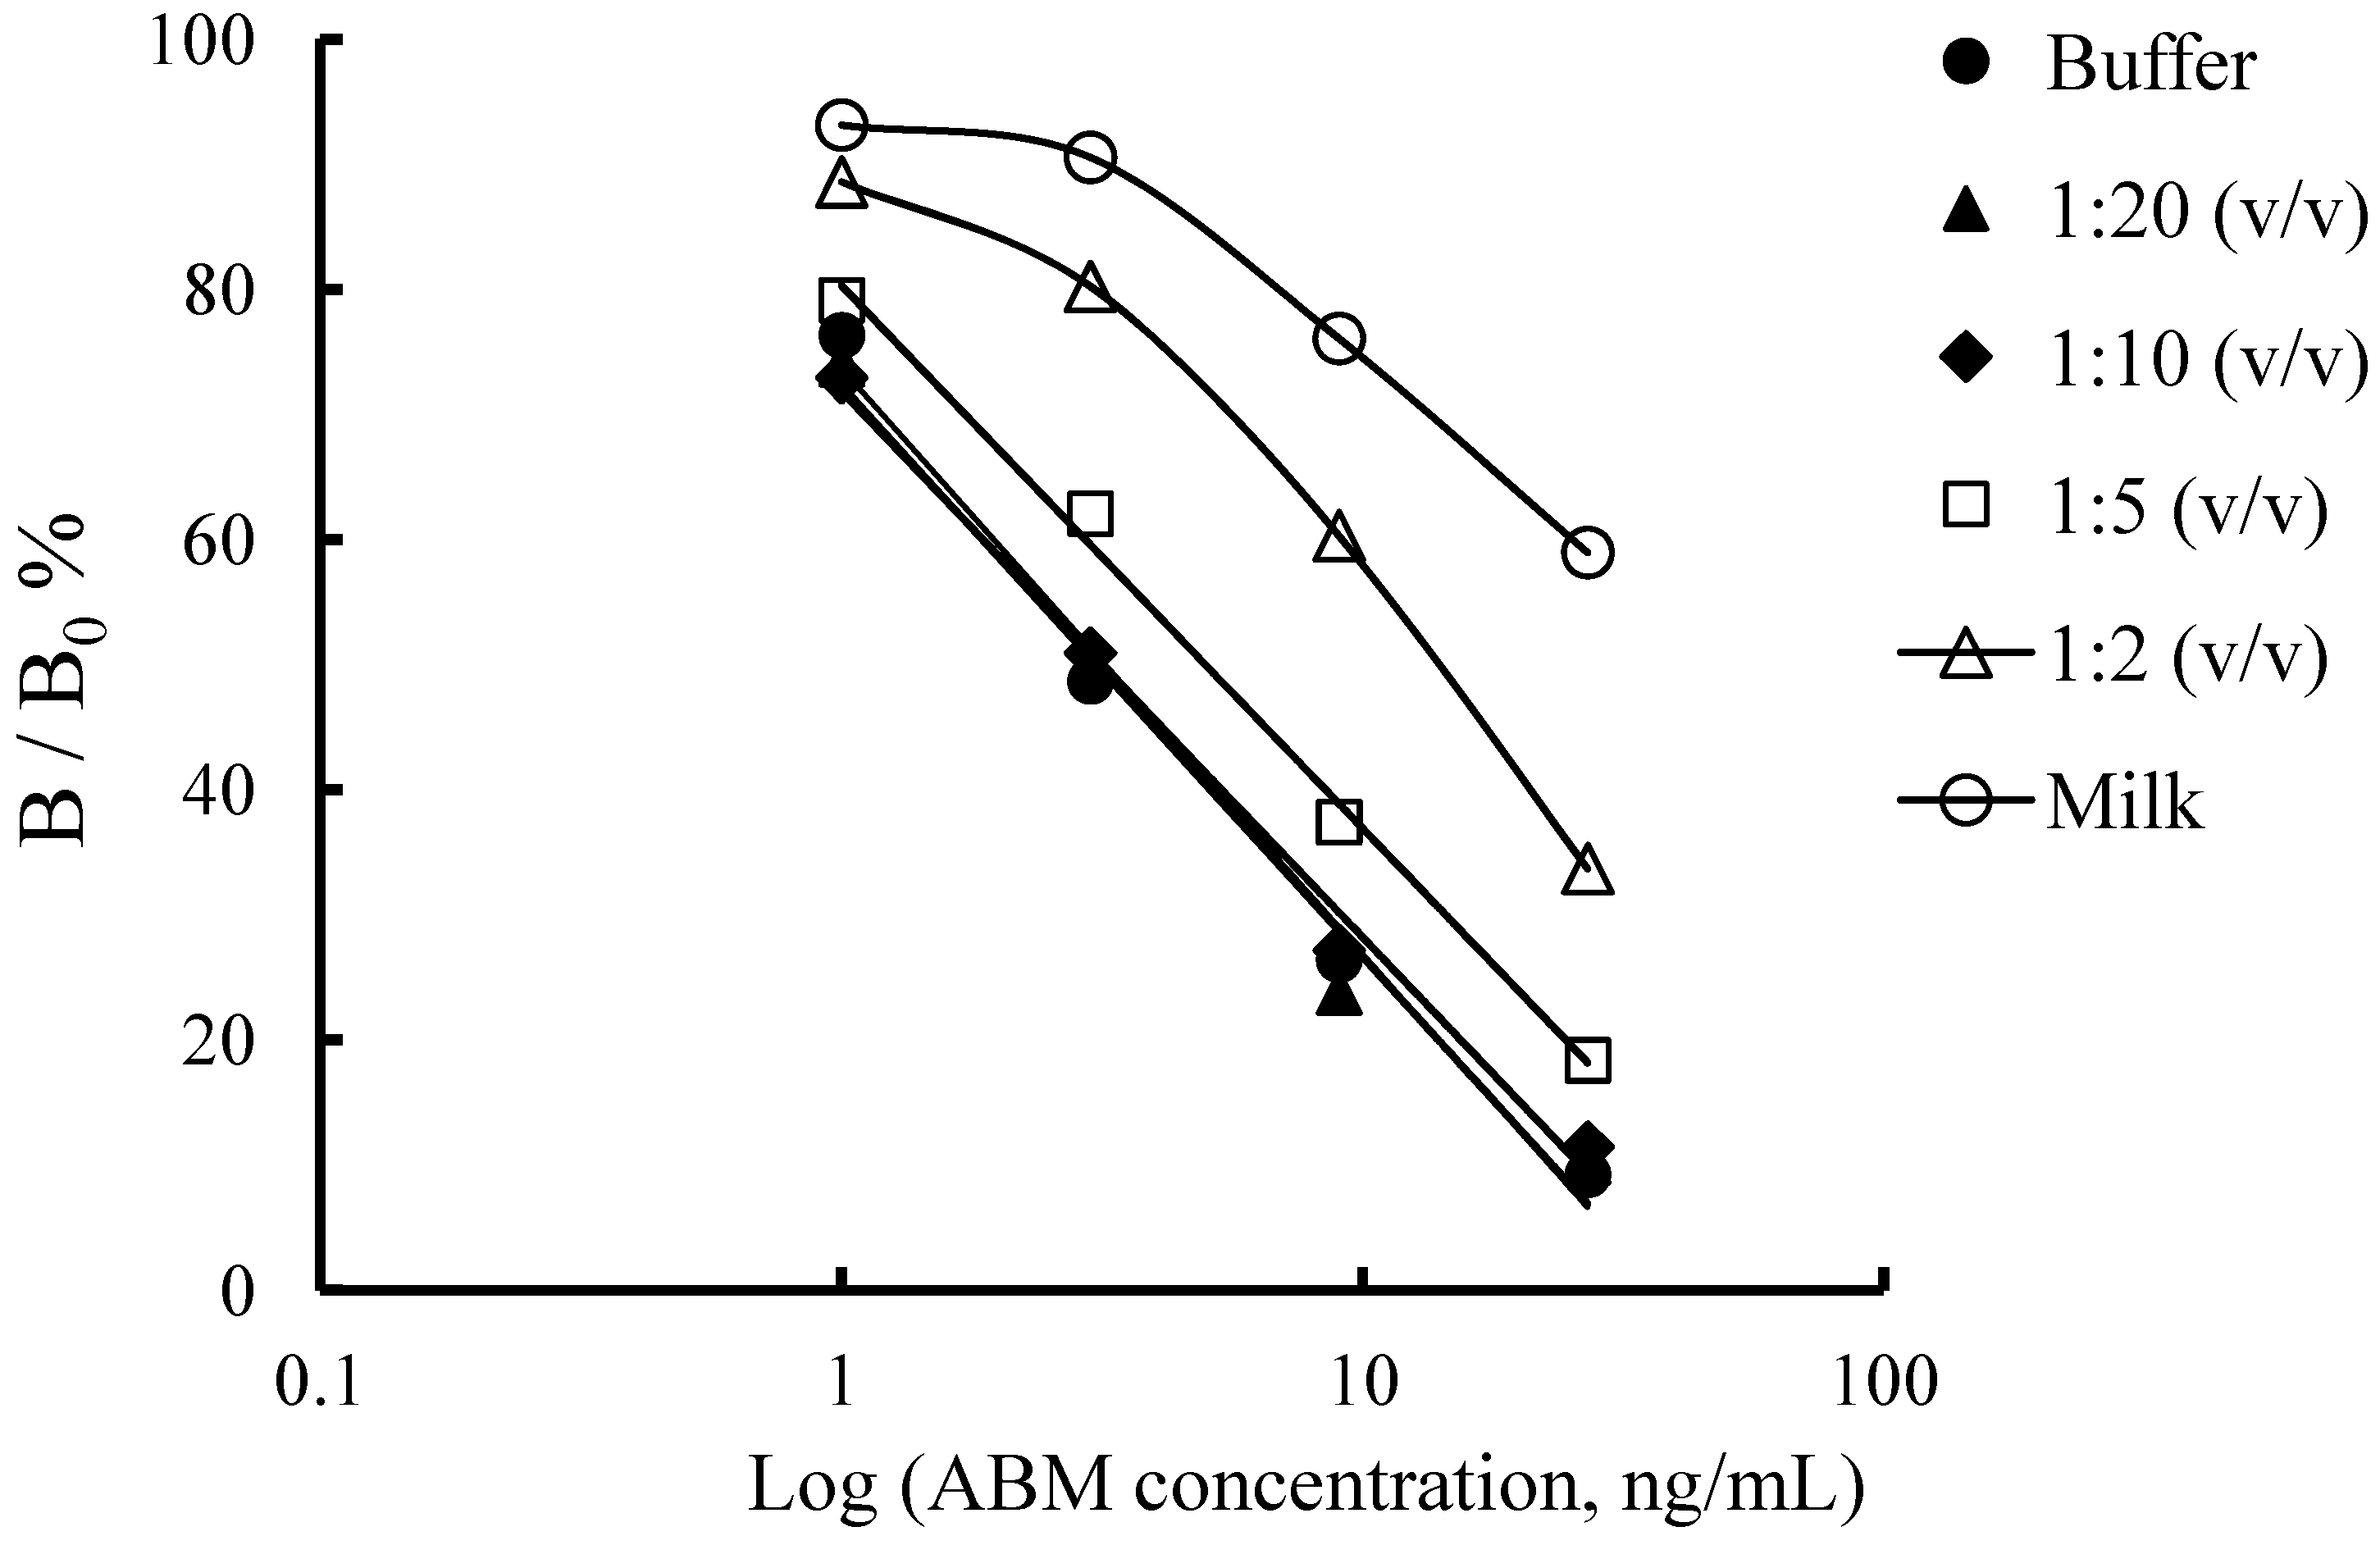
2.4. Milk Analysis
2.4.1. Sample Preparation by Simple Dilution

| Analyte | Spiked (ng/mL) | Intra-assay | Inter-assay | ||
|---|---|---|---|---|---|
| Recovery (%) | CV (%) | Recovery (%) | CV (%) | ||
| ABM | 5 | 83.13 ± 23.07 | 28.32 | 89.65 ± 13.45 | 15.31 |
| 10 | 86.02 ± 8.62 | 10.23 | 74.34 ± 4.66 | 6.40 | |
| IVM | 10 | 121.12 ± 16.90 | 14.24 | 113.75 ± 23.00 | 20.64 |
| 20 | 101.32 ± 12.45 | 12.54 | 69.03 ± 13.26 | 19.61 | |
| EPR | 20 | 88.23 ± 11.94 | 13.81 | 88.16 ± 13.31 | 15.41 |
| 40 | 73.02 ± 4.67 | 6.53 | 104.81 ± 11.27 | 10.97 | |
| DOR | 50 | 94.15 ± 20.55 | 22.28 | 75.53 ± 13.16 | 17.78 |
| 100 | 63.73 ± 5.70 | 9.13 | 69.19 ± 11.29 | 16.65 | |
| EMA benzoate | 15 | 100.50 ± 16.38 | 16.63 | 102.62 ± 9.83 | 9.77 |
| 30 | 104.46 ± 9.52 | 9.30 | 99.33 ± 8.27 | 8.50 | |
2.4.2. Sample Preparation by Solvent Extraction
| Analyte | Spiked (ng/mL) | Intra-assay | Inter-assay | ||
|---|---|---|---|---|---|
| Recovery (%) | CV (%) | Recovery (%) | CV (%) | ||
| ABM | 2 | 106.60 ± 13.00 | 12.44 | 94.92 ± 20.27 | 21.79 |
| 4 | 124.18 ± 8.93 | 7.33 | 112.39 ± 31.28 | 28.40 | |
| IVM | 5 | 114.84 ± 22.83 | 20.29 | 116.95 ± 15.93 | 13.90 |
| 10 | 75.00 ± 16.57 | 22.55 | 95.72 ± 19.59 | 20.89 | |
| EPR | 10 | 87.50 ± 13.26 | 15.46 | 69.05 ± 8.22 | 12.15 |
| 20 | 117.49 ± 14.55 | 12.64 | 84.19 ± 12.16 | 14.74 | |
| DOR | 15 | 130.89 ± 13.56 | 10.57 | 85.58 ± 21.56 | 25.70 |
| 30 | 106.60 ± 7.39 | 7.08 | 106.88 ± 13.92 | 13.29 | |
| EMA benzoate | 5 | 98.14 ± 14.50 | 15.07 | 100.71 ± 18.98 | 19.23 |
| 10 | 92.01 ± 24.91 | 27.63 | 114.28 ± 12.91 | 11.52 | |
3. Experimental
3.1. Reagents
3.2. Instrumentation
3.3. Buffers
3.4. Immunogen and Coating Antigens
3.5. Mab Production and Characterization

3.6. Competitive Indirect ELISA
3.7. ELISA Optimization
3.8. Milk Analysis
4. Conclusions
Acknowledgments
References
- Faske, T.; Starr, J. Sensitivity of Meloidogyne incognita and Rotylenchulus reniformis to abamectin. J. Nematol. 2006, 38, 240–244. [Google Scholar]
- Maximum Residue Limits for Veterinary Drugs in Foods Updated as at the 34th Session of the Codex Alimentarius Commission; 34th Session; Codex Alimentarius Commission, 2011.
- Maximum Residue Limits for Veterinary Drugs in Foods (in Chinese); 235th Bulletin; Ministry of Agriculture of China: Beijing, China, 2002.
- Giannetti, L.; Giorgi, A.; Necci, F.; Ferretti, G.; Buiarelli, F.; Neri, B. Validation study on avermectine residues in foodstuffs. Anal. Chim. Acta 2011, 700, 11–15. [Google Scholar] [CrossRef]
- Hou, X.L.; Li, X.W.; Ding, S.Y.; He, J.H.; Jiang, H.Y.; Shen, J.Z. Simultaneous analysis of avermectins in bovine tissues by LC-MS-MS with immunoaffinity chromatography cleanup. Chromatographia 2006, 63, 543–550. [Google Scholar] [CrossRef]
- Danaher, M.; Howells, L.C.; Crooks, S.R.H.; Cerkvenik-Flajs, V.; O’Keeffe, M. Review of methodology for the determination of macrocyclic lactone residues in biological matrices. J. Chromatogr. B 2006, 844, 175–203. [Google Scholar] [CrossRef]
- He, J.H.; Hou, X.L.; Jiang, H.Y.; Shen, J.Z. Multiresidue analysis of avermectins in bovine liver by immunoaffinity column cleanup procedure and liquid chromatography with fluorescence detector. J. AOAC Int. 2005, 88, 1099–1103. [Google Scholar]
- Hennion, M.C.; Barcelo, D. Strengths and limitations of immunoassays for effective and efficient use for pesticide analysis in water samples: A review. Anal. Chim. Acta 1998, 362, 3–34. [Google Scholar] [CrossRef]
- Piao, Y.; Kim, Y.; Kim, Y.; Lee, H.; Hammock, B.; Lee, Y. Development of ELISAs for the class-specific determination of organophosphorus pesticides. J. Agric. Food Chem. 2009, 57, 10004–10013. [Google Scholar] [CrossRef]
- Mitsui, Y.; Tanimori, H.; Kitagawa, T.; Fujimaki, Y.; Aoki, Y. Simple and sensitive enzyme-linked immunosorbent assay for ivermectin. Am. J. Trop. Med. Hyg. 1996, 54, 243–248. [Google Scholar]
- Crooks, S.R.H.; Ross, P.; Thompson, C.S.; Haggan, S.A.; Elliott, C.T. Detection of unwanted residues of ivermectin in bovine milk by dissociation-enhanced lanthanide fluoroimmunoassay. Luminescence 2000, 15, 371–376. [Google Scholar] [CrossRef]
- Samsonova, J.V.; Baxter, G.A.; Crooks, S.R.H.; Elliott, C.T. Biosensor immunoassay of ivermectin in bovine milk. J. AOAC Int. 2002, 85, 879–882. [Google Scholar]
- Samsonova, J.V.; Baxter, G.A.; Crooks, S.R.H.; Small, A.E.; Elliott, C.T. Determination of ivermectin in bovine liver by optical immunobiosensor. Biosens. Bioelectron. 2002, 17, 523–529. [Google Scholar] [CrossRef]
- Crooks, S.R.H.; Baxter, A.G.; Traynor, I.M.; Elliott, C.T.; McCaughey, W.J. Detection of ivermectin residues in bovine liver using an enzyme immunoassay. Analyst 1998, 123, 355–358. [Google Scholar] [CrossRef]
- Wen, S.; Zhang, X.; Liu, Y.; Zhang, Q.; Liu, X.J.; Liang, J.S. Selection of a single chain variable fragment antibody against ivermectin from a phage displayed library. J. Agric. Food Chem. 2010, 58, 5387–5391. [Google Scholar] [CrossRef]
- Xu, S.W.; Li, S.; Sun, D.B.; Guo, D.H. Preparation and characterization of monoclonal antibodies against avermectin. Hybridoma 2009, 28, 173–176. [Google Scholar] [CrossRef]
- Schmidt, D.J.; Clarkson, C.E.; Swanson, T.A.; Egger, M.L.; Carlson, R.E.; Van Emon, J.M.; Karu, A.E. Monoclonal antibodies for immunoassay of avermectins. J. Agric. Food Chem. 1990, 38, 1763–1770. [Google Scholar] [CrossRef]
- Shi, W.M.; He, J.H.; Jiang, H.Y.; Hou, X.L.; Yang, J.H.; Shen, J.Z. Determination of multiresidue of avermectins in bovine liver by an indirect competitive ELISA. J. Agric. Food Chem. 2006, 54, 6143–6146. [Google Scholar] [CrossRef]
- Wang, C.M.; Liu, Y.H.; Guo, Y.R.; Liang, C.Z.; Li, X.B.; Zhu, G.N. Development of a McAb-based immunoassay for parathion and influence of the competitor structure. Food Chem. 2009, 115, 365–370. [Google Scholar] [CrossRef]
- Svendsen, L.; Crowley, A.; Ostergaard, L.H.; Stodulski, G.; Hau, J. Development and comparison of purification strategies for chicken antibodies from egg-yolk. Lab. Anim. Sci. 1995, 45, 89–93. [Google Scholar]
- Brun, E.M.; Garces-Garcia, M.; Puchades, R.; Maquieira, A.N. Highly sensitive enzyme-linked immunosorbent assay for chlorpyrifos. Application to olive oil analysis. 2005, 53, 9352–9360. [Google Scholar]
- Abad, A.; Moreno, M.J.; Montoya, A. Development of monoclonal antibody-based immunoassays to the N-methylcarbamate pesticide carbofuran. J. Agric. Food Chem. 1999, 47, 2475–2485. [Google Scholar] [CrossRef]
- Gui, W.J.; Liu, Y.H.; Wang, C.M.; Liang, X.; Zhu, G.N. Development of a direct competitive enzyme-linked immunosorbent assay for parathion residue in food samples. Anal. Biochem. 2009, 393, 88–94. [Google Scholar] [CrossRef]
- Lee, J.K.; Ahn, K.C.; Park, O.S.; Kang, S.Y.; Hammock, B.D. Development of an ELISA for the detection of the residues of the insecticide imidacloprid in agricultural and environmental samples. J. Agric. Food Chem. 2001, 49, 2159–2167. [Google Scholar] [CrossRef]
- Liang, C.Z.; Jin, R.Y.; Gui, W.J.; Zhu, G.N. Enzyme-linked immunosorbent assay based on a monoclonal antibody for the detection of the insecticide triazophos: Assay optimization and application to environmental samples. Environ. Sci. Technol. 2007, 41, 6783–6788. [Google Scholar] [CrossRef]
- Kim, Y.J.; Kim, Y.A.; Lee, Y.T.; Lee, H.S. Enzyme-linked immunosorbent assays for the insecticide fenitrothion—Influence of hapten conformation and sample matrix on assay performance. Anal. Chim. Acta 2007, 591, 183–190. [Google Scholar] [CrossRef]
- Sample Availability: Not available.
© 2012 by the authors; licensee MDPI, Basel, Switzerland. This article is an open-access article distributed under the terms and conditions of the Creative Commons Attribution license (http://creativecommons.org/licenses/by/3.0/).
Share and Cite
Wang, C.; Wang, Z.; Jiang, W.; Mi, T.; Shen, J. A Monoclonal Antibody-Based ELISA for Multiresidue Determination of Avermectins in Milk. Molecules 2012, 17, 7401-7414. https://doi.org/10.3390/molecules17067401
Wang C, Wang Z, Jiang W, Mi T, Shen J. A Monoclonal Antibody-Based ELISA for Multiresidue Determination of Avermectins in Milk. Molecules. 2012; 17(6):7401-7414. https://doi.org/10.3390/molecules17067401
Chicago/Turabian StyleWang, Chunmei, Zhanhui Wang, Wenxiao Jiang, Tiejun Mi, and Jianzhong Shen. 2012. "A Monoclonal Antibody-Based ELISA for Multiresidue Determination of Avermectins in Milk" Molecules 17, no. 6: 7401-7414. https://doi.org/10.3390/molecules17067401