2.1. Analysis of the Reduced Models of the Protein-Ligand Complexes
As stated before, in order to calculate the steric and electrostatic interaction energies of each of the 74 protein-ligand complexes, we considered only the 53 residues in a radius of 10 Å (reduced model complex), defined from the ligand, as follows, in accordance with the subunit to which they belong (
Figure 4A):
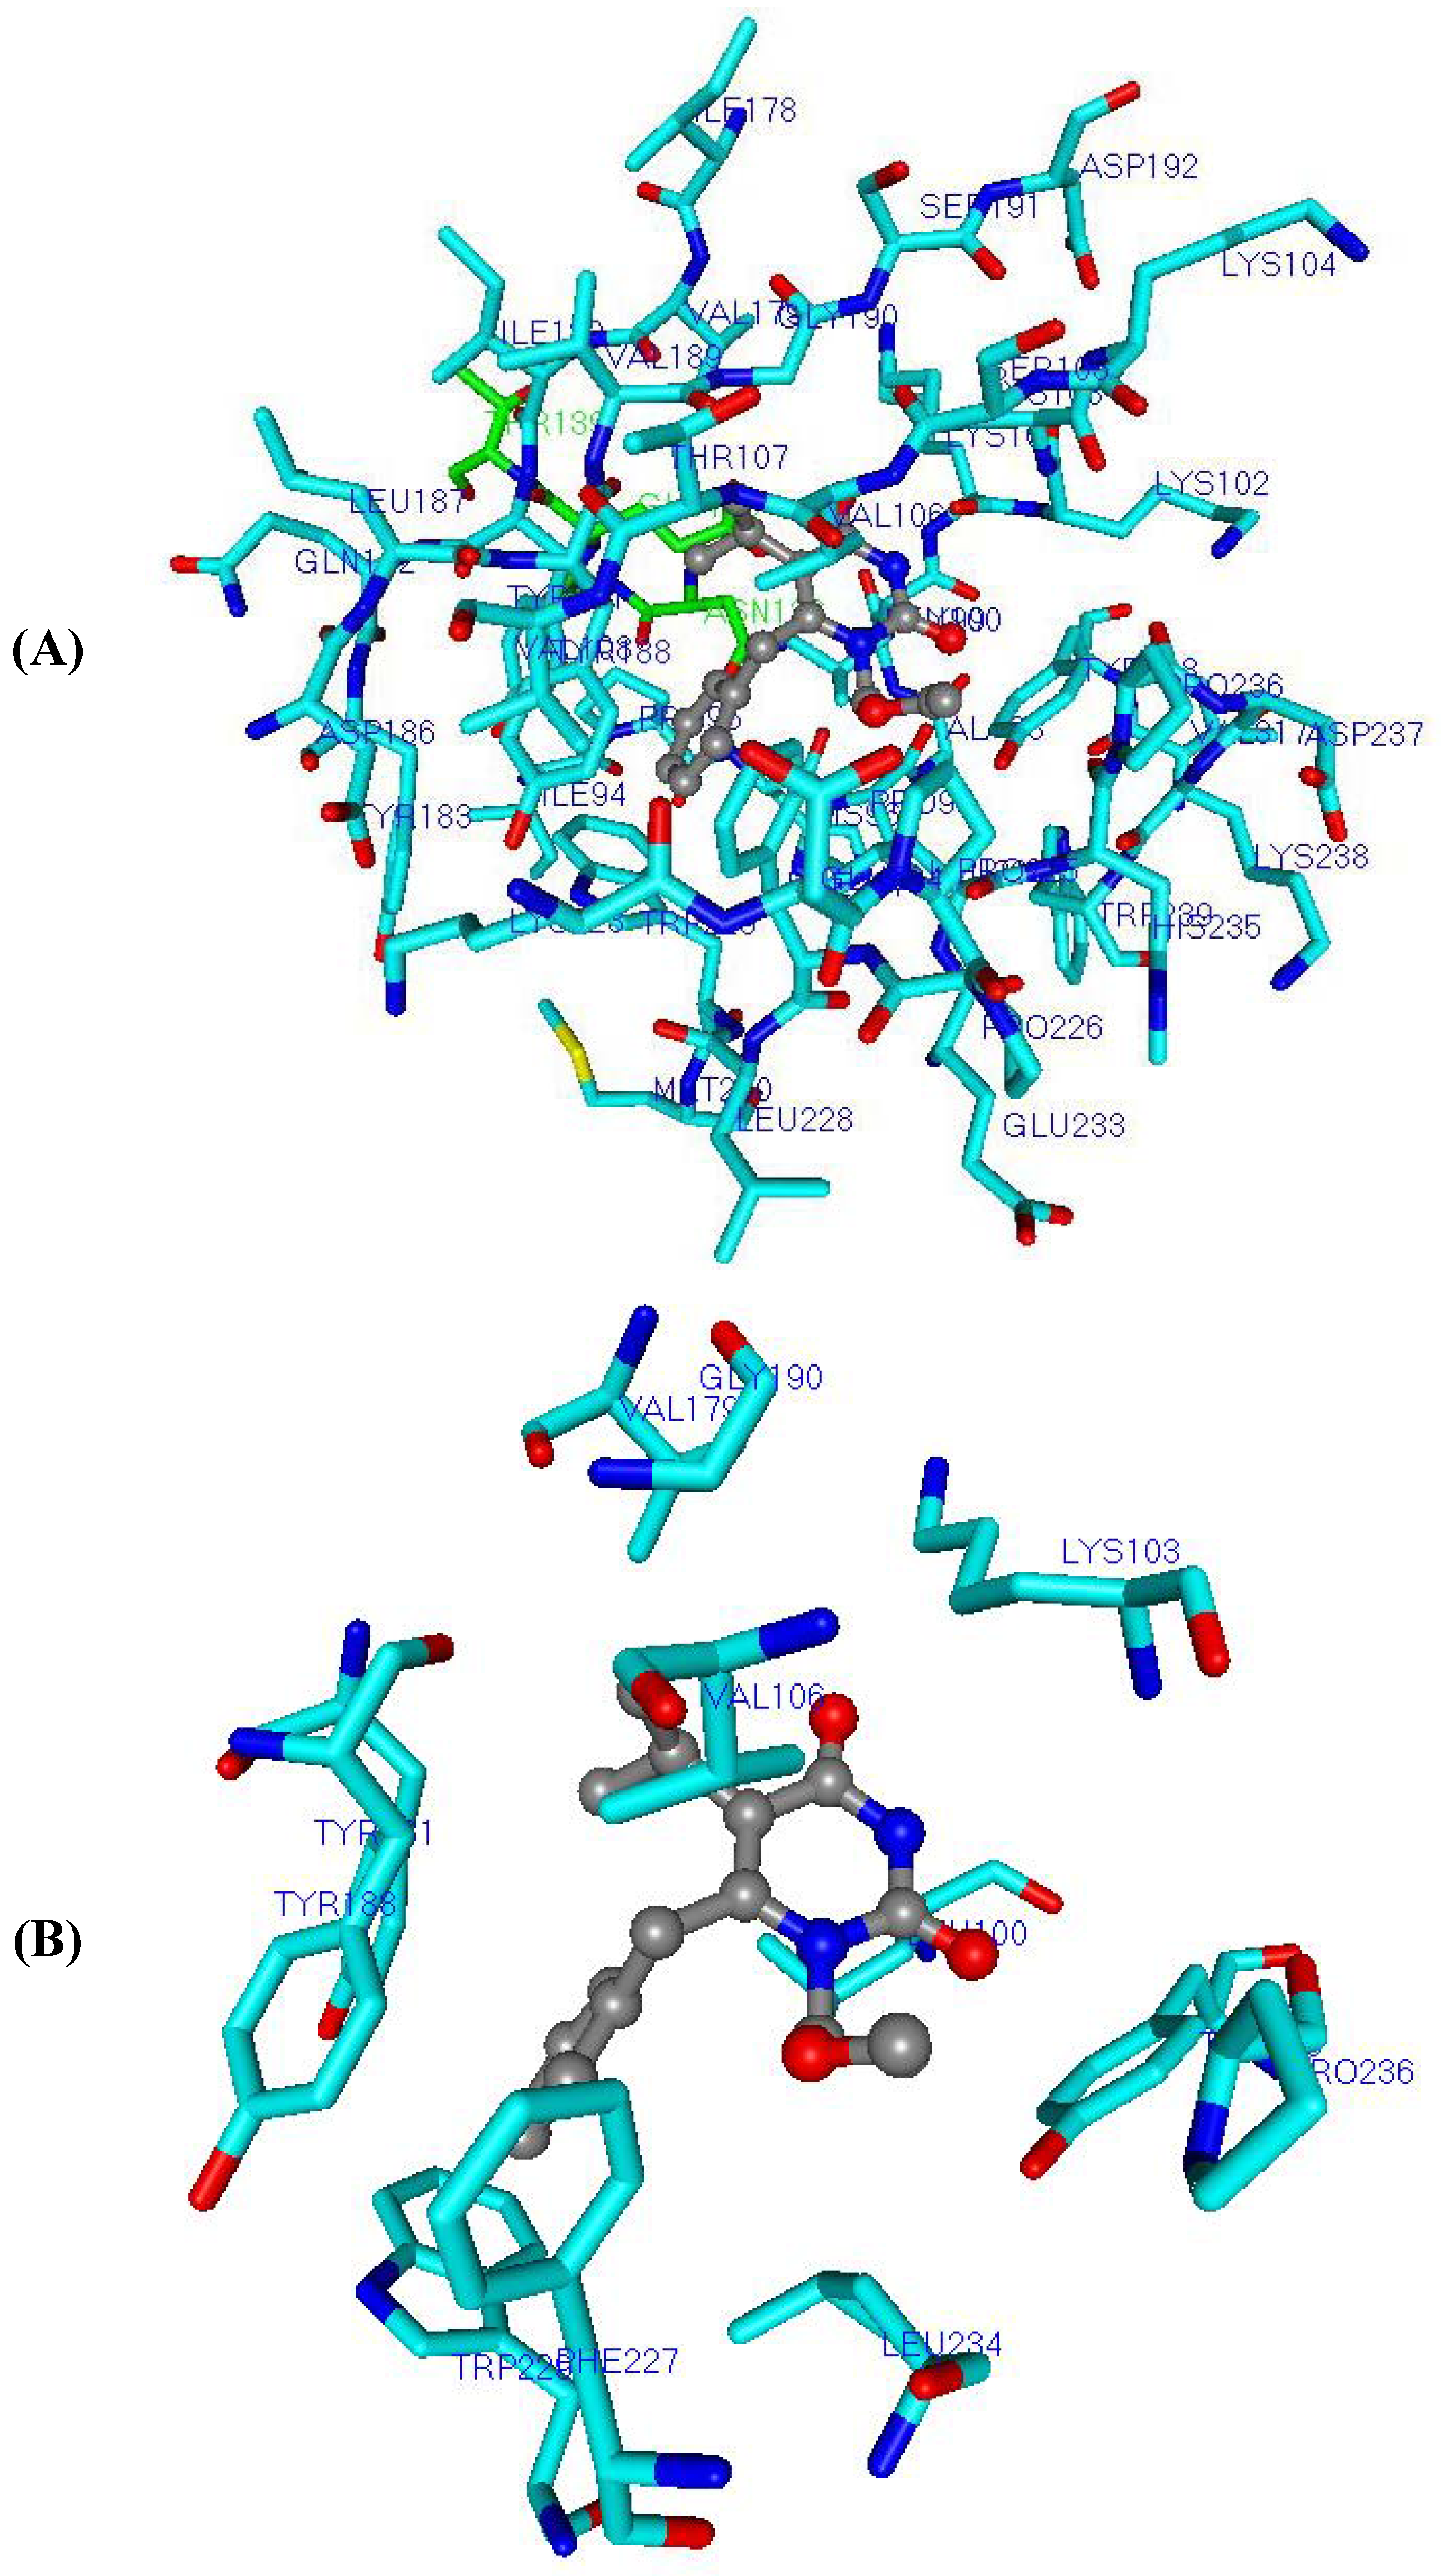
(a) Subunit p66: Ile94, Pro95, His96, Pro97, Ala98, Gly99, Leu100, Lys101, Lys102, Lys103, Lys104, Ser105, Val106, Thr107, Val108, Ile178, Val179, Ile180, Tyr181, Gln182, Tyr183, Asp186 (catalytic), Leu187, Tyr188, Val189, Gly190, Ser191, Asp192, His198, Lys223, Glu224, Pro225, Pro226, Phe227, Leu228, Trp229, Met230, Tyr232, Glu233, Leu234, His235, Pro236, Asp237, Lys238, Trp239, Thr240, Tyr317, Tyr318, and Asp319;
(b) Subunit p51: Asn136, Asn137, Glu138, and Thr139.
Figure 4.
(A) Reduced model complex of the RT of HIV-1 (stick model, carbon atoms of the p66 subunit in light blue and p51 in green) showing all 53 residues included in the radius of 10 Å from the inhibitor MKC-442 (ball-and-stick model, carbon atoms in gray). (B) Close view of the reduced model complex, showing only the residues included in the radius of 5 Å.
Considering the RT catalytic triad (Asp110, Asp185, and Asp186), Asp186 is the only residue included in the reduced model complex. In addition, residues Leu100, Lys101, Lys103, Val106, Val108, Tyr181, Tyr188, Gly190, Pro225, and Phe227, included in the reduced model complex, correspond to NNRTI-associated positions of frequent mutation [
4,
22,
25,
67,
91].
To facilitate the discussion of results about the spatial location of the residues in the reduced model complex, we consider also a smaller radius of 5 Å from the ligand, which includes only the following residues (
Figure 4B): Leu100, Lys103, Val106, Val179, Tyr181, Tyr188, Gly190, Phe227, Trp229, Leu234, Pro236, and Tyr318.
2.2. Overall Analysis of the Best Equations of Databases I to IV
The best ReLIE-3D-QSAR equation from each database studied (
DB-I,
DB-II,
DB-III and
DB-IV,
Table 2) was selected considering the statistical values and the number of outliers, with the goal to select the most representative equation. The statistical indices are shown on
Table 3 and the equations, on
Table 4.
Table 3.
Statistical results of the best equations of DB-I to DB-IV.
Table 3.
Statistical results of the best equations of DB-I to DB-IV.
| Equation (DB) | NTE a | q2adjusb | q2 c | SECV d | PC e | r2 f | SEE g | Outliers h |
|---|
| Eq.E (DB-I) | 10 | 0.660 | 0.713 | 0.420 | 4 | 0.822 | 0.500 | 3 |
| Eq.J (DB-II) | 10 | 0.606 | 0.667 | 0.460 | 6 | 0.766 | 0.600 | 3 |
| Eq.L (DB-III) | 7 | 0.594 | 0.636 | 0.480 | 3 | 0.723 | 1.180 | 4 |
| Eq.Q (DB-IV) | 9 | 0.616 | 0.669 | 0.458 | 6 | 0.764 | 0.700 | 5 |
Table 4.
Descriptors selected in the best equations of DB-I to DB-IV.
Table 4.
Descriptors selected in the best equations of DB-I to DB-IV.
| Eq.E | pIC50 = 4.853 + 22.417 Ile94LJ + 0.231 Pro97LJ − 0.153 Lys101LJ |
| (DB-I) | − 0.110 Tyr181LJ − 0.791 Gln182C − 0.122 Tyr188LJ + 0.323 Ser191C |
| | + 0.043
Pro226C + 0.087 His235LJ − 56.813 Asn137LJ |
| Eq.J | pIC50 = 6.802 + 0.101 Gly99 − 0.244 Tyr183 + 1.202 Leu187 − 0.059 Tyr188 |
| (DB-II) | + 0.360 Ser191 + 0.822 Glu224 − 0.028 Phe227 − 0.026 Trp229 |
| | + 0.061
Asp237 + 1.437 Thr139 |
| Eq.L | pIC50 = 6.257 + 15.851 Ile94LJ − 0.118 Tyr181LJ + 0.101 Pro225C |
| (DB-III) | + 3.525
Glu224 + 0.062 His235LJ − 52.568 Asn137LJ − 0.008 Glu138C |
| Eq.Q | pIC50 = 7.706 + 0.151 Gly99C + 1.162 Leu187C − 0.050 Tyr188C |
| (DB-IV) | + 0.403 Pro225C − 0.238 Pro226C − 0.282 Val179LJ |
| | + 0.124 Lys103LJ − 9.989 Asn136LJ − 0.074 Phe227LJ |
Considering the four equations (
Table 3 and
Table 4),
Eq.E (DB-I) was the best one, not only for the highest explanatory ability (high value of r
2 and low value of SEE), but also for the greatest predictive ability, both internally (high value of q
2 and low value of SE
CV) (
Table 3), in which the compounds of the training set have the lowest residual values, and externally, in which the compounds of the test set also showed the lowest residual values (
Table 5).
Table 5.
Cross-correlation matrix among the residual values of Equations E, J, L, and Q.
Table 5.
Cross-correlation matrix among the residual values of Equations E, J, L, and Q.
| | Eq.E | Eq.J | Eq.L | Eq.Q |
|---|
| Eq.E | 1.000 | | | |
| Eq.J | 0.559 | 1.000 | | |
| Eq.L | 0.514 | 0.434 | 1.000 | |
| Eq.Q | 0.289 | 0.278 | 0.474 | 1.000 |
The second best equation,
Eq.J (
DB-II), has the same number of terms (ten) and the same number of outliers (three) than
Eq.E, however, it has less explanatory and predictive ability (
Table 3). Equations
L (
BD-III) and
Q (
BD-IV), although more economical (showing only seven and nine terms, respectively), showed a higher number of outliers (
i.e., four and five, respectively). Moreover, in the case of
Eq.L, the residual values of four outlier compounds (from the test set) are excessively high, making this equation the worst of all. Therefore, we can classify
Eq.E and
Eq.J as the two best equations and
Eq.L and
Eq.Q as the two worst.
In relation to the Lennard-Jones (LJ) and Coulomb (C) terms contribution (
Table 4) on the structure-activity relationship (SAR), there is a greater prevalence of the LJ term in both the best (
Eq.E, seven LJ and three C terms) and the worst equations (
Eq.L, four LJ and two C terms), whereas in
Eq.Q, there is a slight predominance of the C term (four LJ and five C terms). This analysis cannot be performed for
Eq.J, because the contributions of LJ and C terms are not individualized,
i.e. each term is the sum of the steric and electrostatic interaction energies.
Considering all the 53 amino acids contained in the reduced model complex (10 Å radius), 23 residues, namely
Ile94,
Pro97,
Gly99,
Lys101,
Lys103,
Val179,
Tyr181,
Gln182,
Tyr183,
Leu187,
Tyr188,
Ser191,
Glu224,
Pro225,
Pro226,
Phe227,
Trp229,
His235,
Asp237,
Asn136,
Asn137,
Glu138, and
Thr139, appear more frequently in the best equations (
E,
J,
L, and
Q,
Table 4). This indicates that these residues (~43%) are more important in the SAR than the others, independent of the kind of term contribution (
i.e., steric, electrostatic or combined) related to them.
Among these 23 residues, one (Tyr188) occurs in three equations (Eq.E, Eq.J, and Eq.Q), and eleven occur in two equations, namely Ile94 (Eq.E and Eq.L), Gly99 (Eq.J and Eq.Q), Tyr181 (Eq.E and Eq.L), Leu187 (Eq.J and Eq.Q), Ser191 (Eq.E and Eq.J), Glu224 (Eq.J and Eq.L), Pro225 (Eq.L and Eq.Q), Pro226 (Eq.E and Eq.Q), Phe227 (Eq.J and Eq.Q), His235 (Eq.E and Eq.L), and Asn137 (Eq.E and Eq.L).
In the four equations (
Table 4), at least one term is related to one of the amino acid residues of the p51 subunit:
Asn136 (term
Asn136LJ of
Eq.Q),
Asn137 (term
Asn137LJ of
Eq.E and
Eq.L),
Glu138 (term
Glu138C of
Eq.L) and
Thr139 (term
Thr139 of
Eq.J). As it will be discussed in details for
Eq.E, this fact implies the importance of interchain interaction (p66-p51) in the equations that best describe the structure-activity relationship for this class of compounds.
Additionally,
Table 5 shows the cross-correlation matrix between the residual values (pIC
50Obs − pIC
50Pred) calculated for the training set compounds, using the four equations (
E,
J,
L, and
Q), so as to verify the correlation degree between these models. In such matrix, pairs of equivalent models may have correlated residual values (r close or equal to 1) and may represent the training set in a similar manner. Furthermore, pairs of distinct models have residual values not correlated (r < 0.7) [
43]. Analyzing the data on
Table 5, it is observed that, according to this statement, the models are not correlated (
i.e., they are distinct), as the highest correlation (r = 0.559) occurs between equations
E and
J, which are the two best models, while
Eq.Q is the model that shows most divergence from the others.
2.3. Analysis of the Best Equation of BD-I (Eq.E)
In
Eq.E (
BD-I) (
Table 3 and
Table 4,
Figure 5), each one of the 10 independent variables (steric and electrostatic interaction energies calculated by amino acid residue) is represented by the corresponding amino acid three letters code, followed by the LJ (Lennard-Jones) or C (Coulomb) designation, which indicates that the interaction refers to the steric or electrostatic contribution, respectively.
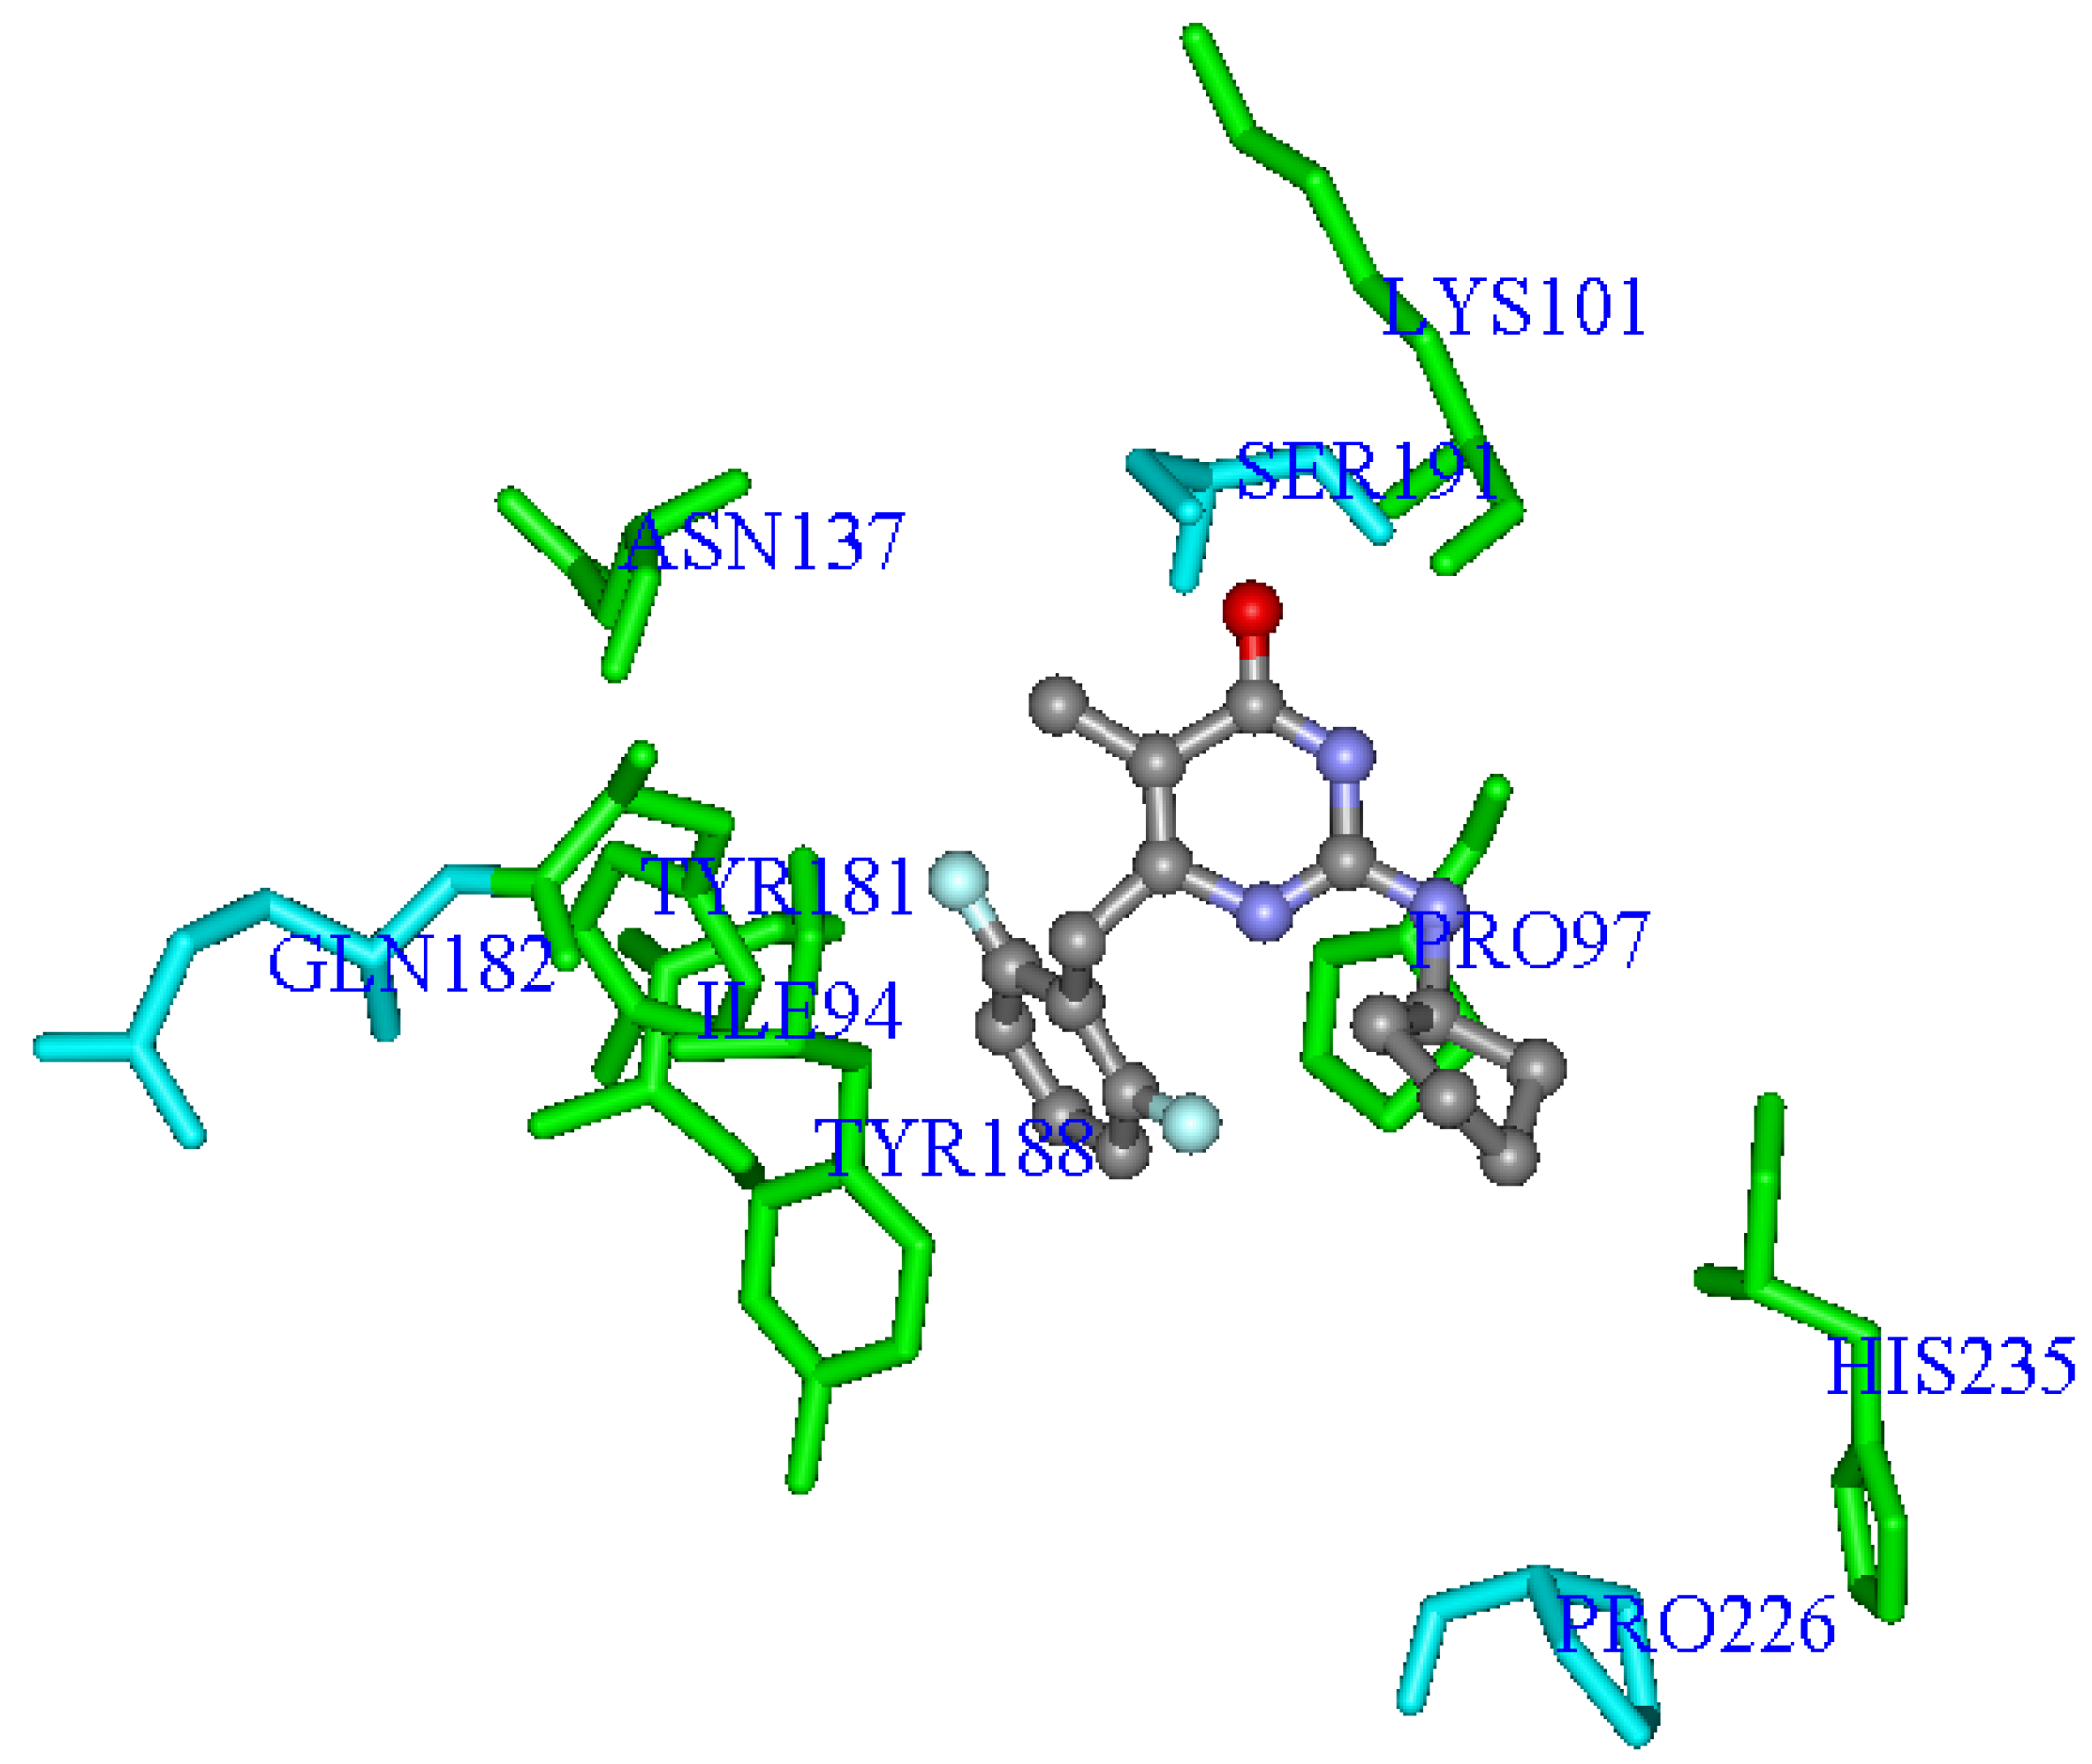
Figure 5 shows the
Eq.E three-dimensional graphic representation, using the most potent NH-DABO, compound
59, as example.
Figure 5.
Three-dimensional graphic representation of
Eq.E (
Table 3 and
Table 4,
DB-I), using the most potent NH-DABO, compound
59 (stick-and-ball model colored by element), as example. The amino acids residues (stick model) colored in green (
Ile94,
Pro97,
Lys101,
Tyr181,
Tyr188,
His235 and
Asn137) represent Lennard-Jones contributions and those colored in light blue (
Gln182,
Ser191 and
Pro226) represent Coulomb contributions. The hydrogen atoms were omitted for better viewing.
It should be noted that residues
Lys101,
Tyr181,
Tyr188, and
His235, which are described in the literature as often making interactions with several NNRTIs, were selected in this equation [
20,
21,
63,
92,
93].
In
Eq.E, only three terms (
Gln182C,
Ser191C, and
Pro226C) represent Coulomb contributions, while the other seven terms (
Ile94LJ,
Pro97LJ,
Lys101LJ,
Tyr181LJ,
Tyr188LJ,
His235LJ, and
Asn137LJ) represent Lennard-Jones contributions. This result indicates a higher importance of the steric interaction than of the electrostatic one to the structure-activity relationship, corroborating the importance of the steric interaction in the hydrophobic cavity of NNBS as discussed by several authors [
20,
21,
92,
94]. In addition, the three electrostatic terms (
Gln182C,
Ser191C, and
Pro226C) selected in this equation are related to residues that are located outside the radius of 5 Å, as defined previously, which might be justified because the electrostatic interaction has a larger range than the steric one.
The values of pIC50 calculated (predicted) by Eq.E are influenced by the magnitude and the signal (+ or −) of the coefficient for each term in the equation and by the signal of the interaction energy itself. As an example, the coefficient of the term Tyr181LJ is negative (−0.110) in Eq.E, therefore, the steric interaction energy between this residue Tyr181 and a ligand should be negative for this energy term to contribute to increase the compound potency; if the interaction energy is positive, the term will help reduce the potency of the compound.
In contrast, the term Ile94LJ presents the positive coefficient (22.417) in Eq.E, therefore, the steric interaction energy between this residue Ile94 and a ligand should be positive for this term of energy to increase the potency of the compound, if the interaction energy is negative, the term will reduce the potency of the compound.
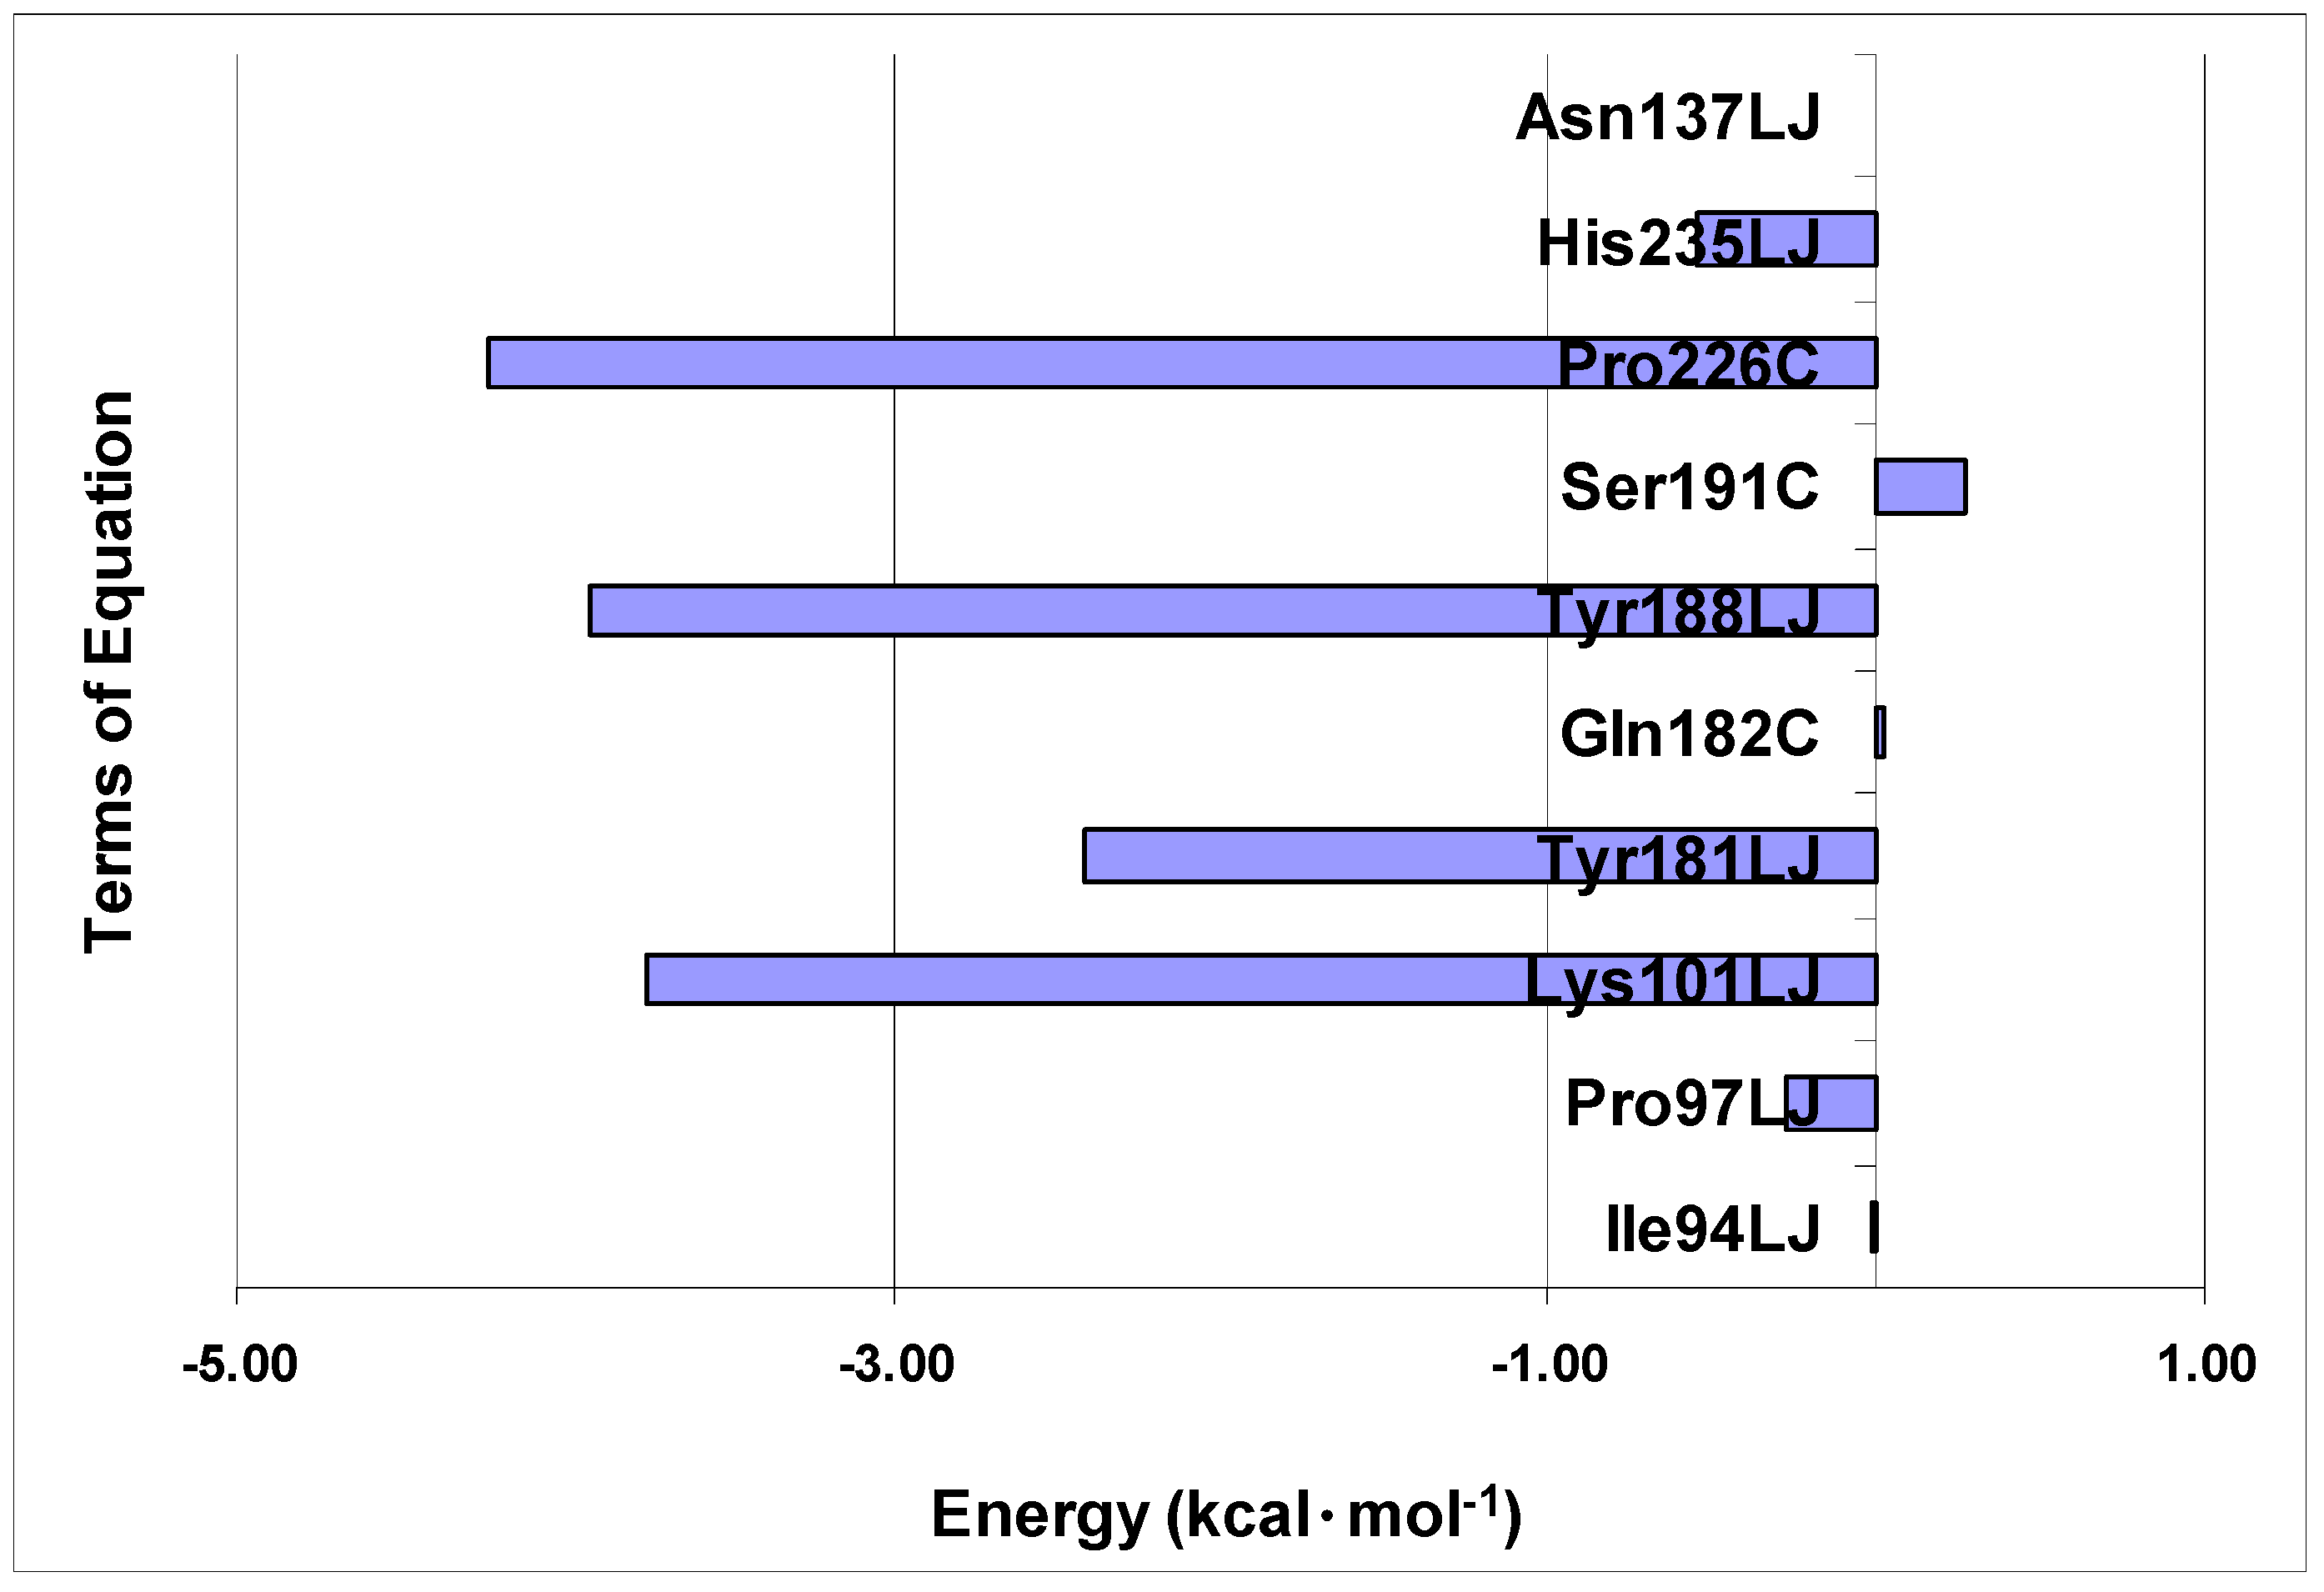
Figure 6 shows the average values of interaction energy (kcal·mol
−1) of compounds
1–
74 with the residues selected in
Eq.E. Most inhibitors presents negative (or close to zero) interaction energies with most of the residues of the
Eq.E, except with residue
Ser191, in which the energy values are negative and of greater magnitude for the terms
Lys101LJ,
Tyr181LJ,
Tyr188LJ and
Pro226C, with an average energy of about −3.8 kcal·mol
−1. The terms
Pro97LJ and
His235LJ, which also represent the negative values of energy, have an average energy of about −0.4 kcal·mol
−1. Considering these six residues with the negative values of energy, the terms
Lys101LJ,
Tyr181LJ,
Tyr188LJ, provide the coefficient of negative sign (
Eq.E), to increase the potency, while the terms
Pro97LJ,
Pro226C and
His235LJ, which have the coefficient of positive sign (
Eq.E), contribute to decrease the potency.
Figure 6.
Average interaction energies (kcal·mol−1) of compounds 1–74 with each of the selected terms in accordance with Eq.E (DB-I).
Figure 6.
Average interaction energies (kcal·mol−1) of compounds 1–74 with each of the selected terms in accordance with Eq.E (DB-I).
The terms Ile94LJ, Gln182C and Asn137LJ, providing average energy of interaction close to zero, are those with the highest values (modular) coefficients, which allows them to balance the weight in relation to other terms in Eq.E. It is also interesting to note that these three terms are related to residues that may be found outside the radius of 5 Å, which may also explain the lower interaction energy (modular) we were able to calculate.
Finally, the term
Ser191C (
Eq.E) is the only one that shows average values of positive interaction, which correspond to a repulsive electrostatic interaction,
i.e., negative, with a value close to 0.3 kcal·mol
−1. Curiously, this term contributes to the increase in the potency, since it presents positive coefficient in
Eq.E. Other authors have reported positive steric and electrostatic interaction energies for other systems [
92].
Concerning the frequently mutated residues in RT related to NNRTIs, three of them were selected in Eq.E related to the terms Lys101LJ, Tyr181LJ and Tyr188LJ. As these three terms have negative steric interaction energy values and also negative coefficients in Eq.E, all contribute to increase the potency.
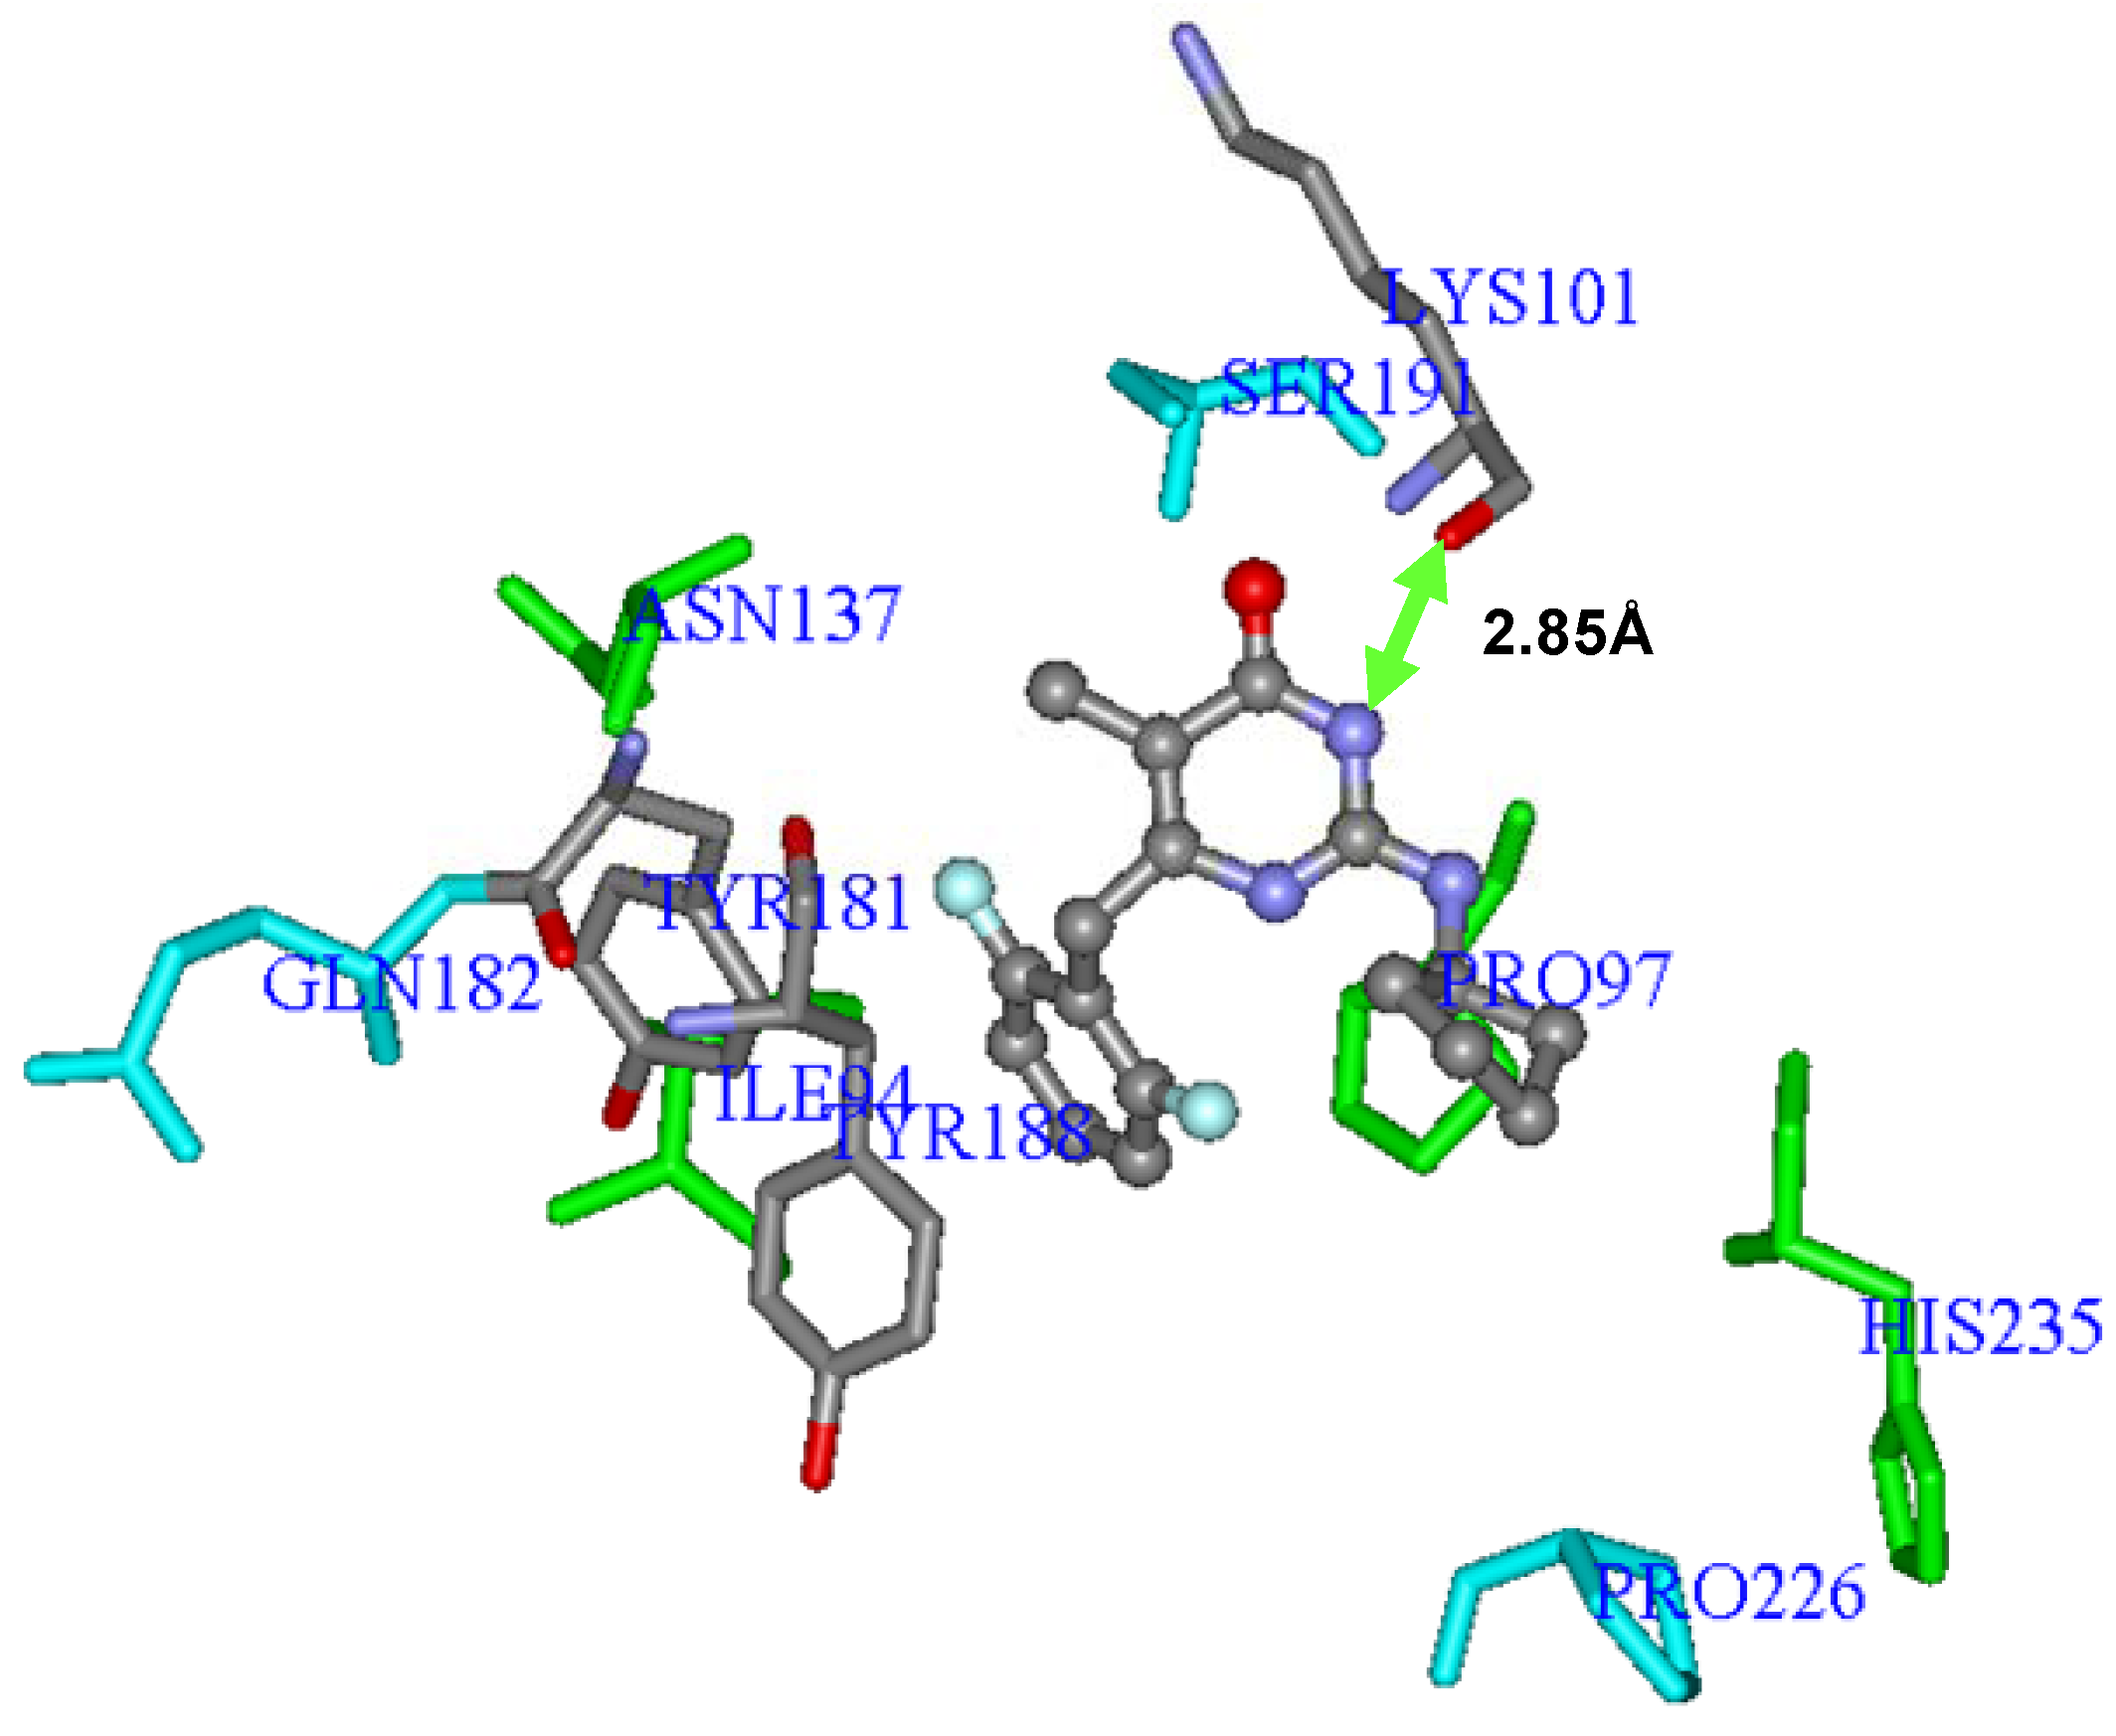
Interestingly, after the mutation of
Lys101Gly into the wild-type RT, the oxygen atom of the amide group’s main chain of
Lys101 was capable of making hydrogen interaction (2.85 Å) with the -NH group of the 4-oxo-pyrimidine inhibitors, as shown in
Figure 7 for compound
59. Additionally, the protonated amine side chain of this residue belonging to subunit p66 was able to make ionic interaction with the carboxylate group of the side chain of
Glu28 (about 5 Å away) and
Glu138 (at around 6.5 Å away), both belonging to the p51 subunit, and responsible, therefore, for interchain interactions (p66-p51).
Figure 7.
Three-dimensional graphic representation of
Eq.E (
Table 3 and
Table 4,
DB-I), using the most potent NH-DABO, compound
59 (stick-and-ball model colored by element), highlighting the frequently mutated residues
Lys101,
Tyr181, and
Tyr188 (stick model colored by element). The arrow indicates a possible hydrogen interaction between
59 and
Lys101. The residues (stick model) colored in green (
Ile94,
Pro97,
His235, and
Asn137) and by element (
Lys101,
Tyr181, and
Tyr188) represent Lennard-Jones contributions and those colored in light blue (
Gln182,
Ser191, and
Pro226) represent Coulomb contributions. The hydrogen atoms were omitted for better viewing.
It’s curious that after the change into
Gly101, the interaction between the residue and the hydrogen atom of the inhibitor could be maintained, since it involves the main chain's residue, which is not changed. However, the corresponding interchain interactions, which depend on the side chain of residue, were lost, affecting the composition of the NNBS (referring to the residue of the p51 subunit). The interchain interactions are important for the dimerization process of the RT and it is composed by residues from p66 and p51 [
95].
In the best four equations, we have found at least one term that is related to an amino acid residue of the p51 subunit:
Asn136 (
Eq.Q),
Asn137 (
Eq.E),
Glu138 (
Eq.L), and
Thr139 (
Eq.J). Both
Asn136 and
Asn137 are highly conserved among the heterodimeric RTs, e.g., HIV-1, HIV-2 and simian immunodeficiency virus [
95]. This fact points to a defined (but as yet unidentified) functional and/or structural role for these residues. The highly conserved
Asn136 is in close proximity to the NNRTI lipophilic pocket of HIV-1 RT. Site-directed mutagenesis has revealed that the catalytic activity of HIV-1 RT mutated at position
Asn136 is heavily compromised [
95]. Only 0.07 to 2.1% of wild-type activity is retained, depending on the nature of the amino acid change at position
136 [
95].
Furthermore, the mutations
Tyr181Cys and
Tyr188Leu belong to a more common case, in which the exchange between the residue affects directly the protein-ligand interaction, and not, as in the previous case, indirectly. In both mutations there is a loss of the π-π-stacking interactions between the side chain aromatic ring of
Tyr181 and
Tyr188 with the inhibitors aromatic ring, reducing the affinity for the NNBS [
92,
94].
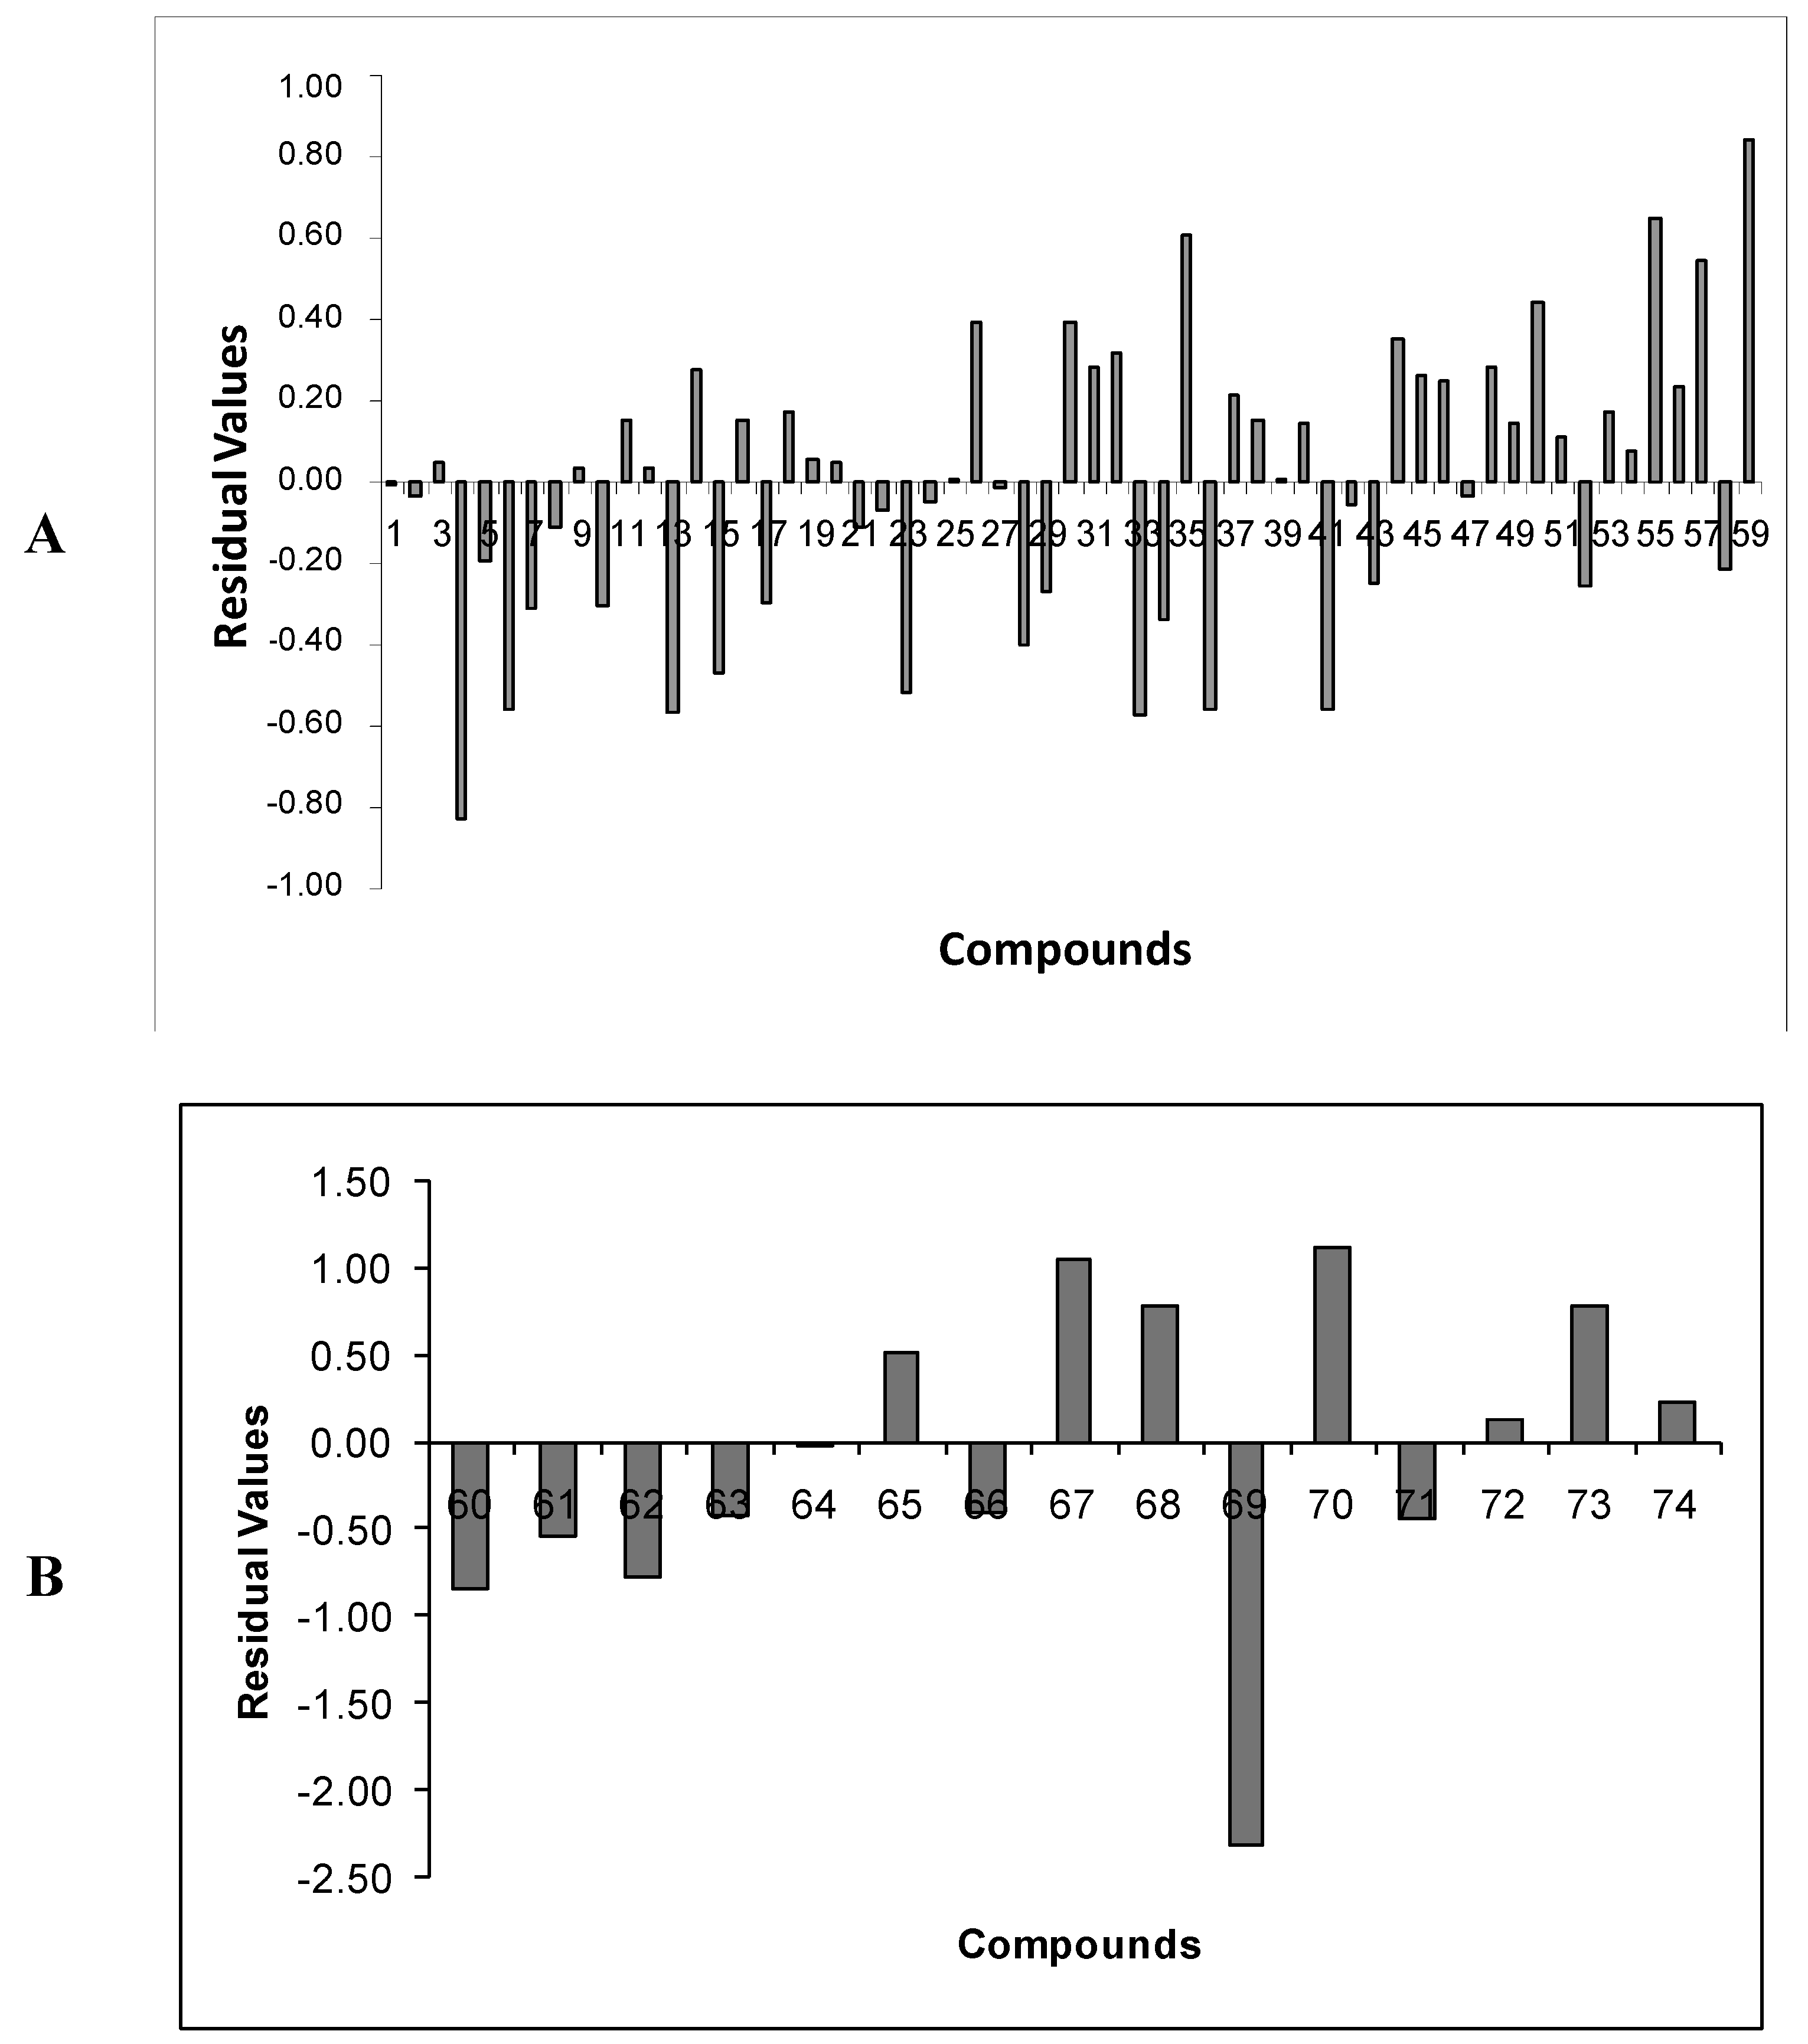
2.5. Analysis of Outliers of Eq.E (DB-I)
As mentioned earlier, with relation to
Eq.E, three outliers were identified (
67,
69, and
70), all of them from the test set (
Table 1). Compounds
67 (residue = 1.06) and
70 (residue = 1.12) have predicted potencies lower than the experimental ones, while the compound
69 (residue = −2.30) has a predicted potency higher than the experimental one.
In the descriptors (interaction energies) selected in
Eq.E, the terms which have more variation are
Tyr181LJ and
Gln182C related to steric and electrostatic contributions, respectively. For
Tyr181LJ, the energy values obtained were: −2.540 kcal·mol
−1 for compound
67, −7.517 kcal·mol
−1 for compound
69 and 1.620 kcal·mol
−1 for compound
70. This term has a negative coefficient (−0.110) in
Eq.E, increasing the potency, something that may justify the higher potency predicted for
69, since the aromatic ring of residue
Tyr181 makes hydrophobic π-π-stacking interactions with the aromatic rings of NNRTIs, as described above. However, it remains unclear why similar compounds containing the nitro substituent in
para (
30) or
meta (
43) position (
Table 1) are not outliers, while
69 (
ortho-nitro) is an outlier.
For Gln182C, which also has a negative coefficient (−0.791) in Eq.E, increasing the potency, the behavior seems similar to the previous term, but with less intensity, since the energy values obtained are as follows: 0.188 kcal·mol−1 (67), −0.606 kcal·mol−1 (69), and 0.097 kcal·mol−1 (70).
2.8. Comparison of CoMFA (RI-3D-QSAR) and ReLIE (RD-3D-QSAR) Models
Recently, we reported a CoMFA (RI-3D-QSAR) model [
62], using this same series of DABO derivatives. In short, the best CoMFA model was built with PM3 charges, default cutoff of 30 kcal·mol
-1 for both steric and electrostatic fields,
sp3 carbon atom with +1 charge as the probe atom and the grid spacing of 2.0 Å. This model showed good internal consistency in terms of r
2 and SEE and good predictive ability (q
2 = 0.691). In this study, the alignments, the partial atomic charges, the cutoff, and the probe atoms had little influence on the resulting statistical values and, consequently, on the models.
The most important structural conclusions from the CoMFA study were the restriction in the volume of the substituent at position
C2 of the 4-oxopyrimidine ring (
Table 1), more bulky substituents in position
C5 and the presence of electron-rich groups in the position
C6 of the aromatic ring, which increase biological activity, making these areas important sites for future structural changes.
The pharmacoforic hypothesis proposed in the ReLIE study was based on MKC-442 conformation and orientation in the NNBS. It was validated by the good statistical results obtained. The best model, Eq.E (DB-I), shows q2 = 0.660, and the external predictive ability was evaluated using a test set of 15 compounds, the same used in the CoMFA.
Although the CoMFA model is little more predictive than the ReLIE model, the incorporation of the X-ray data of protein-ligand complex in the ReLIE studies provided a more detailed interpretation of the contour maps of CoMFA, leading also to better understanding of the interaction of the complex.


