2. Results and Discussion
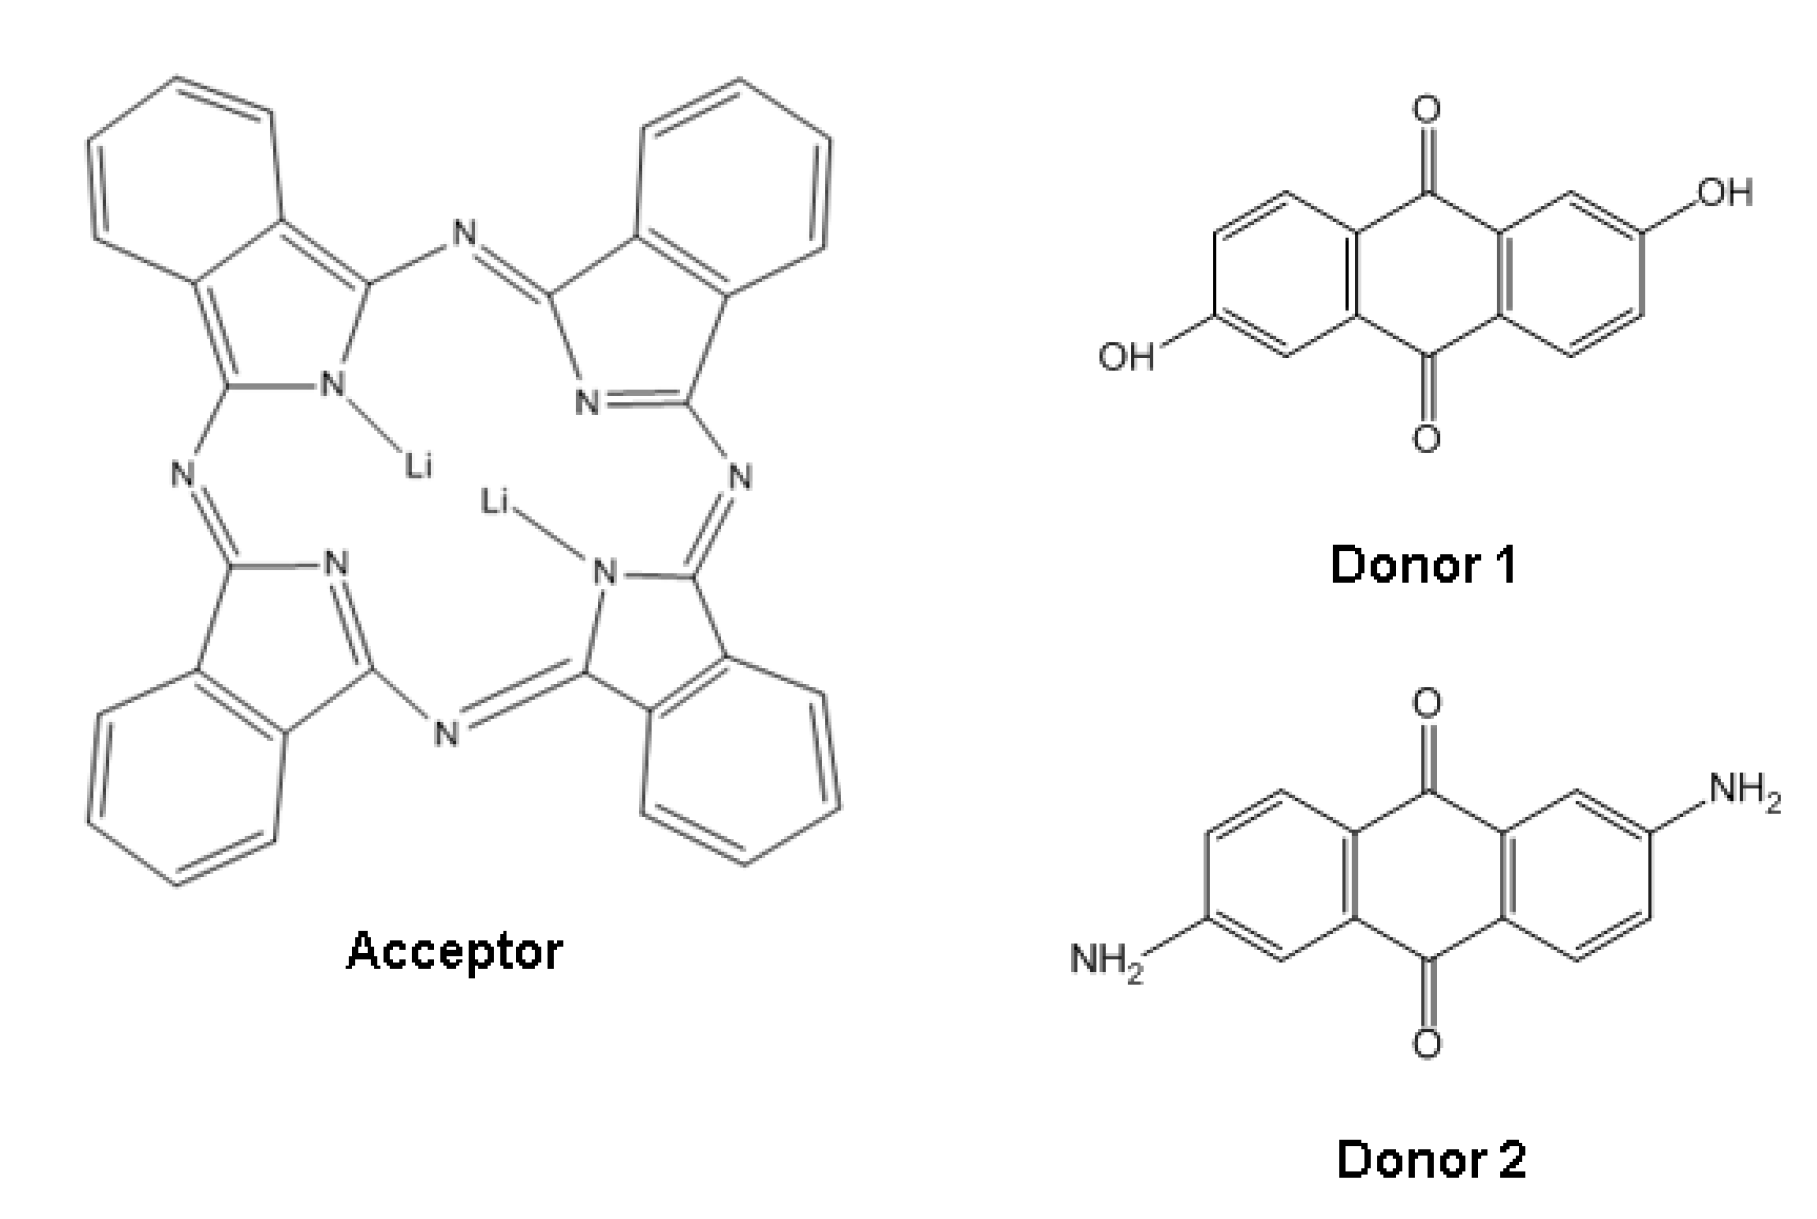
The electronic acceptor dilithium phthalocyanine was made to react with
n moles of the organic donor (L1 or L2; see
Figure 1). The dilithium phthalocyanine was selected for this study because it is a planar molecule and consists of four isoindole units linked by aza nitrogen atoms and two surrounding lithium atoms. A major property related to this structure is its thermal stability which makes it suitable for sublimation without breaking down [
6,
10].
Figure 1.
Acceptor and donor schemes.
Figure 1.
Acceptor and donor schemes.
The purpose of the IR spectroscopic studies on these thin films was to identify the most important and representative bonds of the different synthesized compounds. From these studies we were able to determine any significant chemical changes which occurred in these materials during the thermal evaporation deposition procedure.
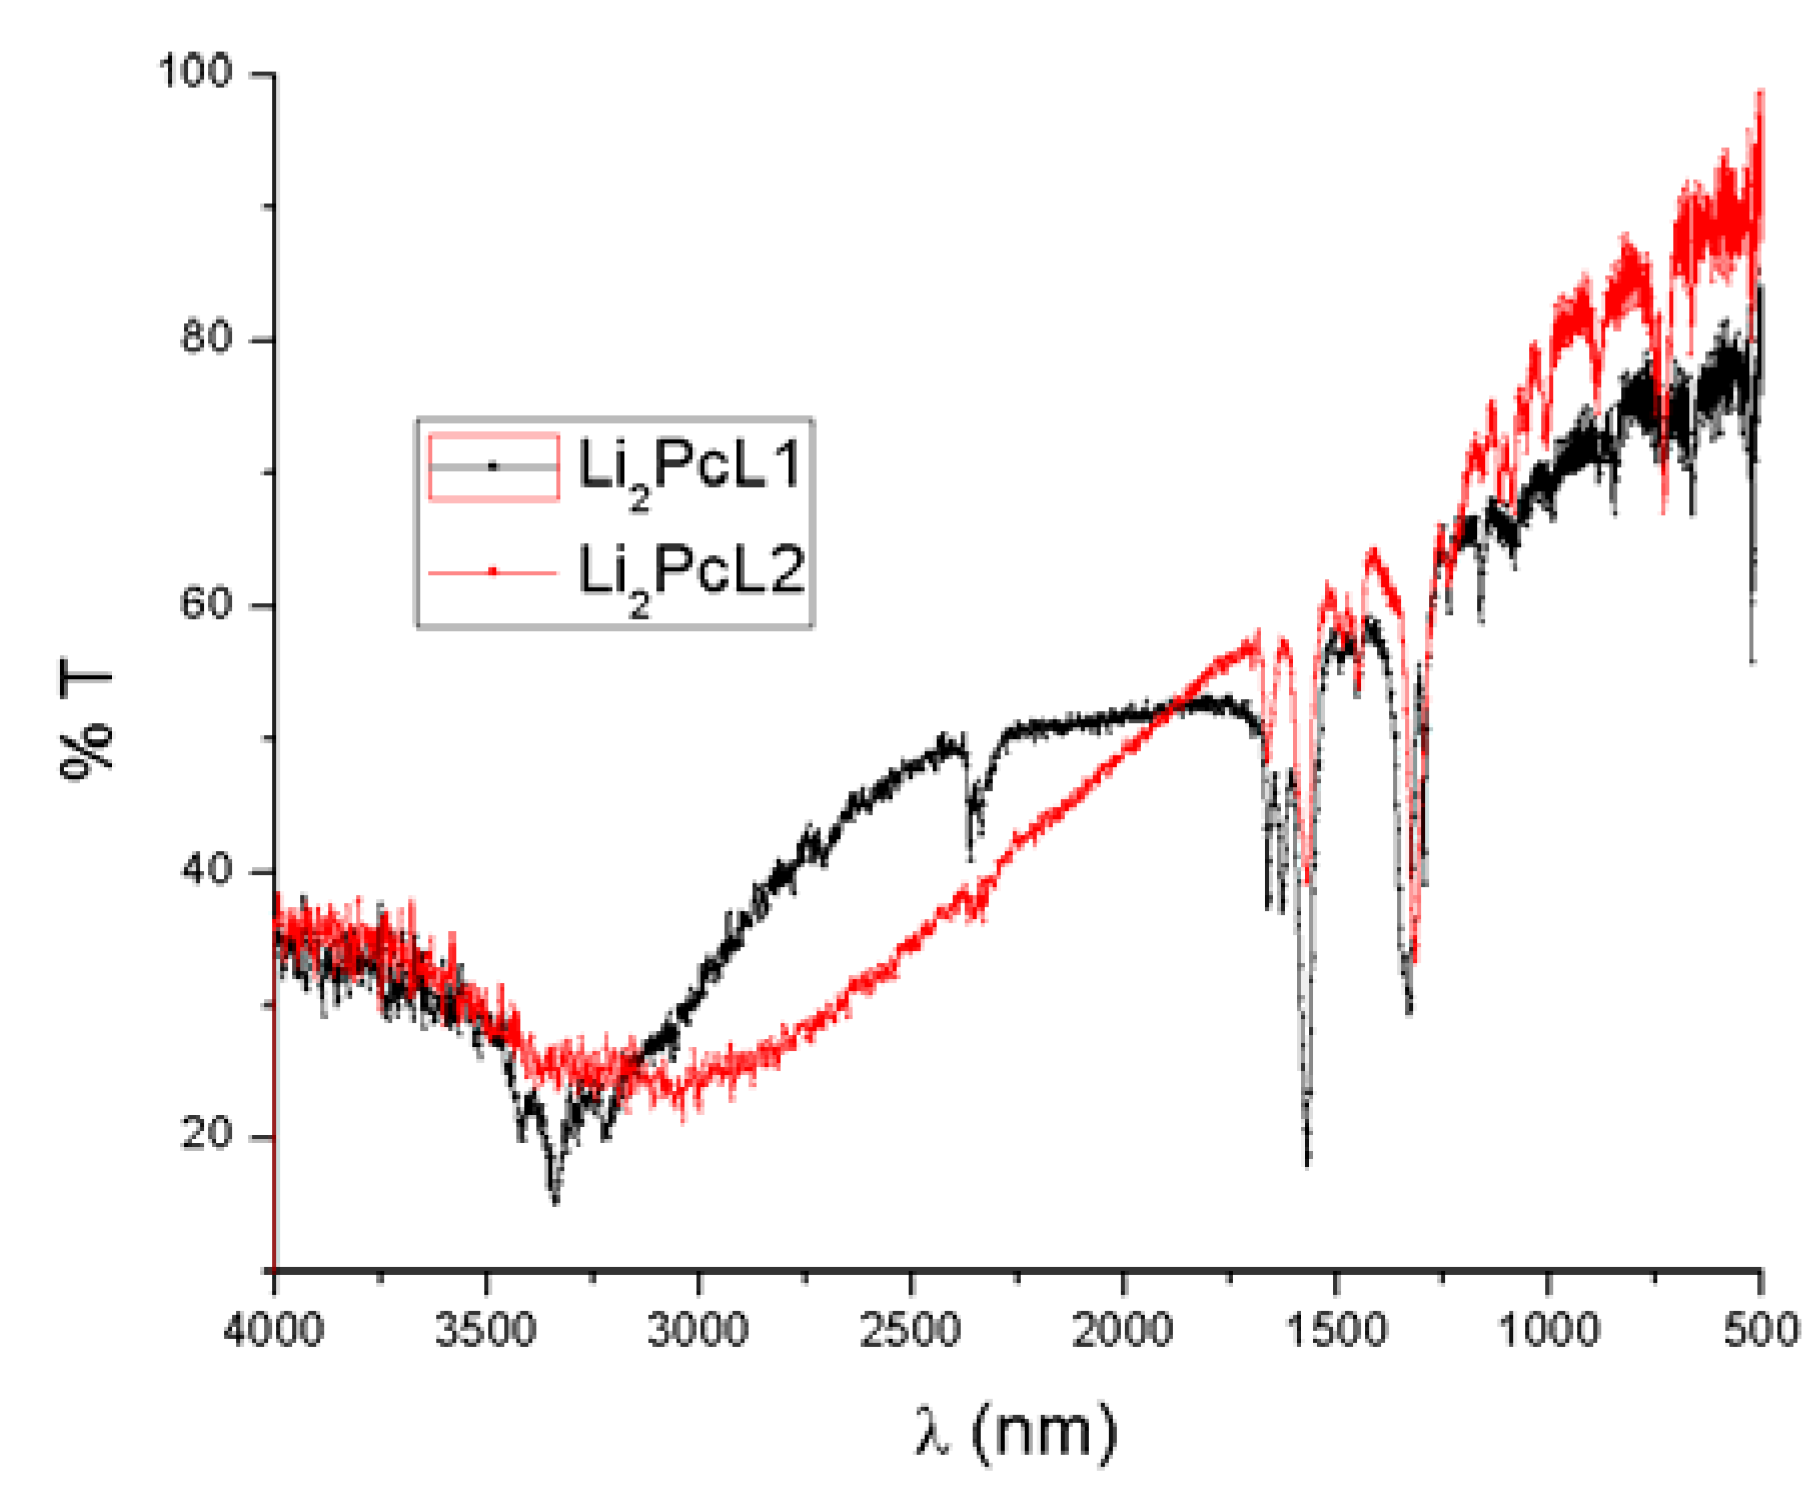
Figure 2 shows infrared absorption spectra of molecular materials in KBr pellet form. Due to the thermal stability of these compounds, chemical changes or reactions are not expected to occur.
Figure 2.
Infrared absorption spectra of Li2PcL1 and Li2PcL2.
Figure 2.
Infrared absorption spectra of Li2PcL1 and Li2PcL2.
Table 1 shows characteristic bands for these compounds on thin film samples. The absorption peaks lie predominantly in the fingerprint region [
11]. The peaks responsible for carbon/nitrogen stretching and bending occur at 1587, 1487, 1328, 1282, and 1057 cm
−1. The peaks at 1167, 1115 and 779 cm
−1 result from the interaction of carbon with the peripheral ring hydrogen atoms. The peak at 1093 cm
−1 results from a carbon/carbon stretch within the macrocyclic ring. Notable peaks also occur at 1707, 881 and 728 cm
−1, all of them representing other atomic interactions within the macrocyclic ring of Li
2Pc [
11]. Additionally it may be noticed that the material from the thin film Li
2PcL1 and Li
2PcL2 exhibits a C=O functional group with wavelengths of 1677 and 1664 cm
−1, respectively. When compounds are presented in the thin film format, the associated spectrum shows slight changes in the maxima absorption location because, in any thin film structure deposited by thermal evaporation, internal stresses exist which affect the angles and the energies of the intramolecular bonds. Moreover, the IR spectra show the same absorption bands for the thin films as those of the original powders used for evaporation. These results strongly suggest that thermal evaporation is a molecular process which does not change the relative chemical composition of the synthesized compounds. Thus, the deposited films are formed by the same macro-ions as those pertaining to the original synthesized powders.
Table 1.
IR (cm−1) characteristic bands of the synthesized materials for powder and thin film sample formats.
Table 1.
IR (cm−1) characteristic bands of the synthesized materials for powder and thin film sample formats.
| Compound | ν (C–H) (cm−1) | ν (C–C) (cm−1) | ν (C=N) (cm−1) | ν (C=O) (cm−1) |
|---|
| Li2Pc | 1167, 1115, 779 | 1093 | 1587, 1487, 1328, 1282, 1057 | - |
| Li2PcL1Powder | 1156, 1116, 782 | 1090 | 1330, 1293, 1068 | 1677 |
| Li2PcL1Thin Film | 1157, 1110, 780 | 1093 | 1329, 1290, 1065 | 1674 |
| Li2PcL2Powder | 1153, 1116, 780 | 1095 | 1312, 1279, 1067 | 1664 |
| Li2PcL2Thin Film | 1152, 1116, 780 | 1094 | 1310, 1282, 1067 | 1665 |
Despite the low solubility of the samples, the FAB+-mass spectra show fragments with the appropriate isotopic ratio representing the dilithium phthalocyanine moiety, [C32H16N8Li2]+ (526 m/z), and fragments containing the macrocycle and one ligand (Li2Pc/ligand), confirming the addition of the ligand to the Li2Pc units. In the case of Li2PcL1 fragments, containing one Li2Pc and one molecule of anthraflavic acid (732 m/z), and for Li2PcL2 fragments, containing one Li2Pc and one amine (744 m/z), all the spectra display additional low intensity signals for heavier fragments up to 900 m/z. The presence of the characteristic functional groups of the molecules which make up the Li2PcL1 and Li2PcL2 thin films, obtained through IR spectroscopy, as well as the FAB+-mass spectra, help complement the results regarding their stability.
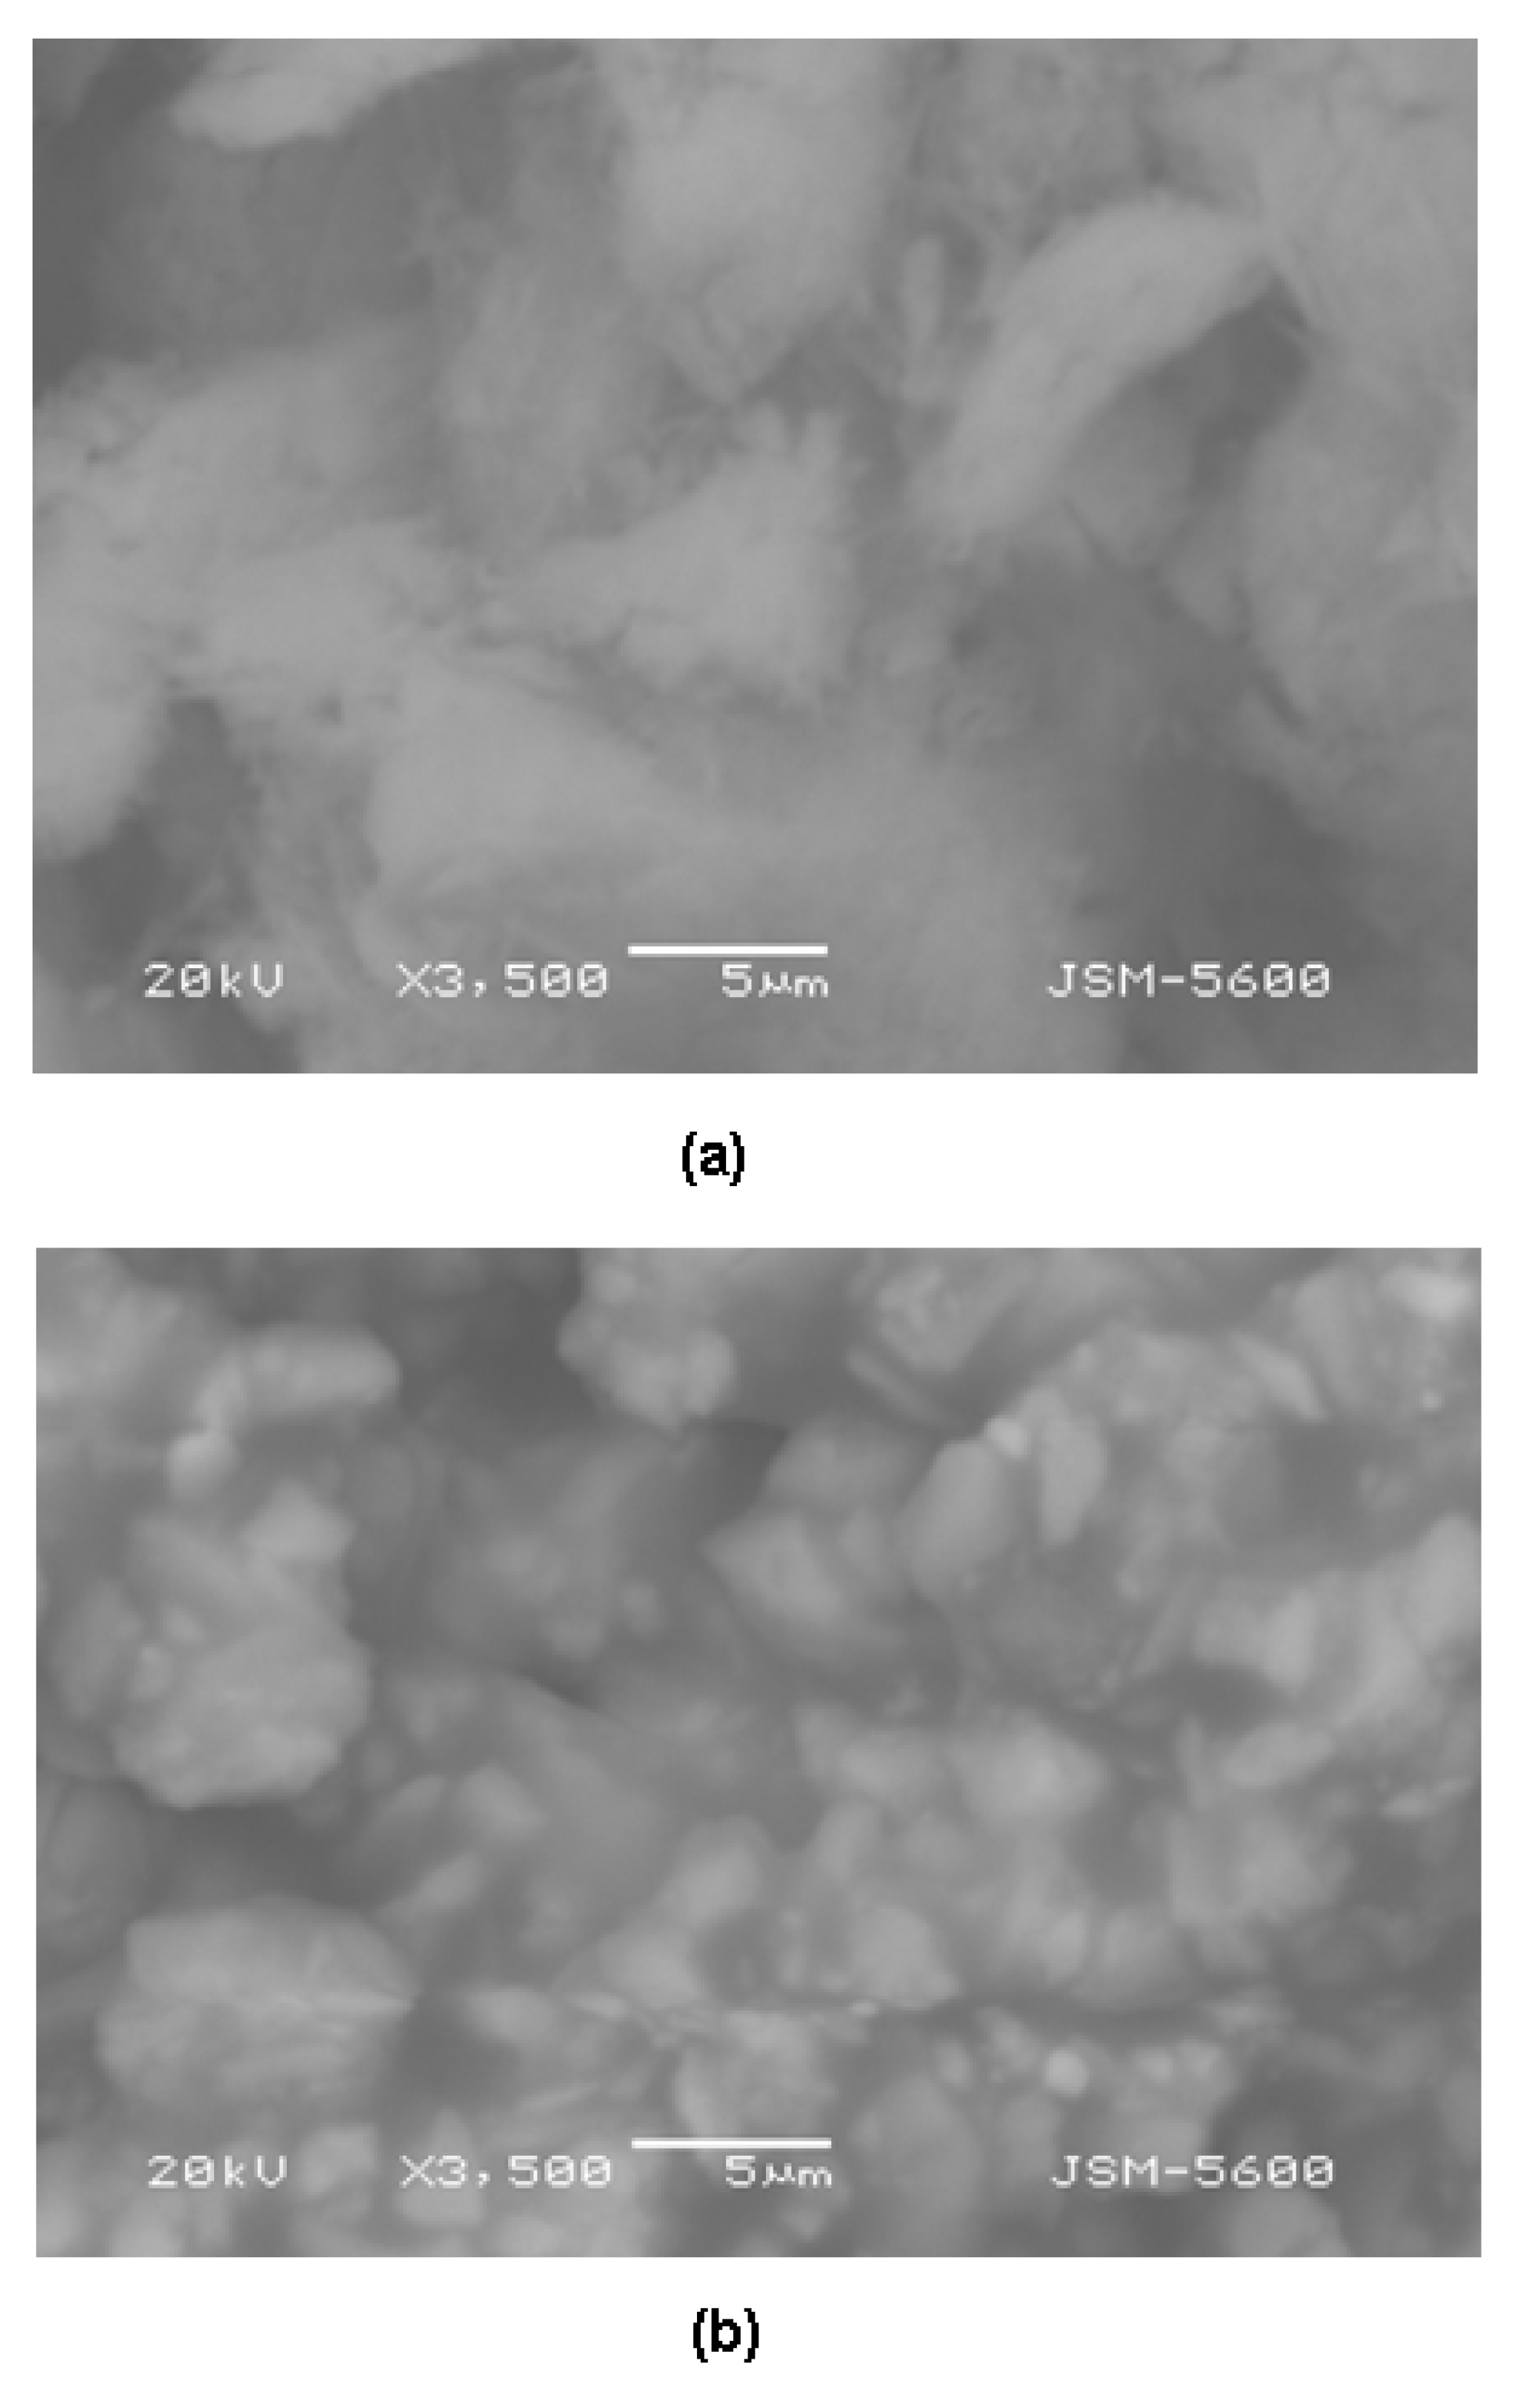
The SEM micrographs of the Li
2PcL1 and Li
2PcL2 thin films are shown in
Figure 3. It may be observed that the surface morphology differs between these two materials. Notwithstanding the effort to maintain a constant deposition parameter, the different melting point for these complexes might prove to be an influence on the resultant morphologies. The thin film synthesized from the anthraflavic acid presents a m.p. of 310 °C, whereas the film synthesized from amine melts at 375 °C. Similar results have been obtained for thin films based upon phthalocyanine and its complexes (magnesium, manganese, iron, cobalt, zinc and lead phthalocyanine) [
12,
13]. Furthermore, the observed morphology for all materials in the SEM micrographs display an amorphous appearance; this being found in films based upon different materials whenever the low-pressure evaporation technique is employed for their deposition [
3,
4,
5,
10]. During the deposition process, when the molecules reach that portion of the substrate at the lowest temperature, their kinetic energy does not suffice in order for them to posses a high-enough surface mobility. Therefore, the long-reach order, characteristic of crystals, is not achieved and an amorphous film structure results.
Figure 3.
SEM micrographs of (a) Li2PcL1 and (b) Li2PcL2 thin films at 3,500×.
Figure 3.
SEM micrographs of (a) Li2PcL1 and (b) Li2PcL2 thin films at 3,500×.
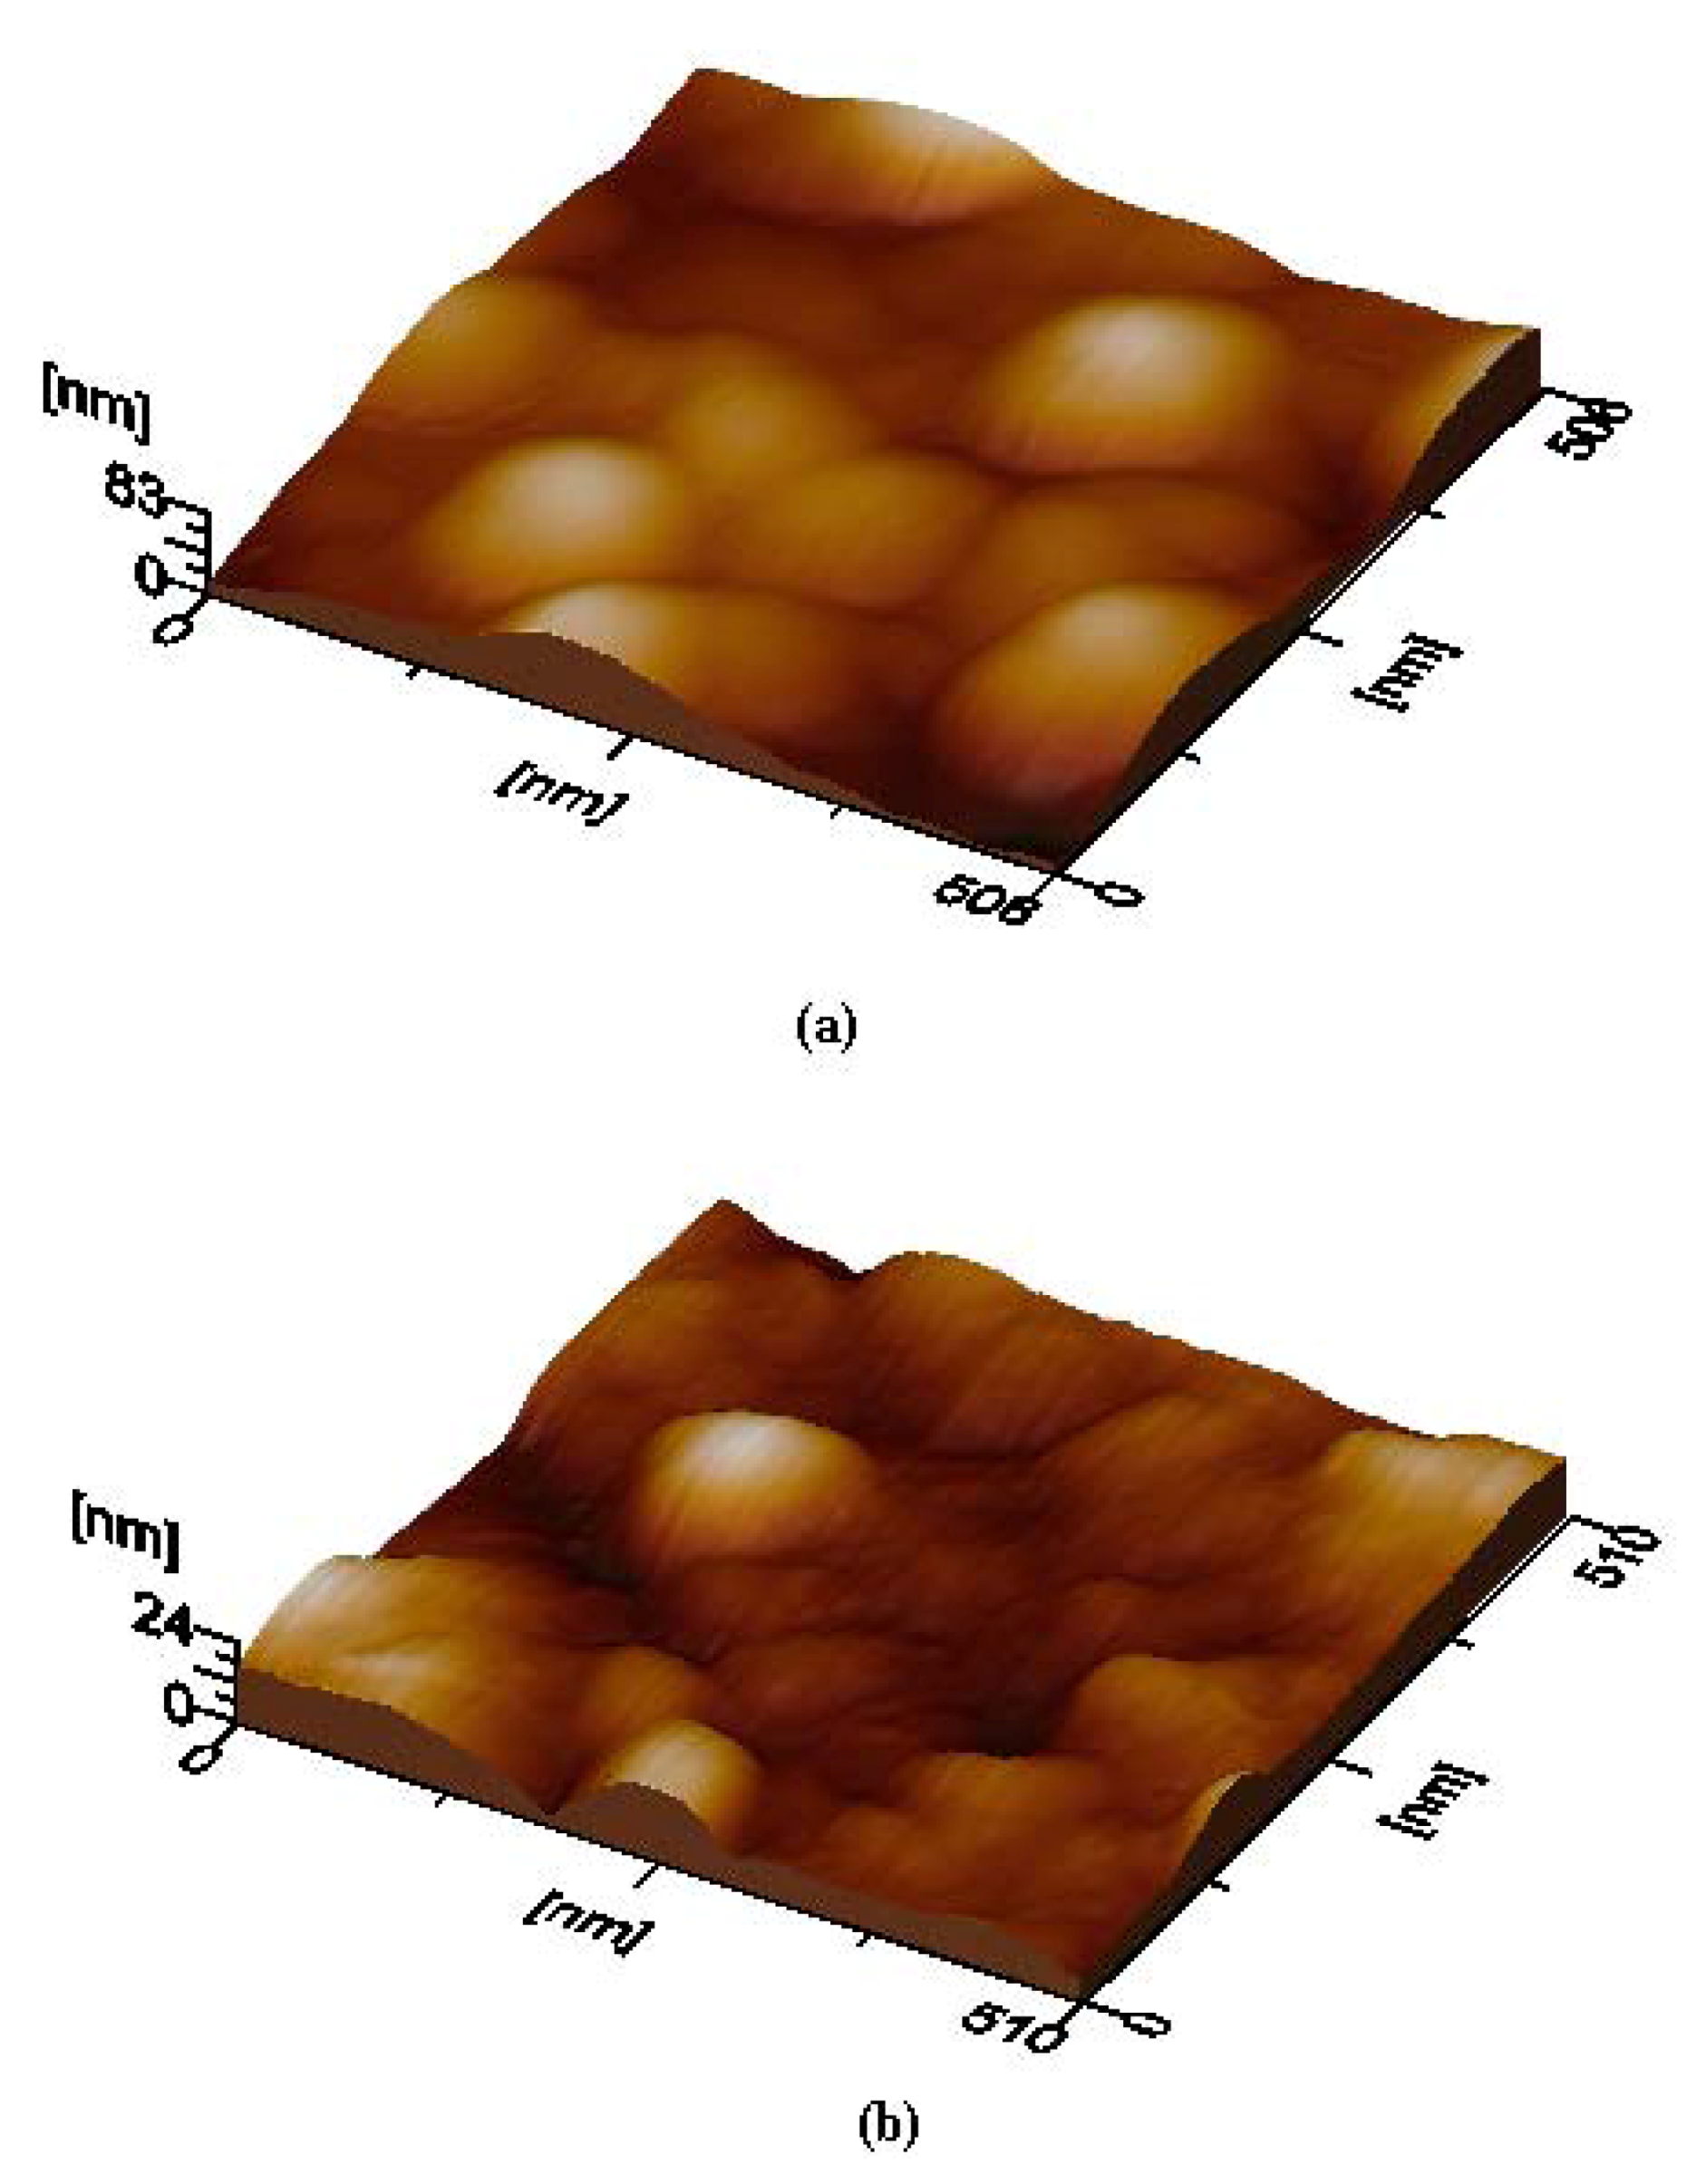
AFM is used to evaluate the surface quality of the deposited films.
Figure 4 shows 3D-micrographs obtained from the Li
2PcL1 and Li
2PcL2 thin films. In a general sense, the agglomeration of small particles in order to generate huge rounded grains with a reasonably heterogeneous distribution at large micrometric length scales may be appreciated. The root mean square (rms) roughness, as evaluated from the AFM measurements of the thin films, is 14.3 nm for Li
2PcL1 and 4.3 nm for Li
2PcL2. The difference in the roughness values may be related to the different bidentate ligand in each molecular material. It appears that the amine group in Li
2PcL2 acts as a Lewis base with a pair of available electrons. The nitrogen atom intervenes in the delocalized orbital, the aromatic ring being part of it, delocalizing the non-shared amine group electron pair within this structure. Hence, the amine group activates the aromatic ring into an oxidation state, due to the influence of electrophilic agents like oxygen in air, as well as other oxidation products, which might affect the film’s surface.
Figure 4.
3D-micrographs obtained by AFM, showing the surface morphology of thin films deposited on quartz slices from: (a) The Li2PcL1 sample and (b) sample, Li2PcL2 respectively.
Figure 4.
3D-micrographs obtained by AFM, showing the surface morphology of thin films deposited on quartz slices from: (a) The Li2PcL1 sample and (b) sample, Li2PcL2 respectively.
In order to investigate the electrical behavior of the synthesized materials, the variation of electrical conductivity as a function of temperature in thin films was evaluated. The measurement took place over a line on the material that had equal spaces between the test points. Care was taken to ensure that the current involved was low enough to prevent sample heating, together with a high input impedance voltmeter. Electrical measurements point towards a semiconductor characteristic for the two synthesized materials. From the above results, the electrical conductivity of all thin films was evaluated at 298 K (
Table 2). Such σ values lie within the semiconductor region (10
−6 to 10
1 S cm
−1) [
14]. The compound Li
2PcL2 exhibits a higher electrical conductivity at room temperature. The electric conductivity values for these films suggest that the addition of the 2,6-diaminoantraquinone favors the charge transport mechanism. It is possible that the conductive anisotropy arises from a columnar disposition of the phthalocyanine-ligand arrangement where the charge transport takes place; the conduction mechanism being mainly based upon the bidentate ligand. Apparently, the electron pair in each amine nitrogen atom becomes a donor group owing to a resonance mechanism. This, in turn, activates the molecule and generates a significant electron delocalization giving rise to a preferential direction for the electric charge transport [
3,
10].
Table 2.
Characteristic parameters of thin-films under investigation a.
Table 2.
Characteristic parameters of thin-films under investigation a.
| Sample | d1 (Å) b | Tauc Eg (eV) c | Cody Eg (eV) d | d2 (Å) b | Tauc Eg (eV) c | Cody Eg (eV) d | d3 (Å) b | Tauc Eg (eV) c | Cody Eg (eV) d | σ298 K(Scm−1) e |
|---|
| Li2PcL1 | 4049 | 1.50, 2.30 | 1.50, 2.31 | 2893 | 1.54, 2.40 | 1.50, 2.31 | 1736 | 1.55, 2.43 | 1.54, 2.34 | 2.0 × 10⁻⁵ |
| Li2PcL2 | 6447 | 1.49, 2.30 | 1.47, 2.10 | 4975 | 1.52, 2.39 | 1.49, 2.12 | 2031 | 1.55, 2.41 | 1.49, 2.12 | 4.2 × 10⁻⁵ |
Hopping is a conduction process observed in Li
2PcL1 and Li
2PcL2 thin films, similar to the conduction process in thin films of (FePc)K and triclinic PbPc [
6]. This general process is known for amorphous materials [
6,
15,
16], for which the lack of long-range order gives rise to a phenomenon known as localization in which the energy levels do not merge into one another, particularly in the region at the edges of the energy bands. The effect of this is that, in order for carriers to be transported through the material and to contribute to the conductivity, they have to proceed by a series of “hops” from one localized energy level to another. Hopping occurs between the various localized energy levels when thermal energy is available. According to Mott and Davis [
16], in this type of material the conductivity σ exhibits different behavior in different regions of its log σ
vs. 1/T characteristic. At higher temperatures thermal excitation of carriers to the band edges is possible and extended-state conductivity can take place, while at lower temperatures, where less thermal energy is available hopping may occur [
6].
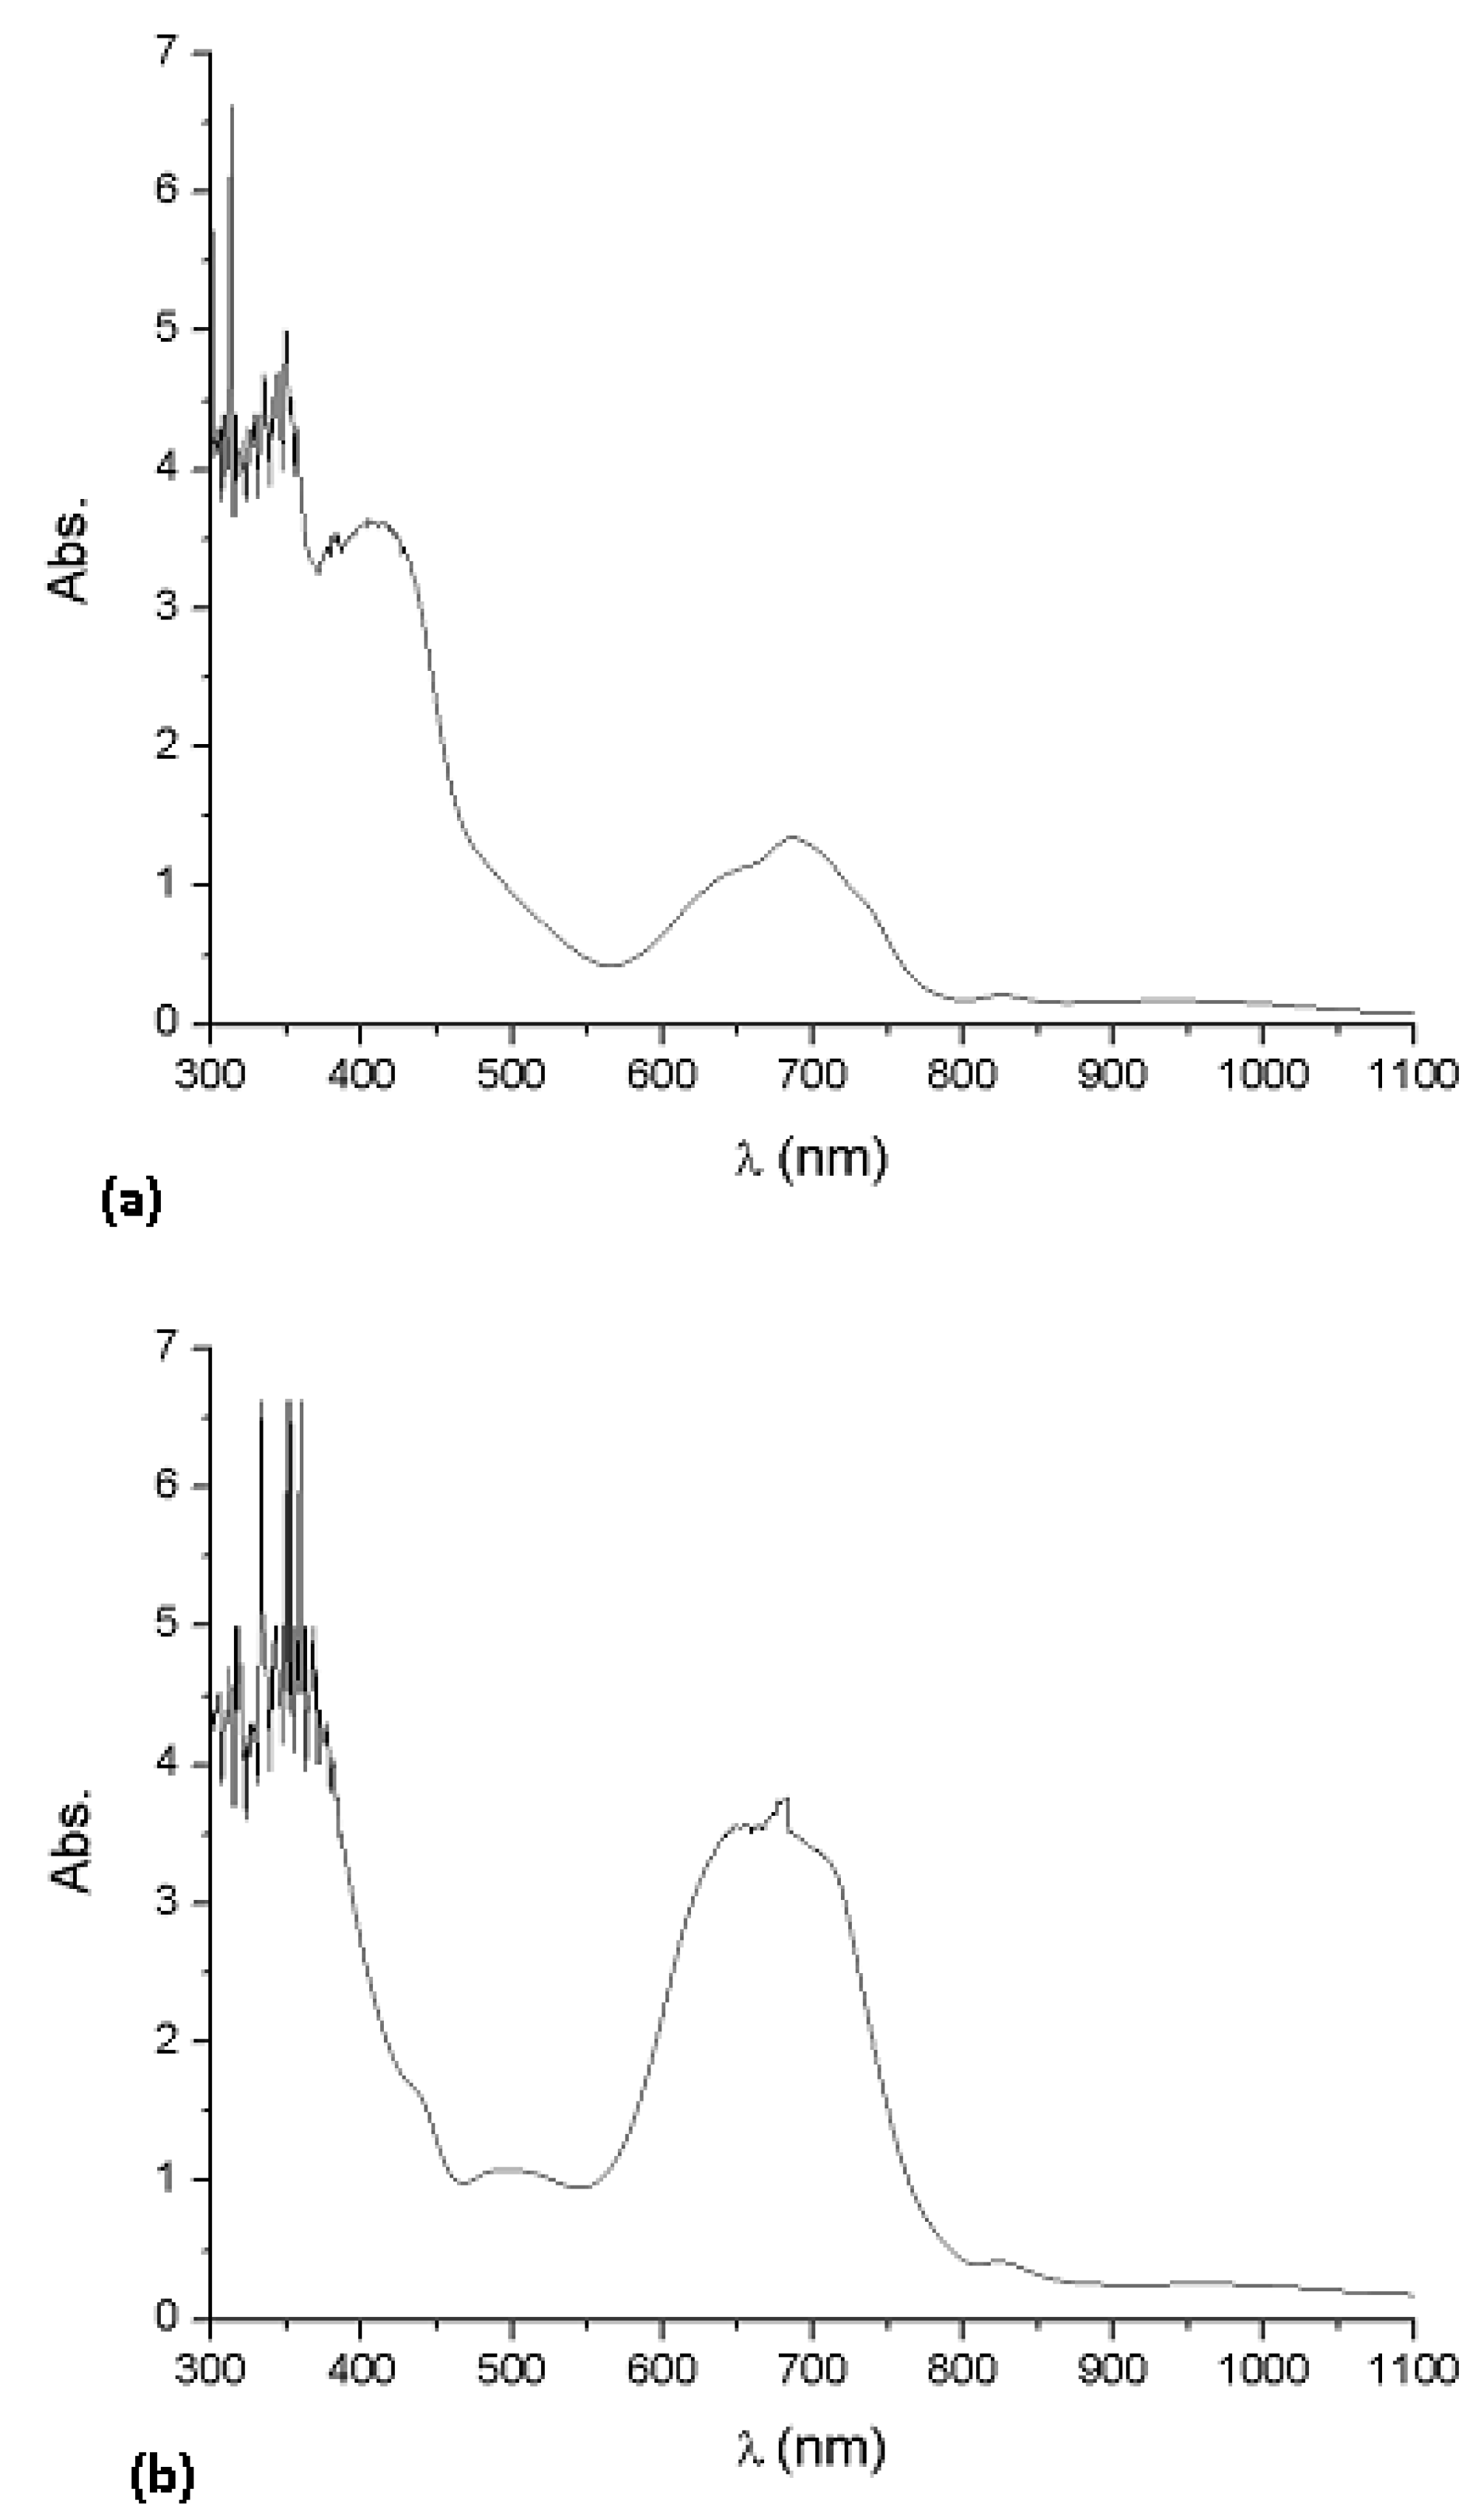
Optical absorption measurements are widely used to characterize the electronic properties of materials, through the determination of parameters describing the electronic transitions such as: band gap, valence band tails and excited state lifetime [
2]. The band gap is deduced from the ultraviolet/visible absorption spectrum of the thin films. The spectra of Li
2PcL1 and Li
2PcL2 contain intense bands in the UV and visible ranges. The absorption spectra of the deposited Li
2PcL1 and Li
2PcL2 thin films with thicknesses of 4049 Å and 6447 Å, respectively, are shown in
Figure 5. An increase of intensity of the absorption peaks, as the film thickness increases, is found. The UV-Vis spectrum observed for phthalocyanines thin films, originates from molecular orbitals within the aromatic 18π electron system and from overlapping orbitals on the central metal atoms [
13]. Li
2PcL1 and Li
2PcL2 thin films show a strong Vis band (Q band) around 656 nm and two broad near-UV bands (B or Soret bands) at 370 and 328 nm respectively, consistent with a typical closed-shell metallo phthalocyanine [
8,
17]. In a similar fashion to the MgPc thin films [
7], since the central Li metal atoms are devoid of
d electrons, the mixing between metal and ligand orbitals is negligible, so that electronic transitions take place between ligand-centered orbitals, all transitions being π–π* in nature. The bands around 370–328 nm are due to electronic transitions between molecules, having an intermediate ionic degree, which conform the synthesized molecular materials. The Q band, can be attributed to the allowed highest occupied molecular orbital (HOMO)-lowest unoccupied molecular orbital (LUMO) (π–π*) transition in the phthalocyanine ring [
18]. The maximum absorption peak in the Q band is assigned to a remote wavelength region owing to the coordination of ligand to metallic ions in the phthalocyanines. The presence of this absorption band may be interpreted as an overlap of π orbitals through the ligand.
Figure 5.
Absorption spectra of the (a) Li2PcL1 and (b) Li2PcL2 thin films for 4049 Å and 6447 Å thicknesses, respectively.
Figure 5.
Absorption spectra of the (a) Li2PcL1 and (b) Li2PcL2 thin films for 4049 Å and 6447 Å thicknesses, respectively.
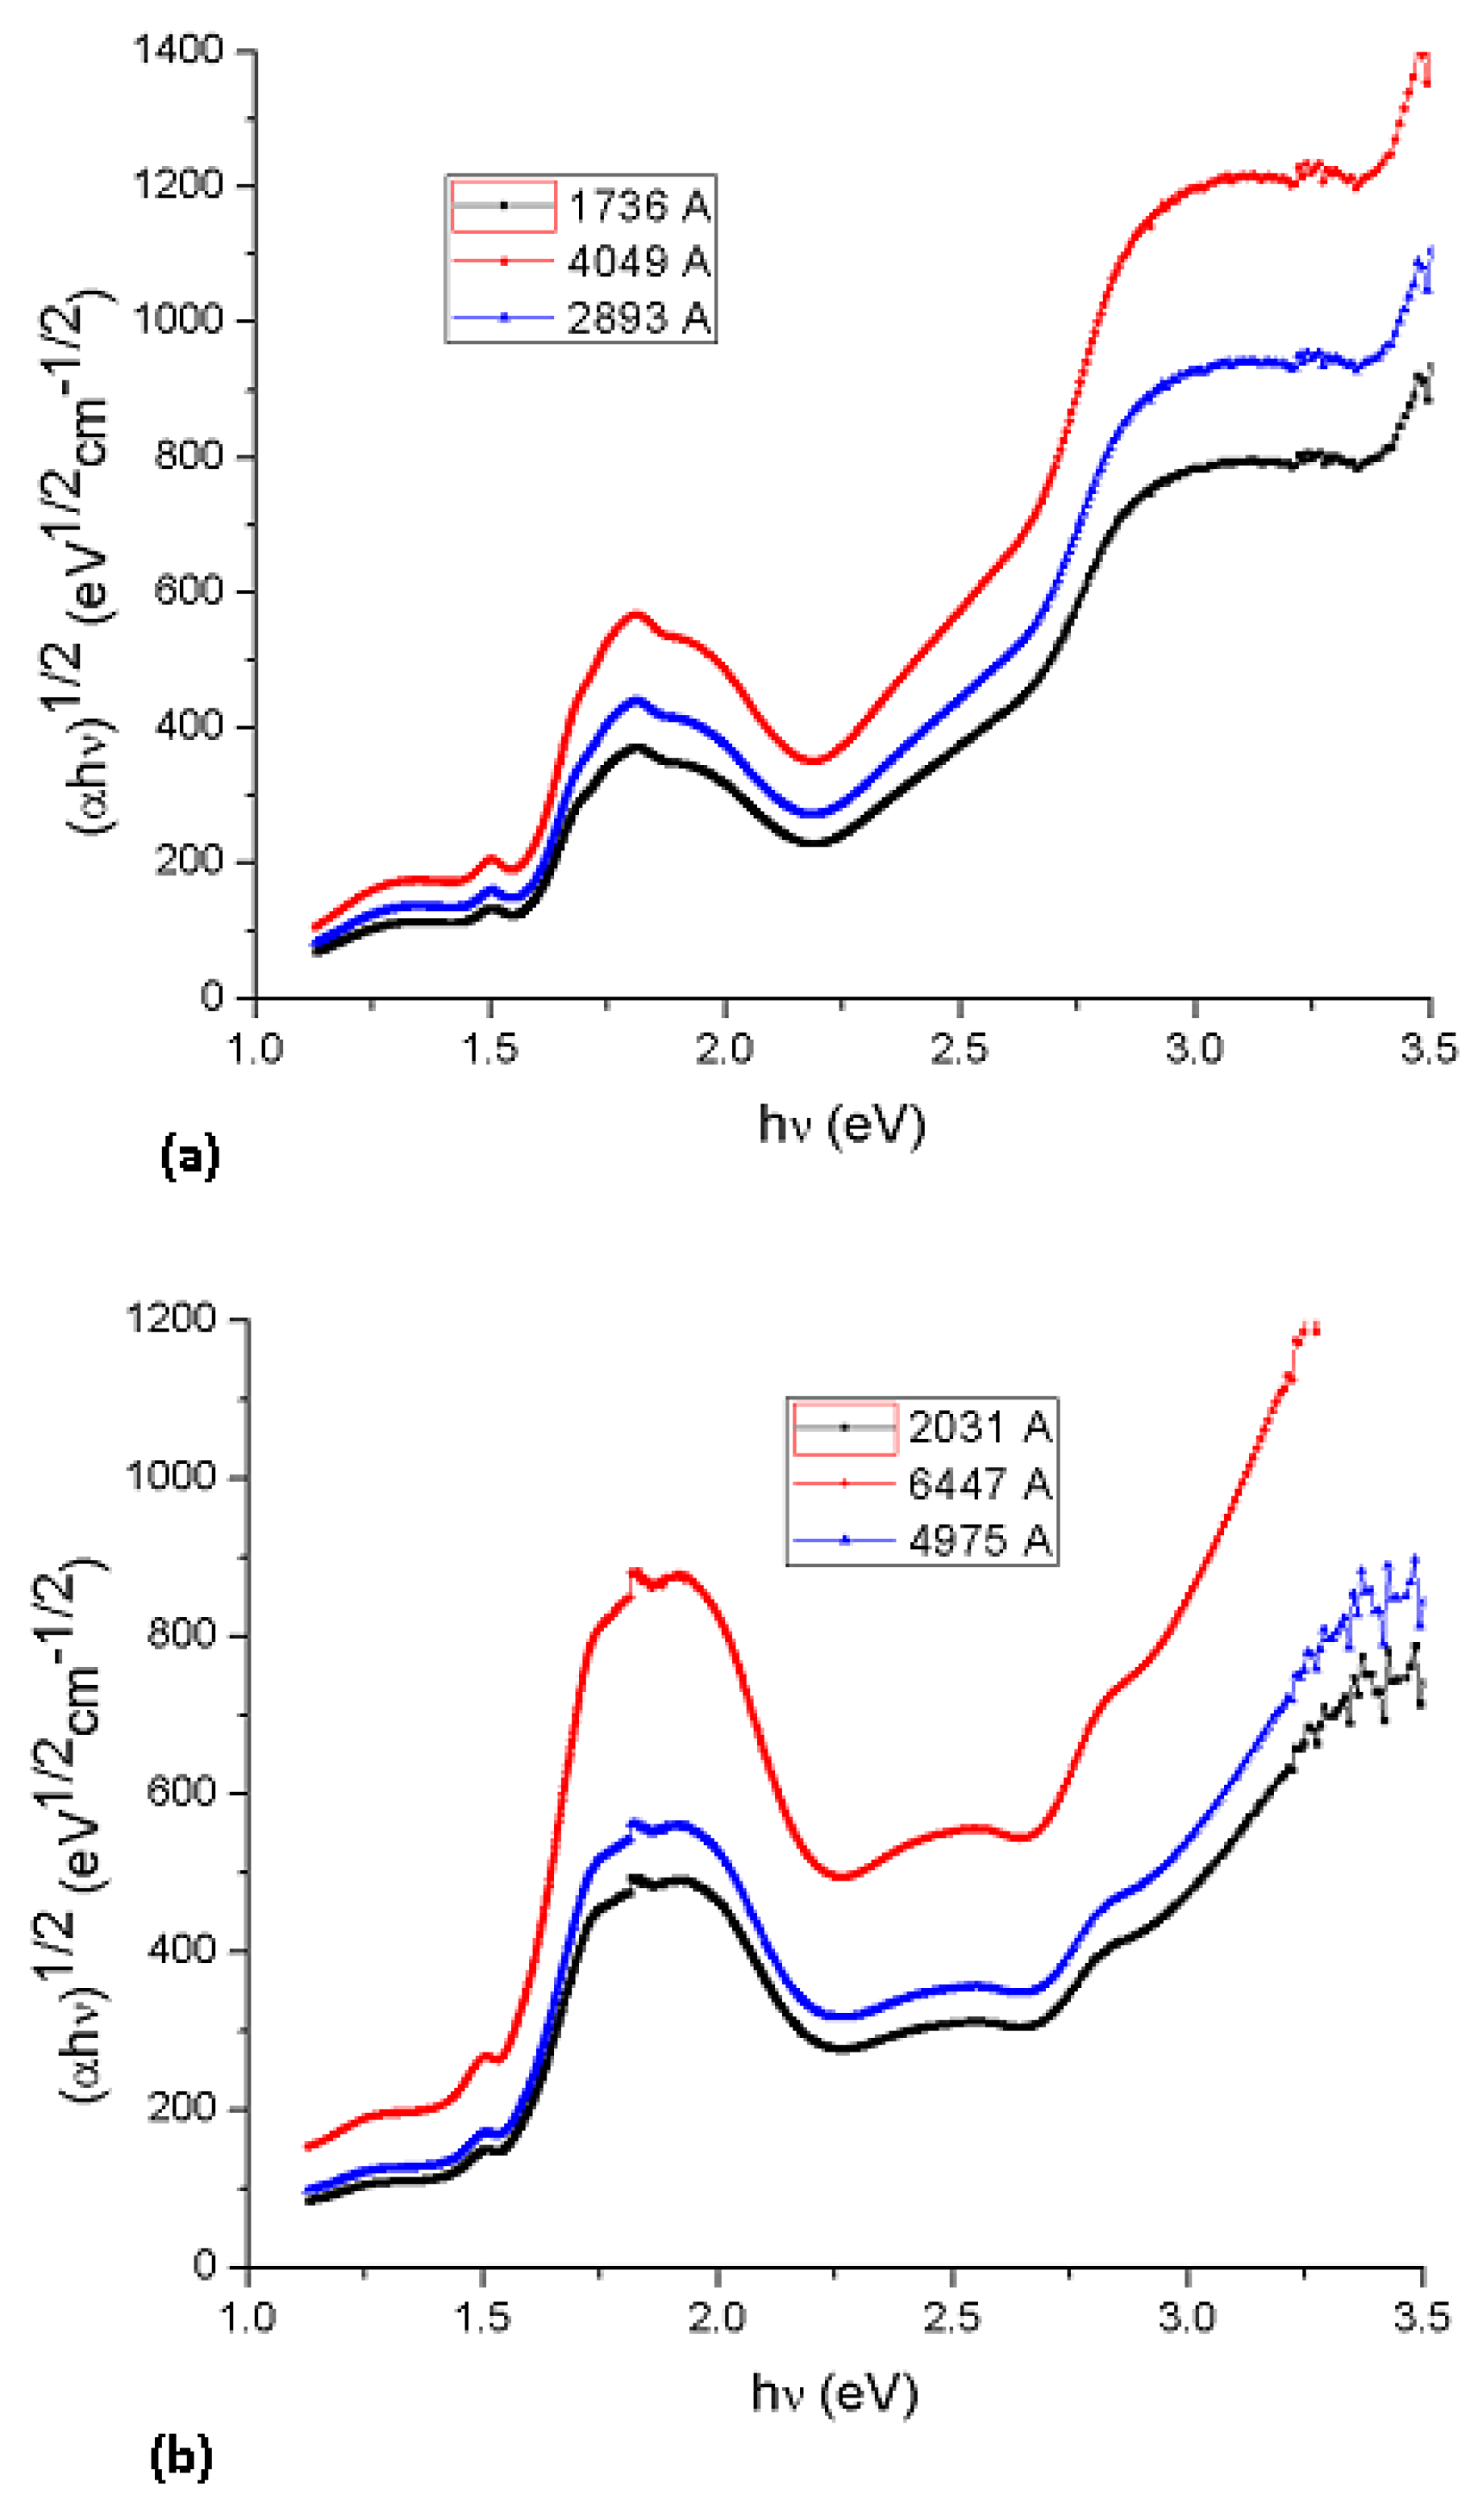
Several models are used to determine the optical properties of amorphous semiconductors. The most widespread is the Tauc model [
2] which allows us to derive the band gap energy E
g from E(ε)
1/2 as function of the incident energy E. The Tauc optical gap associated with the thin films is determined through an extrapolation of the linear trend observed in the spectral dependence of (αhν)
1/2 over a limited range of photon energies hν [
19]: the Tauc optical gap is defined as occurring at the intercept of this linear extrapolation with the abscissa axis [
1]. The absorption coefficient
α near the band edge in many amorphous semiconductors shows an exponential dependence upon photon energy usually obeying the empirical relation [
20]:
where β
−1 is the band edge parameter and
n is a number characterizing the transition process which may take values 1/2, 1, 3/2 or 2, depending upon the nature of the electronic transitions responsible for the absorption [
21]. At this point it may be recalled that, in amorphous semiconductors, optical transitions are described to a first approximation by non-direct transitions with no conservation of electronic momentum, for allowed indirect transitions
n = 2 [
22]. In order to gain some appreciation regarding how the film thickness associated with Li
2PcL1 and Li
2PcL2 influences the determination of the corresponding Tauc optical gap, consider
Figure 6, in which Tauc optical gap determination are shown for three different film thicknesses for Li
2PcL1 (4,049, 2,893 and 1,736 Å) and three film thicknesses for Li
2PcL2 (6,447, 4,975 and 2,031 Å) [
19]. Thus, the optical gaps for both indirect transitions could be determined by the extrapolation to zero of the linear regions in the (
αhυ)½ =
f(hν) plots.
Figure 6 indicates that Li
2PcL1 and Li
2PcL2 thin films have a strong absorption band around 1.5 eV and another strong band between 2.3 and 2.43 eV. Similar results were obtained for NiPc thin films [
13], the analysis of the spectral behavior revealing two indirect allowed transitions. Given the nature of the curvature, the Tauc optical gap corresponding to the thicker film is smaller than that of its thinner counterpart (see
Table 2). This increase in the Tauc optical gap associated with Li
2PcL1 and Li
2PcL2, corresponding to decreasing film thickness, has been attributed to a number of factors [
19].
Figure 6.
Plot of (αhν)1/2 vs. photon energy hν of (a) Li2PcL1 and (b) Li2PcL2 thin films.
Figure 6.
Plot of (αhν)1/2 vs. photon energy hν of (a) Li2PcL1 and (b) Li2PcL2 thin films.
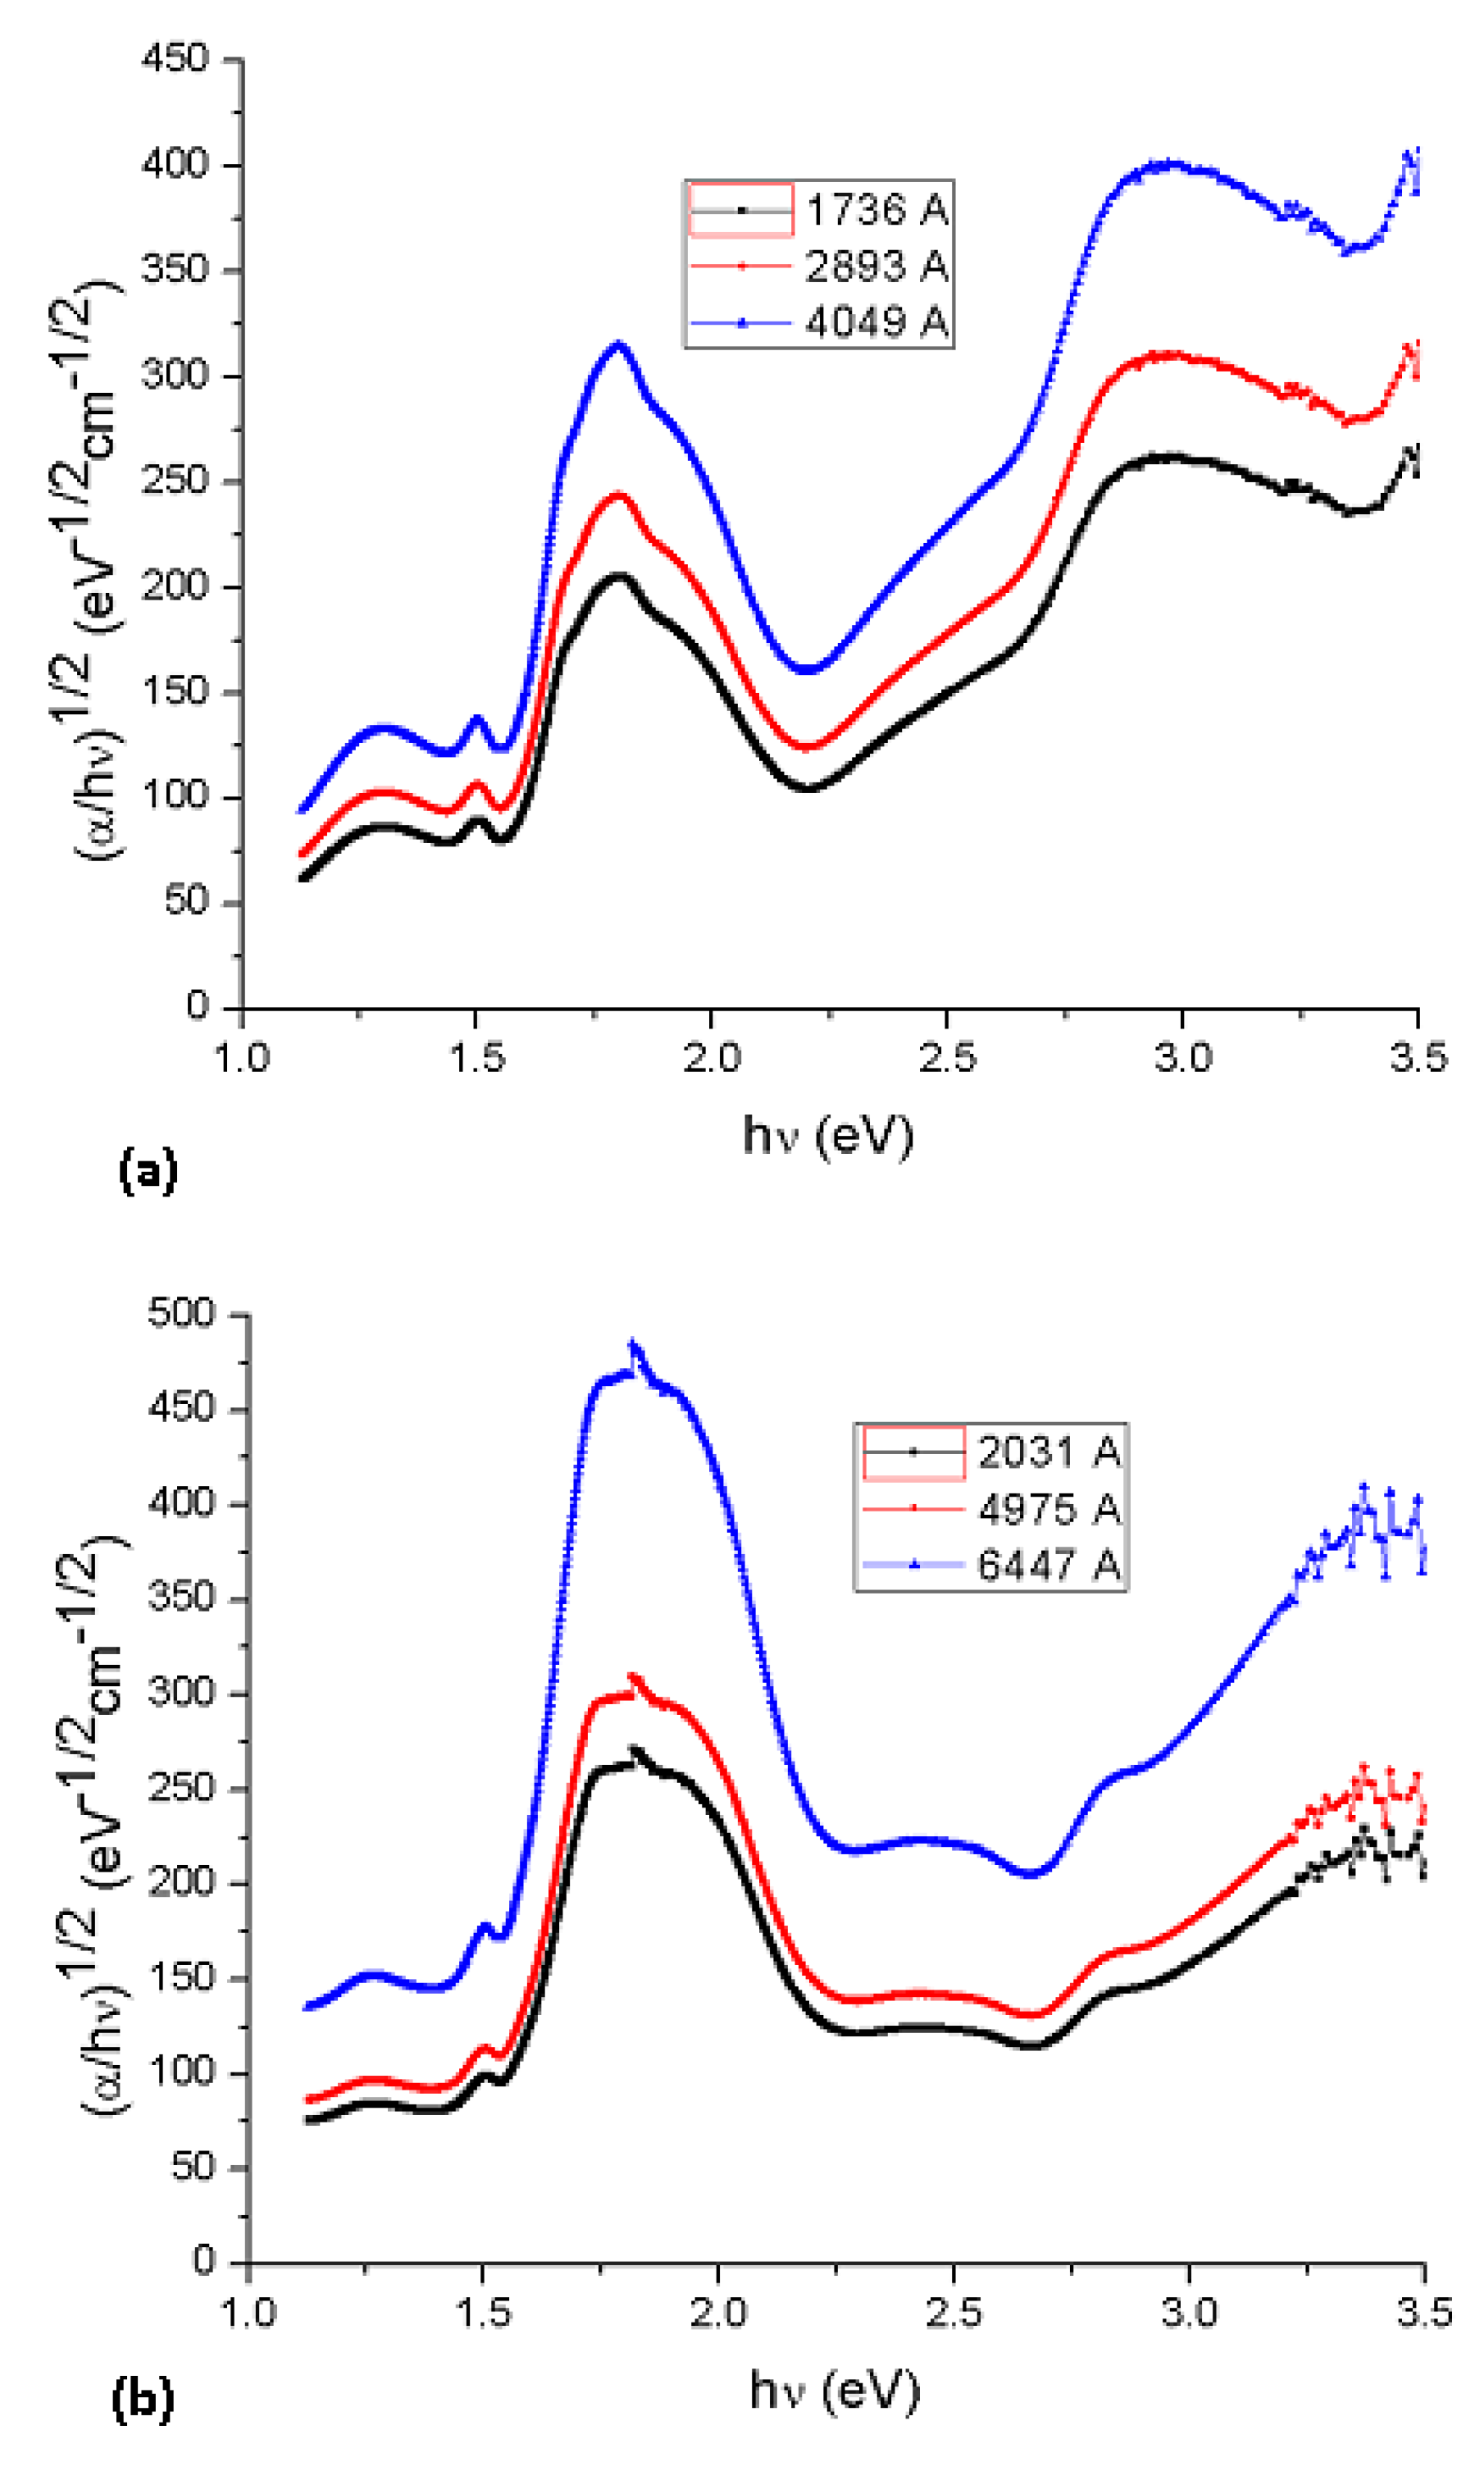
Cody
et al., hypothesize that this behavior occurs due to a fundamental curvature in the spectral dependence of (
αhυ)½ =
f(hν) which they hold responsible for the increases in the Tauc optical gap as associated to decreasing film thickness [
19]. In accordance to the model, as given by Cody
et al., the optical gap associated with Li
2PcL1 and Li
2PcL2 thin films should rather be determined by extrapolating the linear trend observed in the spectral dependence of (α/
hν)
1/2, over a limited range of photon energies. The abscissa axis intercept of this linear extrapolation, corresponding to the Cody optical gap (
Figure 7) on the thickness of the film, became negligible. Cody plots exhibit a much milder curvature than their Tauc counterparts and much milder dependence in the gap associated with Li
2PcL1 and Li
2PcL2 thin films thickness than for the case of the Tauc optical gap [
19]. Tauc assumes that the momentum matrix element is independent of the photon energy, Cody suggests, instead, that the dipole matrix element is actually independent of the photon energy.
Table 2 shows optical gap determinations for Cody model. Even though differences in terms of the activation energy may be perceived in the graphs, similar values may be observed by comparing the results arising from the Tauc and the Cody models. If the measurement error range is taken into account, it may be concluded that these differences are really not important so that any of the two models may be used for calculating the activation energy of organic semiconductors.
Figure 7.
Plot of (α/hν)1/2 vs. photon energy hν of (a) Li2PcL1 and (b) Li2PcL2 thin films.
Figure 7.
Plot of (α/hν)1/2 vs. photon energy hν of (a) Li2PcL1 and (b) Li2PcL2 thin films.
In amorphous semiconductors, the optical transitions are dominated, to a first approximation, by the so-called indirect transitions. In these electronic transitions from states in the valence band to states in the conduction band, there is no conservation of the electronic momentum [
23]. An alternative explanation may be reached considering the generation of Frenkel-type, tightly-bound excitons [
24]. It has been observed [
23] that significant charge localization in organic molecular materials leads to a significant difference between the size of the optical gap and the size of the transport gap, which corresponds to the formation energy of a separated free electron and a hole. Whereas the optical gap can be measured by optical absorption spectroscopy, the transport gap can be measured by ultraviolet or inverse photoemission spectroscopy, the latter one being larger than the former by a quantity equal to the binding energy of the Frenkel exciton.


