2.2. Crystallization and Melting Behavior
The most important aspect of the physical properties of oils and fats is related to their melting and crystallization behavior [
11]. If crystallization conditions changed, crystal habit, crystal size and crystal numbers would be influenced. These changes will eventually be reflected in the product performance. In order to study the physical properties of PS and PO, their crystallization and melting behaviors were analyzed by DSC and shown in
Figure 1 and
Figure 2.
Figure 1.
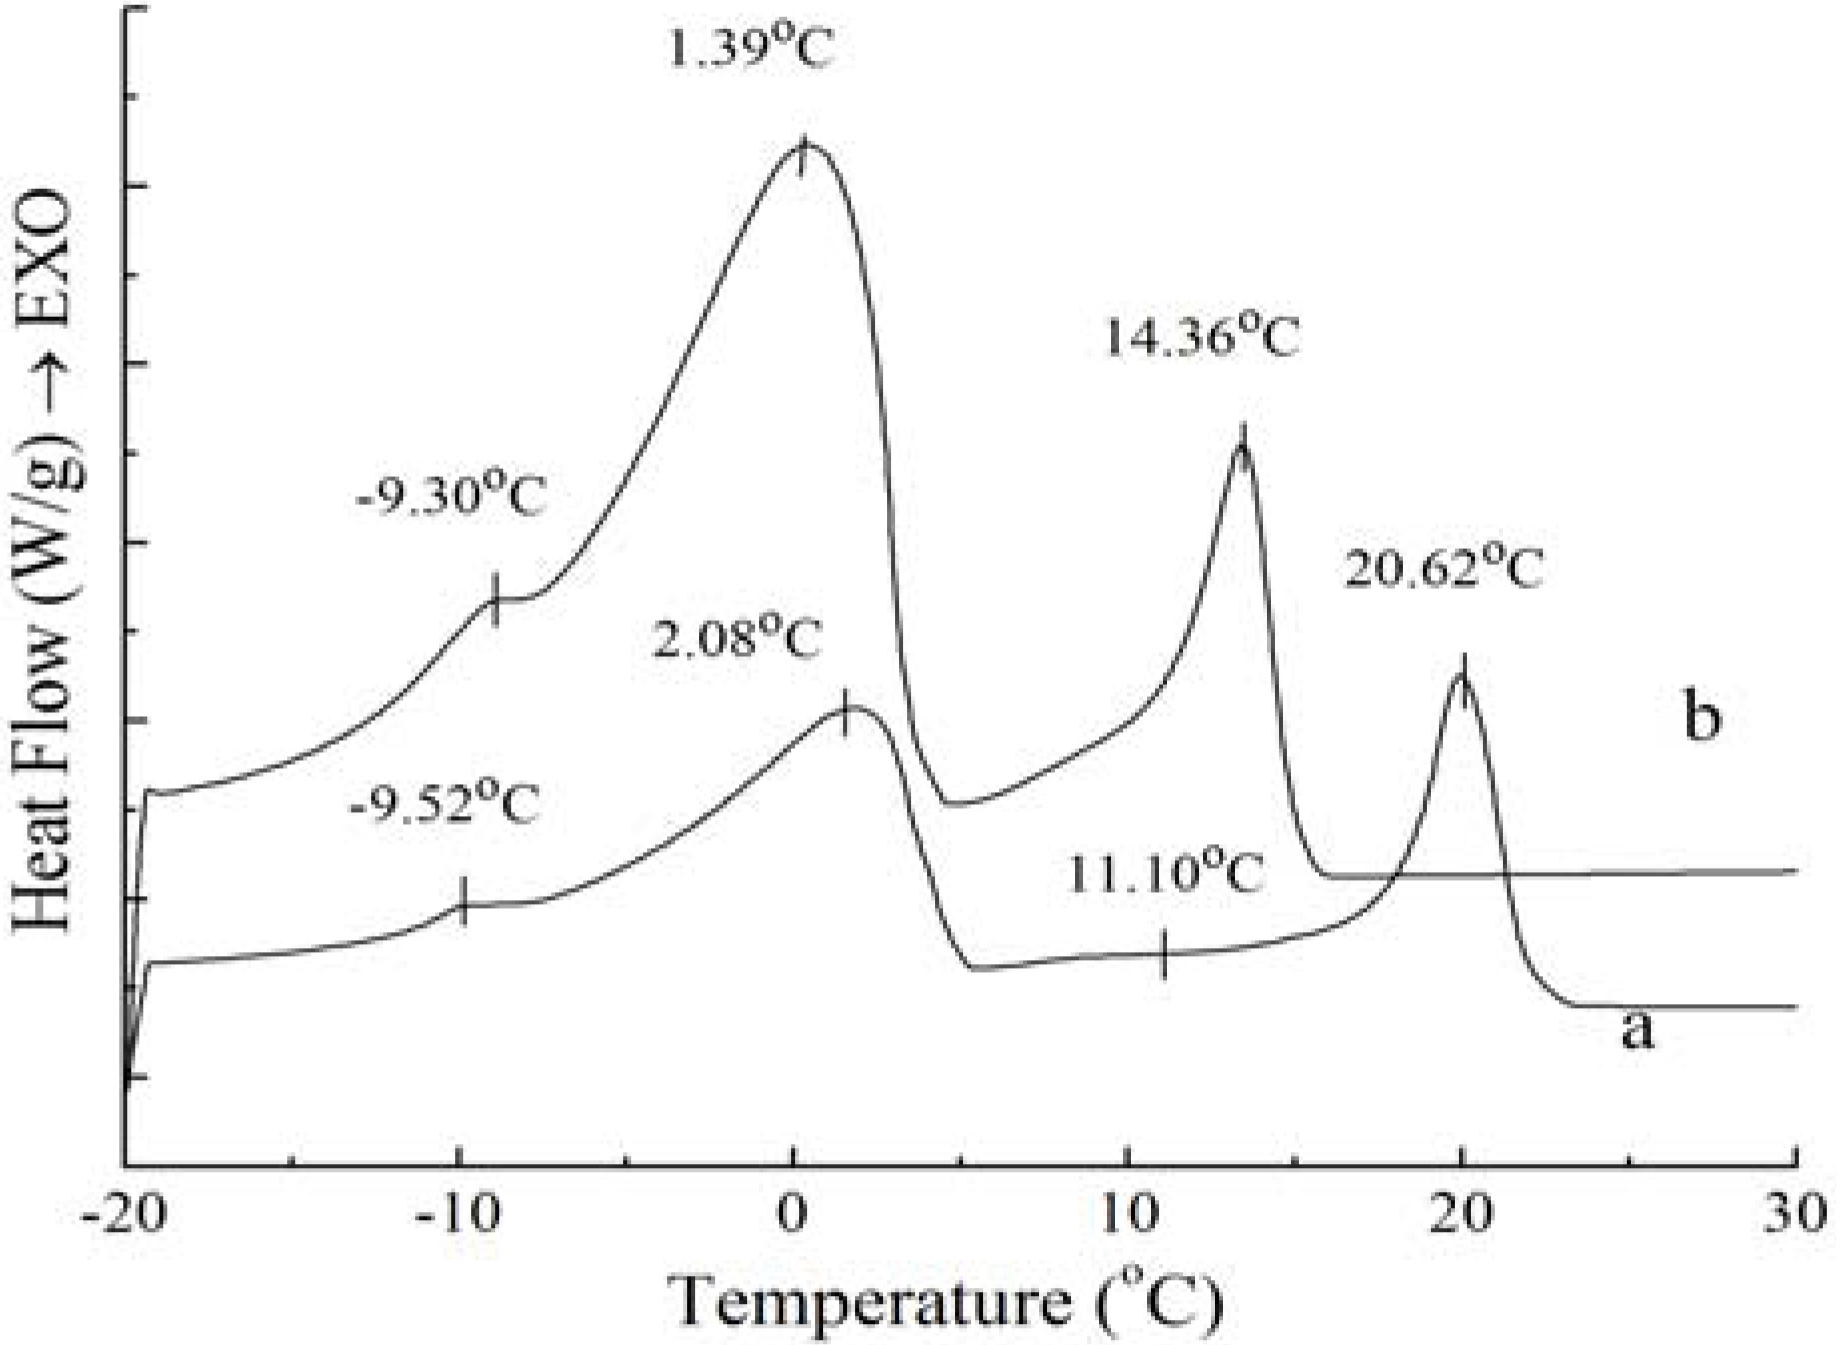
Crystallization curves of PS (a) and PO (b).
Figure 1.
Crystallization curves of PS (a) and PO (b).
Figure 2.
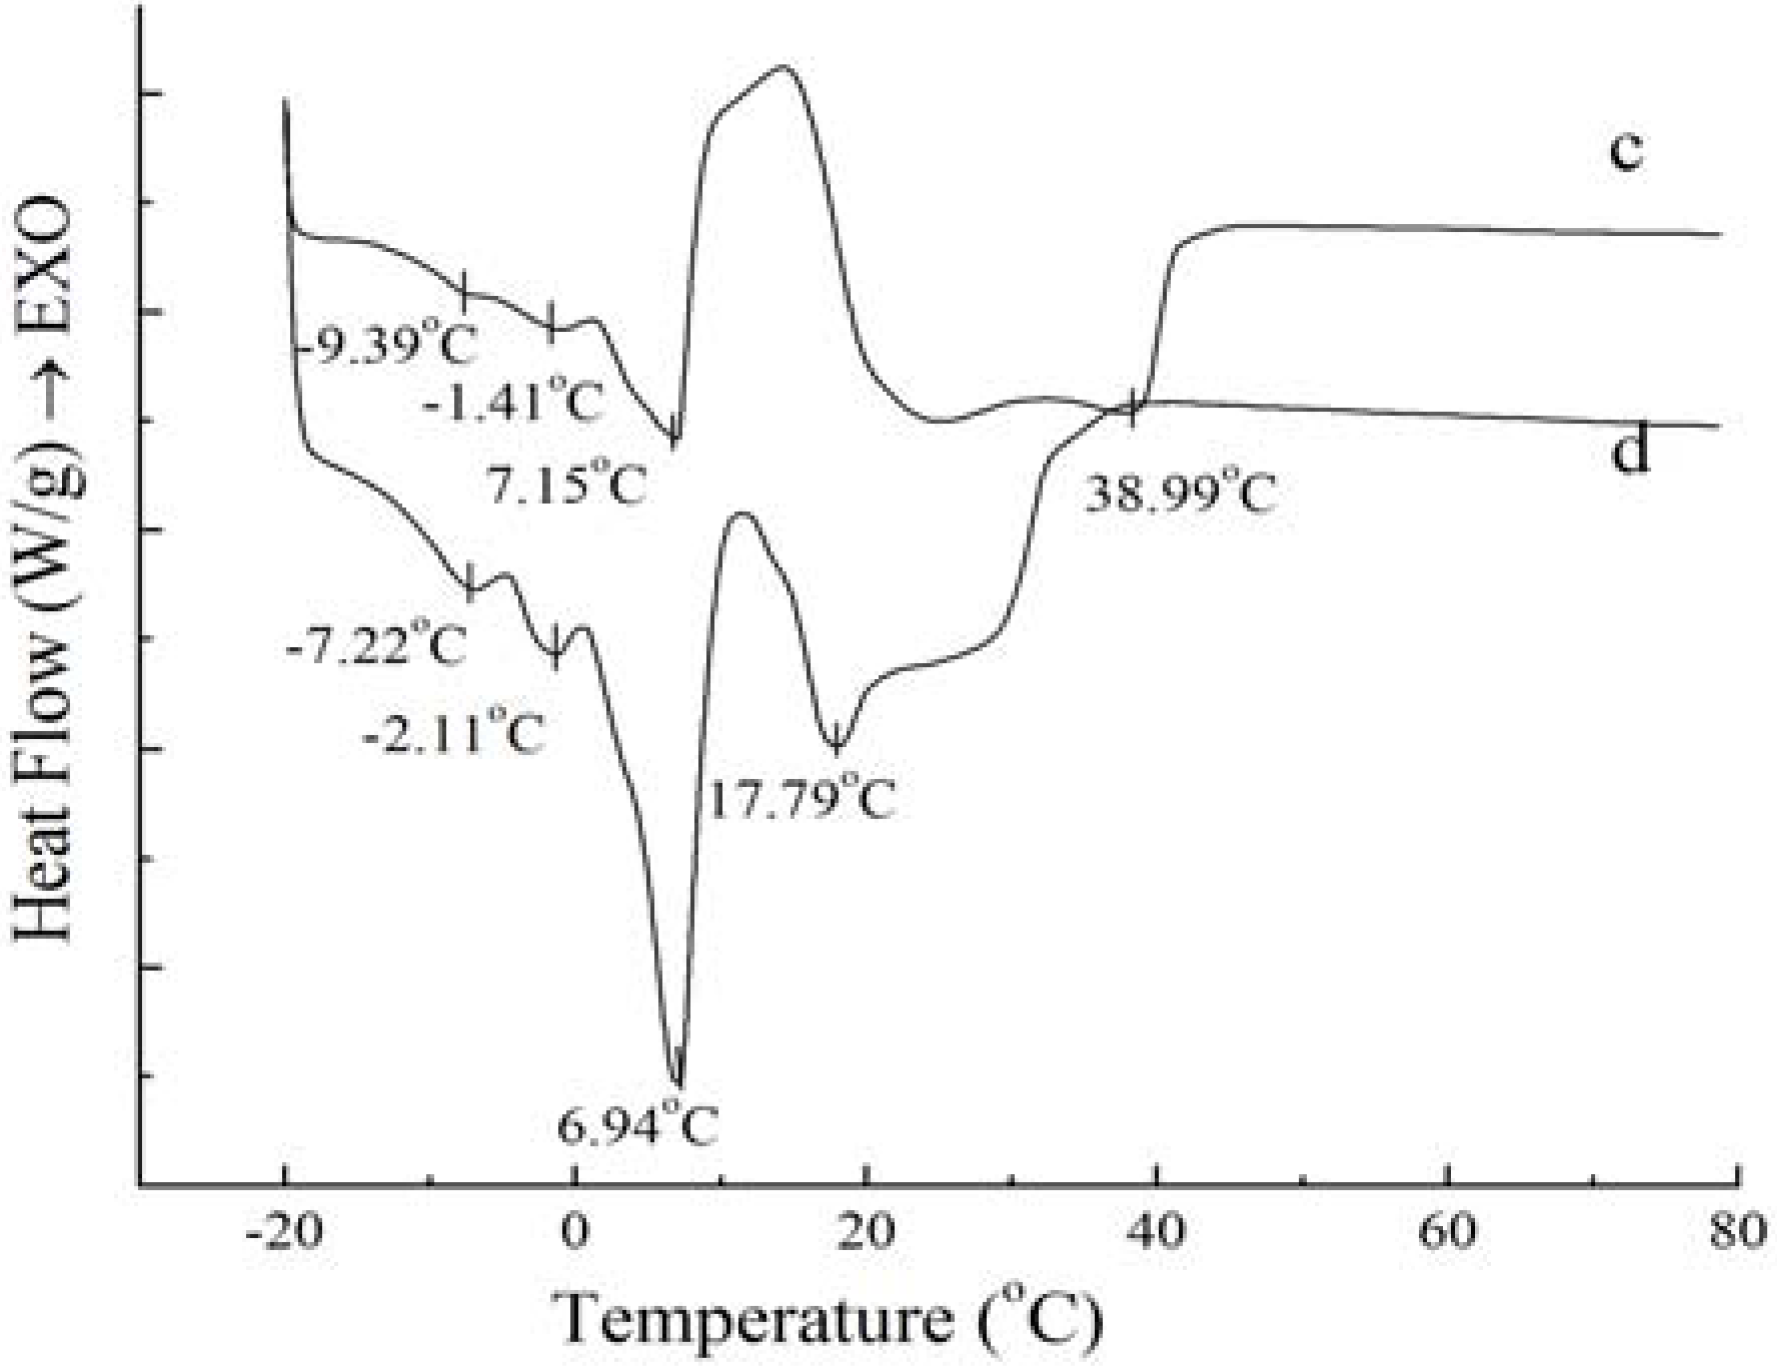
Melting curves of PS (c) and PO (d).
Figure 2.
Melting curves of PS (c) and PO (d).
As
Figure 1 shows, exothermic peak changes appear during the crystallization process, which may be due to polymorphic changes. In the crystallization profiles for PS and PO samples, three similar exotherms emerged, indicating that these two samples had similar crystallization thermodynamics. The crystallization profile is characterized by the beginning of fat crystal formation, which is related with the rearrangement of molecules due to the presence of high saturated TAGs, and the end of crystallization, which is generally reflected by aggregation and compaction of molecules [
11]. The peak temperature and the required enthalpy variations of crystallization thermograms of PS and PO with 5 °C/min have been calculated, the exotherms temperature and enthalpy variations of the four peaks of PS are −9.52 ± 0.08 °C and 0.37 ± 0.10 J/g, 2.08 ± 0.08 °C and 21.93 ± 0.37 J/g, 11.10 ± 0.06 °C and 0.12 ± 0.01 J/g, 20.62 ± 0.44 °C and 15.76 ± 0.42 J/g, when those of PO come to −9.30 ± 0.12 °C and 0.34 ± 0.09 J/g, 1.39 ± 0.11 °C and 19.12 ± 0.32 J/g, 14.36 ± 0.35 °C and 8.51 ± 0.32 J/g. Exothermic peaks of PO were sharper compared to those of PS; this was due to the fact that the TAG distribution of PO was not as broad as that of PS. The temperatures and enthalpy variations of the two main exothermic peaks of PS were higher than those of PO. In essence, as the melt is cooled from above the crystallization temperature to below the crystallization temperature, it can be explained by the reason that there are more higher melting components in PS and more less melting components in PO. It can clearly be seen that the higher melting component exhibit more rapid crystallization. These results are in accordance with those reported for palm oil samples [
12]. Tan and Che Man [
11] and Saadi
et al. [
13] have reported that the exothermic thermogram was affected only by the chemical composition of the oil and not by primary crystallization state, and the changes in the temperature transition of cooling thermograms display the behaviour of triacylglycerols contents as principal feature. The peak temperature of SUS(S- saturate fatty acid; U- unsaturated fatty acid)TAGs and SSS TAGs was −11.22~−1.69 °C and 13.72~27.64 °C when the cooling rate was 5 °C /min for the crystallization process studied by Che Man [
12]. According to
Figure 1, it can be obtained that the exothermic peaks of PS and PO corresponded with those for SSS TAGs and SUS TAGs.
Figure 2 shows that the melting curves are more complicated than the crystallization curves, being broad and overlapping. The broadening effects between the four peaks were due to the broad TAG distribution of the samples [
14]. The melting peaks are multiple and irregular with four endotherms in
Figure 2. According to Fredrick
et al. [
15], the melting profiles gave an indication of the amount of crystallized fat and the occurrence of polymorphic transitions. For
Figure 2, the complexity of the melting curves shows there are different amount of crystallized fat and several types of homogeneous polycrystalline of PS and PO. The peak temperature and the required enthalpy variations of melting thermograms of PS and PO with 5 °C/min have been calculated. The peak temperature and the enthalpy variations of PS are −9.39 ± 0.12 °C and 0.19 ± 0.05 J/g, −1.41 ± 0.14 °C and 0.69 ± 0.08 J/g, 7.15 ± 0.12 °C and 13.06 ± 0.21 J/g, 38.99 ± 0.35 °C and 67.61 ± 0.48 J/g , while those of PO come to −7.22 ± 0.18 °C and 0.50 ± 0.11 J/g, −2.11 ± 0.09 °C and 0.66 ± 0.10 J/g, 6.94 ± 0.07 °C and 10.53 ± 0.24 J/g, 17.79 ± 0.11 °C and 14.66 ± 0.18 J/g. According to Kawamura [
9], the different type of homogeneous polycrystalline presented with different enthalpy variations. Garti
et al. [
16] studied the role of emulsifier on the stabilization of the β' form and found that the first peak of the heating thermogram corresponded to the melting of the α form, while the last peak corresponded to the melting of the β form, and the intermediate peak indicated the melting of the β' form. Also, Che Man and Swe [
17] found that the low-temperature peaks represented polymorphs β
2' and α, while the high-temperature peaks represented polymorphs β
1' and β
1 according to the heating curves of refined, bleached and deodorized palm oil. Busfield and Proschogo [
5] analyzed from the heating thermogram that the structures of palm stearin were α, β', and β. Che Man [
12] have studied the heating thermogram of palm oil and palm stearin and pointed out that the peaks of PS around 39.2 °C and 6.9 °C represented polymorphs β
1’ and α, the peaks of PO around 19.4 °C and 6.2 °C represented polymorphs β
1' and α, and the other peaks at the temperature below 0 °C could not be confirmed the polymorphs. Consequently, it can be proved that there were different types of homogeneous polycrystalline PS and PO for this study.
Figure 2 also demonstrates that the endothermic peaks of PO were sharper compared to those of PS. When the temperature was lower than 10 °C, the endothermic peaks of PO were larger than those of PS, indicating that there was more low-melting fatty acids in PO. When the temperature ranged from 17 °C to 40 °C, the endothermic peaks of PS were larger than those of PO, which was consistent with the higher content of high melting crystallized fat in PS.
2.3. Thermal Behavior with Different Cooling Rates
DSC crystallization profiles and data under different cooling rates are summarized in
Figure 3 and
Figure 4. The scanning rate was 1, 5, 10, 15, 20 °C/min, respectively. The curves in
Figure 3 are similar with those in
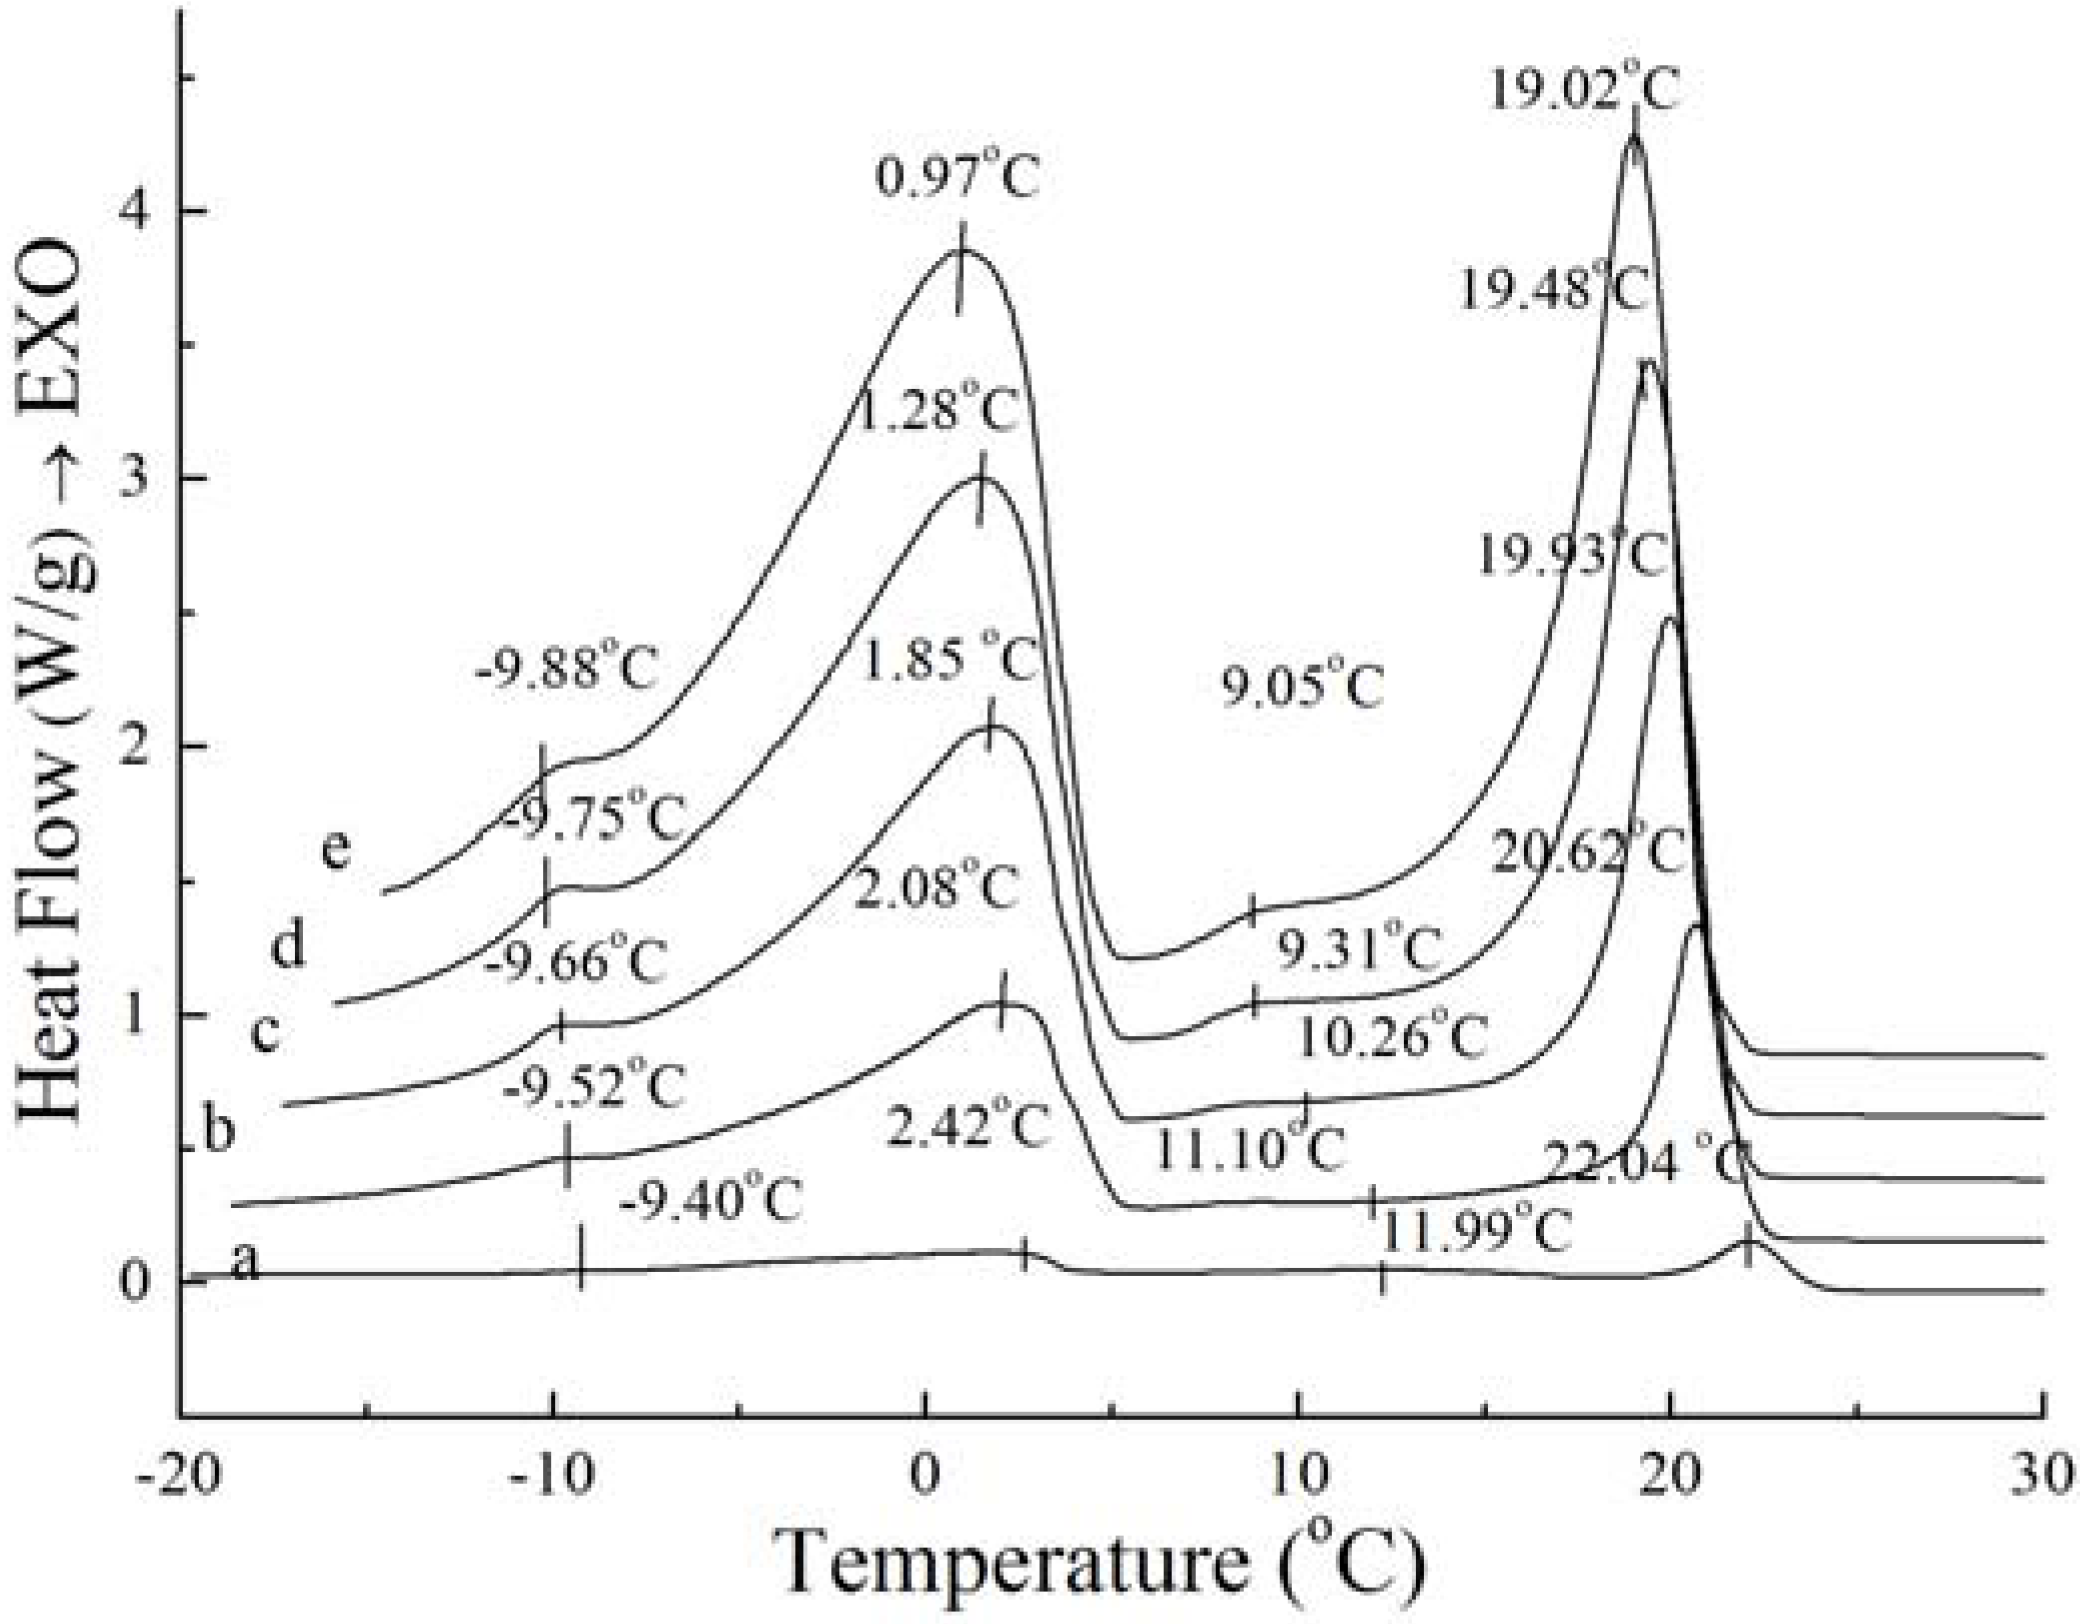
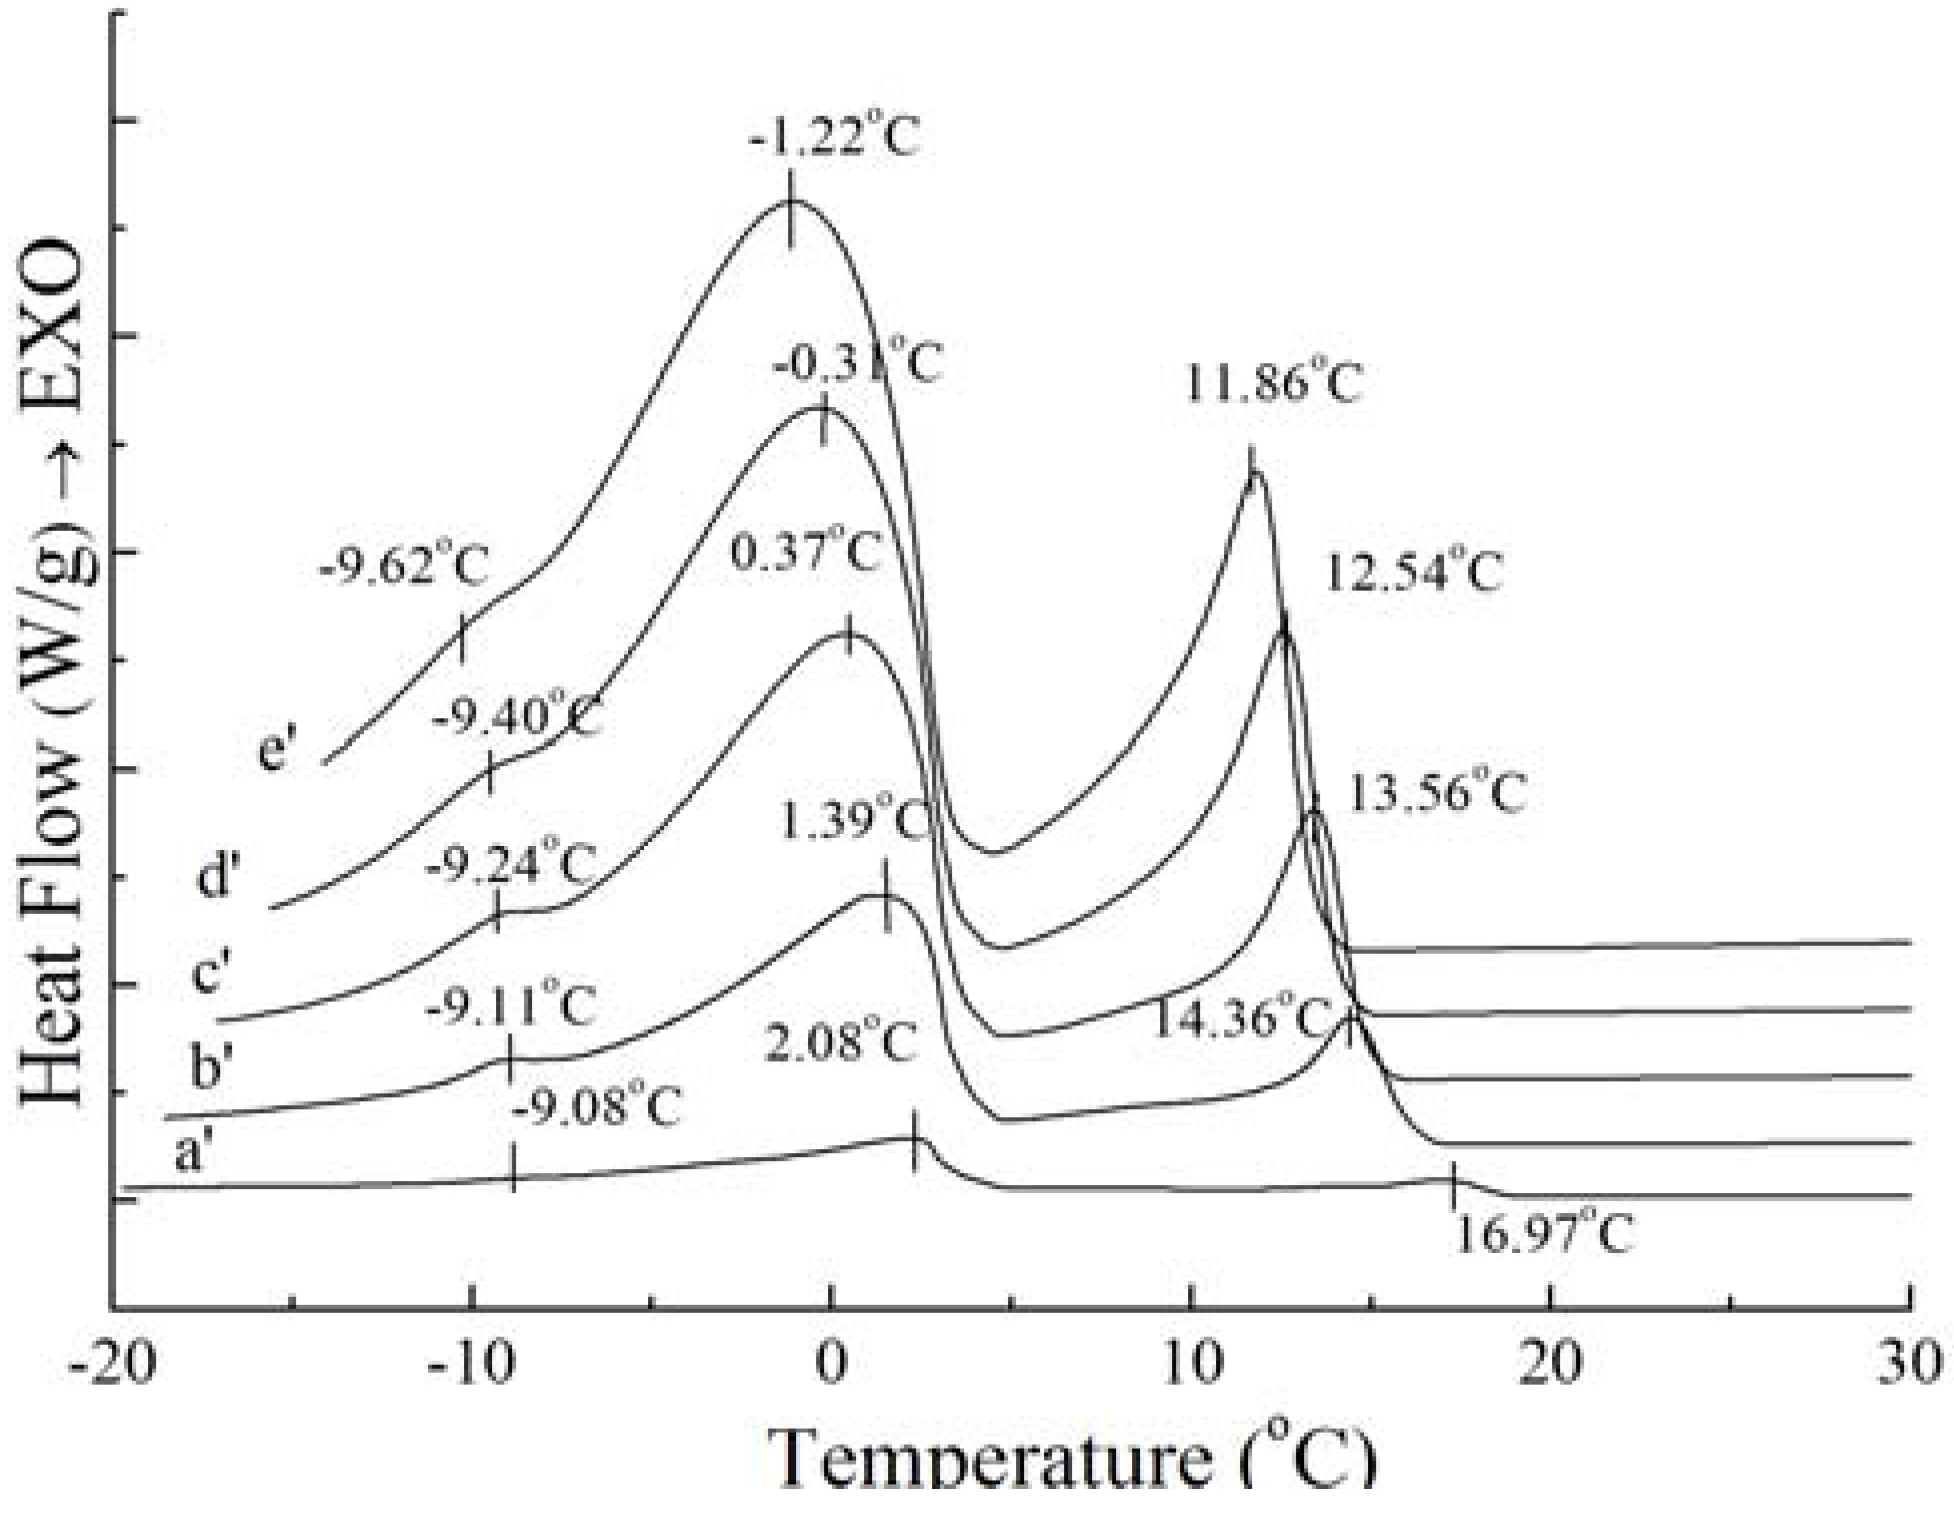
Figure 4, so it can be considered that PS and PO have similar crystallization profiles changing with the cooling rate. From the figures, it can be seen that the position of the exotherms is dependent on the cooling rate, while the amount of the exotherms is independent on the cooling rate. The crystallization exotherms came to lower temperature as the cooling rates increasing. Also, the crystallization exotherms got broadened with the cooling rate increasing. For PS, two small exothermic peaks and two big sharp exothermic peaks can be seen in the range of 1 °C/min to 20 °C/min, when there is one small exothermic peak and two big sharp exothermic peaks in PO (
Figure 3 and
Figure 4), it may be caused by the dependence of the heat history of crystallization process. These results are in accordance with the study reported for milk fat and lard [
18]. It may correspond to the differential crystallization of higher melting TAGs firstly and lower melting TAGs secondly. When the crystallization process is slow, TAGs of similar chain lengths have time to associate with each other, co-crystallize, and fractionate. As the cooling rate increases, so does the rate of crystallization. As the system is crystallized rapidly, higher melting TAGs will be rapidly undercooled and initially crystallized, developing a solid within the liquid phase [
19], and the polymer chains which come into crystalline lattice require a certain “relaxation” time, resulting in a “lag period” compared to the cooling process and it increases with cooling rate increasing [
20]. In addition, this is accompanied by a rapid increase in viscosity, thus heat transfer and mass transfer may be limited. Lower mobility of molecular chain prevented rearrangement of the crystal, thus forming unstable crystal.
Figure 3.
Crystallization curves with different cooling rate of PS: 1 °C/min (a), 5 °C/min (b), 10 °C/min (c), 15 °C/min (d), 20 °C/min (e).
Figure 3.
Crystallization curves with different cooling rate of PS: 1 °C/min (a), 5 °C/min (b), 10 °C/min (c), 15 °C/min (d), 20 °C/min (e).
Figure 4.
Crystallization curves with different cooling rate of PO: 1 °C/min (a'), 5 °C/min (b'), 10 °C/min (c'), 15 °C/min (d'), 20 °C/min (e').
Figure 4.
Crystallization curves with different cooling rate of PO: 1 °C/min (a'), 5 °C/min (b'), 10 °C/min (c'), 15 °C/min (d'), 20 °C/min (e').
Although the amount and shape of exothermic peaks for PS and PO in crystallization curves at different cooling rates are similar, the height and width of these peaks are quite different between PS and PO. The peak temperature and the required enthalpy variations of the main two big sharp peaks of PS and PO with different cooling rate have been calculated in
Table 2. As
Table 2 shows, all of temperatures of the main two exothermic peaks of PS and enthalpy values were higher than those of PO at the same cooling rate. This meant that PS was more easily crystallized with existing saturated TAGs. Crystallization at slow cooling rates gave more time to allow interactions between TAGs. The observed exothermic peak was attributed to the crystallization from transition of the saturated TAG. For PS and PO, with the cooling rate decreased, crystallization temperature of the peaks shifted to higher temperature while the enthalpy values became lower. Both enthalpy values of PS and PO provide a good expression on enthalpy requirements during interactions. This event was possibly attributed to the saturated TAGs.
Table 2.
Peak temperature(Tp)and enthalpy variation(∆Hc) of PS and PO with different cooling rate.
Table 2.
Peak temperature(Tp)and enthalpy variation(∆Hc) of PS and PO with different cooling rate.
| Sample | Dc (°C/min) | Peak I | Peak II |
|---|
| | | Tp (°C) | △Hc (J/g) | Tp (°C) | ∆Hc (J/g) |
|---|
| PS | 1 | 22.04 ± 0.25 | 9.74 ± 0.65 | 2.42 ± 0.11 | 13.78 ± 0.23 |
| 5 | 20.62 ± 0.44 | 15.76 ± 0.42 | 2.08 ± 0.08 | 21.93 ± 0.37 |
| 10 | 19.93 ± 0.27 | 16.20 ± 0.12 | 1.85 ± 0.16 | 23.59 ± 0.35 |
| 15 | 19.48 ± 0.11 | 16.18 ± 0.33 | 1.28 ± 0.04 | 24.93 ± 0.28 |
| 20 | 19.02 ± 0.21 | 17.02 ± 0.35 | 0.97 ± 0.07 | 25.30 ± 0.19 |
| PO | 1 | 16.97 ± 0.28 | 4.78 ± 0.19 | 2.08 ± 0.05 | 11.47 ± 0.25 |
| 5 | 14.36 ± 0.35 | 8.51 ± 0.32 | 1.39 ± 0.11 | 19.12 ± 0.32 |
| 10 | 13.56 ± 0.24 | 8.53 ± 0.28 | 0.37 ± 0.04 | 19.73 ± 0.19 |
| 15 | 12.54 ± 0.37 | 8.26 ± 0.15 | −0.31 ± 0.03 | 21.68 ± 0.27 |
| 20 | 11.86 ± 0.14 | 7.98 ± 0.22 | −1.22 ± 0.10 | 24.26 ± 0.65 |
2.4. Isothermal Crystallization Curves by pNMR
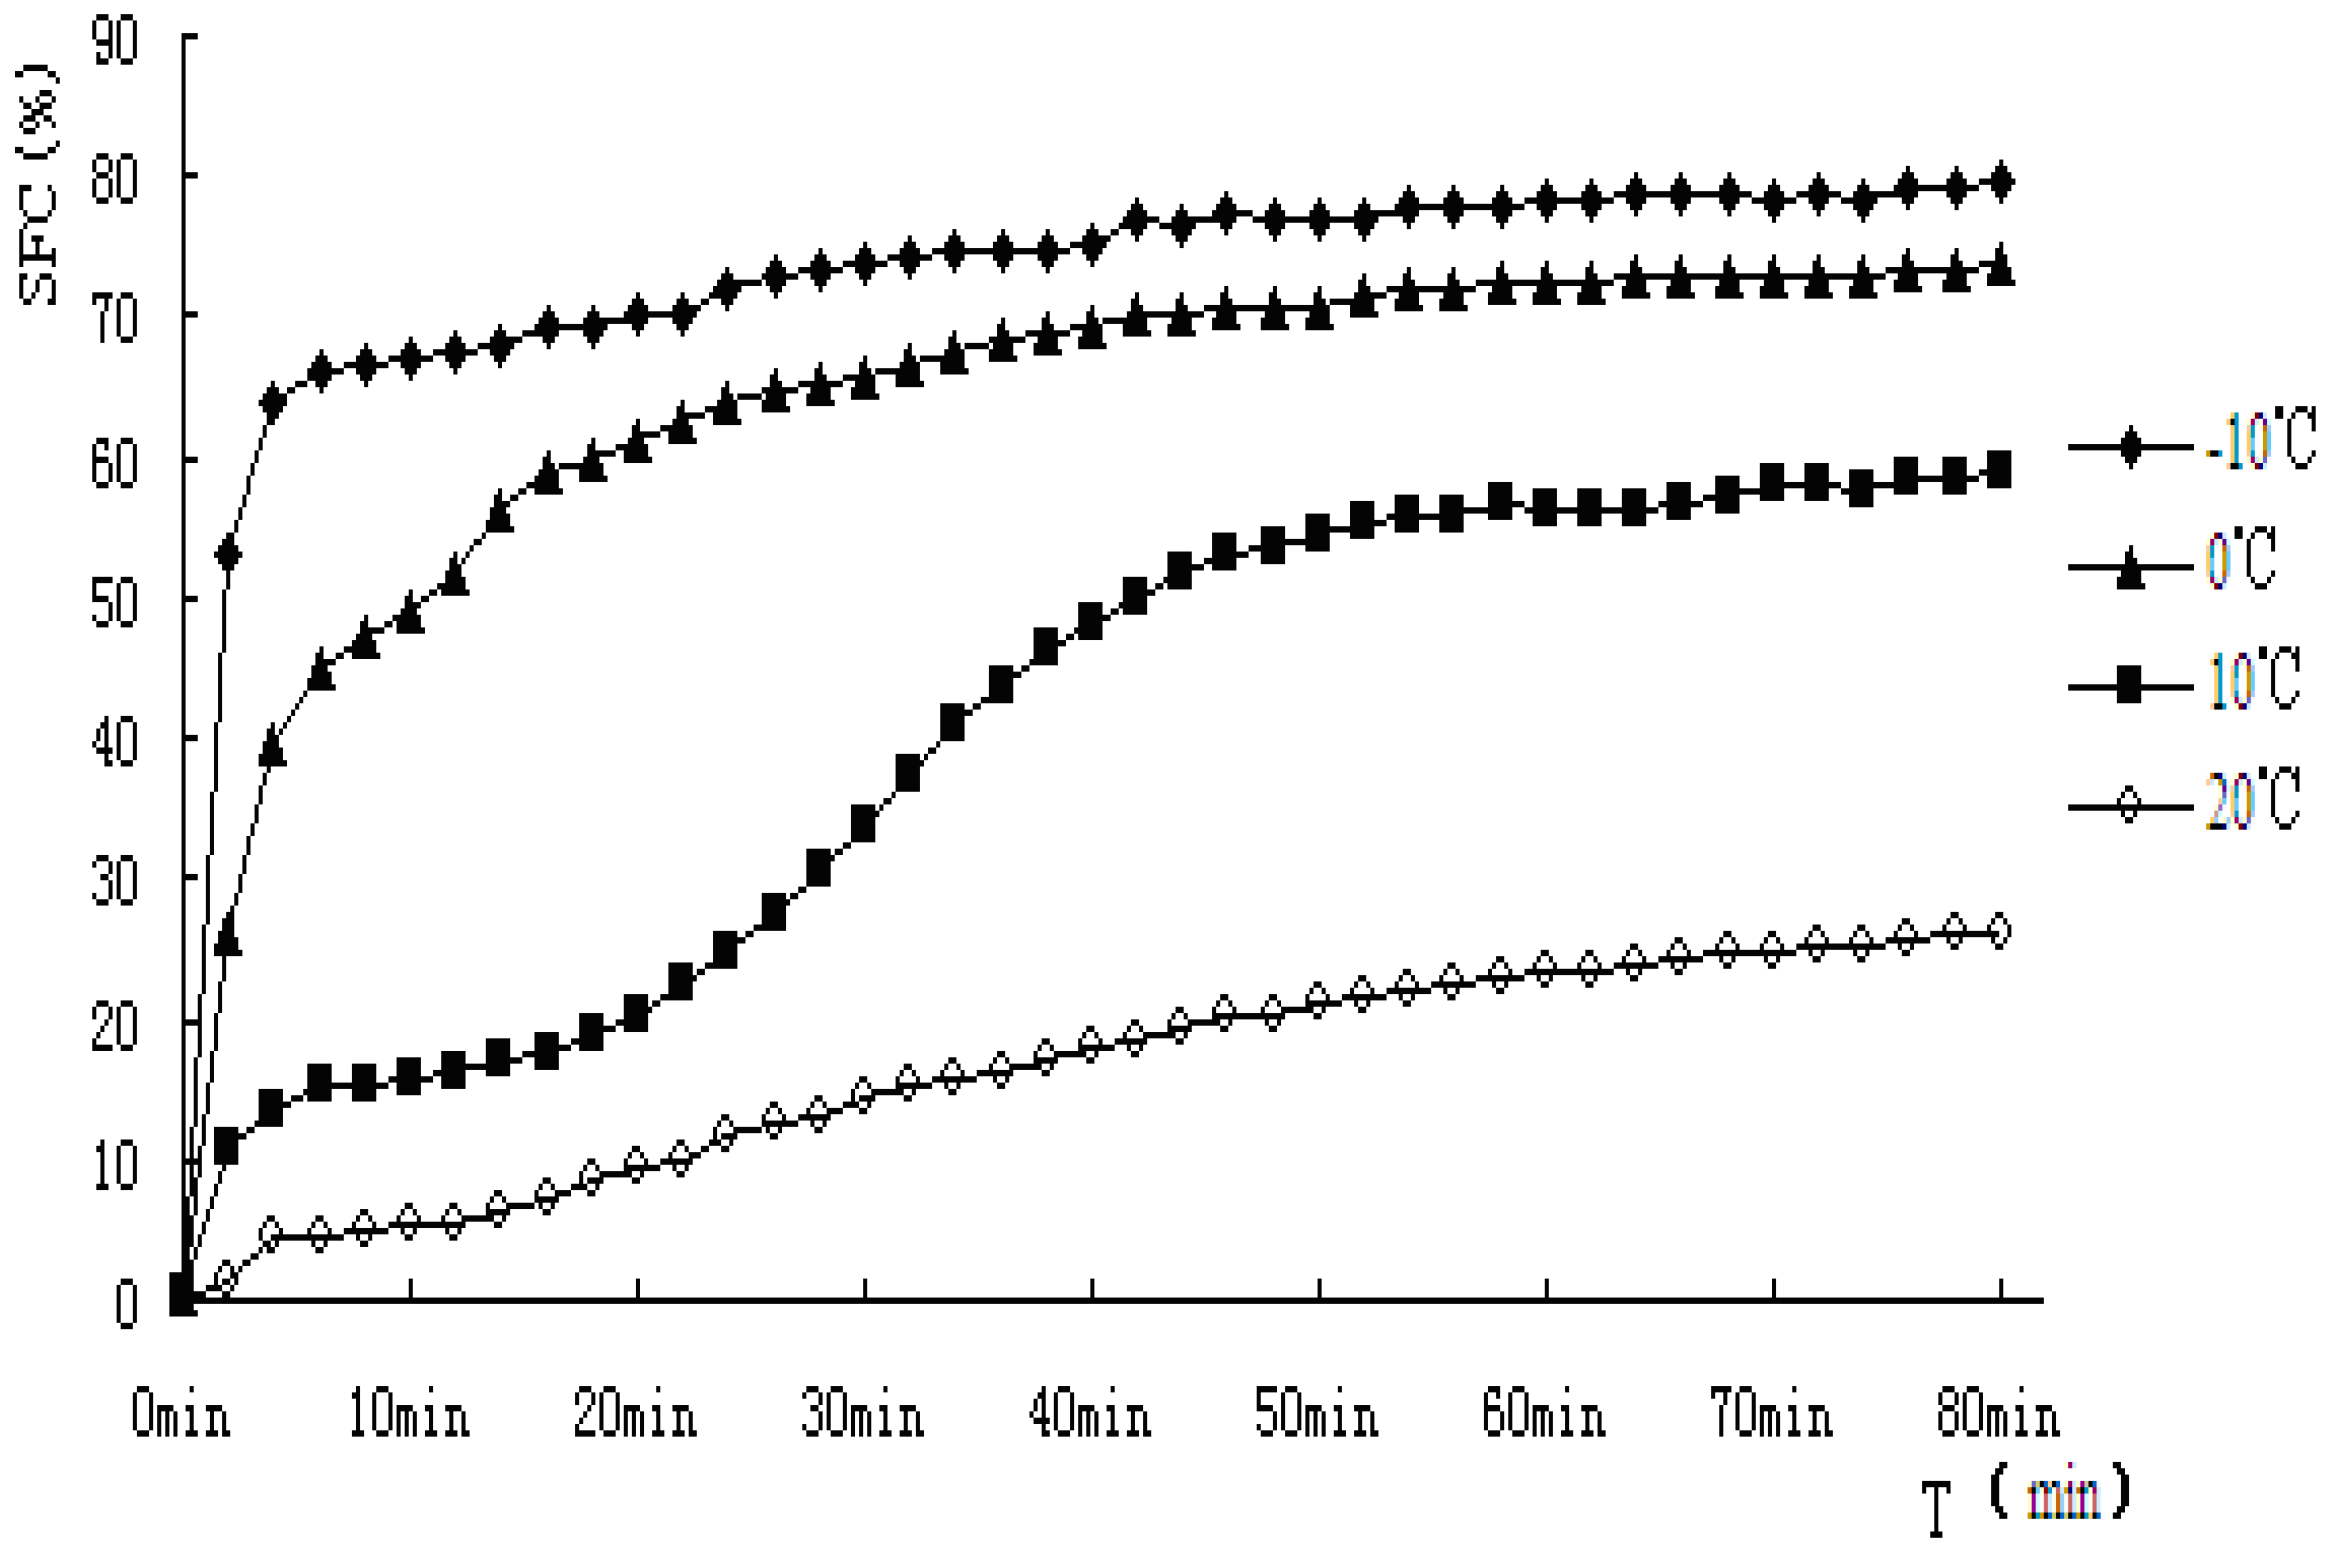
It can be seen the cooling rates have strong effects on the crystallization behavior of PS and PO from the above results, so different crystallization behavior at different temperatures was exhibited, and this may affect the quality of oil and its products. In this section, for further study of the crystallization mechanism of PS and PO at constant temperature, PS and PO were crystallized respectively at −10 °C, 0 °C, 10 °C and 20 °C isothermal crystallization curves of PS and PO were examined by pNMR and analyzed. Solid fat content
versus time profile during isothermal crystallization of PS and PO under the temperature of −10 °C, 0 °C, 10 °C, 20 °C can be seen from
Figure 5 and
Figure 6. Noticeable differences in the shape of the curves of the component fats can be observed.
Figure 5.
Solid fat content vs. time of crystallization for PS.
Figure 5.
Solid fat content vs. time of crystallization for PS.
Figure 6.
Solid fat content vs. time of crystallization for PO.
Figure 6.
Solid fat content vs. time of crystallization for PO.
There are two crystallization steps, one is nucleation forming, and the other is crystal growth. In order to form crystal nucleii, the fat system should stay in super-cooling or as a supersaturated system. Once the nucleation forms, they continue to grow and form crystals [
21]. Fat crystal generally experiences a fat-free period, nucleation form, rapid crystal accumulation period and endgame of crystallization with slowing down of speed and reaching the maximum. The shape of crystal SFC
vs. time can give important clues for the crystallization mechanism of a particular substance [
22]. In a study of the interaction of partial acylglycerols and triacylglycerols in milk fat, Foubert
et al. [
23] reported two mechanisms of interaction with the triacylgycerol crystals. The first resulted in slower crystal growth, due to competition in binding with the triacylglycerols. The second form involved organization in a micelle structure of partial acylglycerols, acting as nucleation facilitators.
As indicated from the
Figure 5 and
Figure 6, when PS and PO stayed at lower temperature, higher SFC emerged. In this study, PS and PO were all heated up to 80 °C and held at this temperature for 20 min to clear the crystal history, then cooled to −10 °C, 0 °C, 10 °C, 20 °C for crystallization. Super-cooling level was higher when isothermal crystallization temperature was lower, so the nucleation rate exhibited rapid change as the crystallization rate did. Both the samples showed obvious S-curves at 10 °C and 20 °C, however, S-curves was not so obvious at −10 °C and 0 °C. The reasons were that nucleation and crystallization were at a faster rate when isothermal crystallization occurred at −10 °C and 0 °C. The fat-free period was inconspicuous, the fat could reach the end of crystallization quickly.
The crystallization curves of PS and PO show sharp slopes when the crystallization began at −10 °C and 0 °C. The slopes of PS and PO are almost the same. However, when the temperatures come to 10 °C and 20 °C, the slopes of PS were larger than those of PO, indicating crystallization rate of PS was higher. When the crystallization time came to 10 min, PS reached a stable crystalline form basically at −10 °C, 0 °C, 10 °C. Then the SFC changed very slowly, PO showed a slower changing rate at the same temperature. It may be due to the complex compositions of the samples. PS would crystallize faster and quickly come to the stable crystal form under the same crystallization temperature condition. At 20 °C, the SFC changing rates of PS and PO both slow down.
Different isothermal crystallization curves signify different crystallization mechanisms. Temperature changing not only affected the solid fat content of products but also affected the crystallization behavior of the product. Thus it would affect the nature of the products. In order to describe the crystallization behavior in more detail, the Avrami crystallization theory has been used, the Avrami equation fitted with the percentage of crystallinity, as a function of time by linear regression. The equation fitted the data very well over the entire range of fractional crystallization values. Correlation coefficients obtained were always higher than 0.96 for the linear regression of log[−ln (1−X)] on log(t). The Avrami exponent (
n), Avrami constant (
K), and the half-times of crystallization (
t1/2) determined from the curve fits has been calculated and the results were shown in
Table 3.
Table 3.
Isothermal crystallization kinetic parameters for PS and PO.
Table 3.
Isothermal crystallization kinetic parameters for PS and PO.
| Samples | T | n | K/min−n | t1/2/min | R2 |
|---|
| PS | −10 °C | 0.4579 ± 0.0101 | 0.7976 ± 0.0021 | 0.7356 ± 0.1027 | 0.999 |
| 0 °C | 0.5708 ± 0.0098 | 0.4003 ± 0.0109 | 2.6156 ± 0.2319 | 0.998 |
| 10 °C | 0.8871 ± 0.0110 | 0.1032 ± 0.0099 | 8.5568 ± 0.3471 | 0.999 |
| 20 °C | 0.8591 ± 0.0087 | 0.1528 ± 0.0204 | 5.8117 ± 0.1827 | 0.996 |
| PO | −10 °C | 0.4089 ± 0.0203 | 0.7204 ± 0.0331 | 0.9095 ± 0.0218 | 0.998 |
| 0 °C | 0.6034 ± 0.0301 | 0.3420 ± 0.0278 | 3.2233 ± 0.1029 | 0.997 |
| 10 °C | 1.0943 ± 0.0189 | 0.0302 ± 0.0012 | 17.5173 ± 0.5621 | 0.999 |
| 20 °C | 1.1655 ± 0.0076 | 0.0174 ± 0.0026 | 23.6026 ± 0.4875 | 0.999 |
As it can be seen in
Table 3, the Avrami exponent
n for PS and PO increased with increasing crystallization temperature, however, at a set temperature, the difference between the values of
n between PS and PO was slight. It meant that PS and PO have the same mechanism of nucleation and crystal growth. The value of
n reflects the nucleation and growth mechanism for details, the high value of
n means a more complex mechanism of crystal growth. Kawamura [
9] has tabulated values for the Avrami exponent
n for various types of nucleation and growth. The value ranges from 0.5 to 4. For example, an
n of 4 indicates a polyhedral crystal growth mechanism, where an
n of 3 represents a plate-like crystal growth mechanism, and an
n of 2 indicates a linear crystal growth. The smaller the
n value, the faster nucleation forms and grows. Wright
et al. [
24] also pointed out that the n value of 1 corresponded to rod-like growth from instantaneous nuclei, whereas spherulitic growth from sporadic nuclei is expected when a value of 4 is obtained. Litwinenko
et al. [
25] have found that margarine system was generally a heterogeneous nucleation when the Avrami exponent (n) generally increased with increasing temperature, from approximately 1 to 4. For
Table 2, the value of
n increases with the temperature rising indicated that the temperature changes the mechanism of nucleation, it turned to low super-cooling sporadic nucleation from the high super-cooling instantaneous nucleation with the temperature increasing.
Besides, from the figures, apart from 20 °C of PS, the crystallization temperature increasing resulted in an decrease of crystallization rate constant(K) of PS and PO. This may correspond to the different driving forces of crystallization. The driving force depends on the super-cooling or super-saturation conditions, so the higher super-cooling was, the more rapidly crystallization happened. The crystallization would become slower with the lower super-cooling due to increasing temperature. The rate constant K of PS was higher than PO indicated that the crystallization rate of PS was higher than it of PO at the same temperature. The values of K and n had a significant change at 10 °C where K increased and n reduced significantly. This indicated that high temperature could greatly decrease the crystallization rate when the temperature was from −10 °C to 10 °C.
The half-time of crystallization (
t1/2) defined as the time which the extent of crystallization is 50% complete. The shorter the half-time was, the faster the crystallization rate obtained. As shown in
Table 3, a higher temperature leads to a lower super-cooling degree, thus the nuclei for the crystallization had more difficulty to form. PS had more saturated TAG, so it would result in higher super-cooling and nucleation could occur easily, so the
t1/2 value of PS was lower than PO at the same temperature.
2.5. Crystal Morphological Observation
The disagreement between the SFC and TAGs of PS and PO, together with their different nucleation and growth mechanisms at different temperatures, as discussed in the preceding sections, implies differences in the crystal morphologies of the two samples. The most popular method to visualize the microstructure of fat crystal network is PLM. For the food with high fat content, the strength of crystal network determines the 60–80% hardness [
26]. After concluding the previous research of macroscopic physical properties of solid lipids, Narine
et al. found that compared with other crystallization behaviors, the microstructure of fat is more significant to the macroscopic physical properties [
27].
Figure 7 shows the isothermal photomicrographs of crystals of PS and PO at −10 °C, 0 °C, 10 °C and 20 °C. As indicated in the images, PS showed different crystal morphology compared to PO at the same temperature. Also, PS and PO formed different shapes of crystals at different temperatures. At −10 °C, both particles sizes of PS and PO are small, and well-distributed throughout the crystal system, and the crystals of PS were smaller than PO. Crystal aggregations can be seen in the photograph of PO while few were found in PS. At 0 °C, the number of spherical crystals of PS and PO were both decreased. PO formed a larger number of crystals and a denser network compared to PS, indicating that there were stronger interactions between the crystals of PO. When the temperature come to 10 °C, PO formed needle-like, clear frame crystals while PS showed spherical crystals and smaller particle sizes than that of PS. As to PS, the decreasing number of crystals indicated that the interaction between the crystals was reduced. When the temperature rises to 20 °C, disordered links between spherical crystals of PO were melted. Both of them showed independent, few, and larger size crystals, where PO still formed needle-like crystals and PS still formed spherical crystals. Summarily, a conclusion can be drawn that with the temperature increased, the structure of crystal network gradually loosened.
Figure 7.
PLM images (×100) of PS and PO at −10 °C, 0 °C, 10 °C, 20 °C.
Figure 7.
PLM images (×100) of PS and PO at −10 °C, 0 °C, 10 °C, 20 °C.
2.6. Melting Profile of PS and PO under Isothermal Crystallization
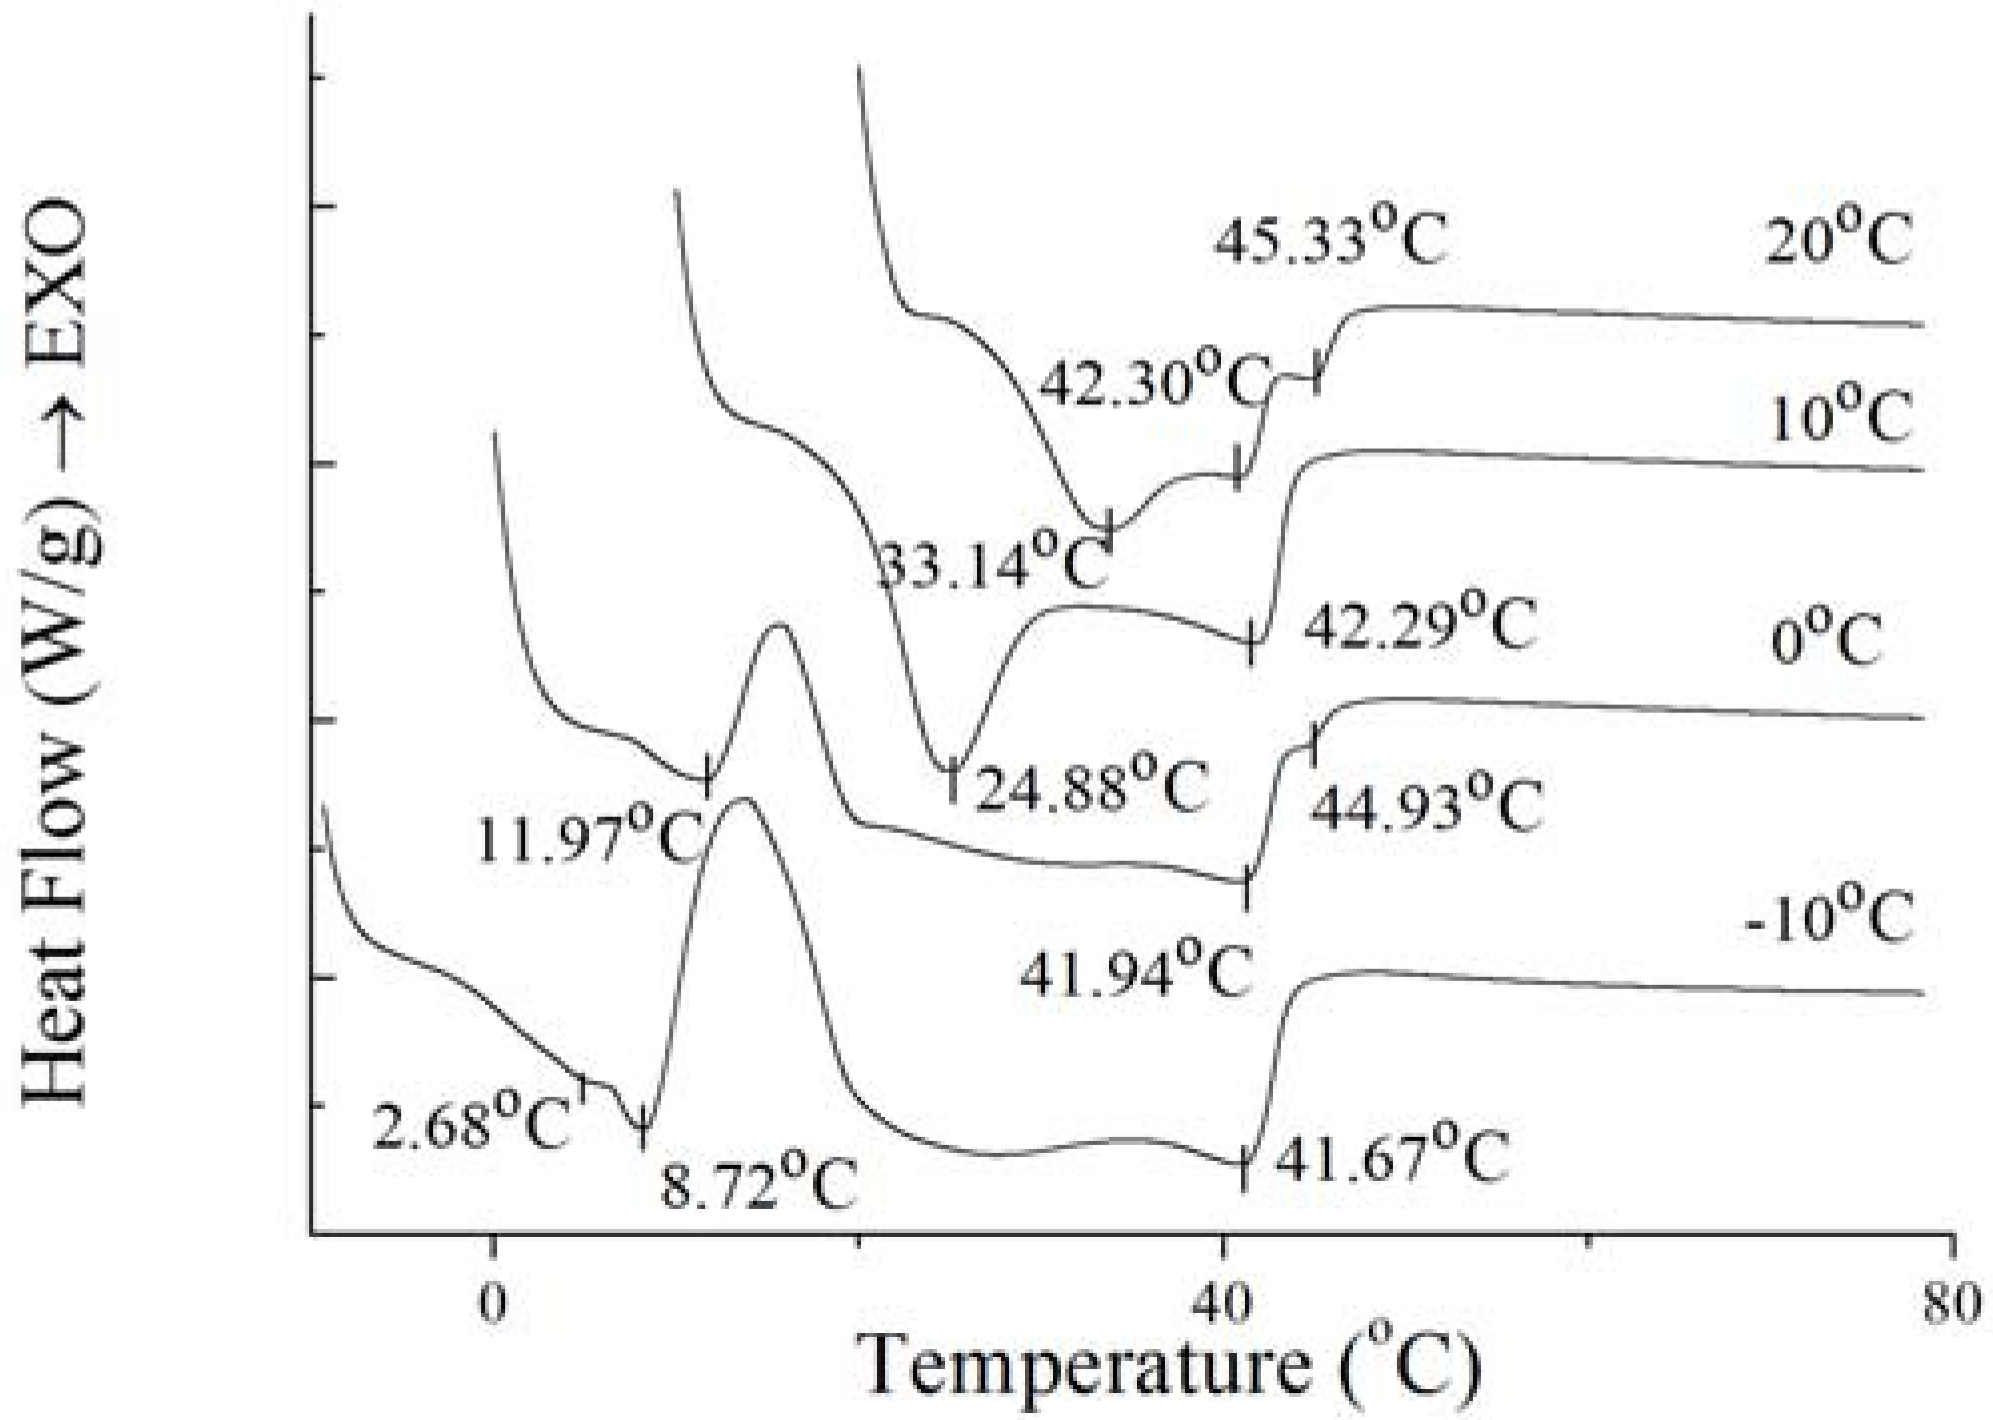
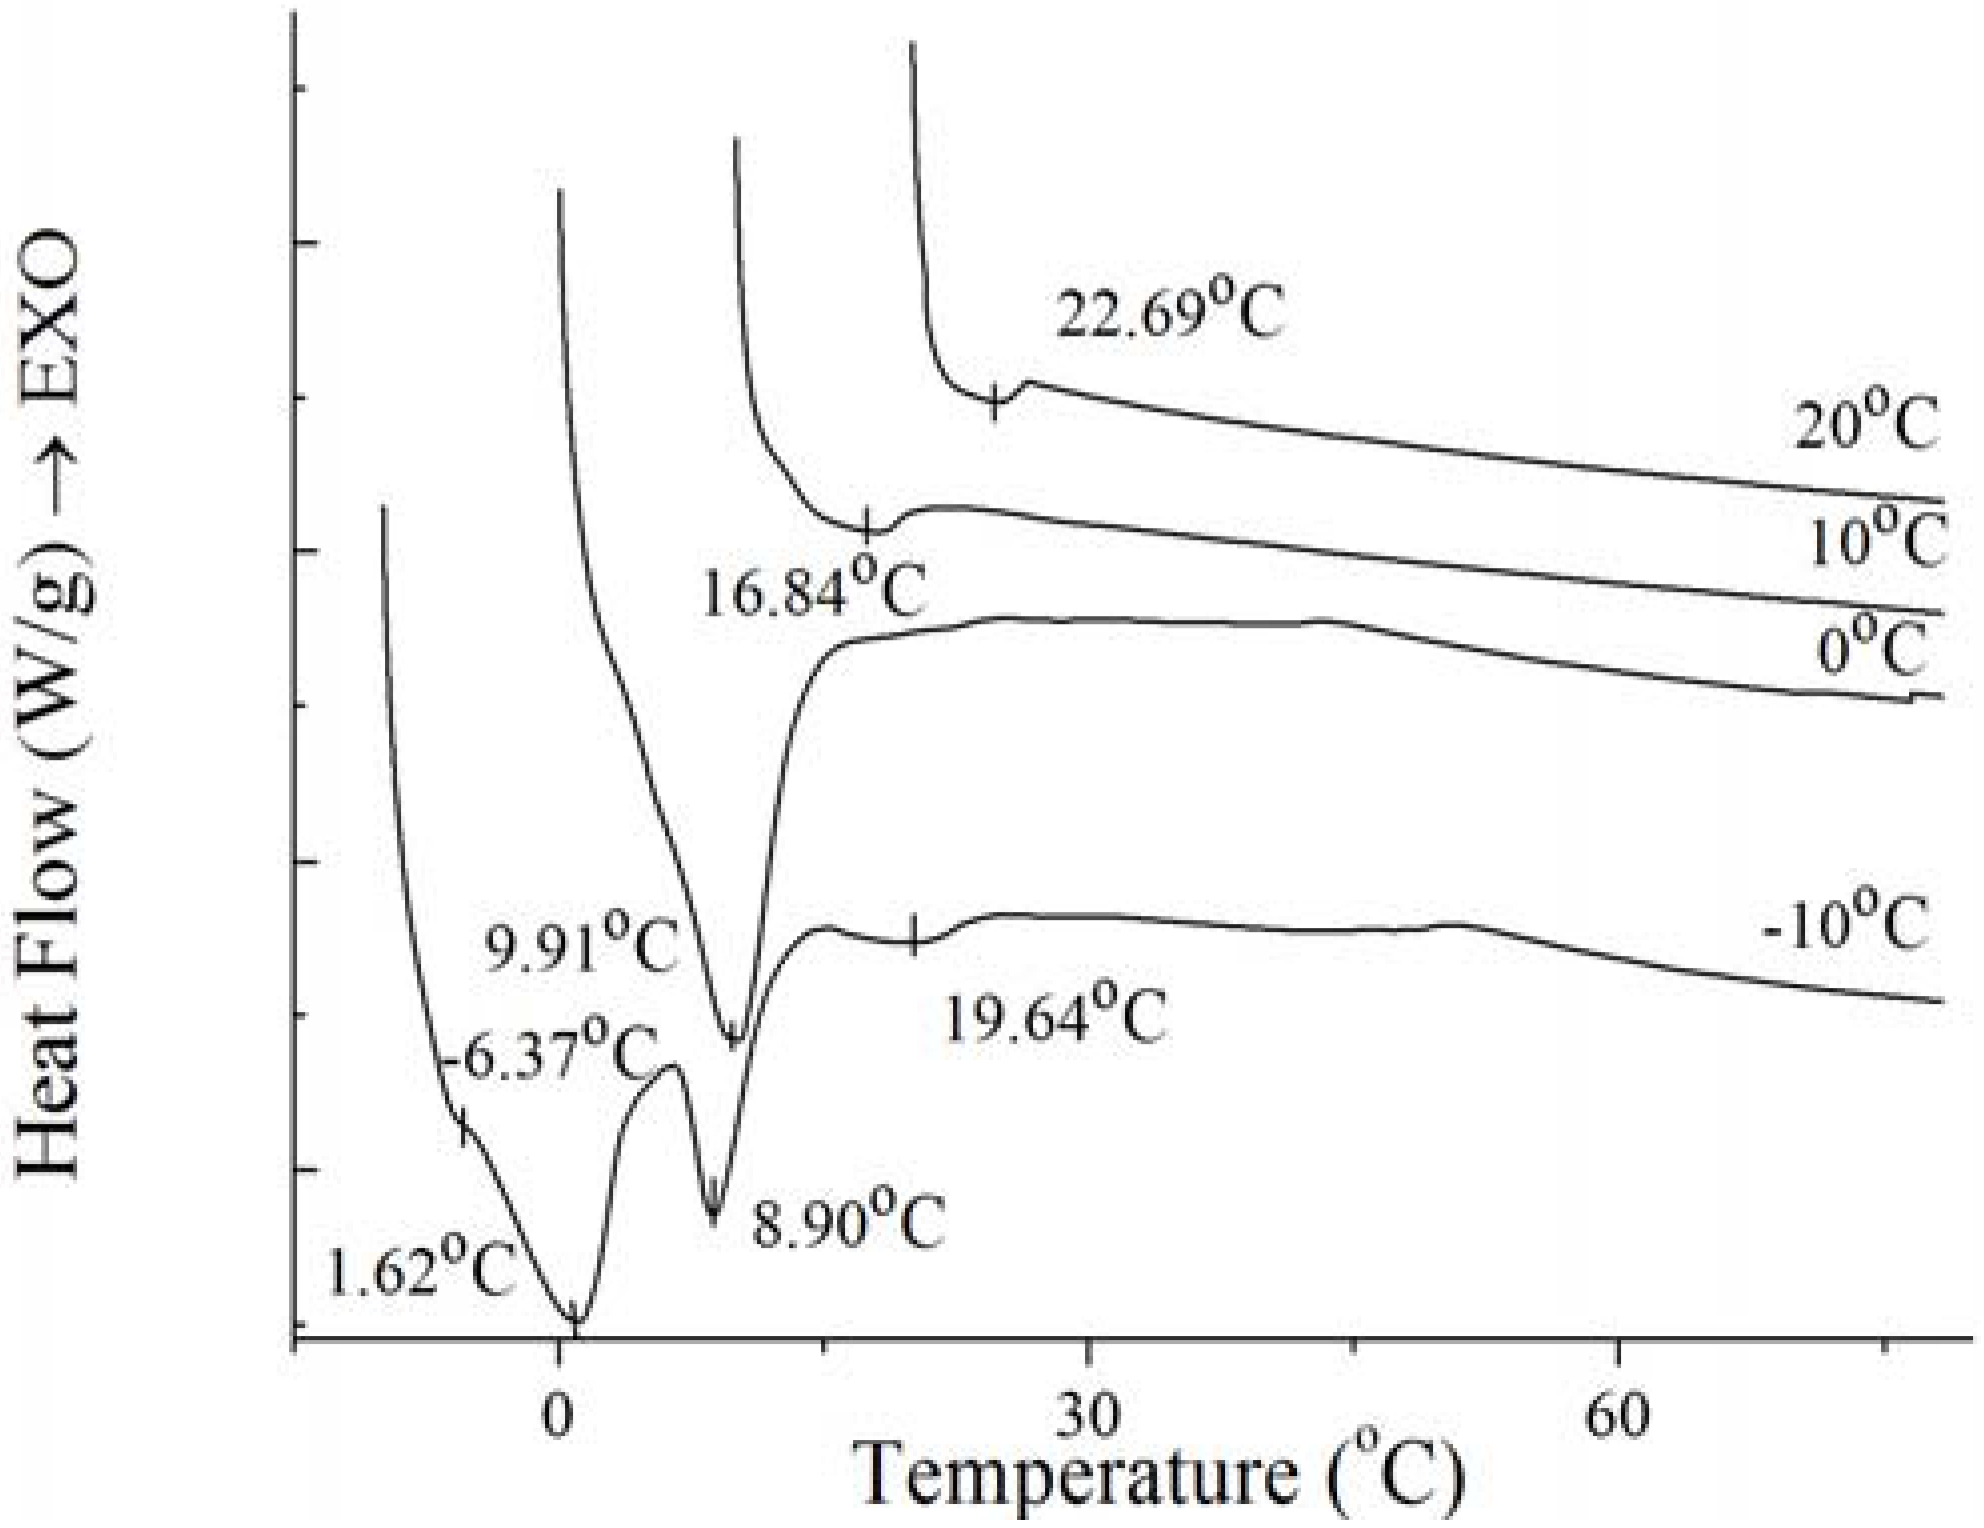
To further investigate the nature of the crystals produced under isothermal crystallization, the melting profile of PS and PO was obtained by heating the sample at the end of each isothermal crystallization process. The results are shown in
Figure 8 and
Figure 9. According to
Figure 8 and
Figure 9, the crystals of PS formed at −10 °C showed a small low-melting endothermal peak around 2.68 °C, a sharp endothermal peak around 8.72 °C and a broad high-melting endothermal peak around 41.67 °C in the melting thermogram. At this temperature, fast nucleation with small spherulitic crystals was observed (
Figure 7). The crystal structure was consistent with the growth mechanism which was presented above. For the size of the crystal of PS increased which formed at 0 °C, the low-melting endothermal peak with temperature of 2.68 °C disappeared and the endothermal peak around 8.72 °C and 41.94 °C decreased in size and increased in peak temperature. It can be interpreted by that there were more high-melting components in PS at higher temperature and different polymorph states were developed with different super-cooling. This is consistent with the crystal structure in
Figure 7. Then with the temperature increasing to 10 °C, PS showed spherical crystals with increasing size (
Figure 7), and the low-melting endothermal peaks disappeared and the higher melting peak showed an increase in its peak temperature (
Figure 8). It indicated that a more stable polymorph state was developed [
28]. When the temperature rises to 20 °C, the size of spherical crystals increased (
Figure 7) with the peak temperarue of endothermal peaks increased (
Figure 8).
Figure 8.
Melting thermogram at 5 °C/min on PS at the end of isothermal crystallization at various temperatures of crystallization.
Figure 8.
Melting thermogram at 5 °C/min on PS at the end of isothermal crystallization at various temperatures of crystallization.
Figure 9.
Melting thermogram at 5 °C/min on PO at the end of isothermal crystallization at various temperatures of crystallization.
Figure 9.
Melting thermogram at 5 °C/min on PO at the end of isothermal crystallization at various temperatures of crystallization.
For the well-distributed small crystals of PO formed at −10 °C (
Figure 7), there were two small endothermal peaks around −6.37 °C and 19.64 °C, two sharp endothermal peaks around 1.62 °C and 8.90 °C. When the temperature arrived 0 °C, there was only a big sharp endothermal peak around 9.91 °C while other peaks disappeared which appeared at 0 °C. At this temperature, small spherulitic crystals was observed in
Figure 7. The needle-like, clear frame crystals formed at 10 °C (
Figure 7) when there was only one small broaden endothermal peak around 16.84 °C in the melting thermogram. Then the size of this peak decreased and the temperature increased to 22.69 °C at 20 °C, melting spherical crystals of PO were presented (
Figure 7). The complexity of the melting curve shows there are different amounts of crystallized fat and several types of homogeneous polycrystalline forms [
9]. It can be concluded that with the temperature increased, the different types of homogeneous polycrystalline form were developed with different nucleation and growth mechanisms.


