Optical Characterization of Oligonucleotide DNA Influenced by Magnetic Fields

Abstract
:1. Introduction
2. Results and Discussion
2.1. Results
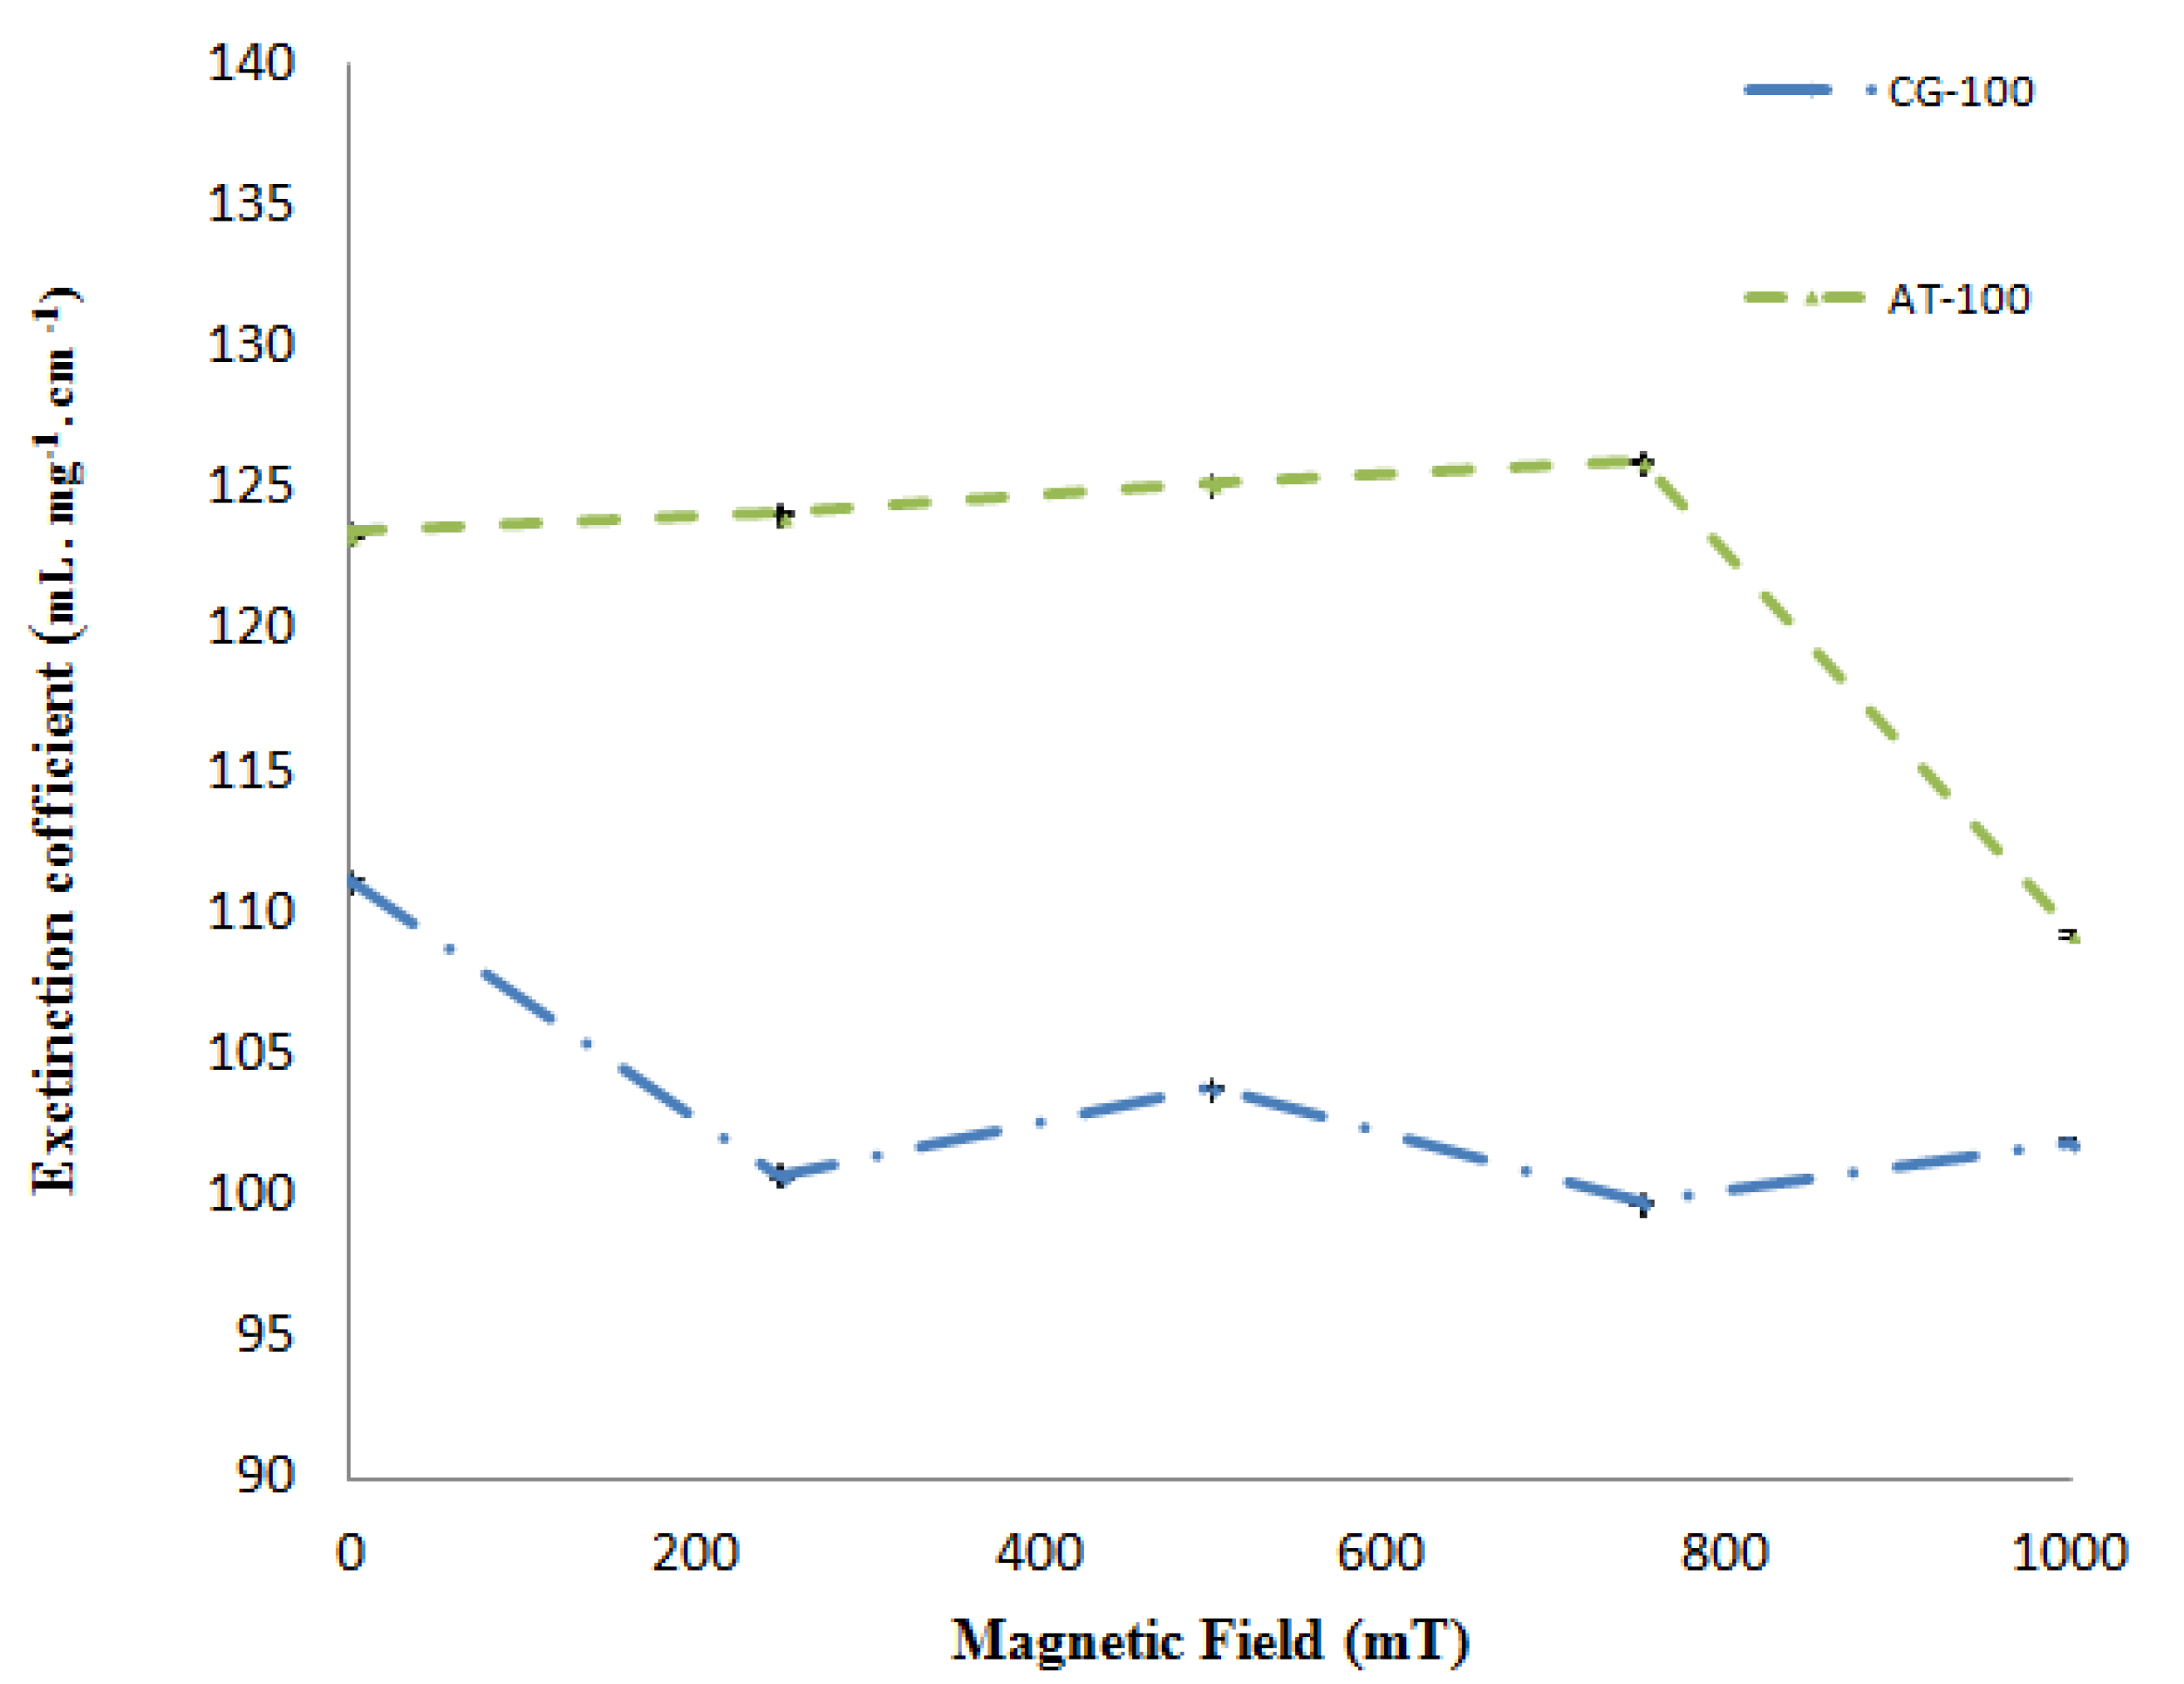
2.1.1. Extinction Coefficient
2.1.1.1. Lambert and Beer Law

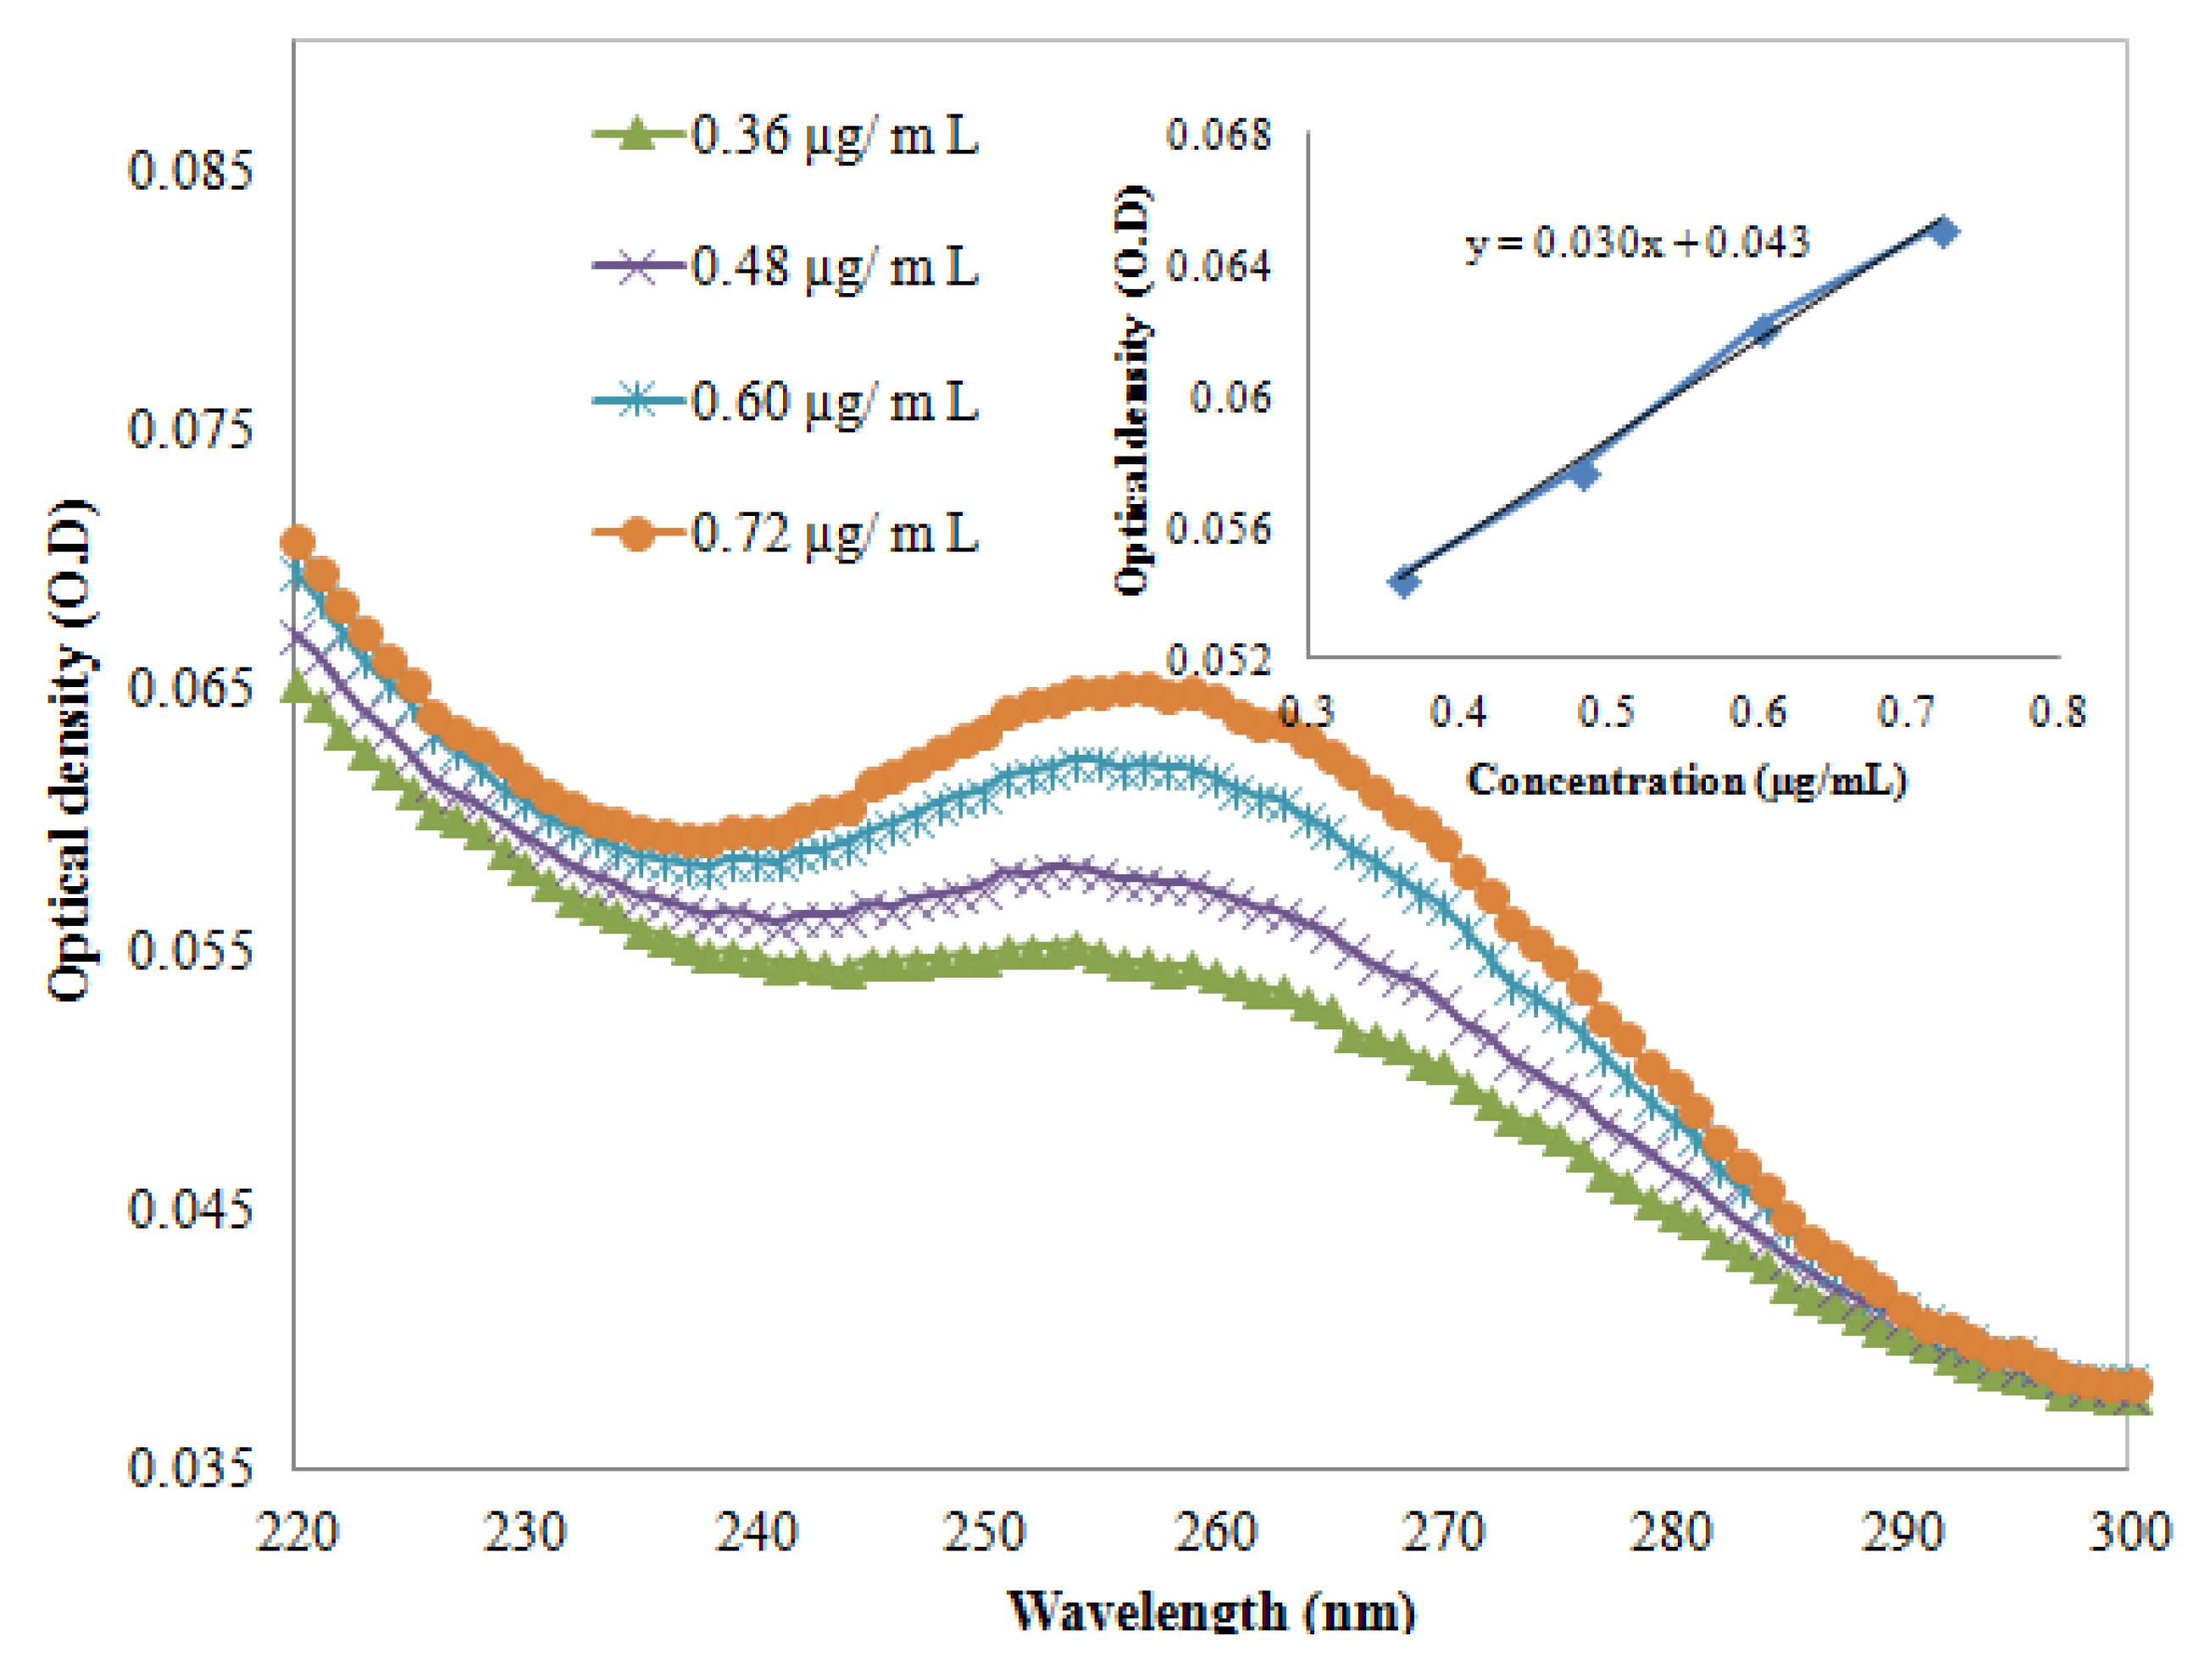
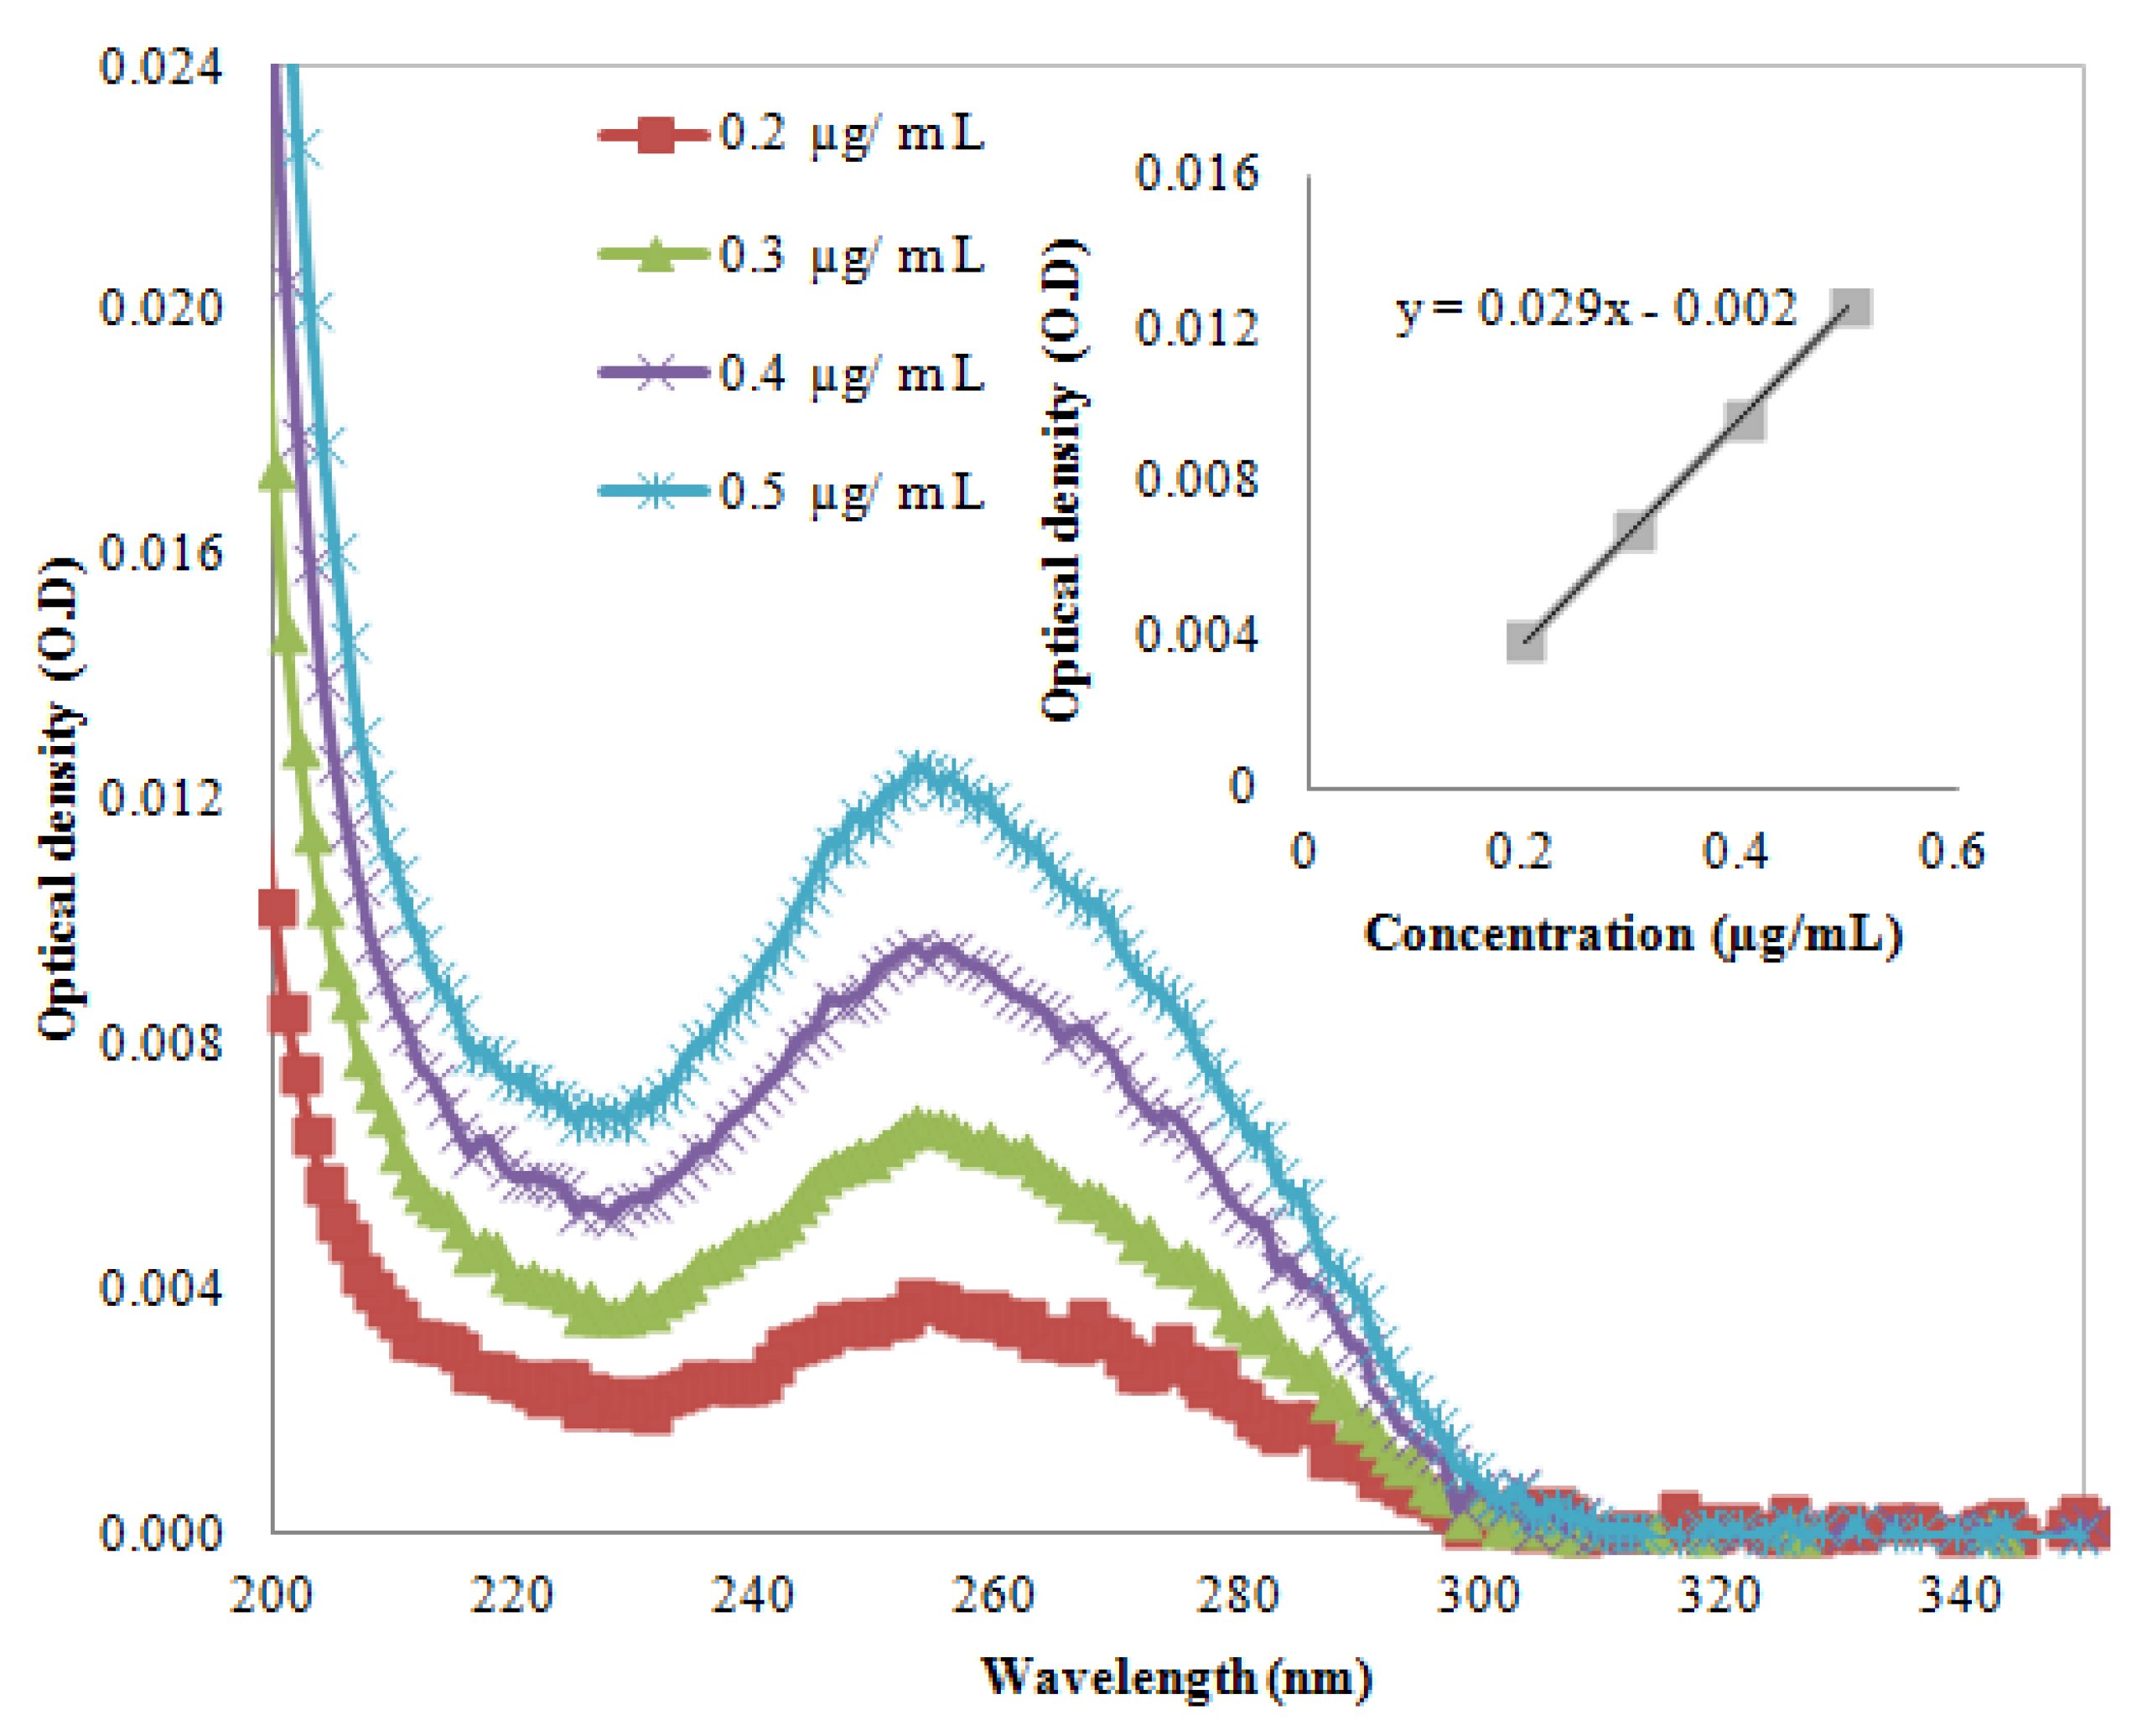
 are the component concentrations, wavelength, absorbance, path length and molar extinction, respectively. The molar extinction coefficient was calculated after extracting the UV-Vis spectrum of the DNA (AT-100 and CG-100). Figure 1 and Figure 2 show UV-Vis spectra of two samples at a variety of concentrations. The insets in the figures show the relationship between optical density and concentration used to calculate the molar extinction coefficients, which for the single-strand oligonucleotides AT-100 and CG-100 are 927,352 and 896,789 L/mol·cm, respectively.

2.1.1.2. Nearest-Neighbor

 is the neighbor molar extinction coefficient of the neighboring nucleotides i, i + 1. The terms
  and
and  are the individual and modified molar extinction coefficients, respectively [18].
2.1.1.3. Base Composition Method
 , and
, and  is the molar extinction coefficient for individual base pairs:

 are shown in Table 1. The results for AT-100 and CG-100 were compared with each other; the experimental result was less than the theoretical investigation because of the double-strand’s hypochromicity effect.
 for the DNA oligonucleotides AT-100 mer and CG 100 mer (E-BC: Base composition method; E-NN: Nearest neighbor method; E-EX: Experimental result).
| DNA Sample | E-BC (L/mol·cm) | E-NN (L/mol·cm) | E-EX (L/mol·cm) |
|---|---|---|---|
| AT (100 mer) | 1,140,750 ± 5,703 | 1,082,685 ± 5,413 | 927,352 ± 4,636 |
| CG (100 mer) | 841,500 ± 4,207 | 846,016 ± 4,230 | 896,789 ± 4,483 |


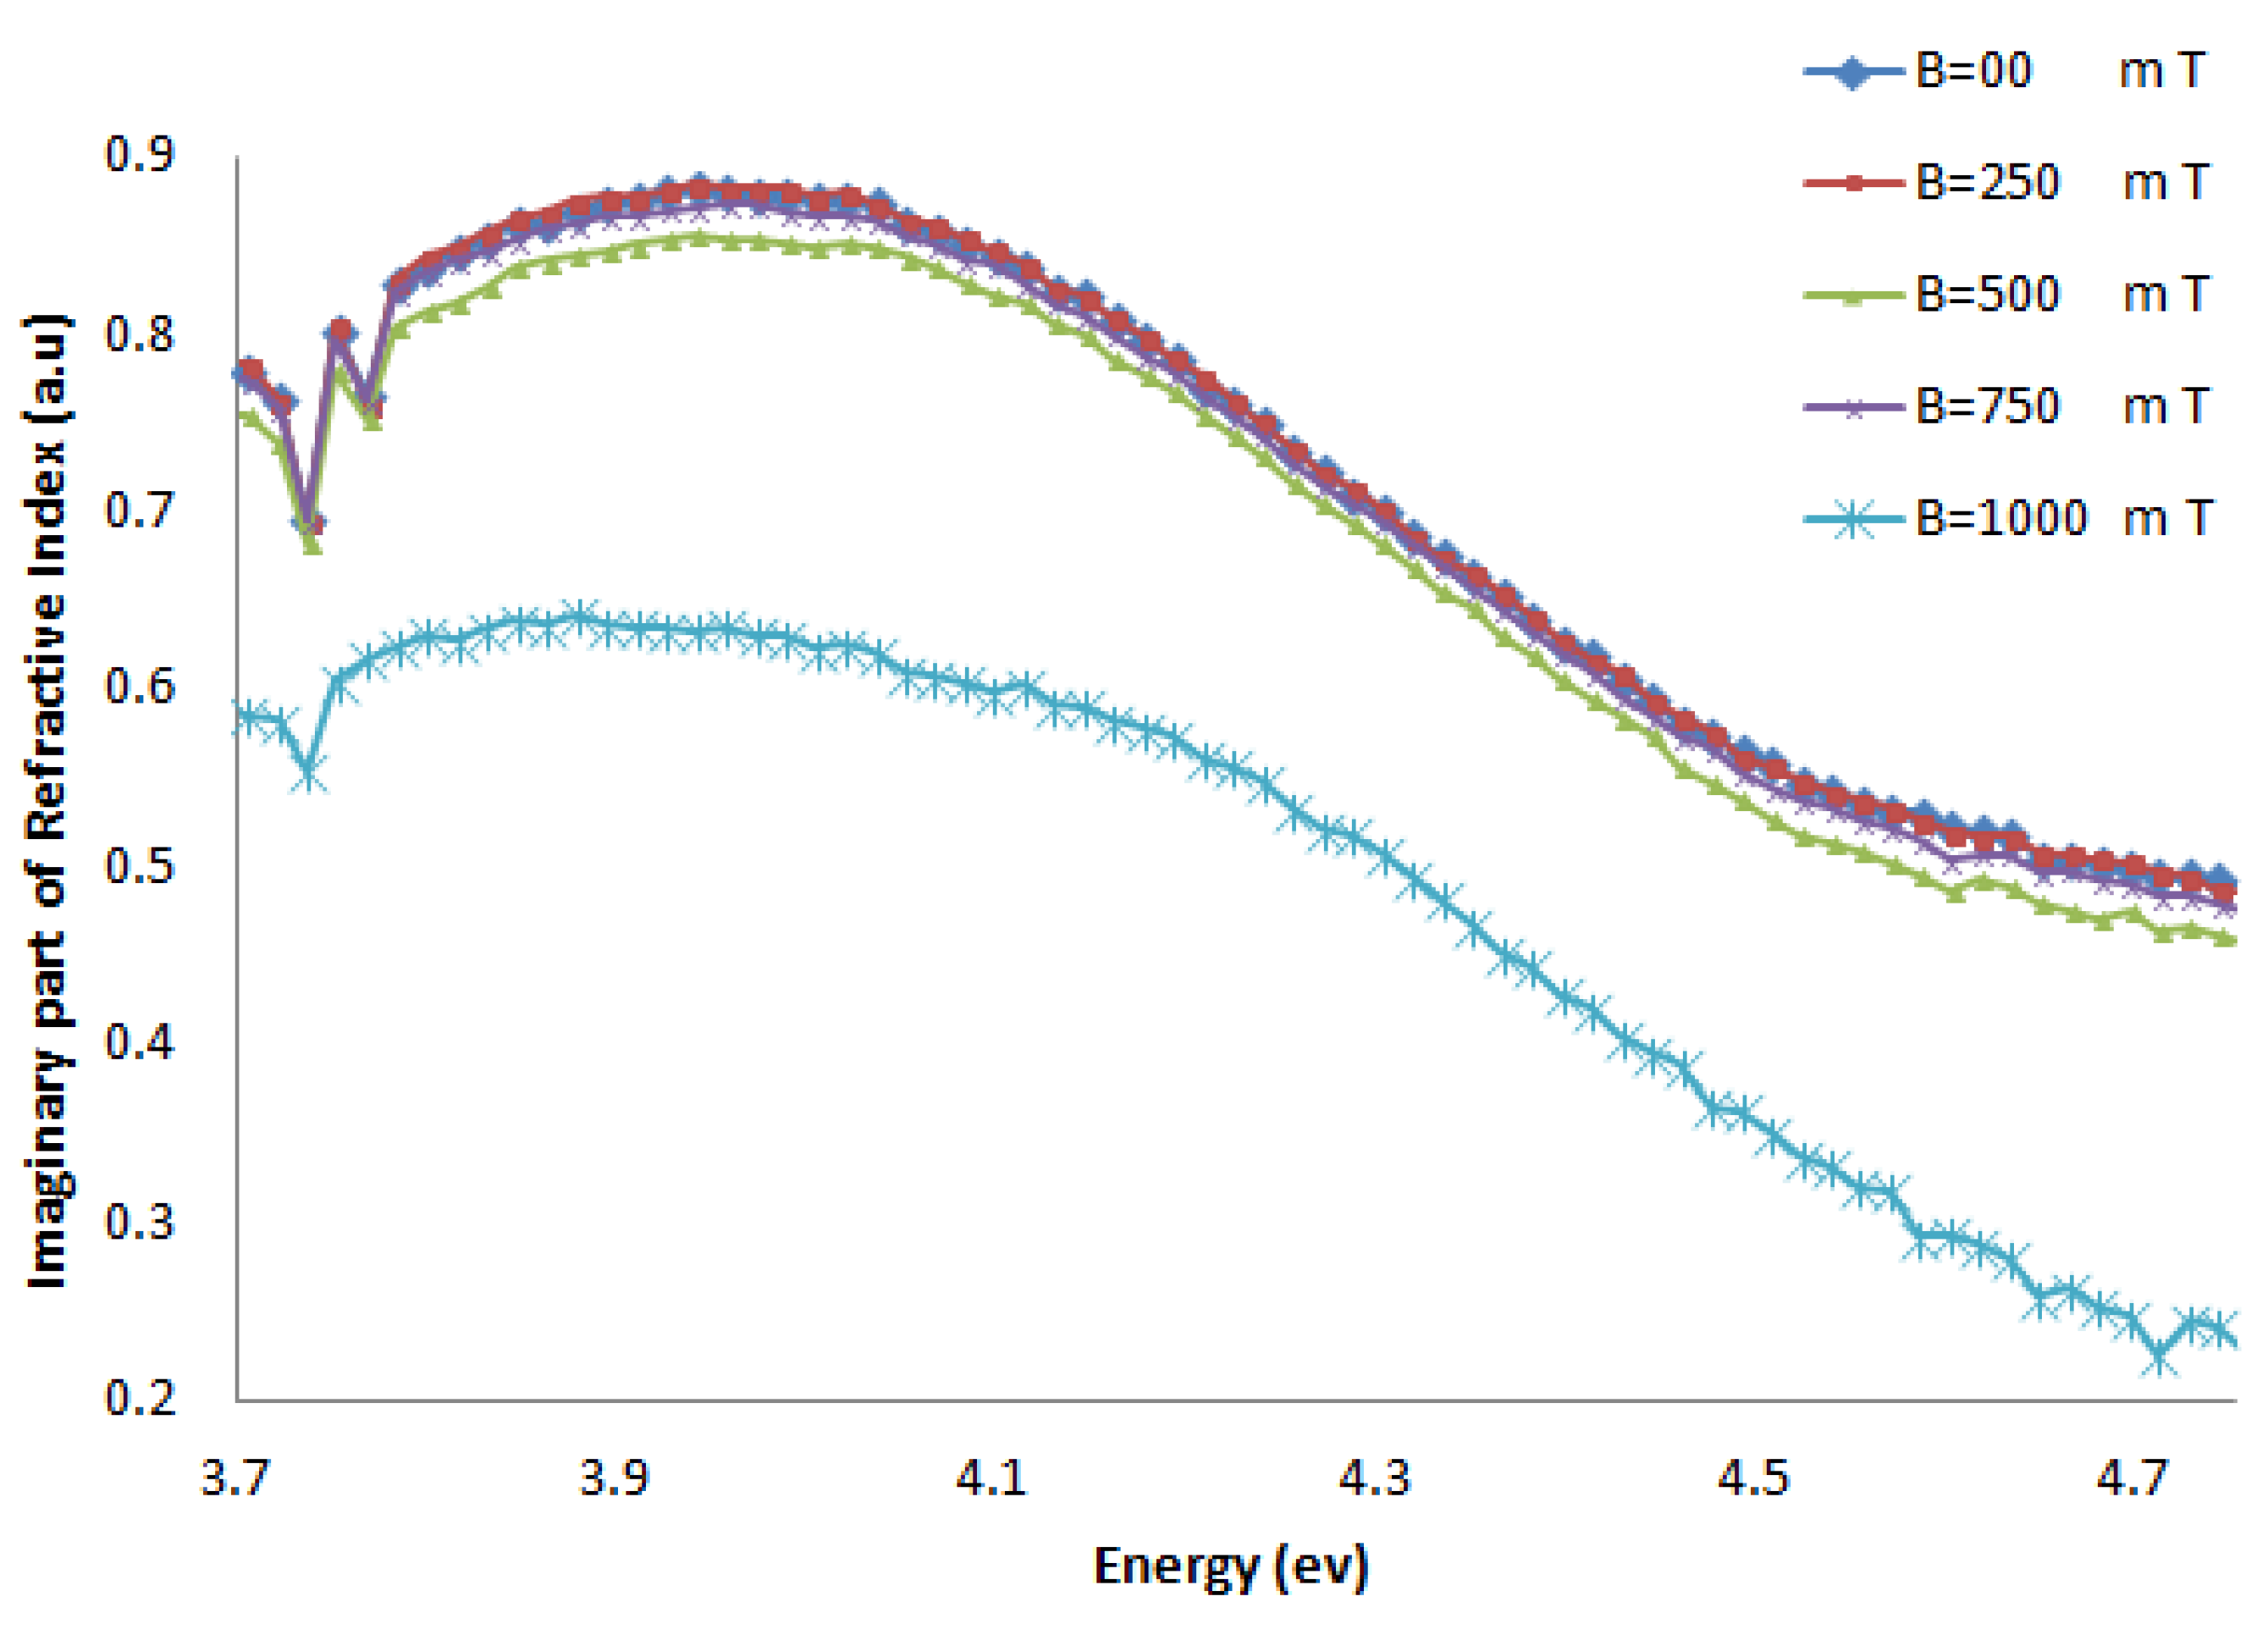
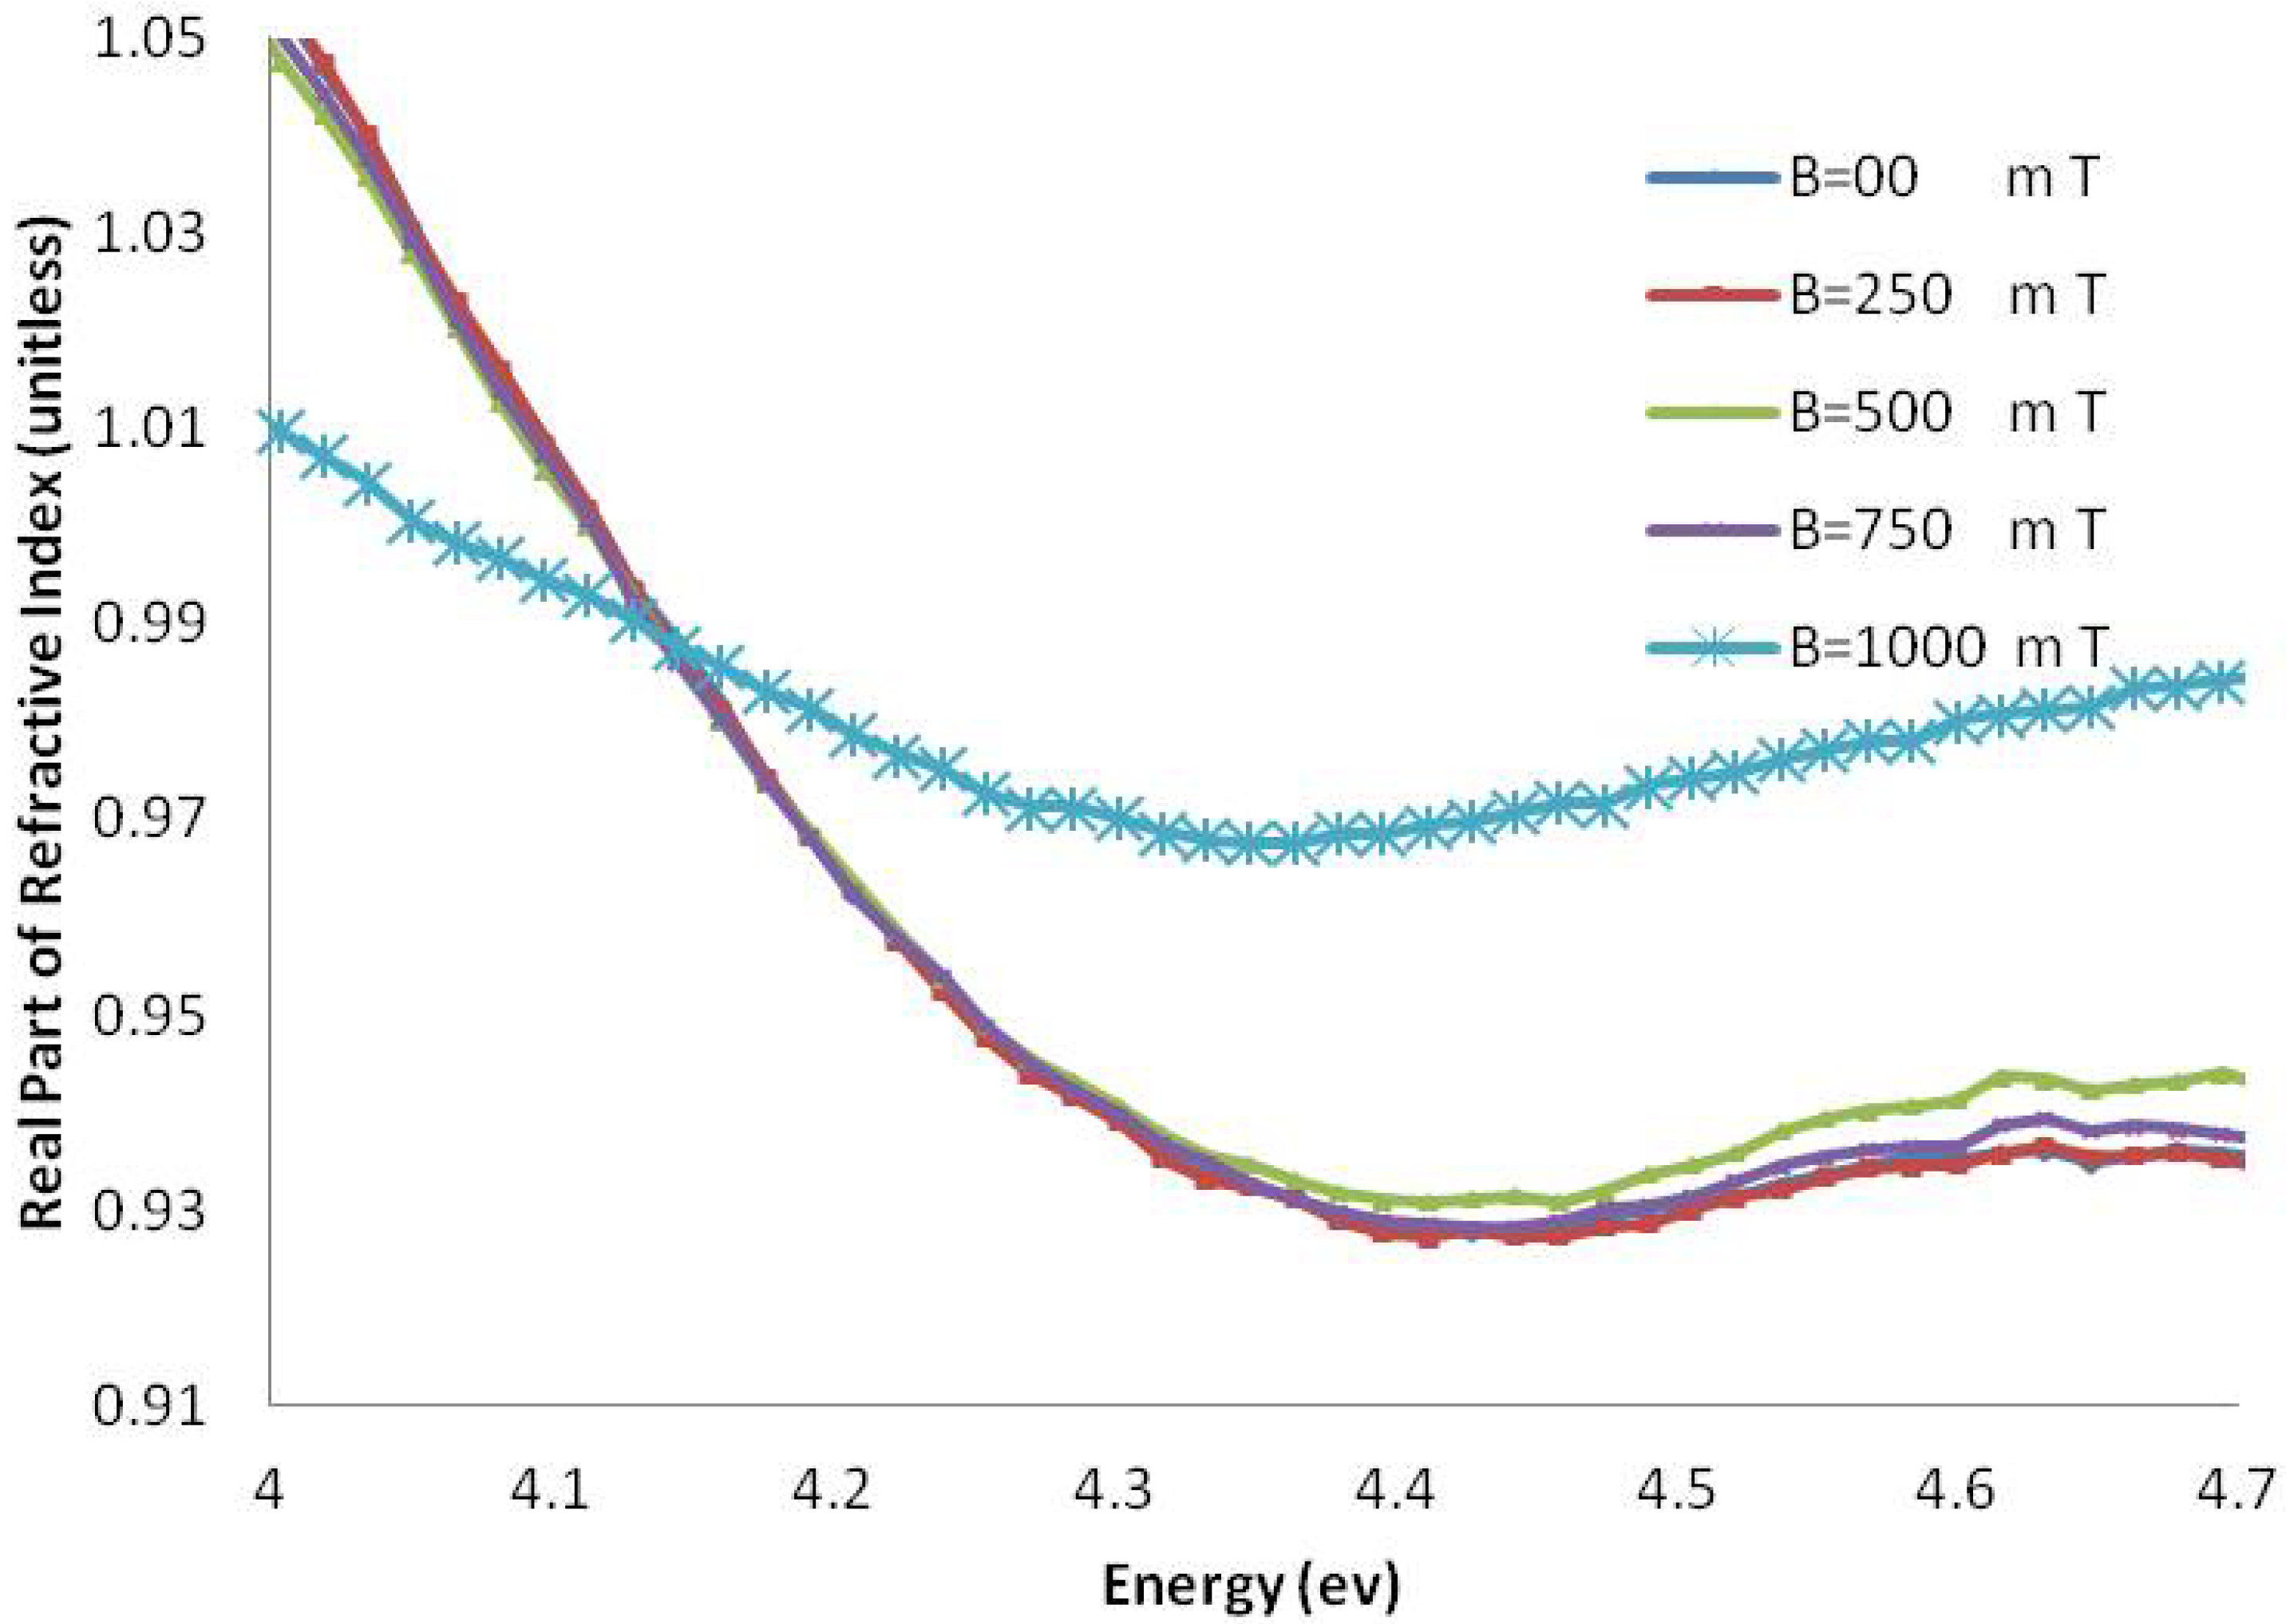
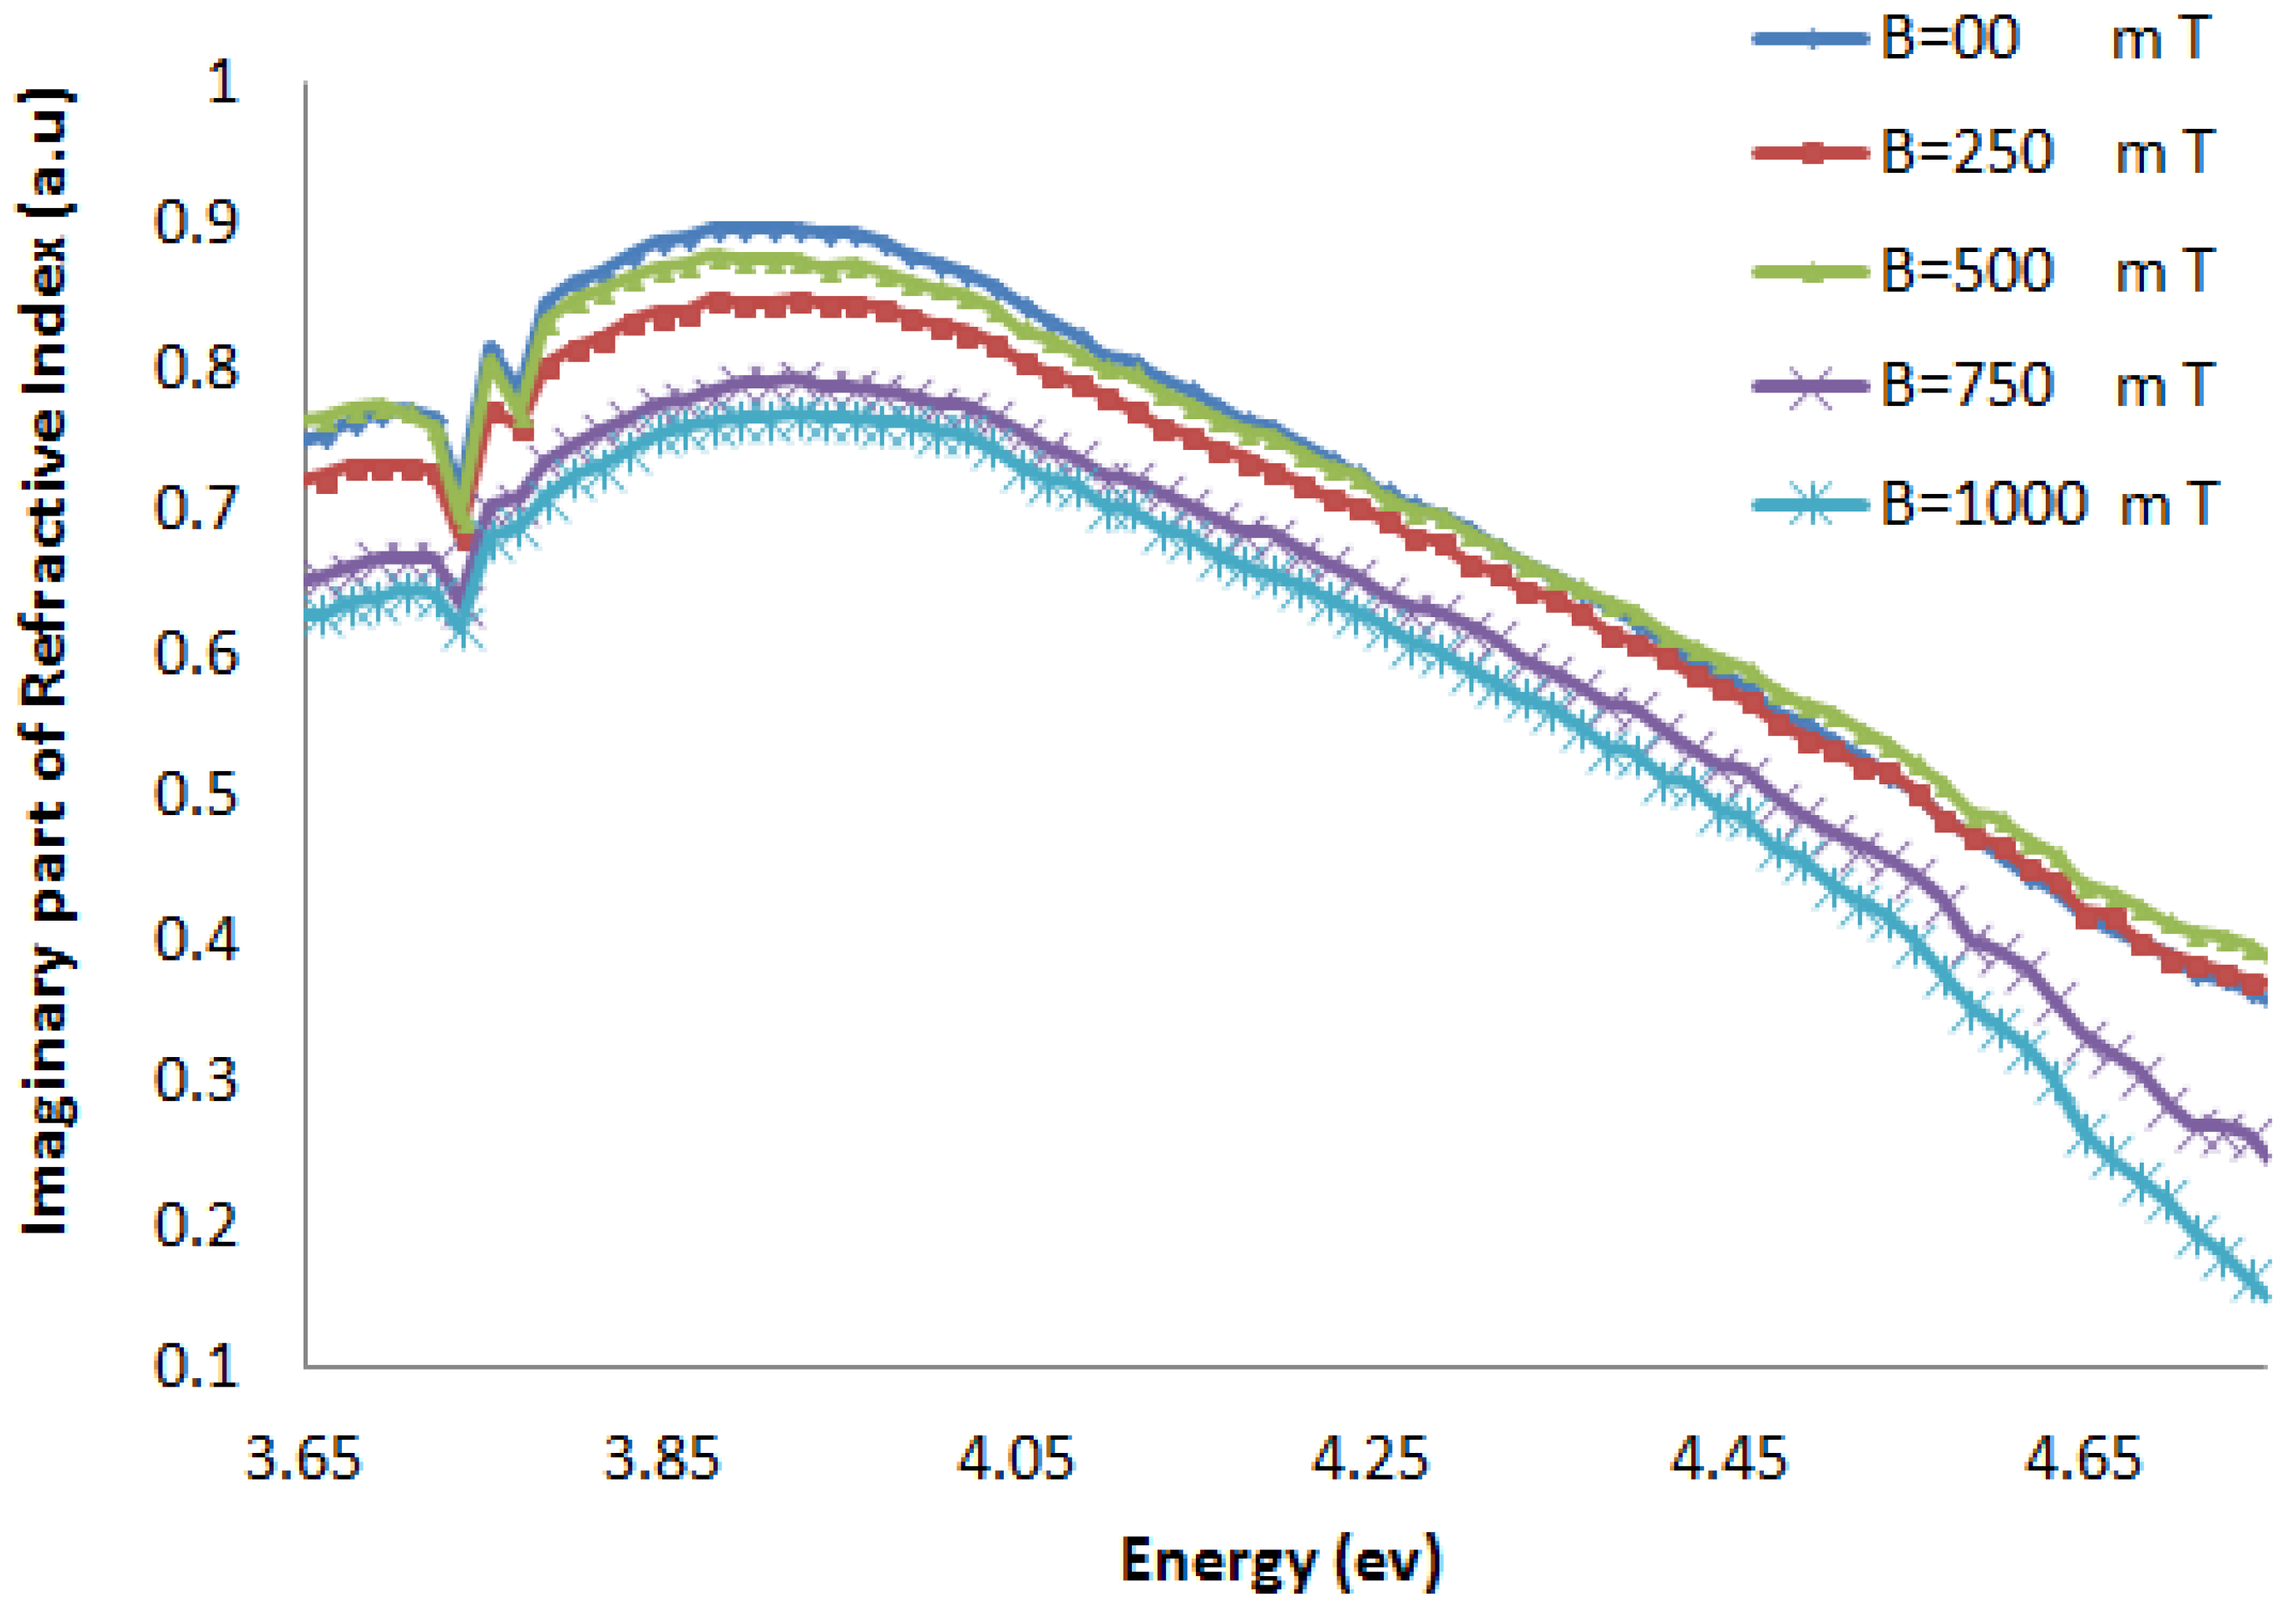
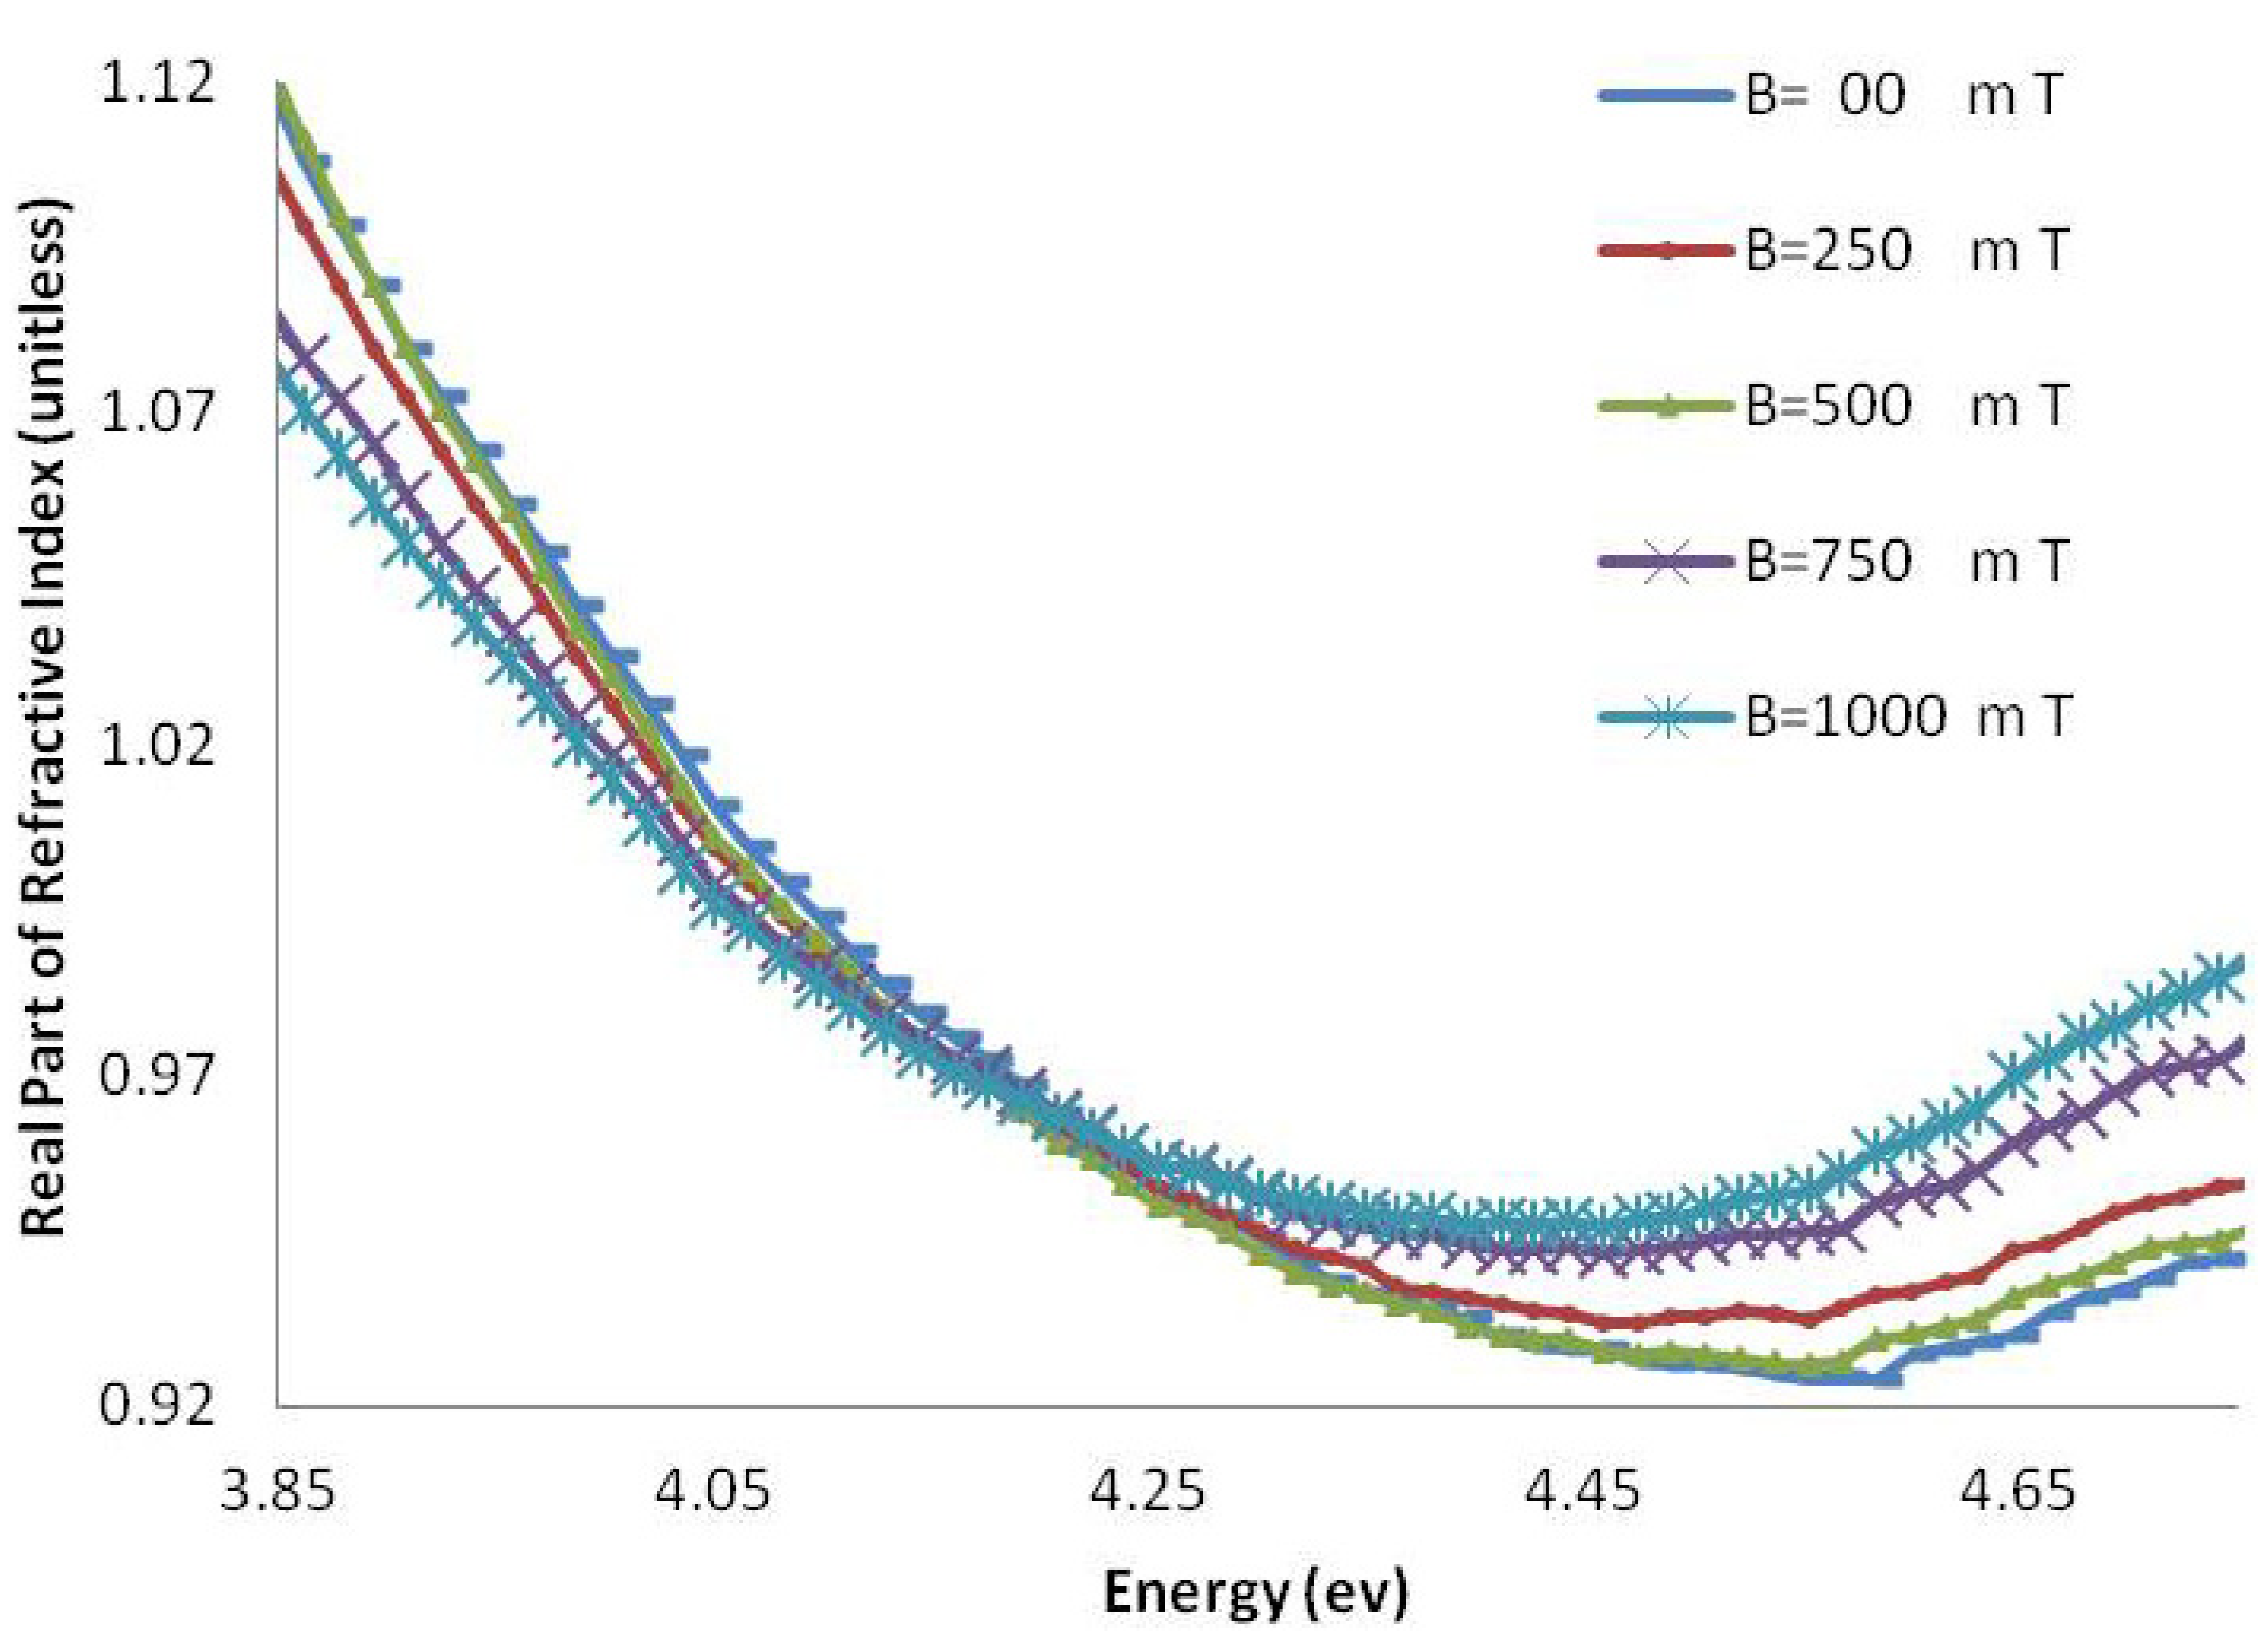
2.1.2. Refractive Index


2.2. Discussion
3. Experimental
3.1. Materials
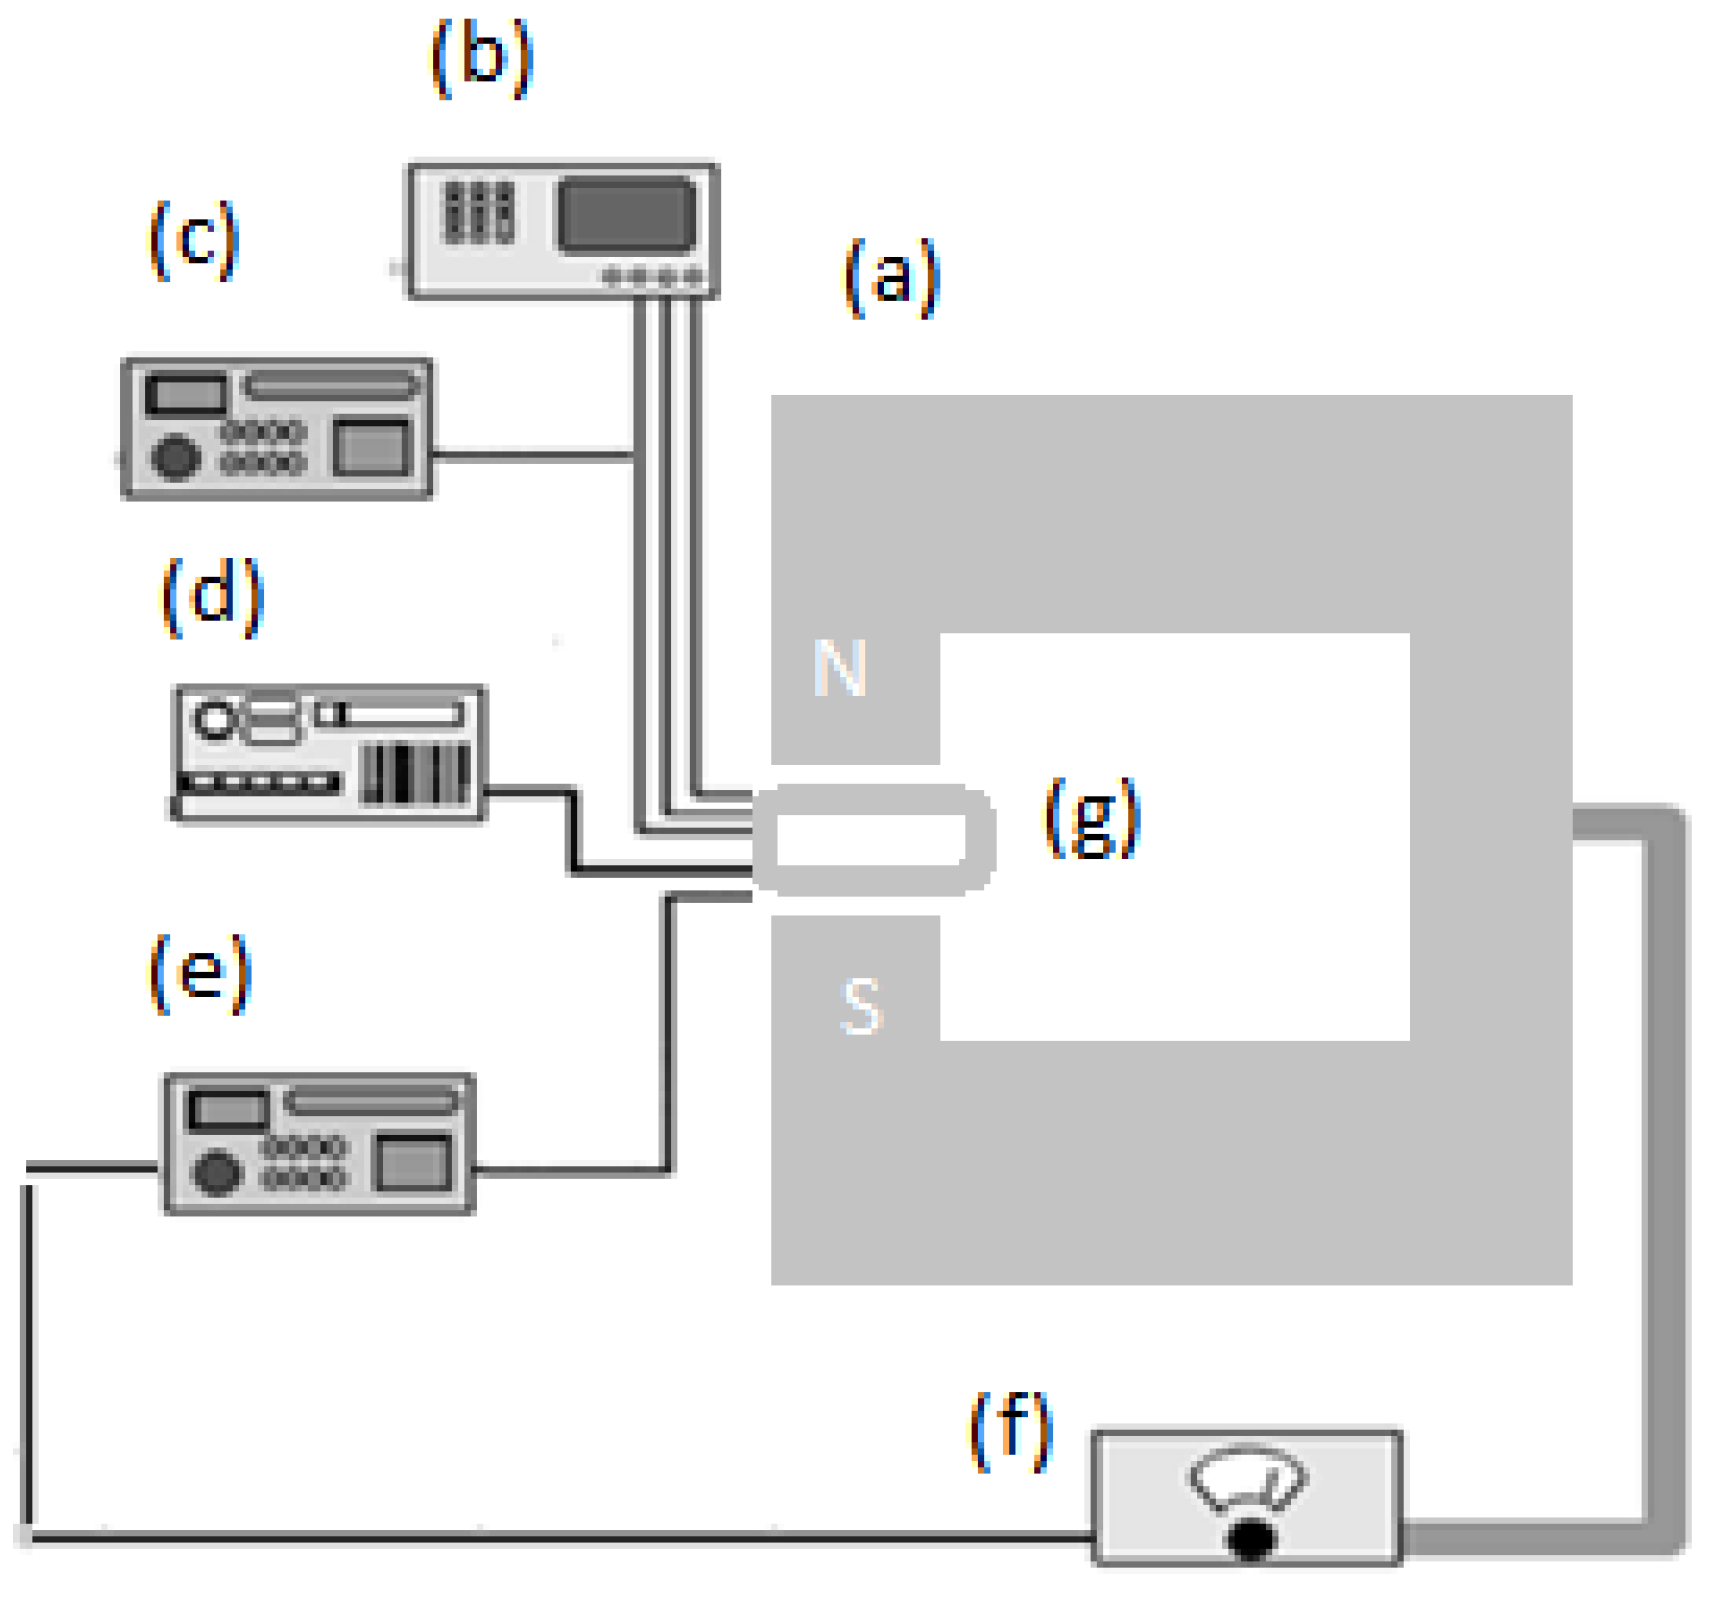
3.2. Set up
3.3. Chip Fabrication
4. Conclusions
Acknowledgments
Conflicts of Interest
References
- Foy, S.P.; Manthe, R.L.; Foy, S.T.; Dimitrijevic, S.; Krishnamurthy, N.; Labhasetwar, V. Optical imaging and magnetic field targeting of magnetic nanoparticles in tumors. ACS Nano 2010, 4, 5217–5224. [Google Scholar] [CrossRef]
- Pankhurst, Q.A.; Connolly, J.; Jones, S.; Dobson, J. Applications of magnetic nanoparticles in biomedicine. J. Phys. D 2003, 36, R167–R181. [Google Scholar]
- Chakeres, D.W.; de Vocht, F. Static magnetic field effects on human subjects related to magnetic resonance imaging systems. Prog. Biophys. Mol. Biol. 2005, 87, 255–265. [Google Scholar] [CrossRef]
- Chen, H.; Fu, H.; Zhu, X.; Cong, P.; Nakamura, F.; Yan, J. Improved high-force magnetic tweezers for stretching and refolding of proteins and short DNA. Biophys. J. 2011, 100, 517–523. [Google Scholar]
- Ichioka, S.; Iwasaka, M.; Shibata, M.; Harii, K.; Kamiya, A.; Ueno, S. Biological effects of static magnetic fields on the microcirculatory blood flow in vivo: A preliminary report. Med. Biol. Eng. Comput. 1998, 36, 91–95. [Google Scholar] [CrossRef]
- Gijs, M.A.M. Magnetic bead handling on-chip: New opportunities for analytical applications. Microfluid. Nanofluidics 2004, 1, 22–40. [Google Scholar]
- De Vlaminck, I.; Henighan, T.; van Loenhout, M.T.J.; Burnham, D.R.; Dekker, C. Magnetic forces and DNA mechanics in multiplexed magnetic tweezers. PLoS One 2012, 7, e41432. [Google Scholar]
- Tempestini, A.; Cassina, V.; Brogioli, D.; Ziano, R.; Erba, S.; Giovannoni, R.; Cerrito, M.G.; Salerno, D.; Mantegazza, F. Magnetic tweezers measurements of the nanomechanical stability of DNA against denaturation at various conditions of pH and ionic strength. Nucleic Acids Res. 2013, 41, 2009–2019. [Google Scholar] [CrossRef]
- Khatir, N.M.; Banihashemian, S.M.; Periasamy, V.; Ritikos, R.; Abd Majid, W.H.; Rahman, S.A. Electrical characterization of Gold-DNA-Gold structures in presence of an external magnetic field by means of I-V curve analysis. Sensors 2012, 12, 3578–3586. [Google Scholar]
- Miller, M.; Sheehan, P.; Edelstein, R.; Tamanaha, C.; Zhong, L.; Bounnak, S.; Whitman, L.; Colton, R. A DNA array sensor utilizing magnetic microbeads and magnetoelectronic detection. J. Magn. Magn. Mater. 2001, 225, 138–144. [Google Scholar] [CrossRef]
- Abdul Rahman, S.; Abd Majid, W.H.; Periasamy, V.; Banihashemian, S.M.; Mahmoudy Khatir, N. Current-voltage characterization on Au-DNA-Au junctions under the influence of magnetic field. Adv. Mater. Res. 2012, 535, 1350–1353. [Google Scholar]
- Thompson, D.G.; Enright, A.; Faulds, K.; Smith, W.E.; Graham, D. Ultrasensitive DNA detection using oligonucleotide-silver nanoparticle conjugates. Anal. Chem. 2008, 80, 2805–2810. [Google Scholar] [CrossRef]
- Dhar, S.; Daniel, W.L.; Giljohann, D.A.; Mirkin, C.A.; Lippard, S.J. Polyvalent oligonucleotide gold nanoparticle conjugates as delivery vehicles for platinum (IV) warheads. J. Am. Chem. Soc. 2009, 131, 14652–14653. [Google Scholar] [CrossRef]
- Lan, G.-Y.; Chen, W.-Y.; Chang, H.-T. One-pot synthesis of fluorescent oligonucleotide Ag nanoclusters for specific and sensitive detection of DNA. Biosens. Bioelectron. 2011, 26, 2431–2435. [Google Scholar] [CrossRef]
- Magbanua, E.; Zivkovic, T.; Hansen, B.; Beschorner, N.; Meyer, C.; Lorenzen, I.; Grotzinger, J.; Hauber, J.; Torda, A.E.; Mayer, G. d (GGGT) 4 and r (GGGU) 4 are both HIV-1 inhibitors and interleukin-6 receptor aptamers. RNA Biol. 2013, 10, 216–227. [Google Scholar] [CrossRef]
- Cantor, C.R.; Warshaw, M.M.; Shapiro, H. Oligonucleotide interactions. III. Circular dichroism studies of the conformation of deoxyoligonucleolides. Biopolymers 1970, 9, 1059–1077. [Google Scholar] [CrossRef]
- Richards, E.G.; Fasman, G.D. Handbook of Biochemistry and Molecular Biology: Nucleic Acids; Fasman, C.D., Ed.; CRC: Cleveland, OH, USA, 1975; Volume 1, p. 197. [Google Scholar]
- Cavaluzzi, M.J.; Borer, P.N. Revised UV extinction coefficients for nucleoside-5'-monophosphates and unpaired DNA and RNA. Nucleic Acids Res. 2004, 32, e13–e13. [Google Scholar] [CrossRef]
- Houssier, G.; Kuball, H.G. Electro-optical properties of nucleic acids and nucleoproteins III. Kramers-Kronig relationships in linear birefringence and dichroism. Application to a DNA-proflavine complex. Biopolymers 1971, 10, 2421–2433. [Google Scholar] [CrossRef]
- Pinchuk, A. Optical constants and dielectric function of DNA's nucleotides in UV range. J. Quant. Spectrosc. Radiat. Transf. 2004, 85, 211–215. [Google Scholar] [CrossRef]
- Zak, A.K.; Majid, W. Effect of solvent on structure and optical properties of PZT nanoparticles prepared by sol-gel method, in infrared region. Ceram. Int. 2011, 37, 753–758. [Google Scholar] [CrossRef]
- Khorrami, G.H.; Zak, A.K.; Kompany, A. Optical and structural properties of X-doped (X = Mn, Mg, and Zn) PZT nanoparticles by Kramers-Kronig and size strain plot methods. Cera. Int. 2012, 5683–5690. [Google Scholar] [CrossRef]
- Sample Availability: Samples of the compounds are available from the authors.
© 2013 by the authors; licensee MDPI, Basel, Switzerland. This article is an open access article distributed under the terms and conditions of the Creative Commons Attribution license (http://creativecommons.org/licenses/by/3.0/).
Share and Cite
Banihashemian, S.M.; Periasamy, V.; Mohammadi, S.M.H.M.K.; Ritikos, R.; Rahman, S.A. Optical Characterization of Oligonucleotide DNA Influenced by Magnetic Fields. Molecules 2013, 18, 11797-11808. https://doi.org/10.3390/molecules181011797
Banihashemian SM, Periasamy V, Mohammadi SMHMK, Ritikos R, Rahman SA. Optical Characterization of Oligonucleotide DNA Influenced by Magnetic Fields. Molecules. 2013; 18(10):11797-11808. https://doi.org/10.3390/molecules181011797
Chicago/Turabian StyleBanihashemian, Seyedeh Maryam, Vengadesh Periasamy, Seyed Mohammad Hossein Mousa Kazemi Mohammadi, Richard Ritikos, and Saadah Abdul Rahman. 2013. "Optical Characterization of Oligonucleotide DNA Influenced by Magnetic Fields" Molecules 18, no. 10: 11797-11808. https://doi.org/10.3390/molecules181011797