Article

Simultaneous Determination of 14 Phenolic Compounds in Grape Canes by HPLC-DAD-UV Using Wavelength Switching Detection

1
College of Enology, Northwest A&F University, Yangling 712100, Shaanxi, China
2
Shaanxi Engineering Research Center for Viti-Viniculture, Yangling 712100, Shaanxi, China
3
College of Plant Science, Tarim University, Alaer 843300, Xinjiang, China
*
Author to whom correspondence should be addressed.
These authors contributed equally to this work.
Molecules 2013, 18(11), 14241-14257; https://doi.org/10.3390/molecules181114241
Submission received: 18 September 2013 / Revised: 7 November 2013 / Accepted: 13 November 2013 / Published: 18 November 2013

Abstract

:
The paper described a novel chromatographic method for the simultaneous determination of phenolic compounds such as gallic, protocatechuic, vanillic, caffeic, syringic, p-coumaric and salicylic acid, (+)-catechin, (‒)-epicatechin, rutin, morin, quercetin, coumarin and trans-resveratrol at their maximum absorbance wavelengths (MAW) employing reverse-phase high performance liquid chromatography combined with DAD and UV detection via detection wavelength switching. The method was based on MAW acquisition by DAD and quantification by UV. The separation process was performed on a Shim-Pack VP-ODS C18 column (250 mm × 4.6 mm, 5 μm) held at 30 °C, utilizing 3.0% acetic acid and acetonitrile as mobile phase at a flow rate of 0.8 mL/min in the gradient elution mode. The method was fully validated in terms of linearity (r2 > 0.9990, 10‒350 mg/L), precision (both intra-day and inter-day RSD < 4.22%), accuracy (97.31%‒104.66%), specificity, robustness (0.59% < RSD < 2.86%), limit of detection and quantification. The switching method significantly improved the sensitivities of most phenolics studied in comparison with the standard constant wavelength detection (280 nm). The proposed method has been successfully applied to the determination of 14 phenolic compounds in 89 varieties of one-year-old Chinese grape one-year-canes. Grape canes contain many phenolics, especially trans-resveratrol, (‒)-epicatechin, and (+)-catechin.

1. Introduction

Phenolic compounds have strong antioxidant activities associated with their abilities to scavenge free radicals, donate hydrogen, chelate metals, break radical chain reactions, and quench singlet oxygen in vitro and in vivo [1,2]. Among dietary antioxidants, phenolics are by far the most abundant compounds in most of the diets. Epidemiological studies have revealed the associations between the consumption of phenolic-rich foods and the prevention of oxidative stress-related diseases [3,4,5,6]. Concurrently, the synthetic antioxidants have restricted use in food as they are suspected to be carcinogenic [7]. People’s demand for natural products that can enhance and preserve health has never been greater with the enhancement of health consciousness.
The main solid wastes from vineyards and wineries, which include grape leaves, canes, pomace, and stems, are rich in high added-value natural antioxidants [8,9,10,11], especially in polyphenolic components. Compared with grape pomace and stems, people pay a little attention to grape canes with respect to the phenolic compound profile. The world total vineyard area reached approximately 7,636 mha in 2009 [12], with an approximate yearly grape cane yield of 1 t/ha [13], implying some 8,000,000 t of annual pruning waste production. These wastes represent a potentially important global source of natural antioxidants.
The content of phenolic compounds in biological samples can be determined by various analytical instrumental methods, such as gas chromatography [14], thin-layer chromatography [15], and capillary electrophoresis [16]. However, high performance liquid chromatography (HPLC) has proved to be the most appropriate owing to the structural similarity and diversity of phenolic compounds, allowing the analysis with sufficient precision, selectivity and within a reasonable time. HPLC typically hyphenated with ultraviolet visible (UV), photodiode array (DAD), mass spectrometry (MS), electrochemical (ED), fluorescence (FD), chemiluminescence (CL), refractive index (RI), and evaporative light scattering (ELSD) detectors has been the best method of choice for routine analysis of phenolic compounds in most hitherto published studies. However, in many cases, the disadvantages of some detectors were their limited analytical application because of baseline drift, limitations of detecting electrochemically inactive compounds (ED), complex pretreatment of non-fluorescent analytes (FD), fewer chemiluminescence reactions available, interference from excess use of some derivation reagents, incompatibility of the mobile phase with chemiluminescence reactions (CL) and low sensitivity (RI, ELSD) [17,18,19,20,21,22,23,24]. The critical decision for the analyst of which analytical technique to employ, is not only dependent on the expected composition of the sample and the designation of analytical expectations, but also certainly on the instrument availability.
Among all the detectors coupled with HPLC for the determination of phenolic compounds, MS is the most expensive and unusual one, especially for the labs with limited facilities. UV and DAD are the most useful and common ones in ordinary labs. Indeed a lot of previous papers existed which are about phenolic compound detection by HPLC via UV or DAD detection, but there is a universal phenomenon which is the non-uniform detection wavelengths adopted to determine the same or similar phenolic compounds. As we know, the optimum detection wavelengths for the determination of phenolics by HPLC-DAD-UV should be set for the sake of accurate quantitation, moreover, the MAW of phenolic compounds may differ due to their characteristic absorbance groups. To obtain the objective or true content of each phenolic compound in the matrix during the simultaneous determination, the proper detection wavelength should be set at the MAW for every compound. However, the wavelengths used in many literatures for phenolic compounds determination are not their MAW, even by DAD detection, which are usually a sort of compromise detection wavelength. A brief summary of UV and DAD detectors used in analysis of phenolic compounds with the emphasis to detection wavelength selection was displayed in Table 1.
Table 1. Detectors and wavelengths used in recent papers for phenolics detection.
SampleIndividual phenolics aDetectorDetection wavelength (nm)Ref.
Grape & WinePCA, EC, PA, CA, GA, CAT, VA, SYAUV-vis280[25]
Cumin organsPCA, EC, PA, GA, QC, CAT, VA, SYAUV-vis280[26]
Grape seedsPCA, EC, GA, QC, CAT, RT, VA, SYAUV-vis280[27]
WineRESUV-vis310[28]
JujubeGA, CAUV-vis280[29]
Wine and teaGA, PA, VA, CA, CAT, EC, SYA, QC, RTUV-vis280[30]
RT (Synthesized)UV-vis280[31]
MushroomRTUV-vis300[32]
WineEC, CA, QC, RES, CAT, RTUV-visEC, CAT, RES-280; CA-320; QC, RT-360[33]
Guava leafMR, GA, QC, CATUV-vis280[34]
Grape wasteCA, GA, QC, RES, CAT, RT, SYAUV-vis280[35]
WineQC, RT, MRUV-vis360[36]
CheonggukjangCA, EC, PA, MR, GA, CAT, VAUV-vis280[37]
Plant materialPHA, VA, CA, SYA, PCAUV-vis254[38]
WinePCA, EC, PA, CA, GA, QC, RES, CAT, VADAD280[39]
KnotweedCAT, EC, RESDADRES-315; CAT, EC-220[40]
Grape caneRESDAD320[10]
MescalSYADAD260[41]
TeaGA, PA, VA, CA, CAT, EC, RT, QC.DAD280[42]
Peanut skinRESDAD280[43]
Ma-mao juiceEC, QC, RES, CAT, RTDAD254[44]
Guava leafGA, CAT, QCDAD280[45]
BeverageCAT, EC, QCDADQC-360; CAT, EC-230[46]
Grape seed and skinEC, GA, CAT, VA, SYADAD280[47]
Grape productGA, CAT, EC, RES, CA, PCA, QCDADGA, CAT, EC-280; RES, CA, PCA-320; QC-360[48]
a CA caffeic acid; CAT (+)-catechin; CR coumarin; EC (‒)-epicatechin; GA gallic acid; MR morin; PA protocatechuic acid; PCA p-coumaric acid; QC: quercetin; RES trans-resveratrol; RT rutin; SLA salicylic acid; SYA syringic acid; VA vanillic acid.
Ten of or tens of nanometers of detection wavelength differences usually happen during the determination of the same compounds, this may result in non-detected or false values for some compounds in trace detection and lead discrepancies and incomparability of the results, especially for the same analytes analyzed by different researchers. A DAD detector could simultaneously scan samples at multiple wavelengths and provide the information of the special spectral characteristics for identification of compounds, but its sensitivity is lower than that of UV detectors for quantitation [49]. To overcome these pitfalls, we proposed a wavelength-switching method by HPLC coupled with a DAD detector for MAW acquisition and a UV detector for quantitation.
In this work, an optimized and exhaustively validated method for the simultaneous analysis of gallic acid, protocatechuic acid, (+)-catechin, vanillic acid, caffeic acid, syringic acid, (‒)-epicatechin, p-coumaric acid, rutin, salicylic acid, coumarin, trans-resveratrol, morin, and quercetin in 89 varieties of Chinese grape canes was developed using HPLC-DAD-UV with wavelength switching detection. In addition, the sensitivities of UV and DAD were determined under both constant and wavelength switching detection, and fine-tuning of wavelength of the UV detector was investigated to indicate the differences in results of MAW and common wavelengths detection.

2. Results and Discussion

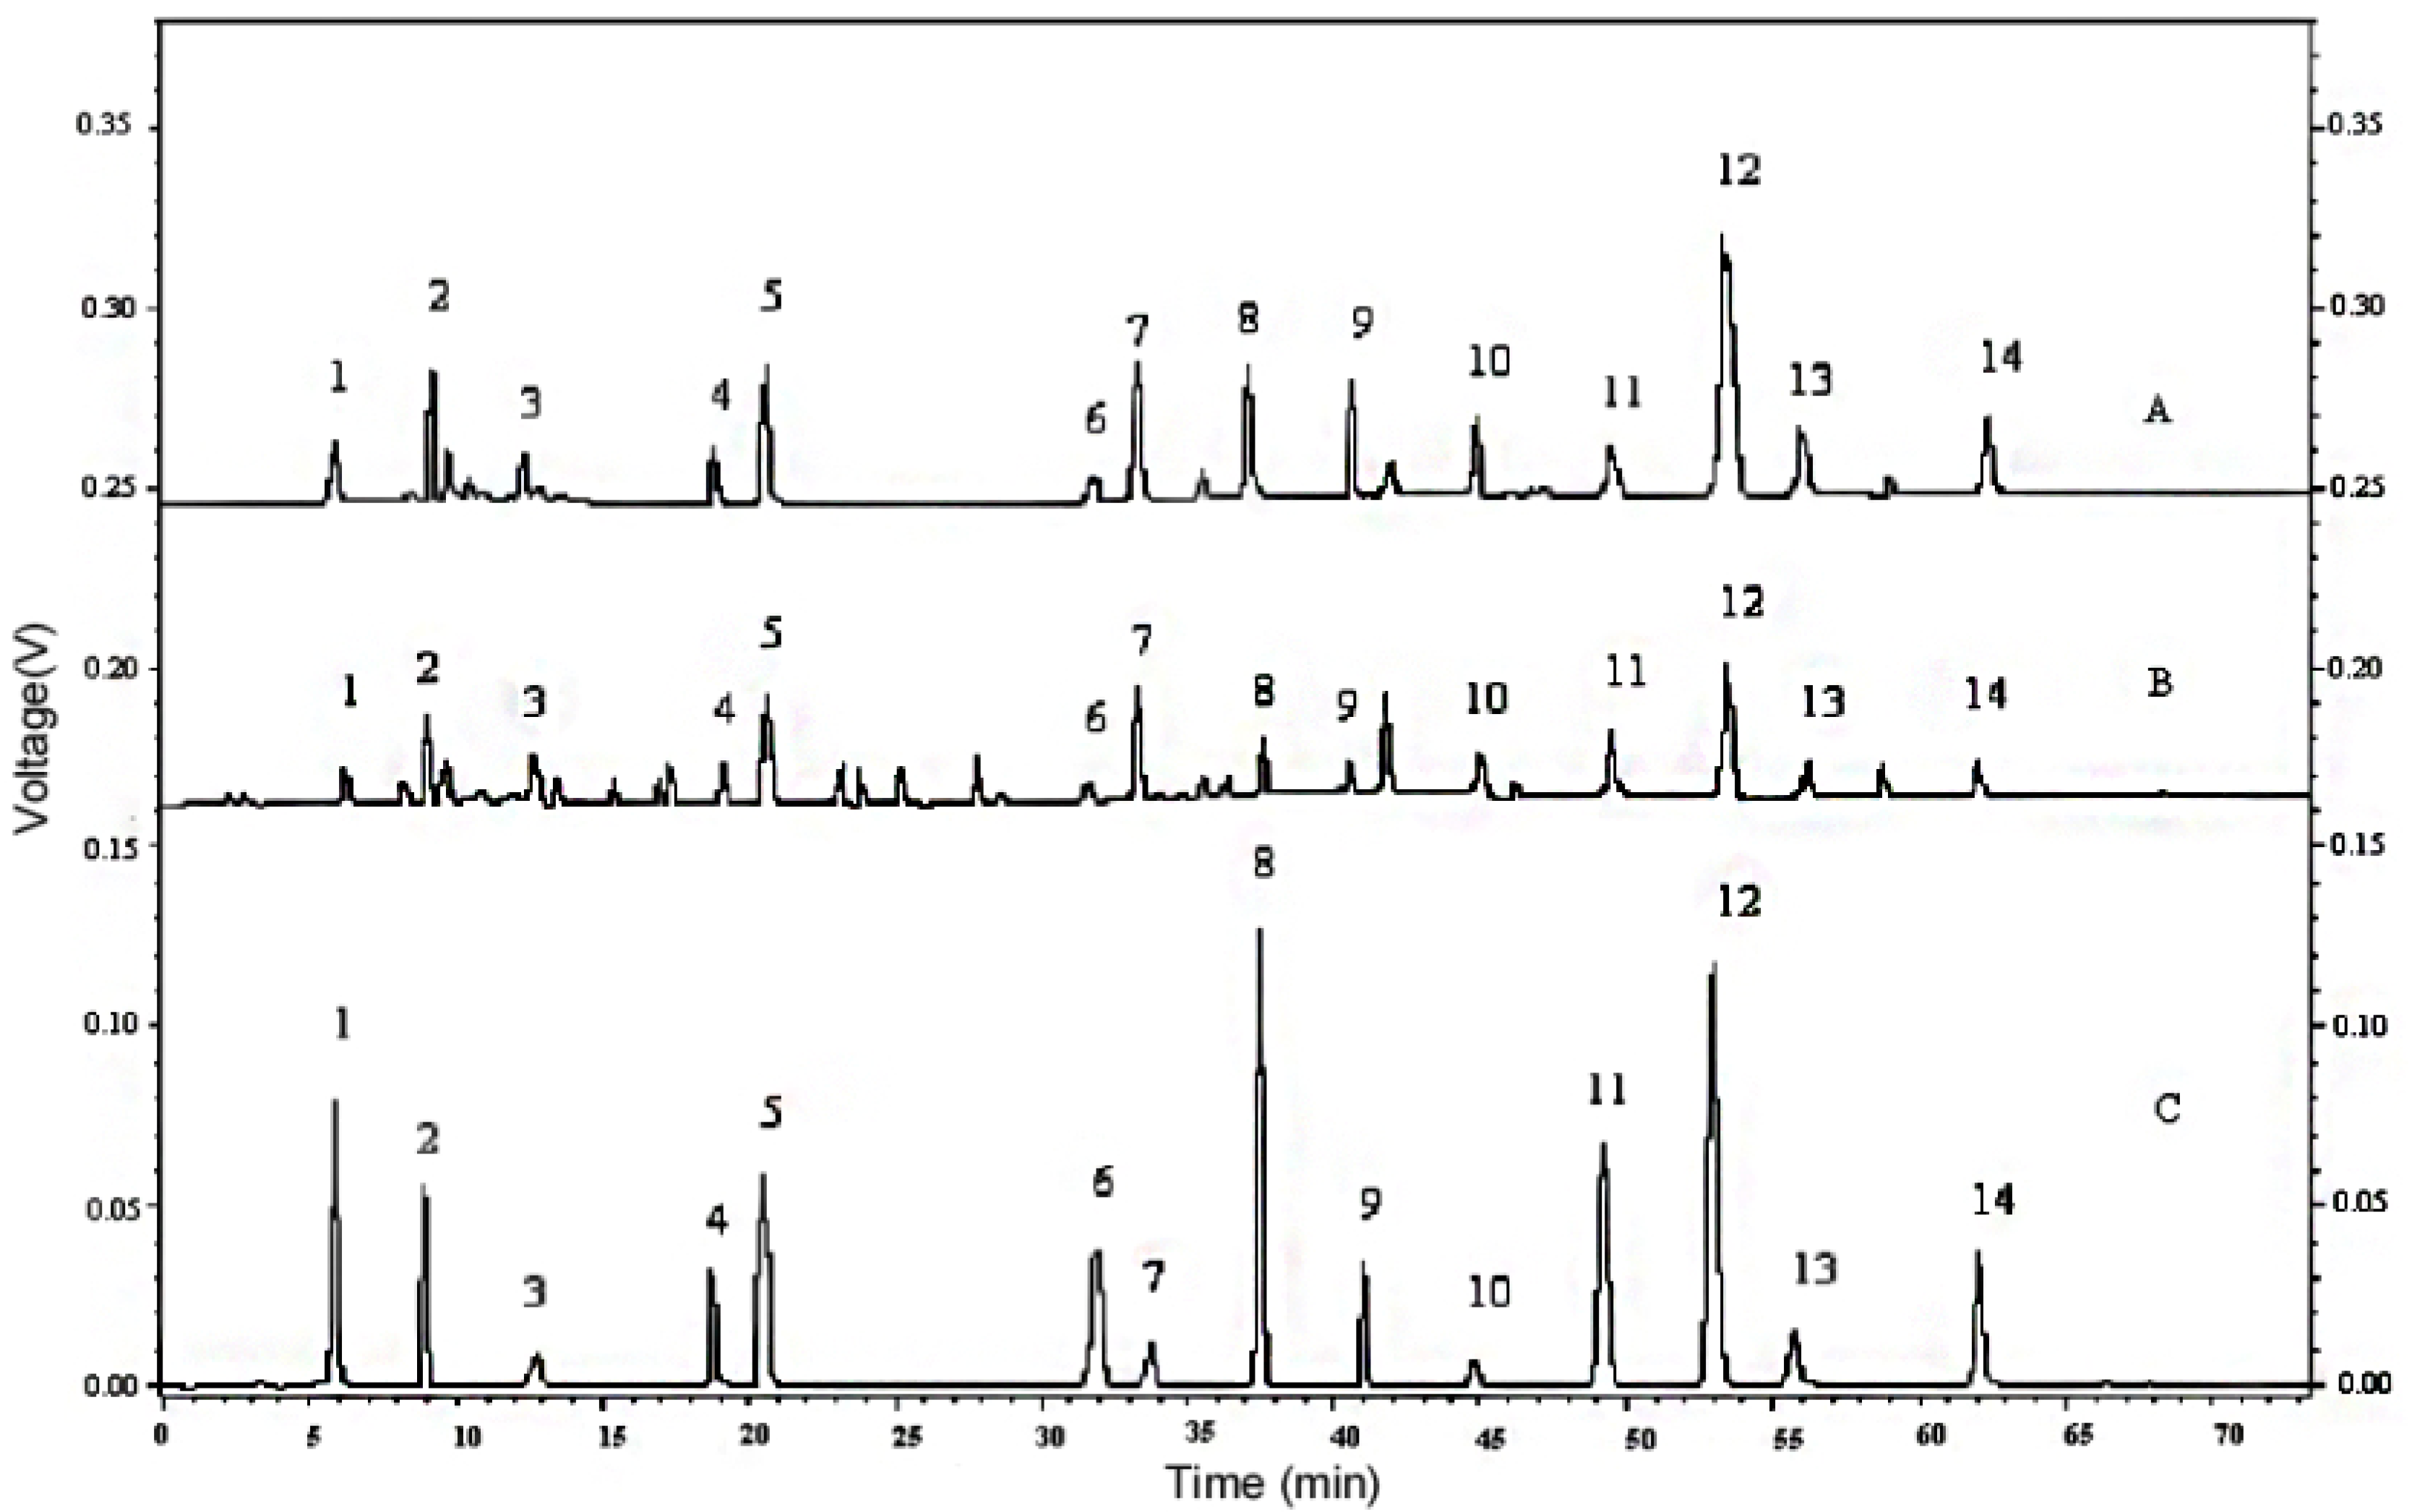
2.1. Optimization of Chromatographic Conditions

The aim of this study was to establish a sequential injection procedure, which has the ability to provide suitable separation conditions for the determination of gallic acid, protocatechuic acid, (+)-catechin, vanillic acid, caffeic acid, syringic acid, (‒)-epicatechin, p-coumaric acid, rutin, salicylic acid, coumarin, trans-resveratrol, morin, and quercetin (Figure 1), and to demonstrate the feasibility of applying this method to real samples. It is well known that the elution order of phenolic compounds in RP-HPLC is closely related to their polarity, with the most polar ones eluting first, followed the less polar ones. Once the analyte types are identified, the parameters affecting HPLC retention performance such as sample solvents, mobile phase composition, column temperature, and flow rate should be optimized.
Figure 1. Chemical structures of phenolic compounds.
Molecules 18 14241 g001
Eight varieties of mobile phases (methanol/water, acetonitrile/water, methanol/1%, 2%, 3% acetic acid, and acetontrile/1%, 2%, 3% acetic acid), three column temperatures (28, 30, and 32 °C), and three flow rates (0.6, 0.8, and 1.0 mL/min) were tested to screen optimal chromatographic conditions. Although methanol and acetonitrile as mobile phase had similar strength, peaks for phenolic compounds eluted by methanol were broader than those by acetonitrile in this study. Some asymmetrical peaks (catechin, syringic acid, and morin) and very late eluting peaks (morin and quercetin) were also observed in methanol elution compared to acetonitrile. This might be attributed to the higher dipole moment of acetonitrile, with the resulting stronger analyte-mobile phase dispersive interaction (donor-acceptor interactions). The sharp peaks and shorter run times observed when using acetonitrile were similar to the results reported by other authors [50,51]. Peaks of vanillic acid and caffeic acid were found to be difficult to separate in a chromatogram both with methanol and acetonitrile due to their similar retention properties, with resolution factors of 1.28 and 1.43, respectively. The use of 3% acetic acid solution as a mobile phase additive achieved good separation and resolution of all the phenolic compounds of interest in this study. The optimized flow rate and column temperature were 0.8 mL/min and 30 °C, respectively, for the purposes of shortening analysis times and improving peak shape after several tests.
Phenolic compounds absorb well in the UV range with different absorptive intensity and response times due to their respective characteristic structures, therefore, choosing suitable detection wavelengths for each analyte should be seriously considered and no single one is sufficient for the simultaneous determination in extracts of various plant materials. MAWs of 14 phenolic compounds scanned by the DAD detector were listed in Table 2. Although phenolic compounds have more than one absorption peaks in their DAD spectra, except for gallic acid, (+)-catechin, syringic acid, (‒)-epicatechin, p-coumaric acid, and trans-resveratrol, the more intense ones were chosen as their detection wavelengths. There were just three phenolic compounds with the same maximum absorbance at 280 nm. Apparently, detection at 280 nm, the most general detection wavelength used for the simultaneous determination of different phenolic compounds, was insufficient.
Table 2. Data of MAW, retention, response, and switching times for phenolic compounds.
NameRetention time ± SDMAW (nm)Response time, duration (min)Switching time, duration (min)
Gallic acid5.883 ± 0.0142715.513–6.243, 0.7305.463–6.293, 0.830
Protocatechuic acid8.932 ± 0.0152608.707–9.157, 0.4498.657–9.207, 0.549
(+)-Catechin12.705 ± 0.01928012.205–13.125, 0.92012.155–13.175, 1.020
Vanillic acid18.637 ± 0.01826018.324–18.997, 0.67318.274–19.047, 0.773
Caffeic acid20.574 ± 0.02032420.129–21.025, 0.89620.079–21.075, 0.996
Syringic acid31.683 ± 0.01927531.174–32.184, 1.01031.124–32.234, 1.110
(‒)-Epicatechin33.712 ± 0.01128033.28–34.133, 0.85333.230–34.183, 0.953
p-Coumaric acid37.486 ± 0.01730937.143–37.835, 0.69237.093–37.885, 0.792
Rutin41.058 ± 0.01925540.882–41.234, 0.35240.832–41.284, 0.452
Salicylic acid44.927 ± 0.01630444.502–45.353, 0.85144.452–45.403, 0.951
Coumarin49.384 ± 0.01828048.881–49.886, 1.00548.831–49.936, 1.105
trans-Resveratrol53.115 ± 0.01530652.610–53.624, 1.01452.560–53.674, 1.114
Morin55.867 ± 0.01525655.251–56.489, 1.23855.201–56.539, 1.338
Quercetin62.342 ± 0.02037461.839–62.845, 1.00661.789–62.895, 1.106
The time points for wavelength switching for each compound were set based on their retention and response times acquired from linearity experiments, as can be seen in Table 2. The retention time in 18 continuous analysis indicated excellent repeatability expressed as RSD (<0.27%). The Shimadzu HPLC allows random wavelength switching between 190 and 400 nm, the detector’s response and stabilization time is less than 0.1 s (data from Shimadzu Technique). In this experiment, the detection wavelength was switched within 0.05 min before peak signal starting and after its stopping, which implied that each phenolic compound could be detected at its MAW. The wavelength at other time periods was set to 360 nm, which minimized the interferences from solvents and impurities. The representative chromatograms of the phenolic standards and sample separation are shown in Figure 2. Wavelength-switching detection gave a more effective chromatogram with less impurity peaks than did the constant wavelength (280 nm) one.
Figure 2. Typical HPLC chromatograms A: Cabernet Sauvignon extract at switching wavelength; B: Cabernet Sauvignon extract at 280 nm; C: Standard compounds at switching wavelength. Peaks: 1‒Gallic acid; 2‒Protocatechuic acid; 3‒(+)-Catechin; 4‒Vanillic acid; 5‒Caffeic acid; 6‒Syringic acid; 7‒(‒)-Epicatechin; 8‒p-Coumaric acid; 9‒Rutin; 10‒Salicylic acid; 11‒Coumarin; 12‒trans-Resveratrol; 13‒Morin; 14‒Quercetin.
Molecules 18 14241 g002

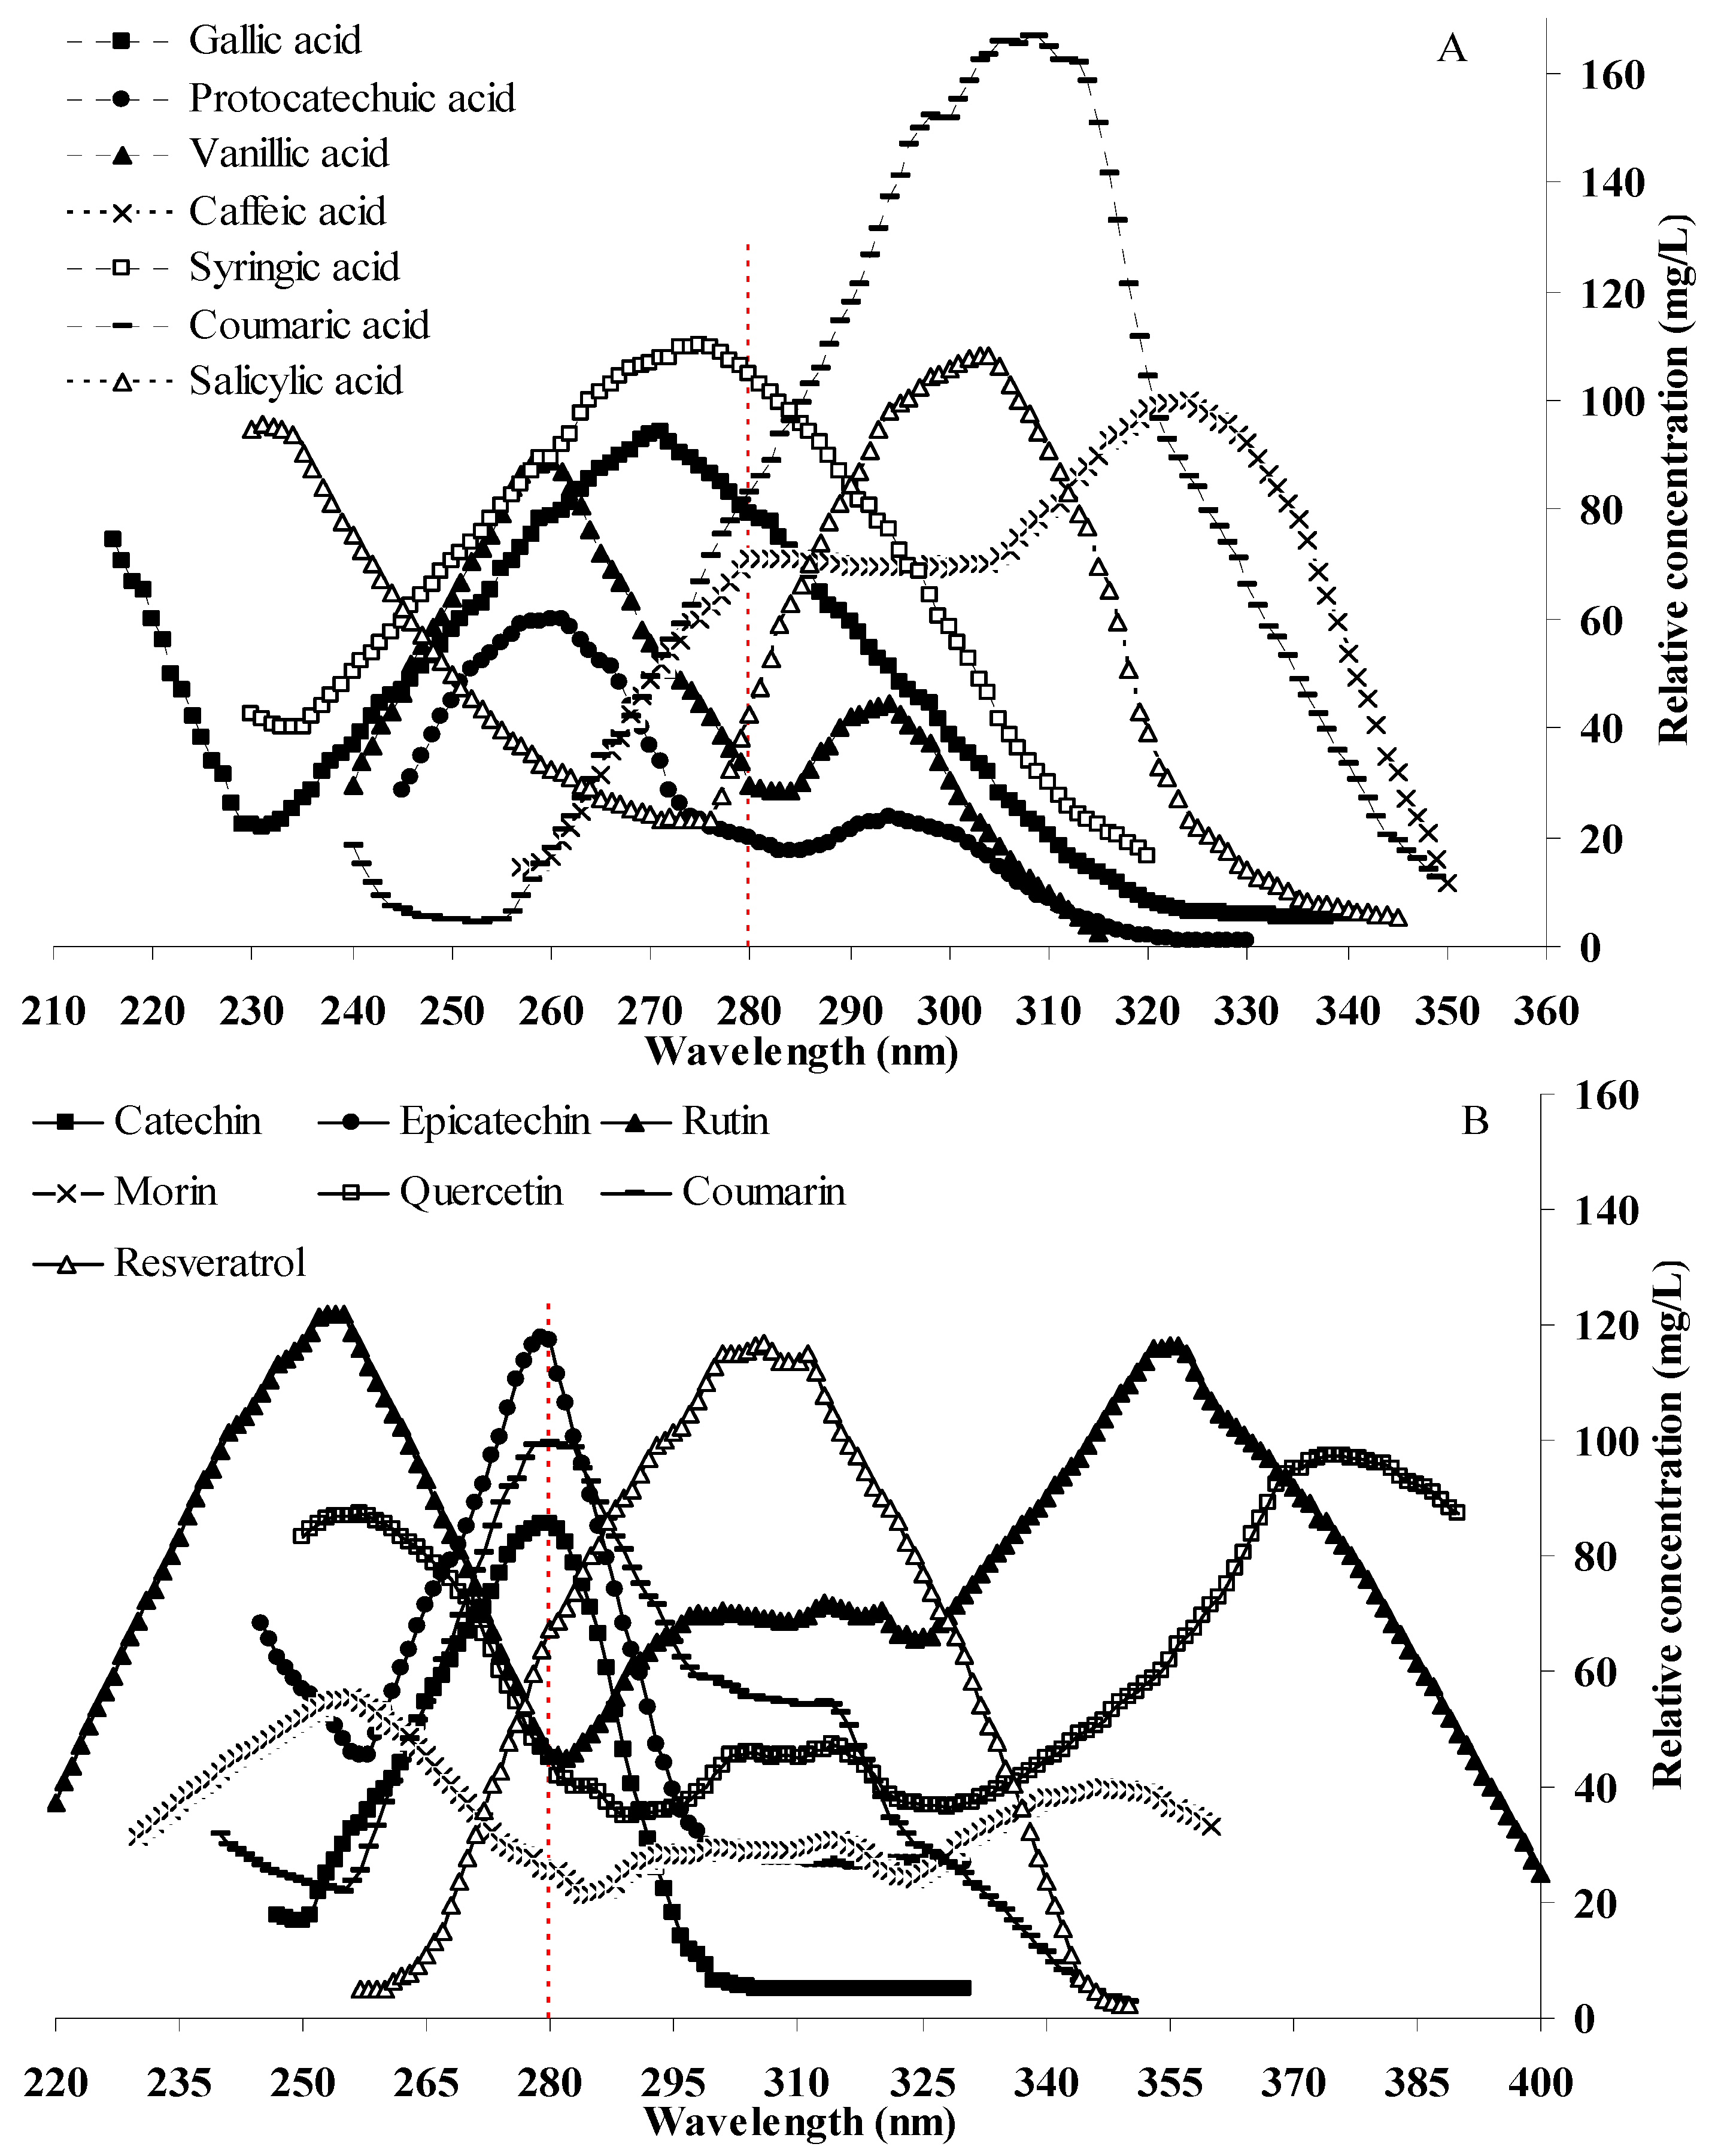
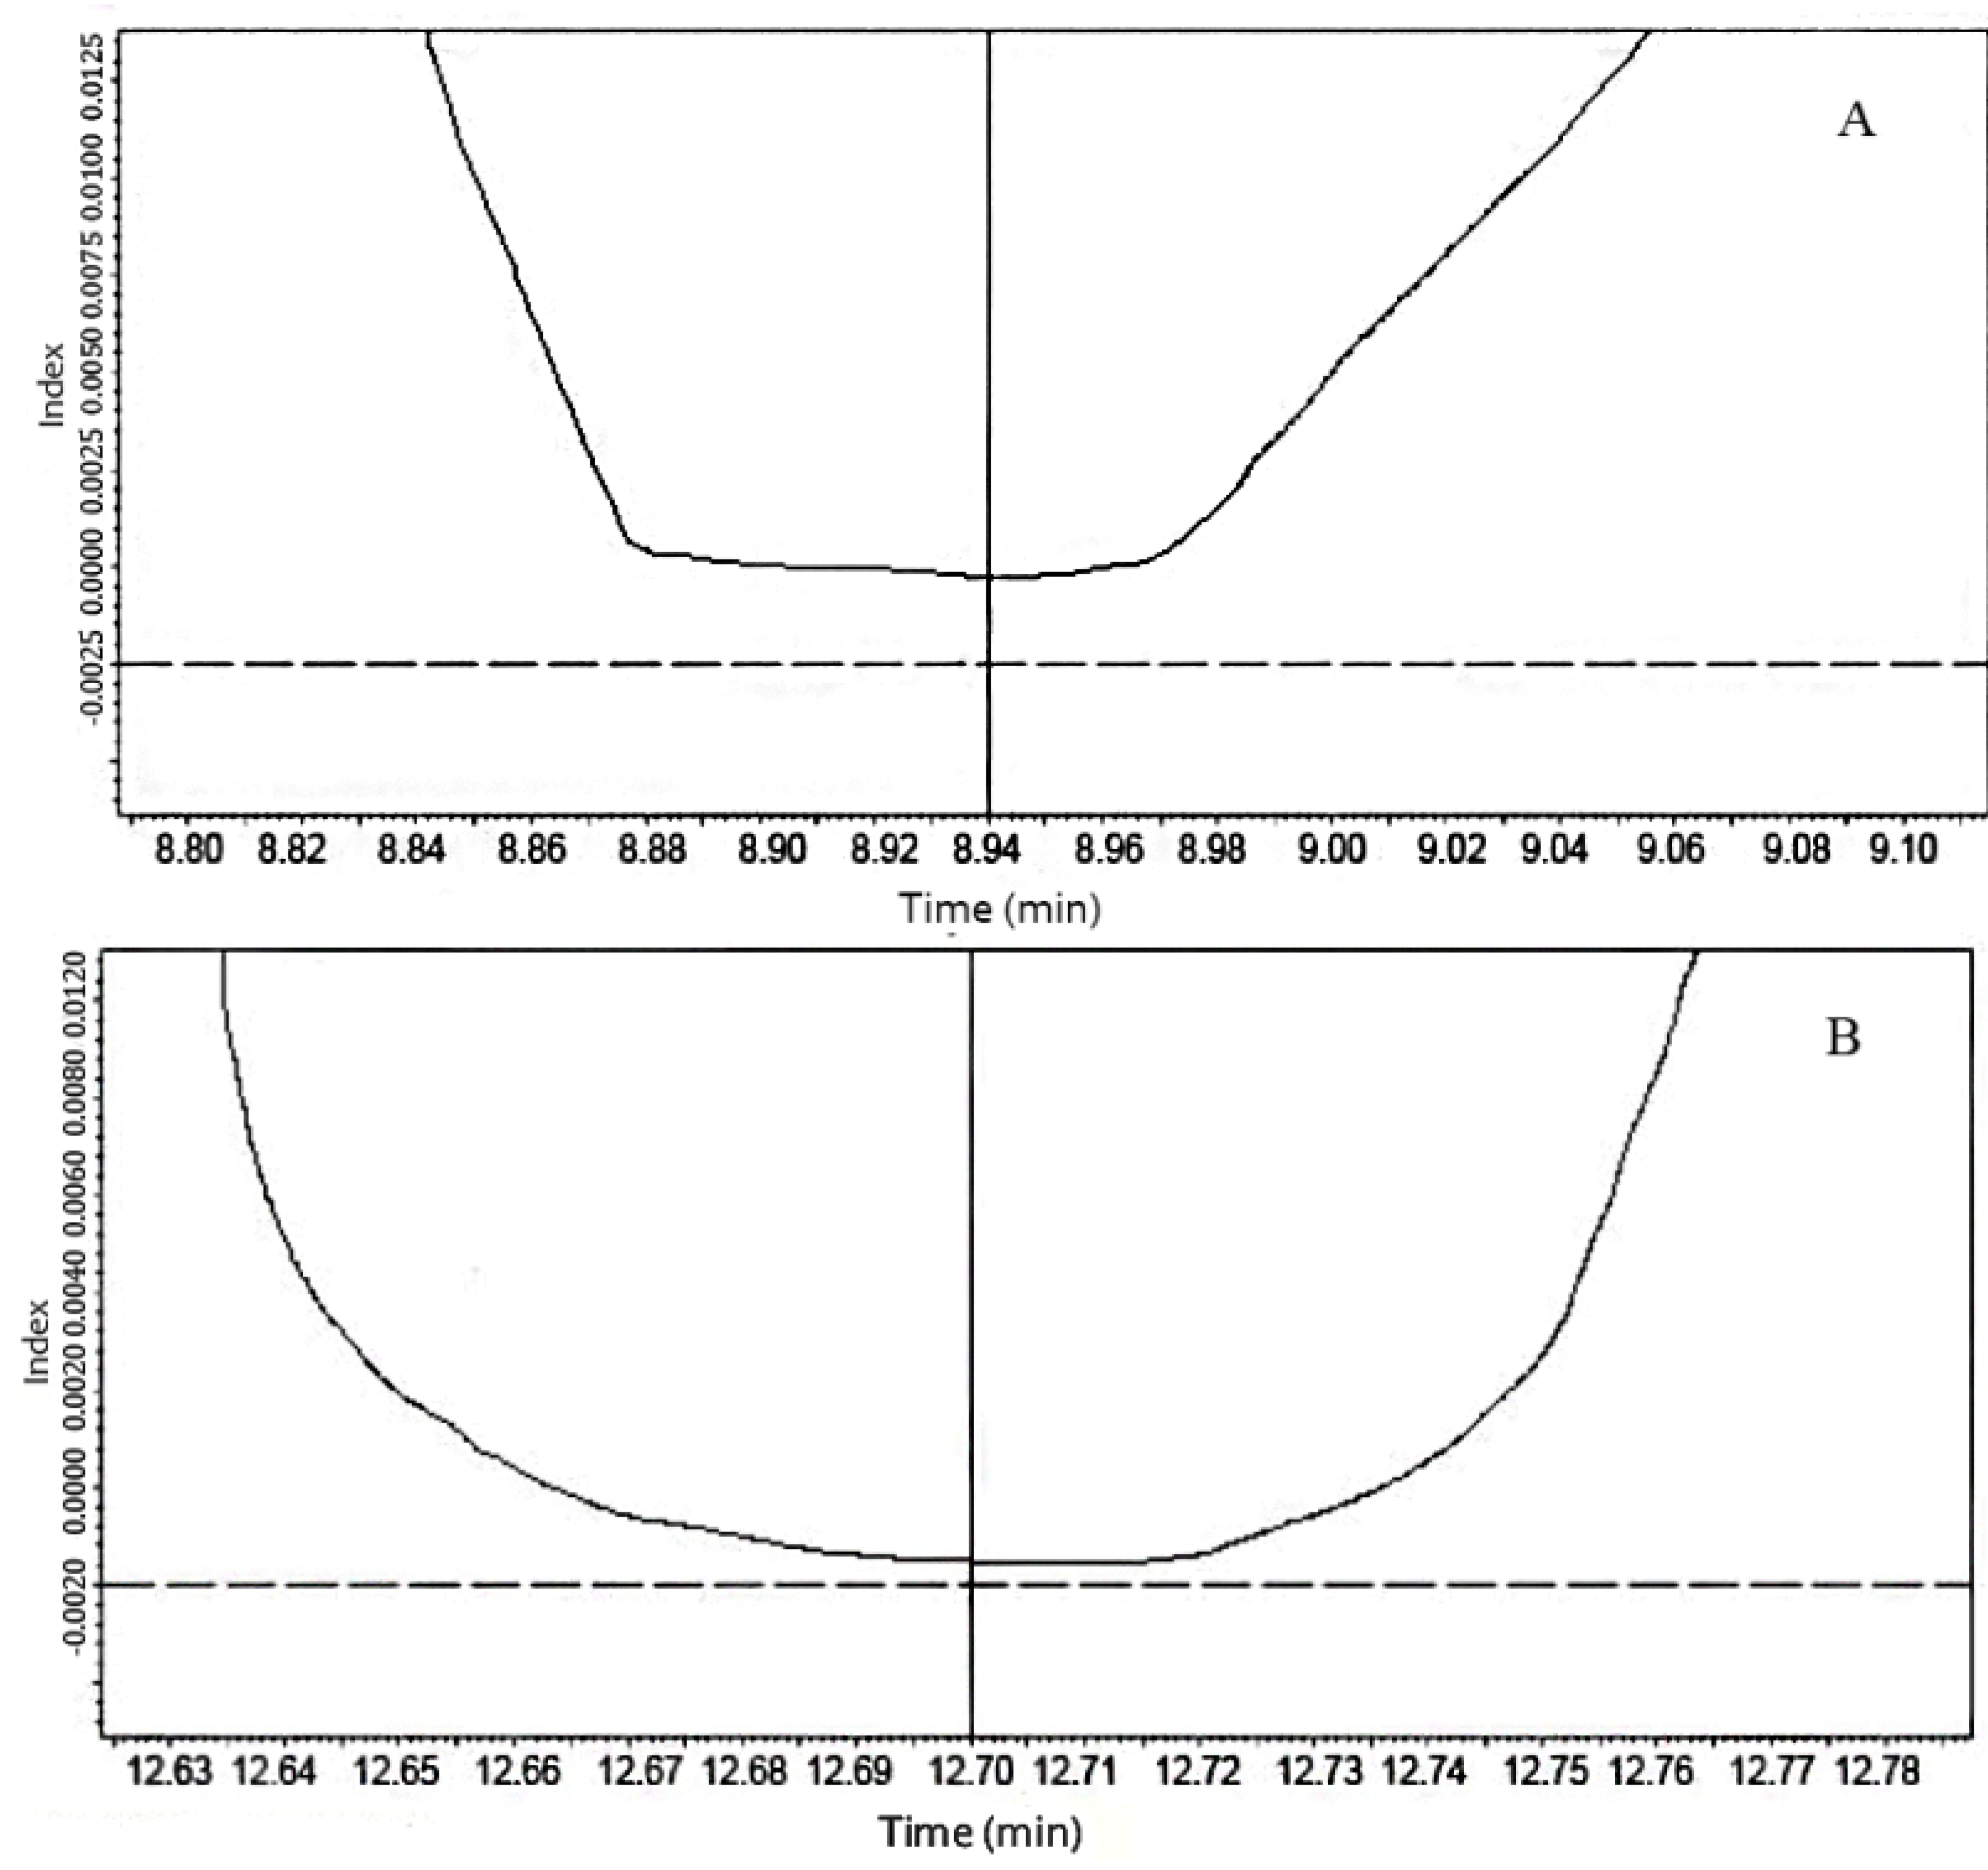
2.2. Fine-Tuning of Detection Wavelength

The wavelength fine-tuning data manifested the relationship between the relative concentrations and the detection wavelengths for the same concentrated standard solution. The results are shown in Figure 3. It can be seen that the relative concentrations of different compounds varied with wavelengths dramatically. Compared with detection at 280 nm, the relative concentrations of protocatechuic acid and vanillic acid were almost three times lower than those at their MAW, and gallic acid, caffeic acid, p-coumaric acid, and salicylic acid were about 1.2, 1.5, 2, and 2.5 times, respectively, as can be seen in Figure 3A. The relative concentrations of rutin, morin, and quercetin determined at their MAW were almost 2.7, 2.2, and 2.2 times higher than those at 280 nm, and trans-resveratrol at 280 nm was 1.7 times lower in comparison with its MAW (Figure 3B). The detection wavelengths of 14 phenolic compounds with the highest relative concentrations were in conformity with the MAW given by the DAD detector.
Figure 3. Relative concentrations of phenolic compounds under different detection wavelengths (A) phenolic acids; (B) flavonoids, coumarin, and trans-resveratrol).
Molecules 18 14241 g003

2.3. Validation of the Method

The analytical method, proposed for the determination of 14 phenolic compounds in 1-yr-old grape canes by HPLC-DAD-UV with wavelength switching detection, was validated in terms of linearity, range, LOD, LOQ, specificity, accuracy, precision and robustness.
Method linearity is the ability to produce the results that are directly proportional to the concentrations of analytes in the sample within a given range. In the present study, linearity was evaluated by plotting peak area (A) versus analyte concentration (C, mg/L) to construct the calibration curves. Regression equations of 14 phenolic compounds listed in Table 3 were linear in the investigated range, with the lowest correlation coefficient ≥ 0.9990, indicating excellent linearity.
A signal-to-noise ratio of approximately 3 is generally considered to be acceptable for estimating the detection limit. The quantitation limit with a typical signal-to-noise ratio of 10 is the lowest concentration of the analyte that can be quantified with acceptable precision and accuracy. LOD and LOQ were separately analyzed by diluting the standard solution. The LOD and LOQ, both for UV-vis and DAD detectors under constant (280 nm) and switching wavelength detection, were studied while keeping all other chromatographic conditions the same, details are given in Table 3. Regarding sensitivity, the UV-Vis detector with wavelength switching had the highest sensitivity for determination of phenolic compounds in comparison with that achieved by both UV-Vis and DAD detector with constant detection or DAD with wavelength switching.
Table 3. Results of calibration and sensitivity, including LOD and LOQ of UV and DAD detectors under different detection wavelength modes (mg/L).
Name aLinear equation bCorr. coeff. (r2)UV detectorDAD detector
Constant (280 nm)SwitchingConstant (280 nm)Switching
LODLOQLODLOQLODLOQLODLOQ
GAC = 46051(±385)A − 209260(±3821)0.99930.0320.0980.0210.0620.0640.1880.0430.119
PAC = 27162(±321)A − 74702(±275)0.99930.0440.1250.0150.0430.1340.3870.0480.151
CATC = 11372(±199)A − 49365(±328)0.99910.0260.0730.0260.0730.1200.2900.1200.290
VAC = 6648(±45)A + 1235(±41)0.99910.0680.1820.0330.0950.0980.2850.0620.179
CAC = 85705(±612)A − 283259(±4372)0.99960.0370.1100.0250.0770.1260.3680.0990.302
SYAC = 49634(±654)A − 106819(±1422)0.99930.0130.0380.0090.0260.0340.0970.0400.116
ECC = 10877(±162)A − 73865(±705)0.99920.0620.3580.0620.3580.1390.5080.1390.508
PCAC = 66221(±524)A − 138690(±2312)0.99970.0190.0580.0130.0370.0470.1450.0300.085
RTC = 19525(±327)A − 29519(±342)0.99900.0650.1820.0220.0640.1080.3310.0870.273
SLAC = 9282(±76)A − 46686(±366)0.99950.1210.3560.0520.1480.2350.6980.1040.317
CRC = 65717(±678)A − 44484(±621)0.99960.0340.1330.0340.1330.1360.4050.1360.405
RESC = 94435(±628)A + 250679(±2313)0.99970.0070.0230.0030.0080.0670.2070.0320.092
MRC = 12833(±465)A + 73026(±665)0.99910.0370.1120.0230.0600.1220.3710.0810.237
QCC = 31436(±973)A − 77114(±768)0.99980.0410.1250.0170.0530.1420.4220.0760.232
a GA: Gallic acid; PA: Protocatechuic acid; CAT: (+)-Catechin; VA: Vanillic acid; CA: Caffeic acid; SYA: Syringic acid; EC: (‒)-Epicatechin; PCA: p-Coumaric acid; RT: Rutin; SLA: Salicylic acid; CR: Coumarin; RES: trans-Resveratrol; MR: Morin; QC: Quercetin. b Linear ranges of all compounds were 10-350 mg/L.
Method specificity ensures that the signal measured comes from the analyte of interest, with no interference from any potential sample components. Chromatographic identification of phenolic compounds was based on comparing retention times and ultraviolet absorption spectrums. The representative chromatograms of the standard mixture solution and Cabernet Sauvignon extract separation are depicted in Figure 2. In the present case, some impurities found in samples, could be some interferences because of the complexity of the crude extracts injected directly. The resolution factors calculated by the Shimadzu software between (+)-catechin and nearby interference peaks in the sample were 1.6 and 1.7, respectively (data not shown). Moreover, in order to verify the specificity, peak purity was evaluated by the PDA detector for the phenolics in samples and the standard solution. Two typical peak purity curves of the samples are shown in Figure 4 for protocatechuic acid and (+)-catechin, and no impurities were observed. Thus, the method was confirmed to be specific for each phenolic compound of interest.
Figure 4. Typical peak purity curves (A) Protocatechuic acid; (B) Catechin.
Molecules 18 14241 g004
Evaluation of method accuracy resorted to the standard addition technique. Extracts of Cabernet Sauvignon were used as substrates for recovery test, as mentioned in Section 2.7, adding known amounts of phenolic reference compounds to the extracts with known amounts, to obtain three addition levels (50, 150, and 250 mg, three replicates each). Each set of samples was repeated three times and the average recovery rate of each compound was as laid out in Table 4, ranging from 97.31% to 104.66%, indicating that the method was accurate.
Precision was determined as both repeatability and intermediate precision, in accordance with ICH recommendations. The spiked extracts used in accuracy analysis were also served in precision study, the repeatability expressed as a relative standard deviation (RSD, %) was determined using six continuous injections of three concentrations and analysed on the same day, the intermediate precision was evaluated for 14 working days by injecting the same test solution three times a day. The precision data is tabulated in Table 4. In both situations, all the RSD values were below 4.22%, demonstrating that the method was precise.
Table 4. Validation results for accuracy (n= 3), precision (intra-day, n = 6; inter-day, n = 14), and robustness (n= 3).
Name aControl (mg)Added (mg)Found ± SD (mg)Recovery (%)Precision RSD (%)Robustness RSD (%)
Intra-dayInter-dayFlow rate (mL/min)AcOH conc. (%, v/v)Column temp. (°C)
0.750.852.953.052931
GA43.865091.34 ± 2.2697.312.672.801.432.312.552.130.840.65
150195.59 ± 7.48100.893.723.86
250292.86 ± 10.8899.663.353.13
PA140.5750192.11 ± 5.57100.812.723.331.671.732.352.861.290.98
150297.21 ± 8.72102.322.653.01
250395.14 ± 13.46101.173.053.76
CAT733.7750799.92 ± 23.83102.061.623.801.531.882.062.170.581.05
150885.98 ± 25.49100.252.803.90
250984.56 ± 36.48100.083.793.92
VA46.8450100.09 ± 2.46103.362.713.571.481.621.761.890.860.99
150195.86 ± 5.2299.502.823.10
250297.70 ± 9.87100.292.963.13
CA44.565095.28 ± 2.51100.762.543.741.321.442.732.850.670.59
150195.92 ± 6.14100.703.323.65
250296.71 ± 11.32100.733.423.69
SYA113.6350160.54 ± 3.7898.112.262.511.761.852.651.871.121.06
150272.96 ± 6.27103.242.432.76
250367.48 ± 10.78101.063.113.22
EC545.7150600.18 ± 14.64100.752.543.101.671.792.211.990.881.10
150722.84 ± 21.73103.903.143.29
250803.27 ± 34.32100.953.744.01
PCA77.5550133.49 ± 3.39104.662.092.761.581.622.712.900.840.93
150229.53 ± 6.67100.873.022.93
250327.26 ± 10.4399.913.263.44
RT92.2950142.55 ± 4.36100.181.792.671.781.752.652.680.790.89
150244.45 ± 6.03100.892.402.54
250344.07 ± 7.51100.522.412.84
SLA179.6250229.37 ± 6.4999.892.582.981.461.422.472.801.051.32
150336.64 ± 10.54102.132.943.26
250431.94 ± 13.84100.542.933.35
CR25.335075.85 ± 2.13100.693.744.221.871.732.122.340.590.66
150171.22 ± 5.3897.652.843.15
250277.59 ± 8.37100.823.073.31
RES1048.7501125.44 ± 35.82102.432.913.251.591.602.832.761.070.74
1501191.31 ± 39.2799.383.163.21
2501318.09 ± 41.22101.492.953.24
MR192.6850252.90 ± 3.72104.211.702.921.551.492.372.510.820.77
150344.29 ± 8.28100.472.562.56
250436.31 ± 14.2898.563.203.20
QC87.8550137.63 ± 3.3799.843.083.161.691.362.542.871.211.14
150245.65 ± 7.99103.283.053.43
250349.91 ± 10.43103.573.263.53
a GA: Gallic acid; PA: Protocatechuic acid; CAT: (+)-Catechin; VA: Vanillic acid; CA: Caffeic acid; SYA: Syringic acid; EC: (‒)-Epicatechin; PCA: p-Coumaric acid; RT: Rutin; SLA: Salicylic acid; CR: Coumarin; RES: trans-Resveratrol; MR: Morin; QC: Quercetin.
Robustness testing is performed to evaluate the influence of small, but deliberate, variations in method parameters. The parameters chosen in this study were the flow rate (±0.05 mL/min), acetic acid concentration (±0.05%, v/v) and column temperature (±1 °C). Three injections of the mixed standard solution were carried out for each variation. The degree of reproducibility of peak area for each compound expressed as RSD was calculated. The results are illustrated in Table 4, an RSD of 0.59%–2.86% was obtained for these parameters. Hence, the analytical method could be considered to be robust.

2.4. Application

In order to validate the utility of the proposed method in real samples, gallic acid, protocatechuic acid, vanillic acid, caffeic acid, syringic acid, p-coumaric acid, salicylic acid, (+)-catechin, (‒)-epicatechin, rutin, morin, quercetin, coumarin, and trans-resveratrol in 89 varieties of grape canes were detected by the method. All the sample extracts prepared according to the procedure described in Section 2.3 were injected into the instrument with an injection amount of 10 µL (n = 3) and the peaks in the chromatograms obtained were identified by comparison of retention times, UV spectrums, and the increase of peak area after the addition of the corresponding phenolics. The typical chromatogram is shown in Figure 2A, and the average contents of the compounds are presented in Table S1. The results demonstrate that grape cane contains a great quantity of phenolic compounds and is an important source of natural antioxidants, especially for trans-resveratrol, (‒)-epicatechin, and (+)-catechin.

3. Experimental

3.1. Chemicals

HPLC grade methanol, acetonitrile, and analytical grade acetic acid were purchased from Tianjin Kermel Chemical Reagent Co. Ltd. (Tianjin, China). Water was purified by Milli-Q system (Millipore, Bedford, MA, USA). All the phenolic compounds were supplied from Sigma-Aldrich (Shanghai, China) and their purities were all over 97%.

3.2. Preparation of Plant Materials

The ideal 1-yr-old canes used in this work from 89 kinds of grapes were moderately vigorous (about 0.8‒1.0 cm diameter) and were collected from a commercial vineyard located in Shandong Province during the 2008 pruning practice. The 1-yr-old canes were frozen in liquid nitrogen, ground through a 0.5 mm sieve using an electrical grinder (final particle size <0.5 mm), vacuumized in labeled plastic bags to cut off air, and then stored at −20 °C in a freezer until extraction.

3.3. Extraction Process

The ground grape cane (5 g fresh weight) was weighed into a 50 mL centrifuge tube and extracted with 40 mL acidified methanol solution (1 N HCl/methanol/water, 1/80/19, v/v/v), and extraction was performed under continuous stirring (600 rpm) at 20 °C for 1 h by an external water bath. After extraction, the extracts were centrifuged at 8,000 g for 15 min at 4 °C using a Sorvall RC-5C Plus centrifuge (Kendro Laboratory Products, Newton, CT, USA). The extraction procedure was repeated three times. All the supernatants were combined in a 250 mL round-bottom flask and concentrated in a Büchi RE-111 rotary vacuum evaporator with a 35 °C water bath (Flawill, Switzerland) to a volume of 10 mL. The final concentrate solution was filtered through a 0.22 µm nylon micro-membrane and stored at −40 °C until analysis.

3.4. Preparation of Standard Solution

A mixed stock standard solution of 1 mg/mL was prepared by accurately weighing 25 mg of 14 phenolic compounds into 25 mL volumetric flask and making up to volume with HPLC grade methanol. Different working solutions were obtained from the stock solution by appropriate dilution in methanol for calibration curves and determinations of the detection and quantitation limit of the method. All the solutions were kept in dark place at −40 °C prior to injection.

3.5. HPLC-DAD-UV Analyses

The HPLC analyses were conducted on a Shimadzu liquid chromatograph system (Shimadzu Corp, Kyoto, Japan) equipped with a quaternary pump, a vacuum degasser, an autosampler, a PDA detector, a tunable UV-vis detector, and a Shim-Pack VP-ODS C18 column (250 mm × 4.6 mm, 5 μm). Results were acquired and processed by the Shimadzu Workstation CLASS-VP 6.12 software (Shimadzu Corp).
The DAD detector was applied to scan the phenolic compounds of interest to ascertain their MAW and acquire other spectral information within a range of 200 to 400 nm. The variable UV-Vis detector was conducted at the MAW of each phenolic compound for quantitative purpose with external standard. A gradient solvent system was employed with solvent A being water-acetic acid (97:3, v/v) and solvent B being acetonitrile. The elution profile had the following proportions (v/v) of solvent B: 0.00–5.00 min, 0%–8.5%; 5.00–16.50 min, 8.5%–2.0%; 16.50–35.00 min, 2.0%–18%; 35.00–50.00 min, 18%–20%; 50.00–65.00 min, 20%–30%; 65.00–70.00 min, 0%–30%. The following wavelength-switching program was employed: 5.463–6.293 min, 271 nm; 8.657–9.207 min, 260 nm; 12.155–13.175 min, 280 nm; 18.274–19.047 min, 260 nm; 20.079–21.075 min, 324 nm; 31.124–32.234 min, 275 nm; 33.230–34.183 min, 280 nm; 37.093–37.885 min, 309 nm; 40.832–41.284 min, 255 nm; 44.452–45.403 min, 304 nm; 48.831–49.936 min, 280; 52.560–53.674 min, 306 nm; 55.201–56.539 min, 256 nm; 61.789–62.895 min, 374 nm; 360 nm was for other time. The column held at 30 °C was flushed with a flow rate of 0.8 mL/min. Chromatographic identification and confirmation of phenolic compounds were based on comparing retention times with authentic standards and on-line ultraviolet absorption spectrum data. All the prepared solutions were filtered through 0.22 µm membranes, and the mobile phase was degassed before injection on to HPLC.

3.6. Fine-Tuning Analysis of Detection Wavelength

Fine-tuning of wavelength detection was carried out by the determination of a mixed standard solution with the known concentration in the UV-vis detector under the chromatographic condition described in 2.5 at the wavelength changing from 210 to 400 nm, with 1 nm interval. The raw data recorded was the peak area of each compound in the chromatograms; the relative concentrations at different wavelengths were calculated from the calibration curves.

3.7. Method Validation Procedure

The method proposed in this study was validated as per ICH guidelines by the determination of the following parameters: linearity, range, precision, accuracy, specificity, robustness (ICH Q2A, ICQ Q2B) [52], limit of detection (LOD) and limit of quantitation (LOQ).
Linearity of the method was established by automatic injections of the standard mixture solutions at six calibration levels in three replicates from low to high concentrations; retention time and response time (duration of signal response in detector) of each compound were extracted by the Shimadzu software for the studying of wavelength switching. Specificity of the method was evaluated by comparing the chromatograms both of standard solutions and the samples through the peak identification and peak purity assessment. Method precision was tested by determining the intra-day precision (repeatability) and the inter-day precision (intermediate precision), both expressed as RSD (%). The accuracy of the method was assessed by spiking phenolic compounds at three levels to samples and was expressed in terms of the average recovery. Method robustness was determined by making slight changes in the chromatographic conditions, such as flow rate, column temperature, and mobile phase additive concentration. LOD and LOQ of both DAD and UV-Vis detector were separately determined by diluting the standard solution.

4. Conclusions

Research on phenolic compounds is of current interest since they have important biological and pharmacological properties. HPLC, with various detection possibilities, or their combinations, has been a preferred technique for routine analysis of phenolics. In this paper, a novel HPLC-DAD-UV method using wavelength switching detection has been established for the simultaneous determination of 14 phenolic compounds in crude grape cane extracts without pre-treatment. Moreover, the proposed procedure, characterized by good sensitivity, linearity, precision, accuracy, and robustness, enabling each compound determined at their MAWs to obtain the real contents to the greatest extent, has an application potential to other analytes and can be suitable for routine laboratories without advanced facilities. In addition, grape canes rich in natural antioxidants should receive more attention.

Supplementary Materials

Supplementary materials can be accessed at: https://www.mdpi.com/1420-3049/18/11/14241/s1.

Acknowledgments

The authors would like to thank Changyu Wine Group Company, Ltd., Yantai for its generous donations of grape canes for analysis. We express our gratitude to Northwest A&F University for the Youth Natural Science Foundation assistance. Also we thank the National Technology System for Grape Industry (nycytx-30-2p-04) for generous financial support of this work.

Conflicts of Interest

The authors declare no conflict of interest.

References

  1. Duthie, G.G.; Duthie, S.J.; Kyle, J.A.M. Plant polyphenols in cancer and heart disease: Implications as nutritional antioxidants. Nutr. Res. Rev. 2000, 13, 79–106. [Google Scholar] [CrossRef]
  2. Pietta, P.G. Flavonoids as antioxidants. J. Nat. Prod. 2000, 63, 1035–1042. [Google Scholar] [CrossRef]
  3. Rice-Evans, C.A.; Miller, N.J.; Paganga, G. Antioxidant properties of phenolic compounds. Trends Plant Sci. 1997, 2, 152–159. [Google Scholar] [CrossRef]
  4. Sies, H. Oxidative stress: Oxidants and antioxidants. Exp. Physiol. 1997, 82, 291–295. [Google Scholar]
  5. Lima, C.F.; Fernandes-Ferreira, M.; Pereira-Wilson, C. Phenolic compounds protect HepG2 cells from oxidative damage: Relevance of glutathione levels. Life Sci. 2006, 79, 2056–2068. [Google Scholar] [CrossRef] [Green Version]
  6. Montilla, P.; Espejo, I.; Muñoz, M.C.; Bujalance, I.; Muñoz-Castañeda, J.R.; Tunez, I. Protective effect of red wine on oxidative stress and antioxidant enzyme activities in the brain and kidney induced by feeding high cholesterol in rats. Clin. Nutr. 2006, 25, 146–153. [Google Scholar] [CrossRef]
  7. Semalty, M.; Semalty, A.; Joshi, G.P.; Rawat, M.S.M. Comparison of in vitro Antioxidant Activity of Trigonella foenum-graecum and T. corniculata Seeds. Res. J. Phytochem. 2009, 3, 63–67. [Google Scholar] [CrossRef]
  8. Dani, C.; Oliboni, L.S.; Agostini, F.; Funchal, C.; Serafini, L.; Henriques, J.A.; Salvador, M. Phenolic content of grapevine leaves (Vitis labrusca var. Bordo) and its neuroprotective effect against peroxide damage. Toxicol. In Vitro 2010, 24, 148–153. [Google Scholar]
  9. Soliman, M.M.A.; Fadel, H.M.; Kaousar, A.H. Effect of flavour extraction on the phenolic constituents of grape leaves. Eur. J. Lipid Sci. Technol. 1995, 97, 471–473. [Google Scholar]
  10. Karacabey, E.; Mazza, G. Optimization of solid-liquid extraction of resveratrol and other phenolic compounds from milled grape canes (Vitis vinifera). J. Agric. Food Chem. 2008, 56, 6318–6325. [Google Scholar] [CrossRef]
  11. Bustamante, M.A.; Moral, R.; Paredes, C.; Pérez-Espinosa, A.; Moreno-Caselles, J.; Pérez-Murcia, M.D. Agrochemical characterisation of the solid by-products and residues from the winery and distillery industry. Waste Manage. 2008, 28, 372–380. [Google Scholar] [CrossRef]
  12. OIV, State of the Vitiviniculture World Market. Available online: http://www.oiv.int/oiv/info/enconjoncture/ (accessed on 14 November 2010).
  13. Stationary Point and Area Sources. AP-42: Compilation of Air Pollutant Emission Factors, 5th ed.; United States Environmental Protection Agency: Washington, DC, USA, 1995. [Google Scholar]
  14. Anl, R.E.; Vural, N.; Kızılet, E. An alternative method for the determination of some of the antioxidant phenolics in varietal turkish red wines. J. Inst. Brew. 2008, 114, 239–245. [Google Scholar] [CrossRef]
  15. Hawrył, M.A.; Hawrył, A.; Soczewiński, E. Application of normal- and reversed-phase 2D TLC on a cyanopropyl-bonded polar stationary phase for separation of phenolic compounds from the flowers of Sambucus nigra L. Jpc. J. Planar Chromat. Mod. Tlc 2002, 15, 4–10. [Google Scholar] [CrossRef]
  16. Kvasnička, F.; Čopíková, J.; Ševčík, R.; Krátká, J.; Syntytsia, A.; Voldřich, M. Determination of phenolic acids by capillary zone electrophoresis and HPLC. Central Eur. J. Chem. 2008, 6, 410–418. [Google Scholar] [CrossRef]
  17. Passarinha, L.A.; Bonifácio, M.J.; Queiroz, J.A. The effect of temperature on the analysis of metanephrine for catechol-O-methyltransferase activity assay by HPLC with electrochemical detection. Biomed. Chromatogr. 2006, 20, 937–944. [Google Scholar] [CrossRef]
  18. Zheng, J.B.; Liu, X.X.; Zhou, Y.Z.; Suo, Z.R. Simultaneous determination of five phenolic compounds in dried flowers by LC using DAD combined electrochemical detection. Chromatographia 2007, 65, 707–712. [Google Scholar] [CrossRef]
  19. Hollman, P.C.H.; Trijp, J.M.P.V.; Buysman, M.N.C.P. Fluorescence detection of flavonols in HPLC by postcolumn chelation with aluminum. Anal. Chem. 1996, 68, 3511–3515. [Google Scholar] [CrossRef]
  20. Cui, H.; Zhou, J.; Xu, F.; Lai, C.Z.; Wan, G.H. Determination of phenolic compounds using high-performance liquid chromatography with Ce4+-Tween 20 chemiluminescence detection. Anal. Chim. Acta 2004, 511, 273–279. [Google Scholar] [CrossRef]
  21. Karim, M.M.; Alam, S.M.; Lee, S.H. Application of a lanthanide composite nanoparticle-sensitized luminescence method for the determination of salicylic acid in pharmaceutical formulations and human plasma. Luminescence 2008, 23, 417–423. [Google Scholar] [CrossRef]
  22. Lewisa, D.A.; Fields, W.N.; Shaw, G.P. A natural flavonoid present in unripe plantain banana pulp (Musa sapientum L. var. paradisiaca) protects the gastric mucosa from aspirin-induced erosions. J. Ethnopharmacol. 1999, 65, 283–288. [Google Scholar] [CrossRef]
  23. Yu, Q.T.; Qi, L.W.; Li, P.; Yi, L.; Zhao, J.; Bi, Z.M. Determination of seventeen main flavonoids and saponins in the medicinal plant Huang-qi (Radix Astragali) by HPLC-DAD-ELSD. J. Sep. Sci. 2007, 30, 1292–1299. [Google Scholar] [CrossRef]
  24. Li, W.K.; Fitzloff, J.F. Determination of andrographolide in commercial Andrographis (Andrographis paniculata) products using HPLC with evaporative light scattering detection. J. Liq. Chromatogr. Relat. Technol. 2002, 25, 1335–1343. [Google Scholar] [CrossRef]
  25. Tian, R.R.; Pan, Q.H.; Zhan, J.C.; Li, J.M.; Wan, S.B.; Zhang, Q.H.; Huang, W.D. Comparison of phenolic acids and flavan-3-ols during wine fermentation of grapes with different harvest times. Molecules 2009, 14, 827–838. [Google Scholar] [CrossRef]
  26. Bourgou, S.; Ksouri, R.; Bellila, A.; Skandrani, I.; Falleh, H.; Marzouk, B. Phenolic composition and biological activities of Tunisian Nigella sativa L.shoots and roots. C. R. Biol. 2008, 331, 48–55. [Google Scholar] [CrossRef]
  27. Tounsi, M.S.; Ouerghemmi, I.; Wannes, W.A.; Ksouri, R.; Zemni, H.; Marzouk, B; Kchouk, M.E. Valorization of three varieties of grape. Ind. Crops Prod. 2009, 30, 292–296. [Google Scholar] [CrossRef]
  28. Boban, N.; Tonkic, M.; Modun, D.; Budimir, D.; Mudnic, I.; Sutlovic, D.; Punda-Polic, V.; Boban, M. Thermally treated wine retains antibacterial effects to food-born pathogens. Food Control 2010, 21, 1161–1165. [Google Scholar] [CrossRef]
  29. Zhang, H.; Jiang, L.; Ye, S.; Ye, Y.B.; Ren, F.Z. Systematic evaluation of antioxidant capacities of the ethanolic extract of different tissues of jujube (Ziziphus jujuba Mill.) from China. Food Chem. Toxicol. 2010, 48, 1461–1465. [Google Scholar] [CrossRef]
  30. Spáčil, Z.; Nováková, L.; Solich, P. Analysis of phenolic compounds by high performance liquid chromatography and ultra performance liquid chromatography. Talanta 2008, 76, 189–199. [Google Scholar] [CrossRef]
  31. Viskupicova, J.; Danihelova, M.; Ondrejovic, M.; Liptaj, T.; Sturdik, E. Lipophilic rutin derivatives for antioxidant protection of oil-based foods. Food Chem. 2010, 123, 45–50. [Google Scholar] [CrossRef]
  32. Jayakumar, T.; Thomas, P.A.; Geraldine, P. In-vitro antioxidant activities of an ethanolic extract of the oyster mushroom, Pleurotus ostreatus. Innov. Food Sci. Emerg. Technol. 2009, 10, 228–234. [Google Scholar] [CrossRef]
  33. Quirós, A.R.B.; Lage-Yusty, M.A.; López-Hernández, J. HPLC-analysis of polyphenolic compounds in Spanish white wines and determination of their antioxidant activity by radical scavenging assay. Food Res. Int. 2009, 42, 1018–1022. [Google Scholar] [CrossRef]
  34. Nantitanon, W.; Yotsawimonwat, S.; Okonogi, S. Factors influencing antioxidant activities and total phenolic content of guava leaf extract. LWT Food Sci. Technol. 2010, 43, 1095–1103. [Google Scholar] [CrossRef]
  35. Casazza, A.A.; Aliakbarian, B.; Mantegna, S.; Cravotto, G.; Perego, P. Extraction of phenolics from Vitis vinifera wastes using non-conventional techniques. J. Food Eng. 2010, 100, 50–55. [Google Scholar] [CrossRef]
  36. Fang, F.; Li, J.M.; Pan, Q.H.; Huang, W.D. Determination of red wine flavonoids by HPLC and effect of aging. Food Chem. 2007, 101, 428–433. [Google Scholar] [CrossRef]
  37. Cho, K.M.; Hong, S.Y.; Math, R.K.; Lee, J.H.; Kambiranda, D.M.; Kim, J.M.; Islam, S.M.A.; Yun, M.G.; Cho, J.J.; Lim, W.J.; Yun, H.D. Biotransformation of phenolics (isoflavones, flavanols and phenolic acids) during the fermentation of cheonggukjang by Bacillus pumilus HY1. Food Chem. 2009, 114, 413–419. [Google Scholar] [CrossRef]
  38. Zgórka, G.; Kawka, S. Application of conventional UV, photodiode array (PDA) and fluorescence (FL) detection to analysis of phenolic acids in plant material and pharmaceutical preparations. J. Pharm. Biomed. Anal. 2001, 24, 1065–1072. [Google Scholar] [CrossRef]
  39. Bravo, M.N.; Silva, S.; Coelho, A.V.; Boas, L.V.; Bronze, M.R. Analysis of phenolic compounds in Muscatel wines produced in Portugal. Anal. Chim. Acta 2006, 563, 84–92. [Google Scholar] [CrossRef]
  40. Vrchotová, N.; Šerá, B.; Tříska, J. The stilbene and catechin content of the spring sprouts of Reynoutria species. Acta Chromatogr. 2007, 19, 21–28. [Google Scholar]
  41. Ávila-Reyes, J.A.; Almaraz-Abarca, N.; Delgado-Alvarado, E.A.; González-Valdez, L.S.; Toro, G.V.; Páramo, E.D. Phenol profile and antioxidant capacity of mescal aged in oak wood barrels. Food Res. Int. 2010, 43, 296–300. [Google Scholar] [CrossRef]
  42. Nováková, L.; Spáčil, Z.; Seifrtová, M.; Opletal, L.; Solich, P. Rapid qualitative and quantitative ultra high performance liquid chromatography method for simultaneous analysis of twenty nine common phenolic compounds of various structures. Talanta 2010, 80, 1970–1979. [Google Scholar] [CrossRef]
  43. Ballard, T.S.; Mallikarjunan, P.; Zhou, K.; O’Keefe, S. Microwave-assisted extraction of phenolic antioxidant compounds from peanut skins. Food Chem. 2010, 120, 1185–1192. [Google Scholar] [CrossRef]
  44. Jeenphakdee, M.; Samappito, S. Optimization of an analytical method for determining flavonoid content of Ma-mao juice. J. Sci. Technol. Mahasarakham Univ. 2009, 28, 171–177. [Google Scholar]
  45. Wu, J.W.; Hsieh, C.L.; Wang, H.Y.; Chen, H.Y. Inhibitory effects of guava (Psidium guajava L.) leaf extracts and its active compounds on the glycation process of protein. Food Chem. 2009, 113, 78–84. [Google Scholar] [CrossRef]
  46. Tabart, J.; Kevers, C.; Pincemail, J.; Defraigne, J.O.; Dommes, J. Evaluation of spectrophotometric methods for antioxidant compound measurement in relation to total antioxidant capacity in beverages. Food Chem. 2010, 120, 607–614. [Google Scholar] [CrossRef]
  47. Obreque-Slier, E.; Peña-Neira, A.; López-Solís, R.; Zamora-Marín, F.; Ricardo-da Silva, J.M.; Laureano, O. Comparative study of the phenolic composition of seeds and skins from Carménère and Cabernet Sauvignon grape varieties (Vitis vinifera L.) during ripening. J. Agric. Food Chem. 2010, 58, 3591–3599. [Google Scholar] [CrossRef]
  48. Anastasiadi, M.; Pratsinis, H.; Kletsas, D.; Skaltsounis, A.L.; Haroutounian, S.A. Bioactive non-coloured polyphenols content of grapes, wines and vinification by-products: Evaluation of the antioxidant activities of their extracts. Food Res. Int. 2010, 43, 805–813. [Google Scholar] [CrossRef]
  49. Huang, W.; Liu, X.P. Determination of sudan dyes in foods with HPLC diode array detector. Chin. J. Health Lab. Technol. 2005, 15, 1327–1328. [Google Scholar]
  50. Sharma, V.; Gulati, A.; Ravindranath, S.D.; Kumar, V. A simple and convenient method for analysis of tea biochemicals by reverse phase HPLC. J. Food Compost. Anal. 2005, 18, 583–594. [Google Scholar] [CrossRef]
  51. Guillaume, Y.; Guinchard, C. Marked differences between acetonitrile/water and methanol/water mobile phase systems on the thermodynamic behavior of benzodiazepines in reversed phase liquid chromatography. Chromatographia 1995, 41, 84–87. [Google Scholar]
  52. Q2 (R1) Validation of Analytical Procedures: Text and Methodology. Available online: http://www.fda.gov/Drugs/GuidanceComplianceRegulatoryInformation/Guidances/ucm265700.htm/ (accessed on 14 November 2013).
  • Sample Availability: Not available.

