Identification of Electronic and Structural Descriptors of Adenosine Analogues Related to Inhibition of Leishmanial Glyceraldehyde-3-Phosphate Dehydrogenase

Abstract
:1. Introduction

2. Results and Discussion
2.1. Statistical Results

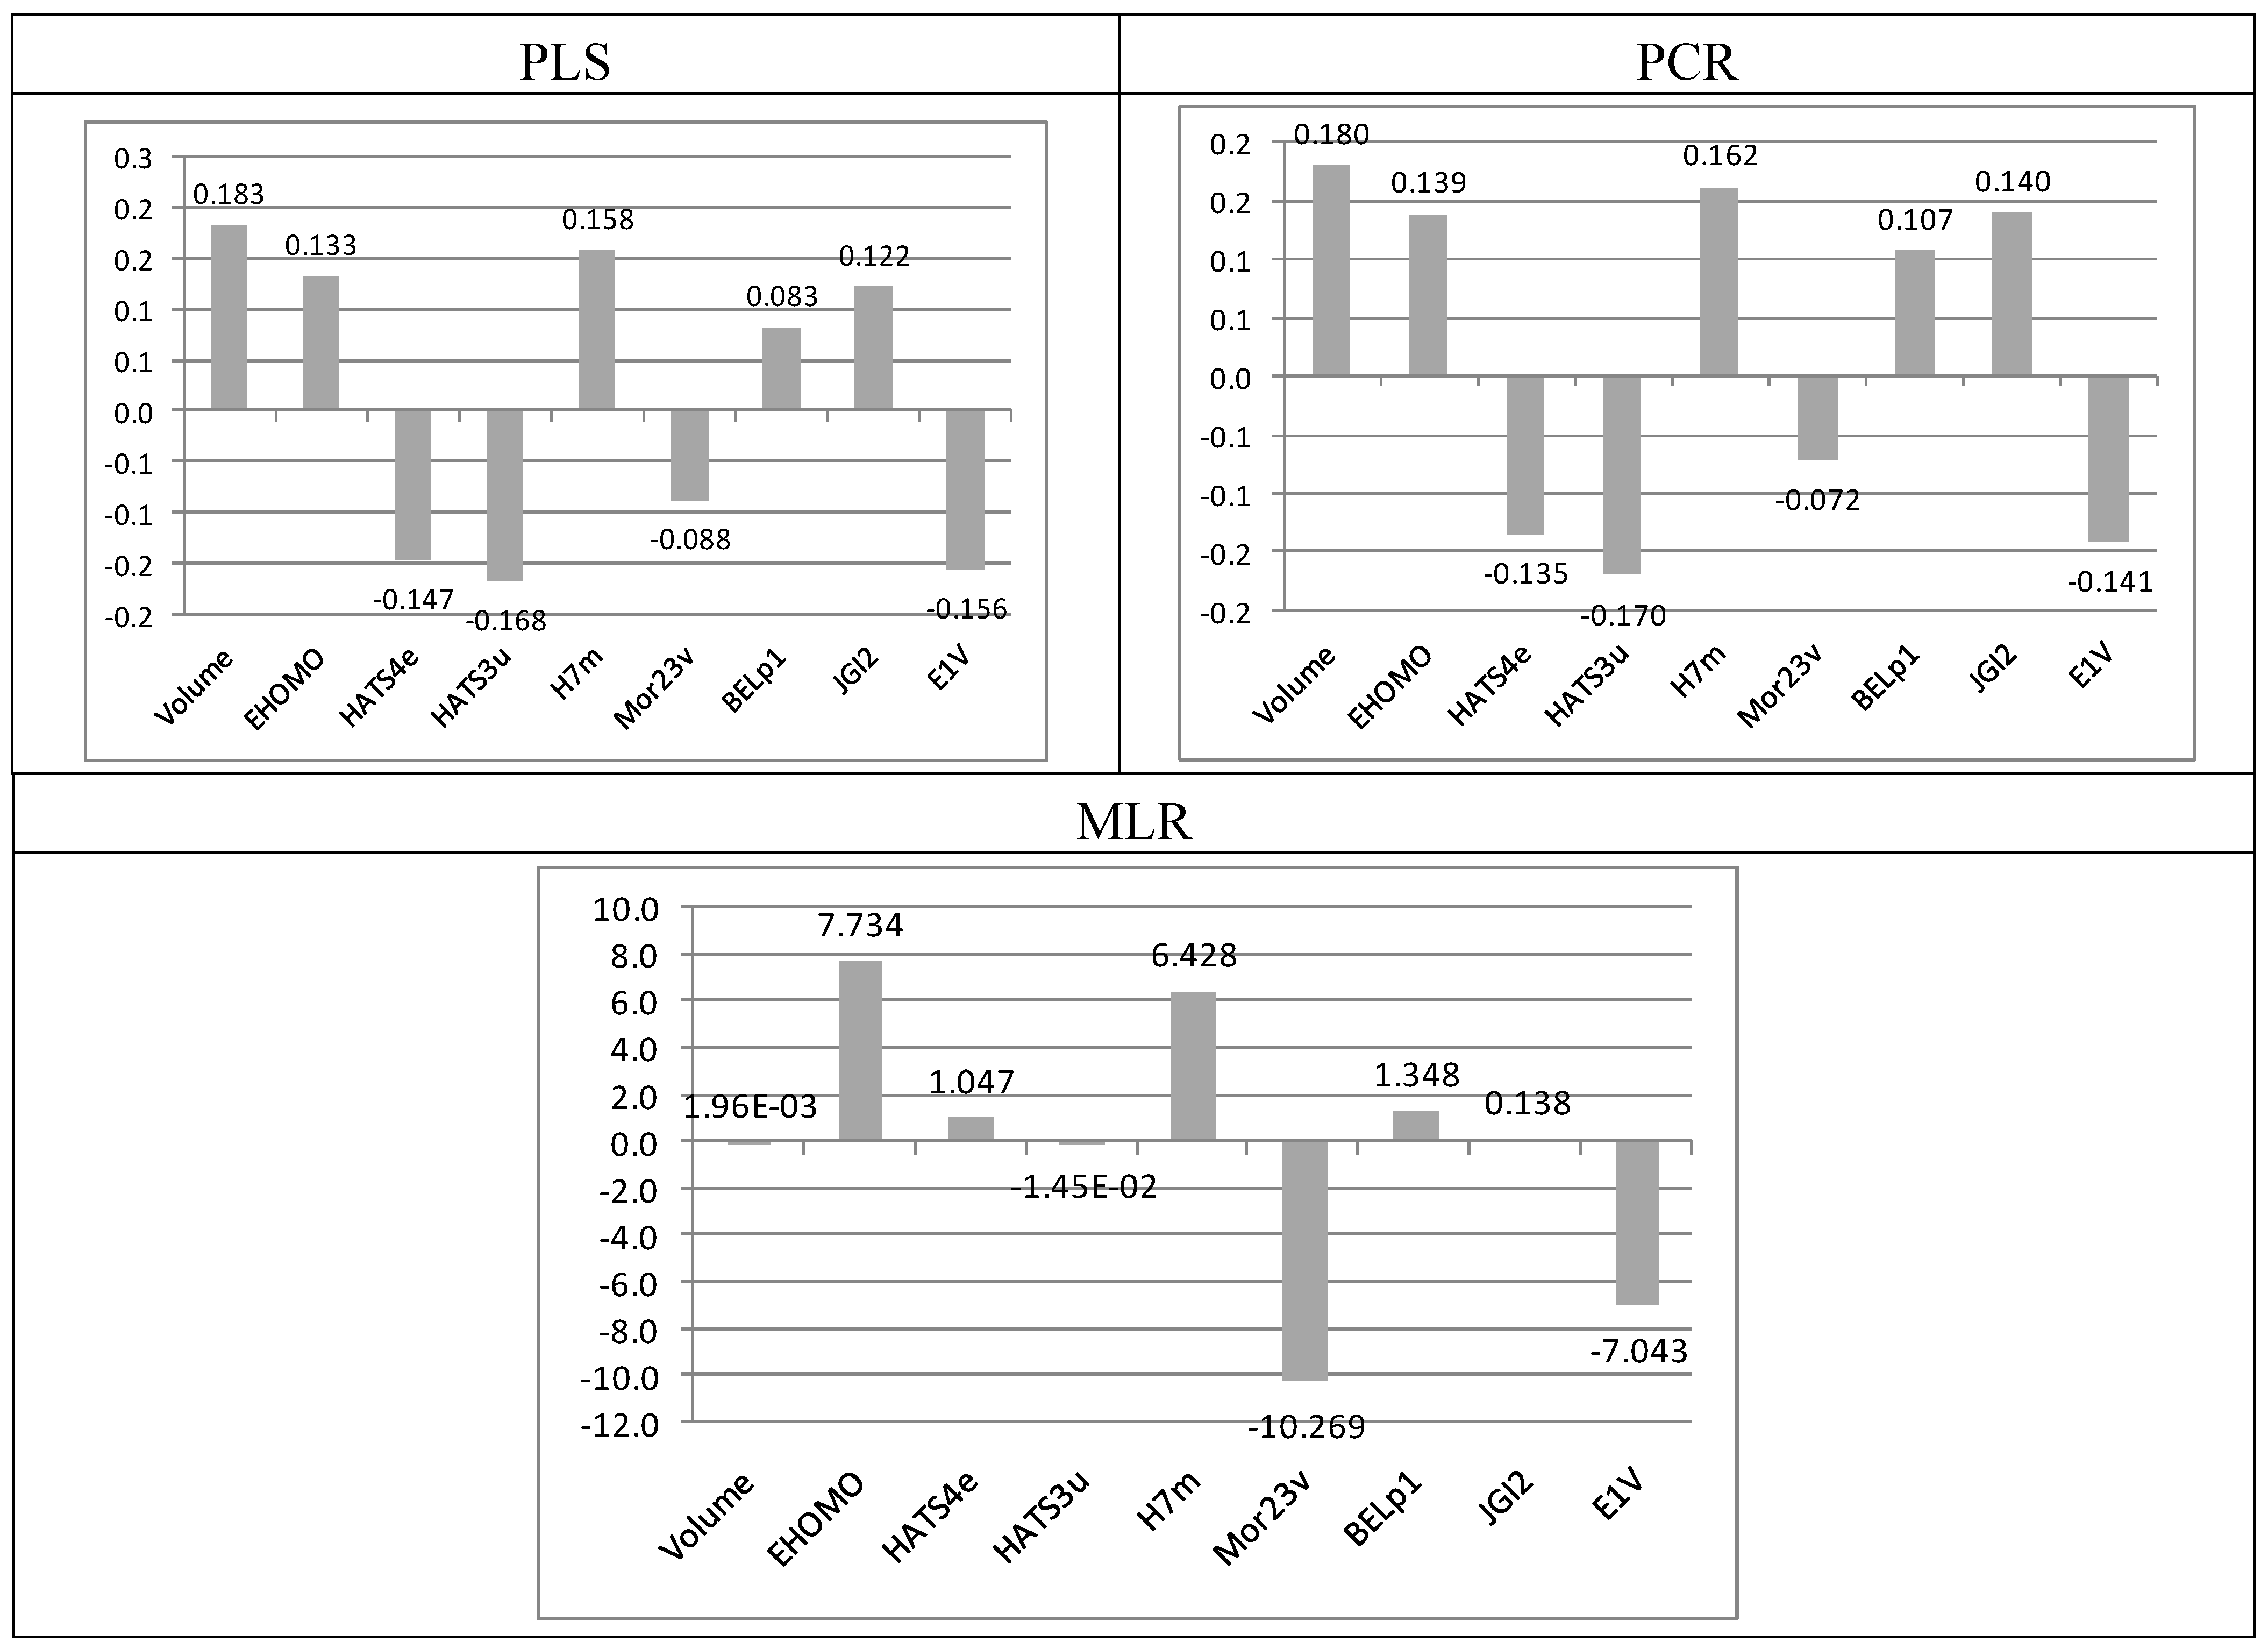
| Descriptor | Type | Definition |
|---|---|---|
| Volume | Geometric | Solvent-accessible surface-bounded molecular volume |
| EHOMO | Electronic | Energy of the highest occupied molecular orbital |
| HATS4e | GETAWAY | Leverage-weighted autocorrelation of lag 4/weighted by atomic Sanderson electronegativities |
| HATS3u | GETAWAY | Leverage-weighted autocorrelation of lag 3/unweighted |
| H7m | GETAWAY | H autocorrelation of lag 2/weighted by atomic masses |
| Mor23v | 3D-MoRSE | 3D-MoRSE-signal 23/weighted by atomic van der Waals volumes |
| BELp1 | BCUT | Lowest eigenvalue n.1 of Burden matrix/weighted by atomic polarizabilities |
| JGI2 | Galvez topological charge indices | Mean topological charge index of order 2 |
| E1v | WHIM | 1st component accessibility directional WHIM index, weighted by atomic van der Waals volumes |
 = 0.852 and r2 = 0.874, whereas in the best PCR models these values are = 0.873 and r2 = 0.852, indicating good internal consistency for both models. Leave-N-out (LNO) cross-validation results show that the models continue to present significant correlation coefficients (
  = 0.850 and 0.854 for PLS and PCR, respectively) even when 30% of the samples are left out for prediction, which indicates that robust models were obtained.
| PLS models | PCR models | ||||||||||
|---|---|---|---|---|---|---|---|---|---|---|---|
| Factors | SEV | PRESS | r2 |  |  * * | PCs | SEV | PRESS | r2 | | * |
| 2 | 0.401 | 7.571 | 0.885 | 0.843 | 2 | 0.388 | 7.092 | 0.873 | 0.852 | 0.854 | |
| 3 | 0.409 | 7.877 | 0.891 | 0.837 | 3 | 0.396 | 7.364 | 0.873 | 0.847 | ||
| 4 | 0.402 | 7.580 | 0.897 | 0.843 | 4 | 0.407 | 7.804 | 0.877 | 0.838 | ||
| 5 | 0.402 | 7.599 | 0.899 | 0.843 | 5 | 0.402 | 7.602 | 0.883 | 0.842 | ||
| 6 | 0.398 | 7.450 | 0.899 | 0.845 | 6 | 0.409 | 7.881 | 0.883 | 0.837 | ||
| 7 | 0.398 | 7.431 | 0.899 | 0.846 | 7 | 0.418 | 8.231 | 0.884 | 0.829 | ||
| 8 | 0.397 | 7.421 | 0.899 | 0.846 | 8 | 0.443 | 9.234 | 0.884 | 0.810 | ||
| 9 | 0.397 | 7.416 | 0.899 | 0.846 | 9 | 0.397 | 7.416 | 0.899 | 0.846 | ||
| MLR model | |||||||||||
| r2 | 0.899 | | 0.845 | * | 0.842 | RMSE | 0.397 | ||||
2.2. External Model Validation and Y-Randomization Tests
 ) and standard errors of prediction (SEP) were achieved (see Table 3). These results indicate that the QSAR models constructed can be used to accurately predict the biological activity of other compounds within this structural class.
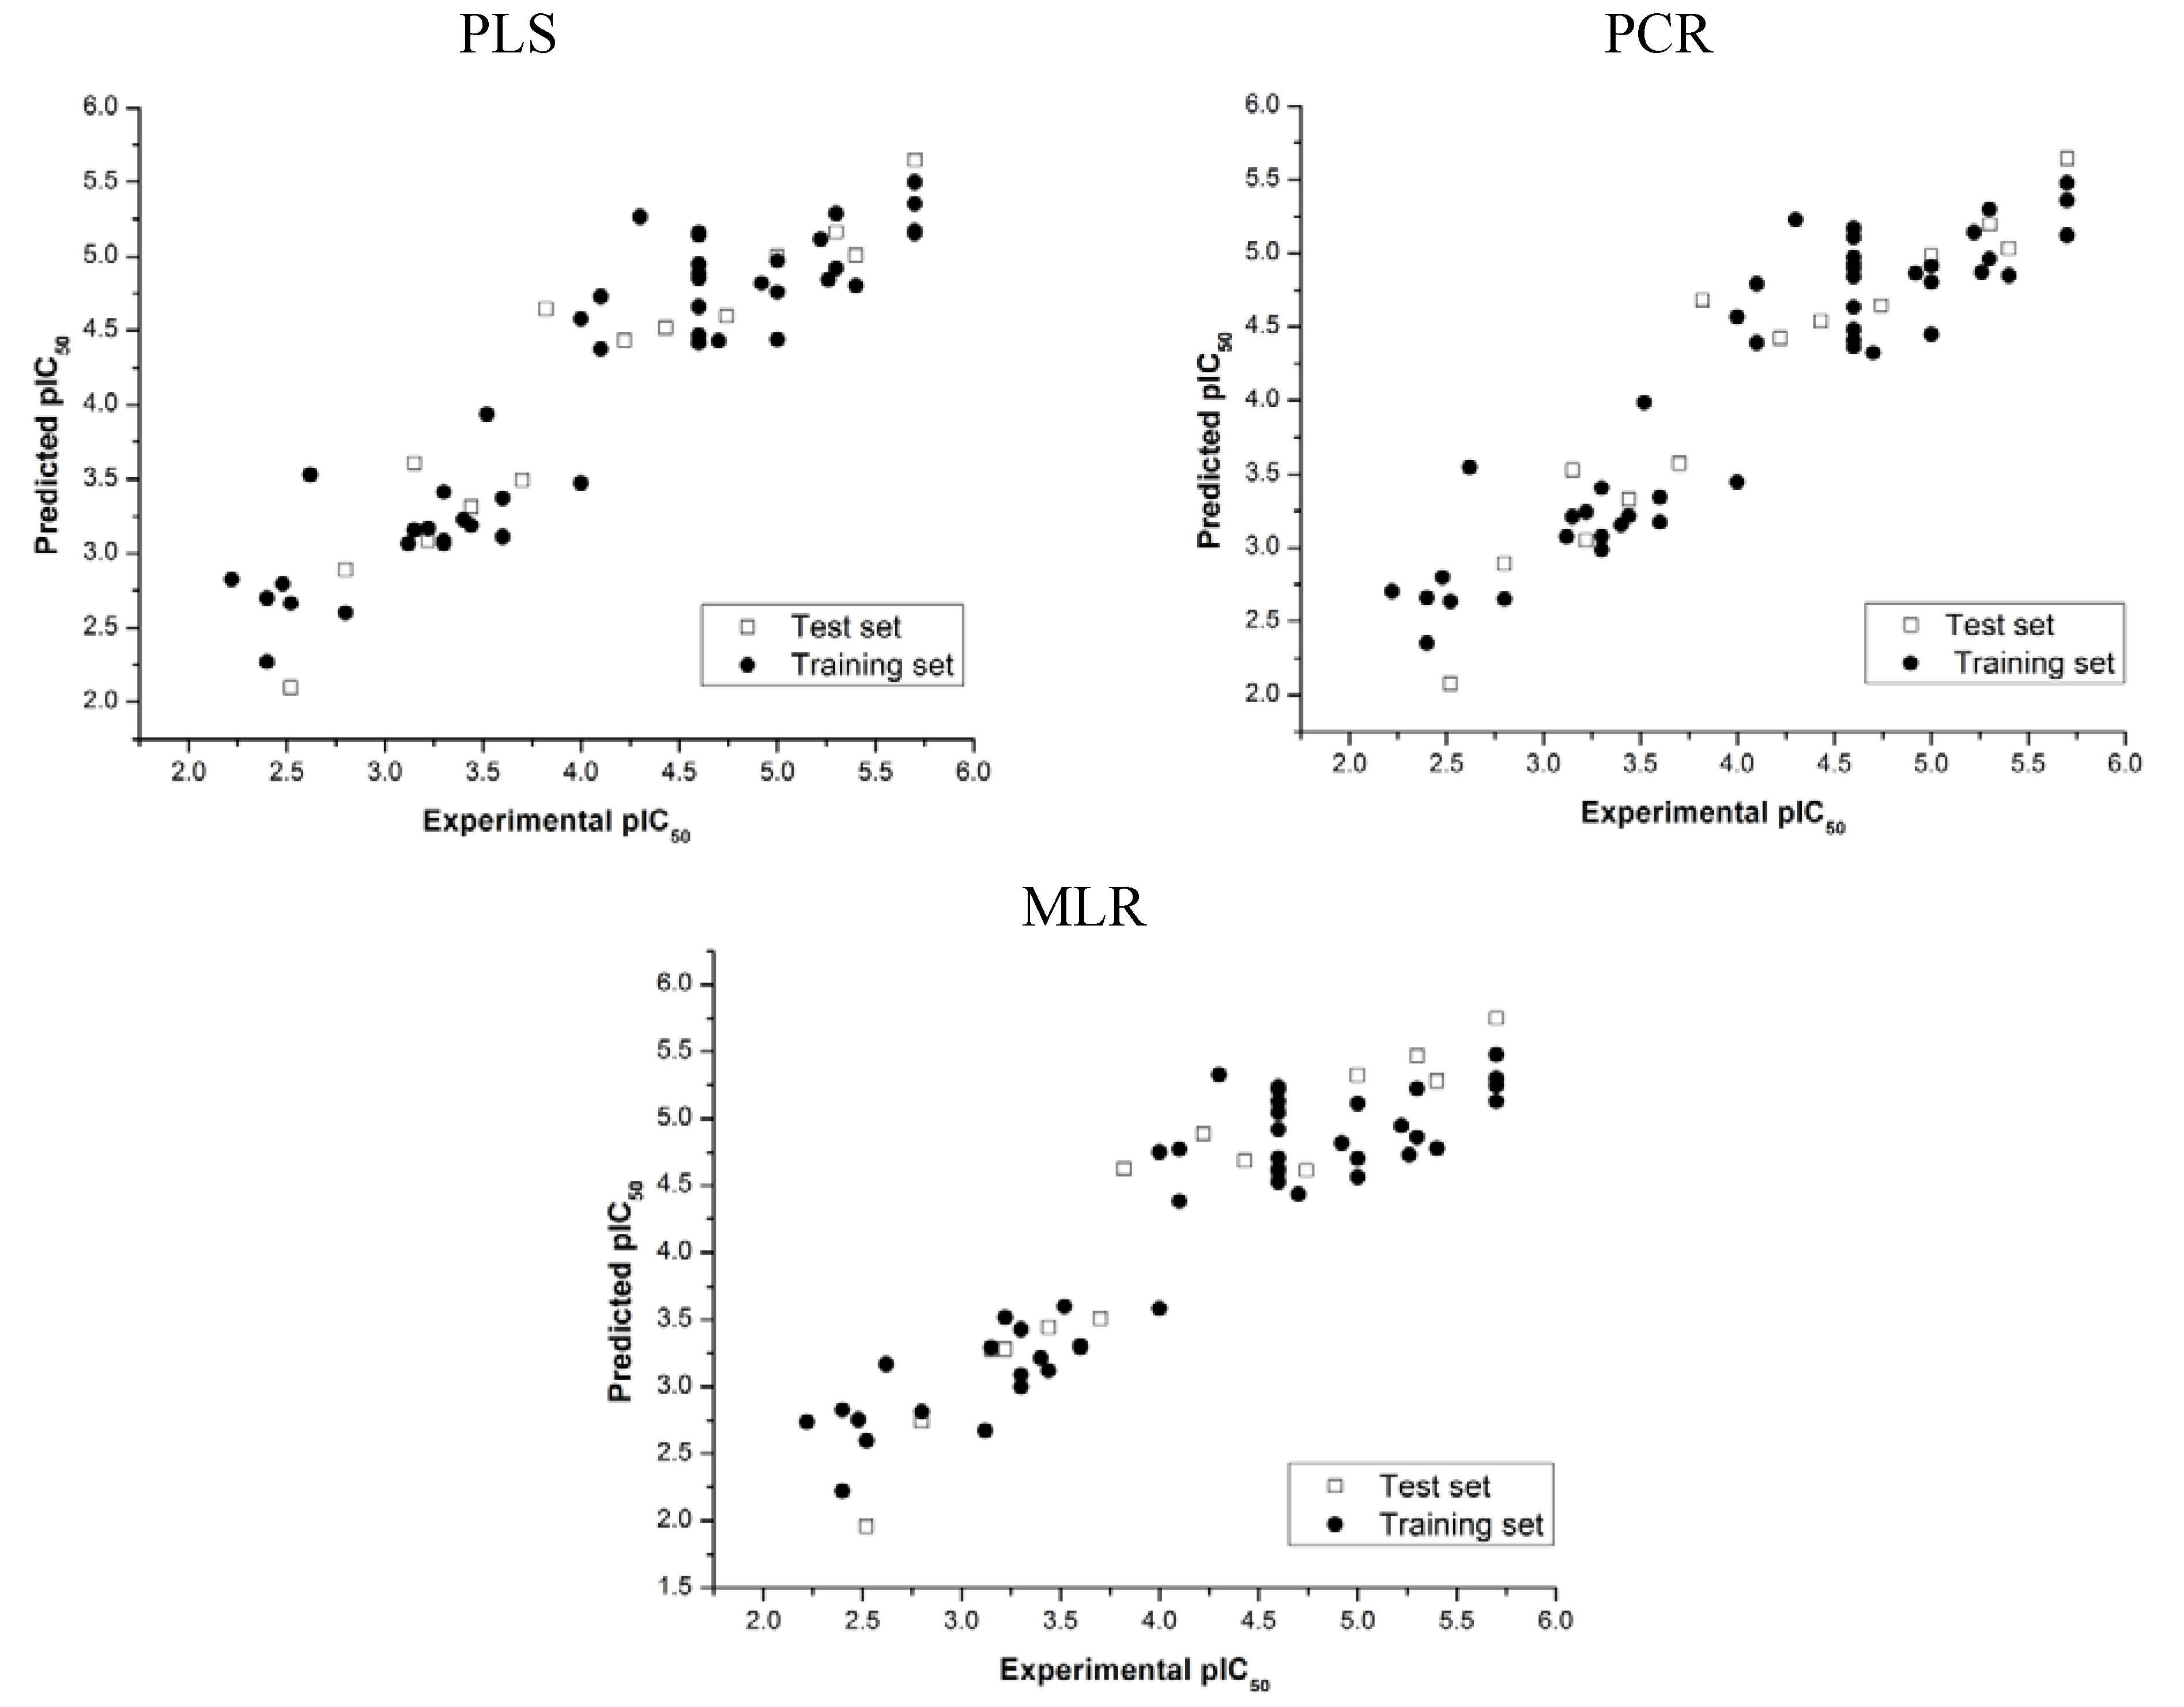
| Model |  | SEP |  * * |  * * |
|---|---|---|---|---|
| PLS | 0.900 | 0.317 | 0.097 | 0.155 |
| PCR | 0.904 | 0.312 | 0.143 | 0.055 |
| MLR | 0.875 | 0.346 | 0.236 | 0.248 |
| Training set | Test set | ||||||
|---|---|---|---|---|---|---|---|
| Ranking results | p% | Ranking results | p% | ||||
| Name | SRD | x < SRD > = x | Name | SRD | x < SRD > =x | ||
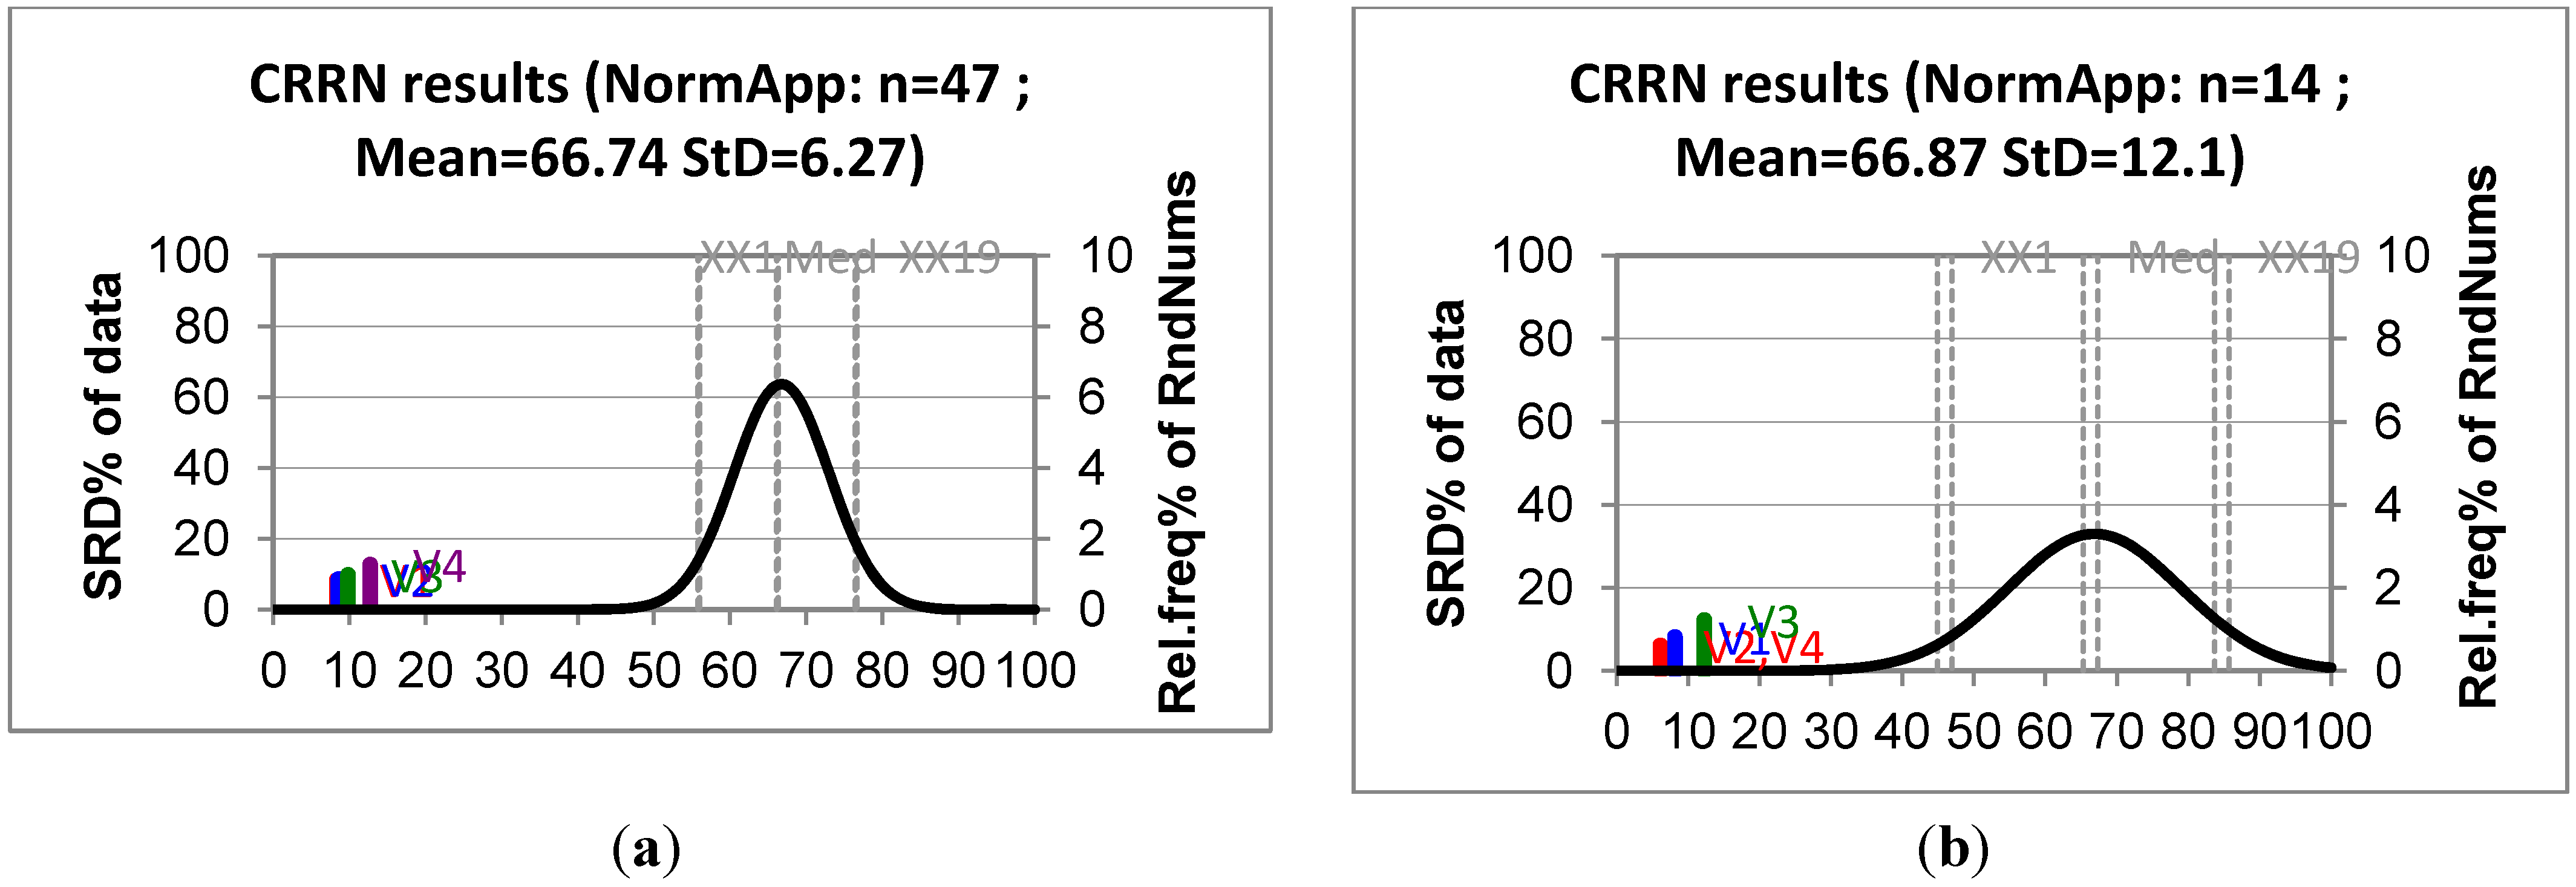
| V1 * | 92 | 1.05 10−18 | 1.48 10−18 | V2 | 6 | 1.19 10−5 | 3.08 10−5 |
| V2 | 94 | 1.48 10−18 | 1.91 10−18 | V4 | 6 | 1.19 10−5 | 3.08 10−5 |
| V3 | 108 | 9.18 10−18 | 1.10 10−17 | V1 | 8 | 3.08 10−5 | 7.45 10−5 |
| V4 | 140 | 5.75 10−16 | 7.00 10−16 | V3 | 12 | 1.73 10−4 | 3.88 10−4 |
| XX1 | 618 | 4.80 | 5.06 | XX1 | 46 | 4.61 | 5.47 |
| Q1 | 684 | 24.67 | 25.64 | Q1 | 58 | 24.45 | 27.12 |
| Med | 732 | 49.24 | 50.40 | Med | 66 | 48.78 | 52.08 |
| Q3 | 778 | 74.96 | 75.88 | Q3 | 74 | 73.59 | 76.22 |
| XX19 | 846 | 94.79 | 95.10 | XX19 | 84 | 94.77 | 95.59 |
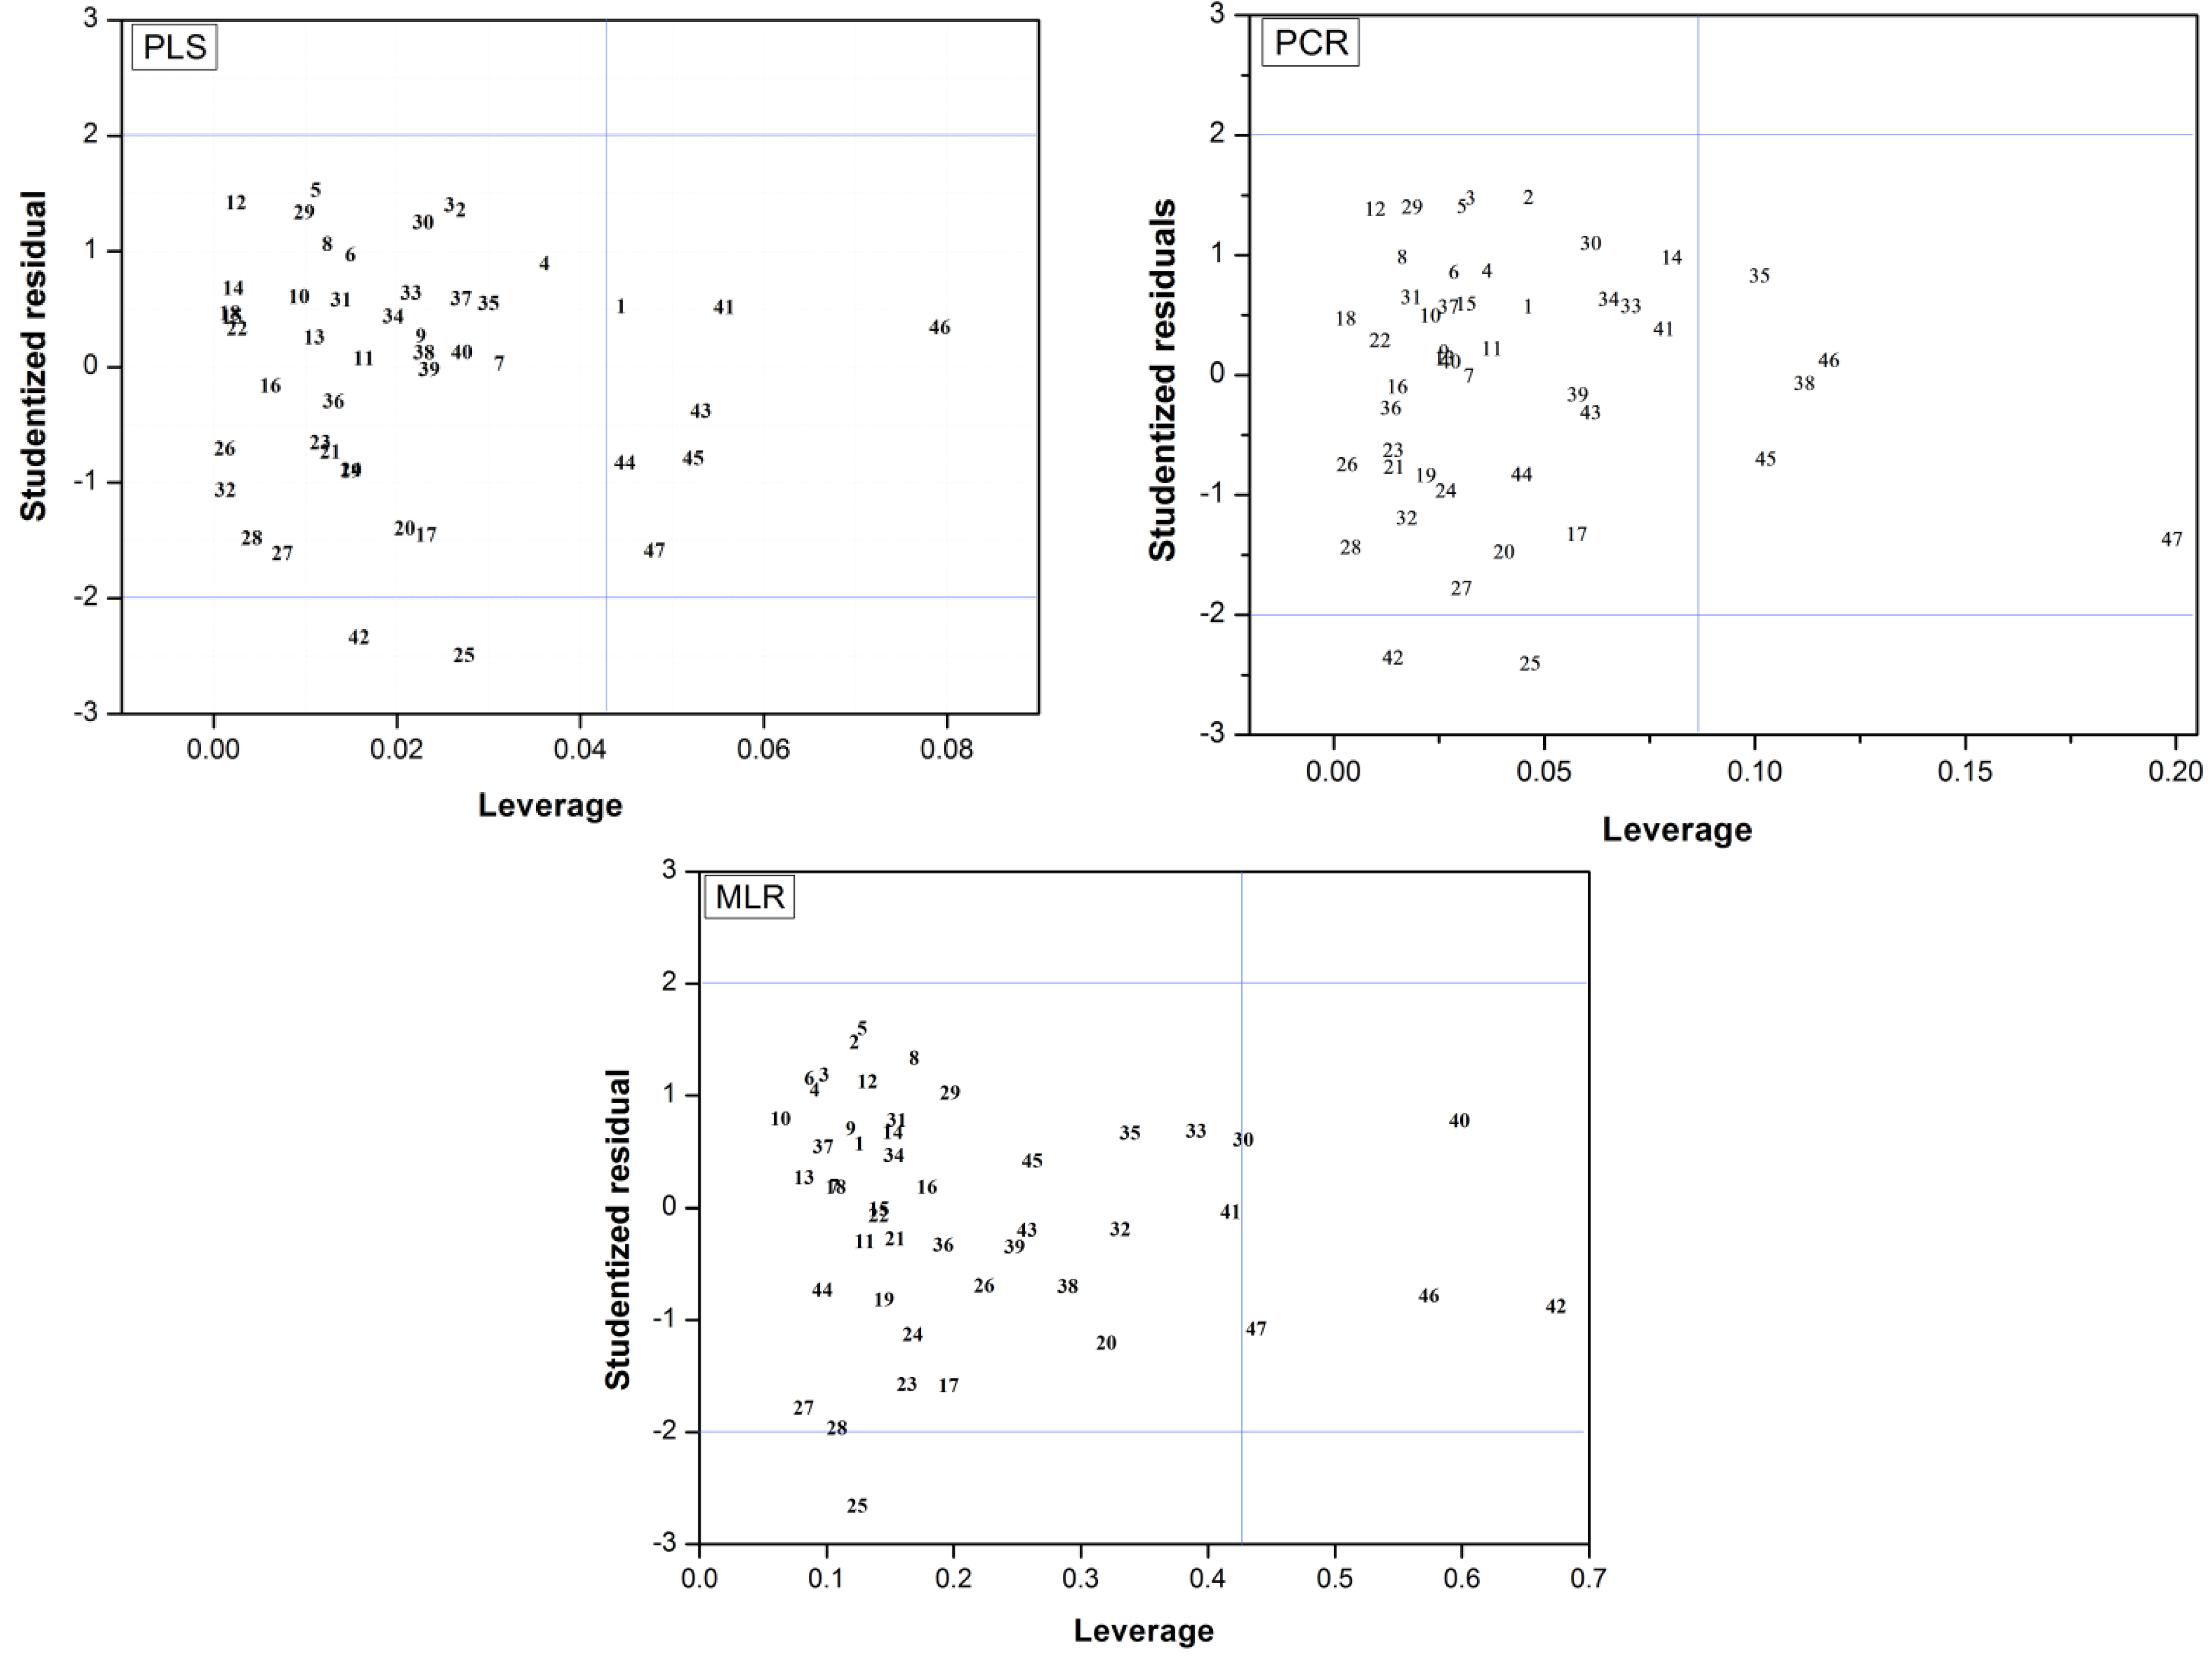
2.3. Applicability Domain
 (i = 1,…, m), where xi is the descriptor row-vector for compound i, m is the number of query compounds, X is the n × k training set matrix, k is the number of model descriptors and n is the number of samples in the training set. A leverage value greater than a certain critical value for a training set sample, defined here on the basis of 95% confidence level, means that the sample has a high influence in the model.
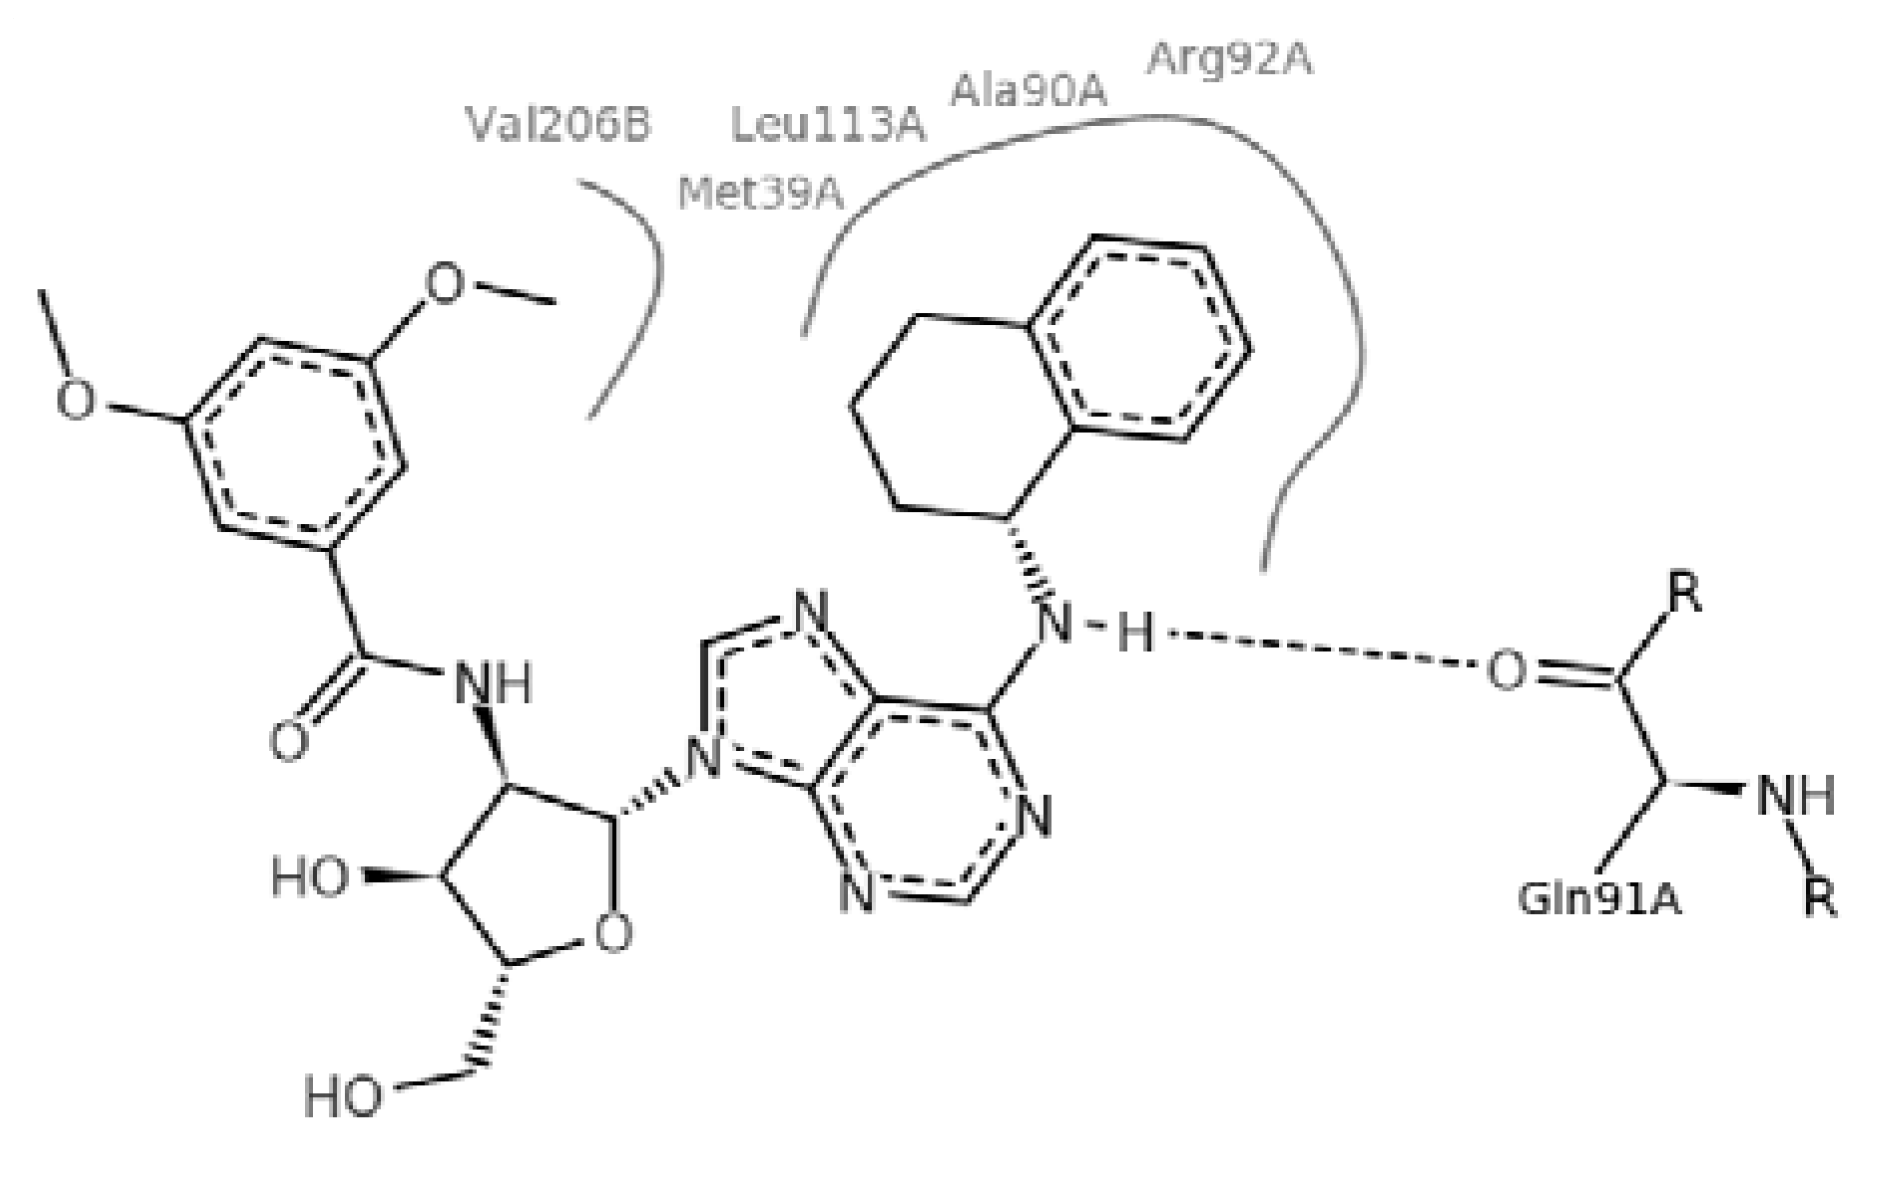
2.4. Molecular Implications for Ligand Design

3. Experimental
3.1. Data Sets
| Training set compounds | |||||
|---|---|---|---|---|---|
| Cpd | Structure | pIC50 | Cpd | Structure | pIC50 |
| 1 | 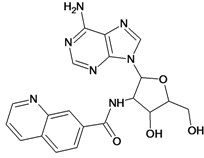 | 3.30 | 2 | 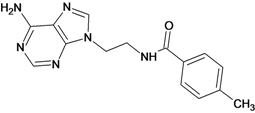 | 2.40 |
| 3 |  | 3.60 | 4 | 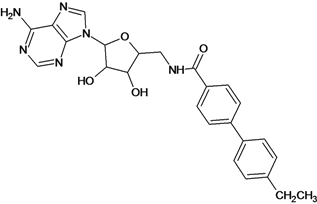 | 3.12 |
| 5 | 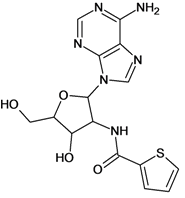 | 2.62 | 6 | 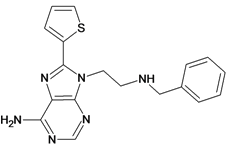 | 3.40 |
| 7 |  | 3.30 | 8 |  | 3.15 |
| 9 |  | 3.52 | 10 |  | 3.15 |
| 11 | 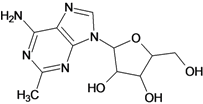 | 2.22 | 12 | 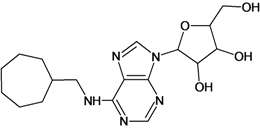 | 2.74 |
| 13 |  | 2.40 | 14 | 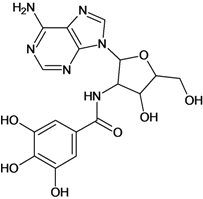 | 3.60 |
| 15 | 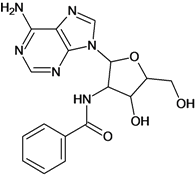 | 2.48 | 16 | 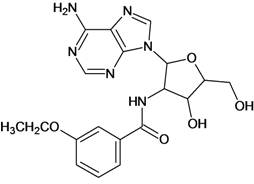 | 3.40 |
| 17 |  | 3.30 | 18 | 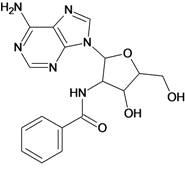 | 2.52 |
| 19 | 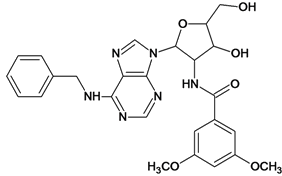 | 4.70 | 20 | 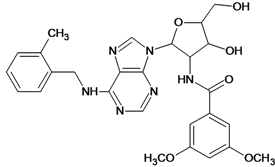 | 4.60 |
| 21 | 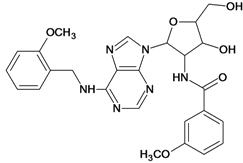 | 4.60 | 22 | 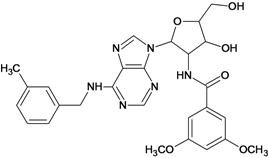 | 4.60 |
| 23 | 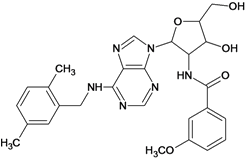 | 4.60 | 24 |  | 5.26 |
| 25 | 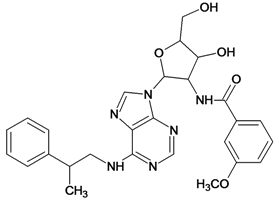 | 4.10 | 26 | 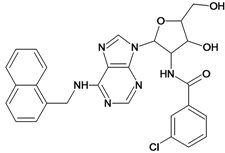 | 5.00 |
| 27 | 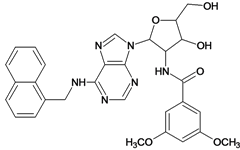 | 5.70 | 28 | 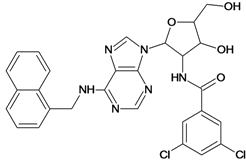 | 4.92 |
| 29 |  | 5.00 | 30 | 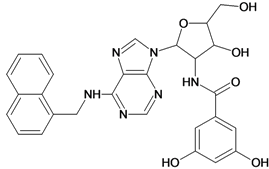 | 5.30 |
| 31 | 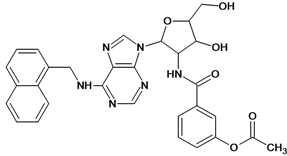 | 4.30 | 32 | 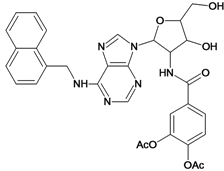 | 4.60 |
| 33 |  | 4.00 | 34 | 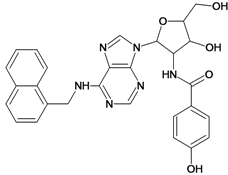 | 4.10 |
| 35 |  | 5.00 | 36 |  | 4.60 |
| 37 |  | 5.70 | 38 | 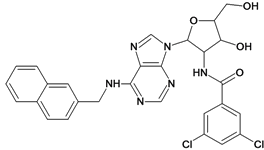 | 4.60 |
| 39 |  | 4.60 | 40 | 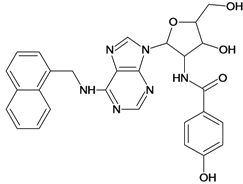 | 4.00 |
| 41 |  | 5.70 | 42 | 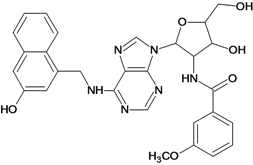 | 5.22 |
| 43 | 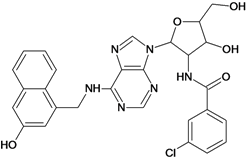 | 5.40 | 44 | 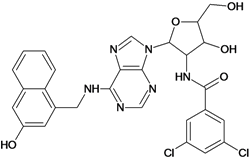 | 4.60 |
| 45 | 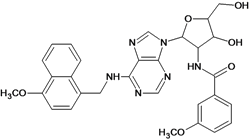 | 5.30 | 46 |  | 5.70 |
| 47 | 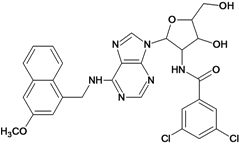 | 4.60 | 48 |  | 2.80 |
| 49 | 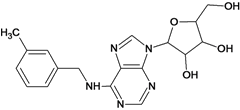 | 3.15 | 50 |  | 3.44 |
| 51 | 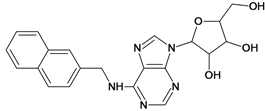 | 3.82 | 52 | 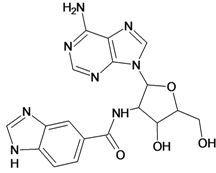 | 2.52 |
| 53 | 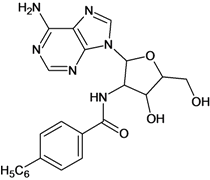 | 3.70 | 54 |  | 3.22 |
| 55 | 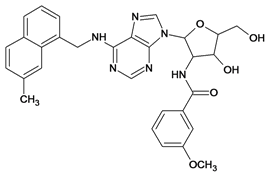 | 5.30 | 56 |  | 4.22 |
| 57 | 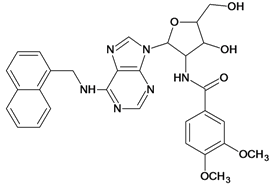 | 5.40 | 58 | 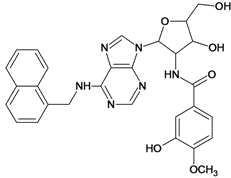 | 4.43 |
| 59 | 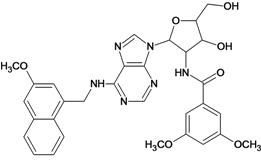 | 5.70 | 60 | 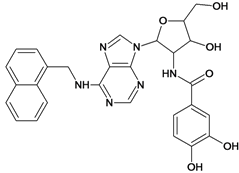 | 4.74 |
| 61 | 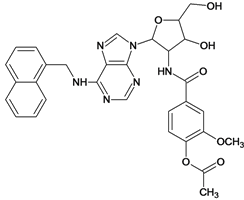 | 5.00 | |||
3.2. Descriptor Calculation and Selection
4. Conclusions
Supplementary Materials
Acknowledgments
References
- Bell, A.S.; Mills, J.E.; Williams, G.P.; Brannigan, J.A.; Wilkinson, A.J.; Parkinson, T.; Leatherbarrow, R.J.; Tate, E.W.; Holder, A.A.; Smith, D.F. Selective inhibitors of protozoan protein N-myristoyltransferases as starting points for tropical disease medicinal chemistry programs. PLoS Negl. Trop. Dis. 2012, 6, 1625–1634. [Google Scholar] [CrossRef]
- Control of the Leishmaniases: Report of a Meeting of the WHO Expert Committee on the Control of Leishmaniases; Proceedings of WHO Expert Committee on control of Leishmaniases, Geneva, Switzerland, 22–26 March 2010; World Health Organ: Geneva, Switzerland, 2010.
- den Boer, M.; Argaw, D.; Jannin, J.; Alvar, J. Leishmaniasis impact and treatment access. Clin. Microbiol. Infect. 2011, 17, 1471–1477. [Google Scholar] [CrossRef]
- Sundar, S. Drug resistance in Indian visceral leishmaniasis. Trop. Med. Int. Health 2001, 6, 849–854. [Google Scholar] [CrossRef]
- Boelaert, M.; Meheus, F.; Sanchez, A.; Singh, S.P.; Vanlerberghe, V.; Picado, A.; Meessen, B.; Sundar, S. The poorest of the poor: A poverty appraisal of households affected by visceral leishmaniasis in Bihar, India. Trop. Med. Int. Health 2009, 14, 639–644. [Google Scholar] [CrossRef]
- Dorlo, T.P.C.; Eggelte, T.A.; Schoone, G.J.; de Vries, P.J.; Beijnen, J.H. A poor-quality generic drug for the treatment of visceral leishmaniasis: A case report and appeal. PLoS Negl. Trop. Dis. 2012, 6, e1544. [Google Scholar]
- Bressi, J.C.; Verlinde, C.L.; Aronov, A.M.; Shaw, M.L.; Shin, S.S.; Nguyen, L.N.; Suresh, S.; Buckner, F.S.; van Voorhis, W.C.; Kuntz, I.D.; et al. Adenosine analogues as selective inhibitors of glyceraldehyde-3-phosphate dehydrogenase of trypanosomatidae via structure-based drug design. J. Med. Chem. 2001, 44, 2080–2093. [Google Scholar] [CrossRef]
- Cook, W.J.; Senkovich, O.; Chattopadhyay, D. An unexpected phosphate binding site in glyceraldehyde 3-phosphate dehydrogenase: Crystal structures of apo, holo and ternary complex of Cryptosporidium parvum enzyme. BMC Struct. Biol. 2009, 9, 9–22. [Google Scholar] [CrossRef]
- Suresh, S.; Bressi, J.C.; Kennedy, K.J.; Verlinde, C.L.; Gelb, M.H.; Hol, W.G. Conformational changes in Leishmania mexicana glyceraldehyde-3-phosphate dehydrogenase induced by designed inhibitors. J. Mol. Biol. 2001, 309, 423–435. [Google Scholar] [CrossRef]
- Stierand, K.; Maaβ, P.; Rarey, M. Molecular complexes at a glance: Automated generation of two-dimensional complex diagrams. Bioinformatics 2006, 22, 1710–1716. [Google Scholar] [CrossRef]
- Guido, R.V.C.; Oliva, G.; Montanari, C.A.; Andricopulo, A.D. Structural basis for selective inhibition of trypanosomatid glyceraldehyde-3-phosphate dehydrogenase: Molecular docking and 3D QSAR studies. J. Chem. Inf. Mod. 2008, 48, 918–929. [Google Scholar] [CrossRef]
- Guido, R.V.C.; Castilho, M.S.; Mota, S.G.R.; Oliva, G.; Andricopulo, A.D. Classical and hologram QSAR studies on a series of inhibitors of trypanosomatid glyceraldehyde-3-phosphate dehydrogenase. QSAR Comb. Sci. 2008, 27, 768–781. [Google Scholar]
- Teófilo, R.F.; Martins, J.P.A.; Ferreira, M.M.C. Sorting variables by using informative vectors as a strategy for feature selection in multivariate regression. J. Chemom. 2009, 23, 32–48. [Google Scholar] [CrossRef]
- Weber, K.C.; Da Silva, A.B.F. A Chemometric Study of the 5-HT1A Receptor Affinities Presented by Arylpiperazine Compounds. Eur. J. Med. Chem. 2008, 43, 364–372. [Google Scholar] [CrossRef]
- Weber, K.C.; Honorio, K.M.; Bruni, A.T.; Andricopulo, A.D.; Da Silva, A.B.F. A partial least squares regression study with antioxidant flavonoid compounds. Struct. Chem. 2006, 17, 307–313. [Google Scholar] [CrossRef]
- Tropsha, A.; Gramatica, P.; Gombar, V.K. The importance of being earnest: Validation is the absolute essential for successful application and interpretation of QSPR models. QSAR Comb. Sci. 2003, 22, 69–77. [Google Scholar] [CrossRef]
- Golbraikh, A.; Tropsha, A. Beware of q2! J. Mol. Graphics Modell. 2002, 20, 269–276. [Google Scholar] [CrossRef]
- Heberger, K.; Kollar-Hunek, K. Sum of ranking differences for method discrimination and its validation: comparison of ranks with random numbers. J. Chemom. 2011, 25, 151–158. [Google Scholar] [CrossRef]
- Heberger, K. Sum of ranking differences compares methods or models fairly. 2010; 101–109. [Google Scholar]
- Connolly, M.L. Solvent-accessible surfaces of proteins and nucleic acids. Science 1983, 221, 709–771. [Google Scholar]
- Dudek, A.Z.; Arodz, T.; Gálvez, J. Computational methods in developing quantitative structure-activity relationships (QSAR): A review. Comb. Chem. High Throug. Screen. 2006, 9, 213–228. [Google Scholar] [CrossRef]
- Karelson, M.; Lobanov, V.S.; Katritzky, A.R. Quantum-chemical descriptors in QSAR/QSPR studies. Chem. Rev. 1996, 96, 1027–1043. [Google Scholar] [CrossRef]
- Schuur, J.; Selzer, P.; Gasteiger, J. The coding of the three-dimensional structure of molecules by molecular transforms and its application to structure-spectra correlations and studies of biological activity. J. Chem. Inf. Comput. Sci. 1996, 36, 334–344. [Google Scholar] [CrossRef]
- Burden, F.R. A Chemically intuitive molecular index based on the eigenvalues of a modified adjacency matrix. Quant. Struct. Act. Relat. 1997, 16, 309–314. [Google Scholar] [CrossRef]
- Galvez, J.; Garcia, R.; Salabert, M.T.; Soler, R. Charge indexes–new topological descriptors. J. Chem. Inf. Comp. Sci. 1994, 34, 520–525. [Google Scholar] [CrossRef]
- Consonni, V.; Todeschini, R.; Pavan, M. Structure/response correlations and similarity/diversity analysis by GETAWAY descriptors. 1. Theory of the novel 3D molecular descriptors. J. Chem. Inf. Comput. Sci. 2002, 42, 682–692. [Google Scholar] [CrossRef]
- Todeschini, R.; Consonni, V. Handbook of Molecular Descriptors; Wiley VCH: Weinheim, Germany, 2000; p. 688. [Google Scholar]
- Todeschini, R.; Gramatica, P. The WHIM theory: New 3D-molecular descriptors for QSAR in environmental modelling. SAR QSAR Environ. Res. 1997, 7, 89–115. [Google Scholar] [CrossRef]
- Verlinde, C.L.M.J.; Callens, M.; Calenbergh, S.; Van Aerschot, A.; Herdewijn, P.; Hannaert, V.; Michels, P.A.M.; Opperdoes, F.R.; Hol, W.G.H. Selective inhibition of trypanosomal glyceraldehyde-3-phosphate dehydrogenase by protein structure-based design: Toward new drugs for the treatment of sleeping sickness. J. Med. Chem. 1994, 37, 3605–3613. [Google Scholar] [CrossRef]
- Van Calenbergh, S.; Verlinde, C.L.M.J.; Soenens, J.; De Bruyn, A.; Callens, M.; Blaton, N.M.; Peeters, O.M.; Rozenski, J.; Hal, W.G.J.; Herdewij, P. Synthesis and Structure-Activity relationships of analogs of 2′-deoxy-2′-(3-methoxybenzamido)adenosine, a selective inhibitor of trypanosoma1 glycosomal glyceraldehyde-3-phosphate dehydrogenase. J. Med. Chem. 1995, 38, 3838–3849. [Google Scholar] [CrossRef]
- Aronov, A.M.; Verlinde, C.L.M.J.; Hol, W.G.J.; Gelb, M.H. Selective tight binding inhibitors of trypanosomal Glyceraldehyde-3-phosphate Dehydrogenase via structure-based drug design. J. Med. Chem. 1998, 41, 4790–4799. [Google Scholar] [CrossRef]
- Aronov, A.M.; Suresh, S.; Buckner, F.S.; Van Voorhis, W.C.; Verlinde, C.L.M.J.; Opperdoes, F.R.; Hol, W.G.J.; Gelb, M.H. Structure-based design of submicromolar, biologically active inhibitors of trypanosomatid glyceraldehyde-3-phosphate dehydrogenase. Proc. Natl. Acad. Sci. USA 1999, 96, 4273–4278. [Google Scholar] [CrossRef]
- Stewart, J.J.P. Optimization of parameters for semiempirical methods. III Extension of PM3 to Be, Mg, Zn, Ga, Ge, As, Se, Cd, In, Sn, Sb, Te, Hg, Tl, Pb, and Bi. J. Comput. Chem. 1991, 12, 320–341. [Google Scholar] [CrossRef]
- HyperChem Release 4.5 for Windows. J. Chem. Inf. Comput. Sci 1996, 36, 612–614. [CrossRef]
- Becke, A.D. Density-functional thermochemistry. III. The role of exact exchange. J. Chem. Phys. 1993, 98, 5648–5652. [Google Scholar] [CrossRef]
- Lee, C.; Yang, W.; Parr, R.G. Development of the colle-salvetti correlation-energy formula into a functional of the electron density. Phys. Rev. B 1988, 37, 785–789. [Google Scholar] [CrossRef]
- Gaussian 03, Revision A.1; a computer program for computational chemistry; Gaussian, Inc.: Wallingford, USA, 2003.
- Tetko, I.V.; Gasteiger, J.; Todeschini, R.; Mauri, A.; Livingstone, D.; Ertl, P.; Palyulin, V.A.; Radchenko, E.V.; Zefirov, N.S.; Makarenko, A.S.; et al. Virtual computational chemistry laboratory-design and description. J. Comput. Aid. Mol. Des. 2005, 19, 453–463. [Google Scholar]
- Baumann, K. Cross-validation as the objective function for variable-selection techniques. TrAC Trends Anal. Chem. 2003, 22, 395–406. [Google Scholar] [CrossRef]
- Doweyko, A.M. 3D-QSAR illusions. J. Comp. Aid. Mol. Des. 2004, 18, 587–596. [Google Scholar] [CrossRef]
- Baumann, K.; Stiefl, N. Validation tools for variable subset regression. J. Comp. Aid. Mol. Des. 2004, 18, 549–562. [Google Scholar]
- Esbensen, K.H.; Geladi, P. Principles of Proper Validation: use and abuse of re-sampling for validation. J. Chemometr. 2010, 24, 168–187. [Google Scholar] [CrossRef]
- Sample Availability: Not available.
© 2013 by the authors; licensee MDPI, Basel, Switzerland. This article is an open access article distributed under the terms and conditions of the Creative Commons Attribution license (http://creativecommons.org/licenses/by/3.0/).
Share and Cite
Lozano, N.B.H.; Oliveira, R.F.; Weber, K.C.; Honorio, K.M.; Guido, R.V.; Andricopulo, A.D.; Silva, A.B.F.D. Identification of Electronic and Structural Descriptors of Adenosine Analogues Related to Inhibition of Leishmanial Glyceraldehyde-3-Phosphate Dehydrogenase. Molecules 2013, 18, 5032-5050. https://doi.org/10.3390/molecules18055032
Lozano NBH, Oliveira RF, Weber KC, Honorio KM, Guido RV, Andricopulo AD, Silva ABFD. Identification of Electronic and Structural Descriptors of Adenosine Analogues Related to Inhibition of Leishmanial Glyceraldehyde-3-Phosphate Dehydrogenase. Molecules. 2013; 18(5):5032-5050. https://doi.org/10.3390/molecules18055032
Chicago/Turabian StyleLozano, Norka B. H., Rafael F. Oliveira, Karen C. Weber, Kathia M. Honorio, Rafael V. Guido, Adriano D. Andricopulo, and Albérico B. F. Da Silva. 2013. "Identification of Electronic and Structural Descriptors of Adenosine Analogues Related to Inhibition of Leishmanial Glyceraldehyde-3-Phosphate Dehydrogenase" Molecules 18, no. 5: 5032-5050. https://doi.org/10.3390/molecules18055032