Article

Design, Synthesis and Evaluation of Dual-Modality Glyco-Nanoparticles for Tumor Imaging

1
Key Laboratory of Carcinogenesis and Translational Research (Ministry of Education), Department of Nuclear Medicine, Peking University Cancer Hospital & Institute, Beijing 100142, China
2
Department of Experimental Diagnostic Imaging, Unit 59, the University of Texas MD Anderson Cancer Center,1515 Holcombe Boulevard, Houston, TX 77030, USA
3
China Institute of Atomic Energy, Beijing 102413, China
*
Authors to whom correspondence should be addressed.
Molecules 2013, 18(6), 6425-6438; https://doi.org/10.3390/molecules18066425
Submission received: 26 March 2013 / Revised: 22 May 2013 / Accepted: 27 May 2013 / Published: 30 May 2013
(This article belongs to the Section Medicinal Chemistry)

Abstract

:
d-Glucosamine (DG) was conjugated to a core-cross linked polymeric micelle (CCPM) system equipped with both a near-infrared fluorophore (NIRF) and a gamma emitter (111In). The resultant nano-scale tumor-targeting imaging tracer, 111In-DG-NIRF-CCPM, selectively accumulated in a human epithelial carcinoma A-431 xenograft model in mice. At 24 hrs post injection, the tumor uptake was 2.62 ± 0.80 % of the injected dose per gram of tissue (%ID/g). Tumors were clearly delineated in both single-photon emission computed tomography (SPECT) and optical imaging. The results suggest that the prepared imaging tracer is a promising agent for tumor diagnosis.

Graphical Abstract

1. Introduction

Optical imaging is a relatively new molecular imaging modality that offers non-invasive, real-time and high-sensitivity imaging of fluorophores embedded in diseased tissues [1,2]. There has been an increased interest in the use of polymeric micelles to deliver tumor-imaging tracers, because polymeric micelles with adequate size can accumulate within tumor tissue due to the enhanced permeation and retention (EPR) effect [3,4]. Specifically, polymeric micelles containing NIRF compounds have been extensively explored for non-invasive molecular imaging [5,6]. Previously, we reported the synthesis of core-cross linked polymeric micelles (CCPM) containing a Cy-7-like NIRF dye as well as a gamma-emitter 111Indium (T1/2 = 2.83 d, 0.171 MeV (90%), 0.245 MeV (94%)). CCPM system exhibited prolonged blood half-life and enhanced uptake in tumor [7,8]. In this study, we investigated whether the surface of CCPM can be further modified with sugar molecules to improve its pharmacokinetics profile and minimize its non-tumor uptake [9].
Carbohydrate-mediated molecular recognitions have been applied to nano-medicine to improve drug delivery efficiency of nano-carriers [10,11]. Glyco-nanotechnology, as an innovative medicine, has been extensively used in basic and clinical research [12,13]. d-Glucosamine (DG) is an attractive scaffold as a glucosyl ligand. We recently reported the synthesis of 68Ga- and 111In-labeled DG for the positron emission tomography (PET) and SPECT imaging of tumors [14,15,16]. Those studies have showed that DG attached to a bulky moiety still preserved its biological functions. In this study, we conjugated DG to the CCPM surface via a succinate linker, and investigated its performances regarding the tumor targeting, in vitro and in vivo stability, biodistribution, and dual gamma and NIRF optical imaging. We found that DG-CCPM had excellent stability, could be taken up by tumor cells, and was visualizable by both gamma and optical imaging modalities. Further studies are needed to improve the drug targeting efficiency with dual-labeled CCPM for molecular imaging.

2. Results and Discussion

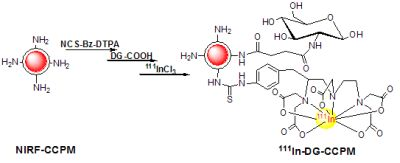
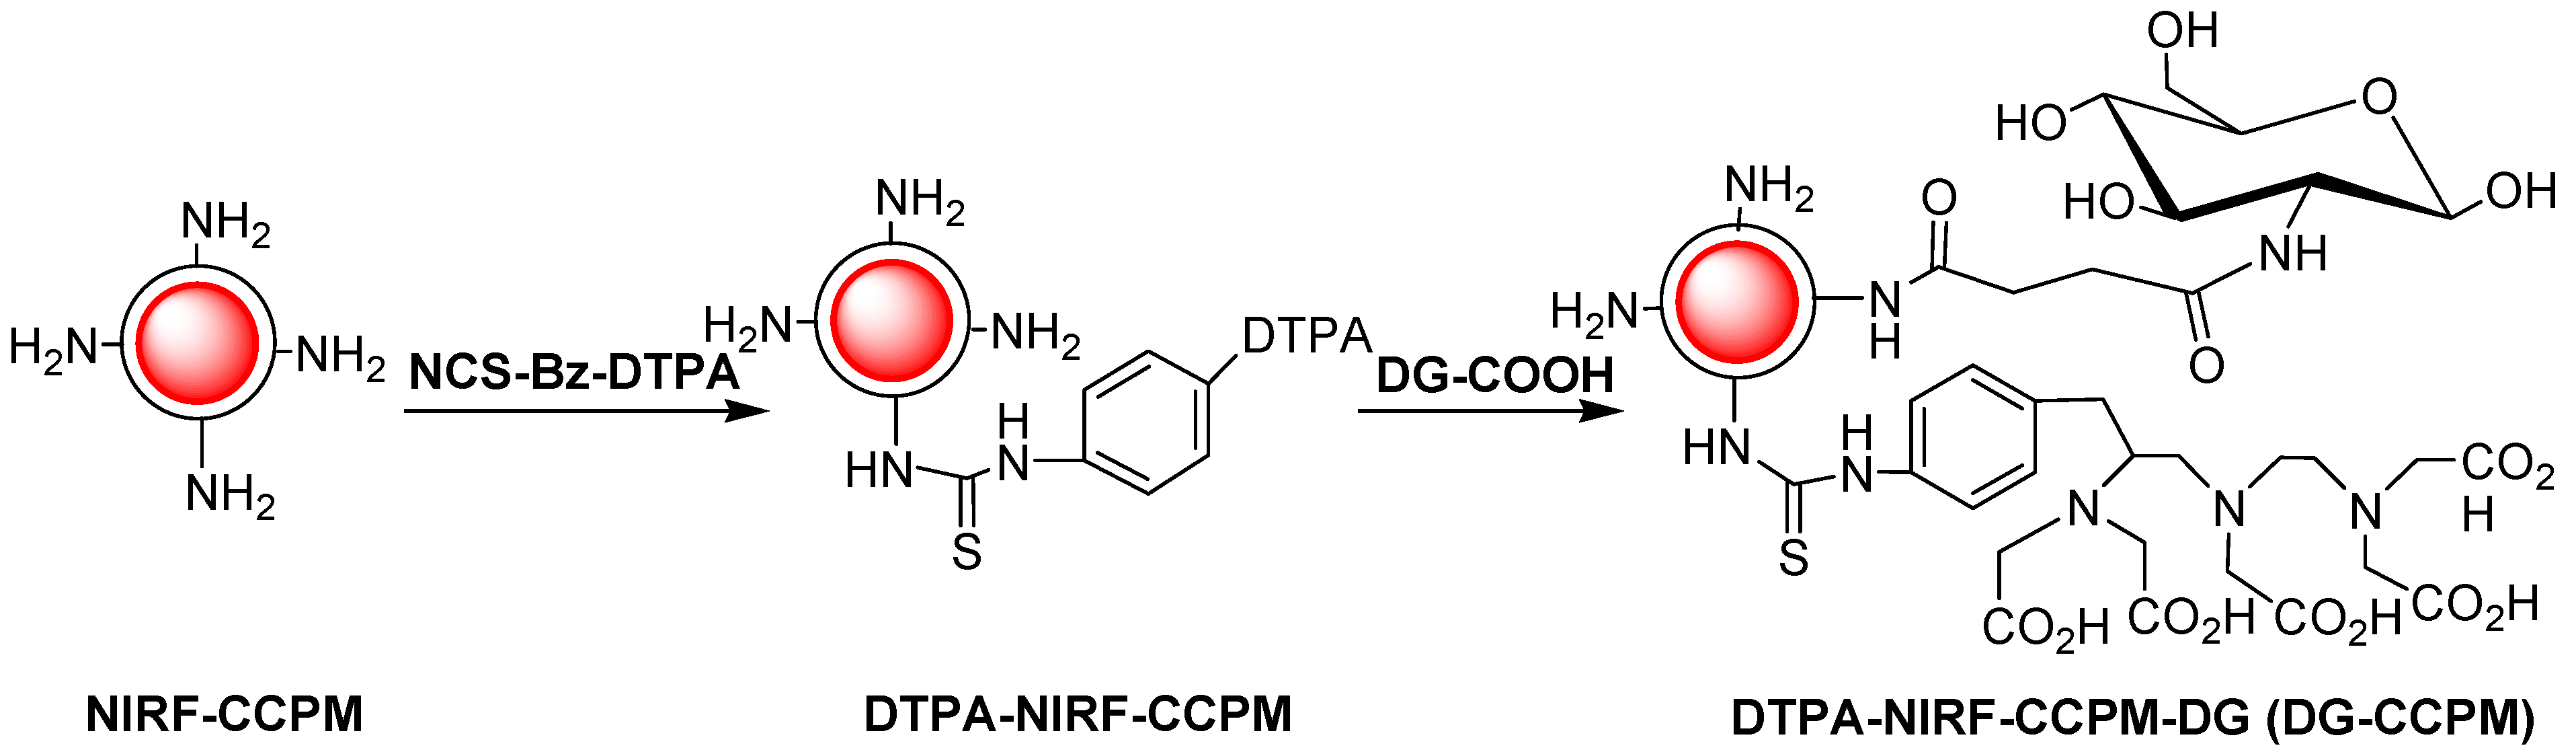
2.1. Synthesis and Characterization of CCPM Nanoparticles

DG-COOH was synthesized by the amidation of glucosamine to succinic anhydride. The identity of this product was confirmed by negative mode electrospray mass spectrometry (Agilent LC/MSDTOF), m/z = 278.1027 for [M−H](C10H16NO8, calculated [M−H] 278.0876);IR (KBr) ν: 3048, 2932, 2840, 1518, 1062, 928 cm−1; 1H-NMR (D2O, 300 MHz) δ: 7.81 (s, 1H, NH), 5.95 (m, 1H), 4.02 (m, 1H), 3.55 (d, J = 2.0 Hz, 2H), 3.30–3.22 (m, 2H), 2.69 (d, J = 2.0 Hz, 2H), 2.55 (d, J = 2.0 Hz, 2H), 2.3–2.2 (m, 4H, -OH).
DTPA was conjugated to CCPM by simply mixing NCS-Bz-DTPA and CCPM under nitrogen overnight. Unreacted NCS-Bz-DTPA was removed by centrifugal filtration or by PD-10 column chromatography. About 70% of the NCS-Bz-DTPA was attached to the NIRF-CCPMs. Next, DG-COOH was coupled to CCPM using1-ethyl-3-(3-dimethylaminopropyl)carbodiimide hydrochloride (EDC) as the coupling agent to form ester linkage. A UV-Vis spectrophotometer was used to measure the absorbance (optical density, OD) at 780 nm or 335 nm; which was converted into a concentration using the Beer-Lambert relation (path-length = 1mm). The standard curve of DTPA-NIRF-CCPM generated at 780 nm was used to determine the concentration of CCPM [Figure 1(a)]. The standard curve generated at 335 nm after treatment with 2,4,6-trinitrobenzenessulfonate (TNBS) was used to quantify the amount of amines on the surface of CCPM [Figure 1(b)] [17,18,19].
Figure 1. Standard Curve of (a) OD 780 nm absorption of DTPA-NIRF-CCPM. (b) OD 335 nm absorption of amines.
Molecules 18 06425 g001
The DTPA-NIRF-CCPM-DG (DG-CCPM) nanoparticles were characterized with regard to composition, size, surface charge and optical properties. As shown in Table 1. DG-CCPM nanoparticles had approximately 19 DTPA and 15 DG molecules per nanoparticle. The volume average size of DTPA-NIRF-CCPM was 24 ± 8.9 nm, determined by dynamic light scattering. Prior to conjugation, the amine-abundant CCPM was weakly positively charged. After DTPA and DG conjugation, however, the surface potential changed to slightly negative, indicating the successful conjugation.
Table 1. Summary of the physicochemical properties of CCPM.
SpecificationNIRF-CCPMDTPA-NIRF-CCPMDG-CCPM
Particles (nm) a24 ± 8.924 ± 8.924 ± 8.9
Zeta potential (mV) b+1.2−5.83 ± 2.40−5.83 ± 1.08
Dyes/Particle c212121
DTPA/Particle d01919
Amines/Particle e180160145
Concentration f1.54 × 10157 × 10143.4 × 1014
DG/Particle gN/AN/A15
a. Volume-average mean diameter measured by dynamic light scattering. b. Zeta potential measured in phosphate-buffered saline at pH 7.4. c. The value was estimated assuming all dye molecules were incorporated into the nanoparticles. d. DTPA loading per particle; estimated on the basis of amount of DTPA used and of conjugation efficiency as measured by capillary electrophoresis. e. TNBS (OD 335 nm) was used to measure the primary amine groups in each particle. f. Determined by absorption at 780 nm. g. Determined by subtracting the number of amines per nanoparticle after conjugation from the number of amines per nanoparticle before DG conjugation. N/A: not applicable.

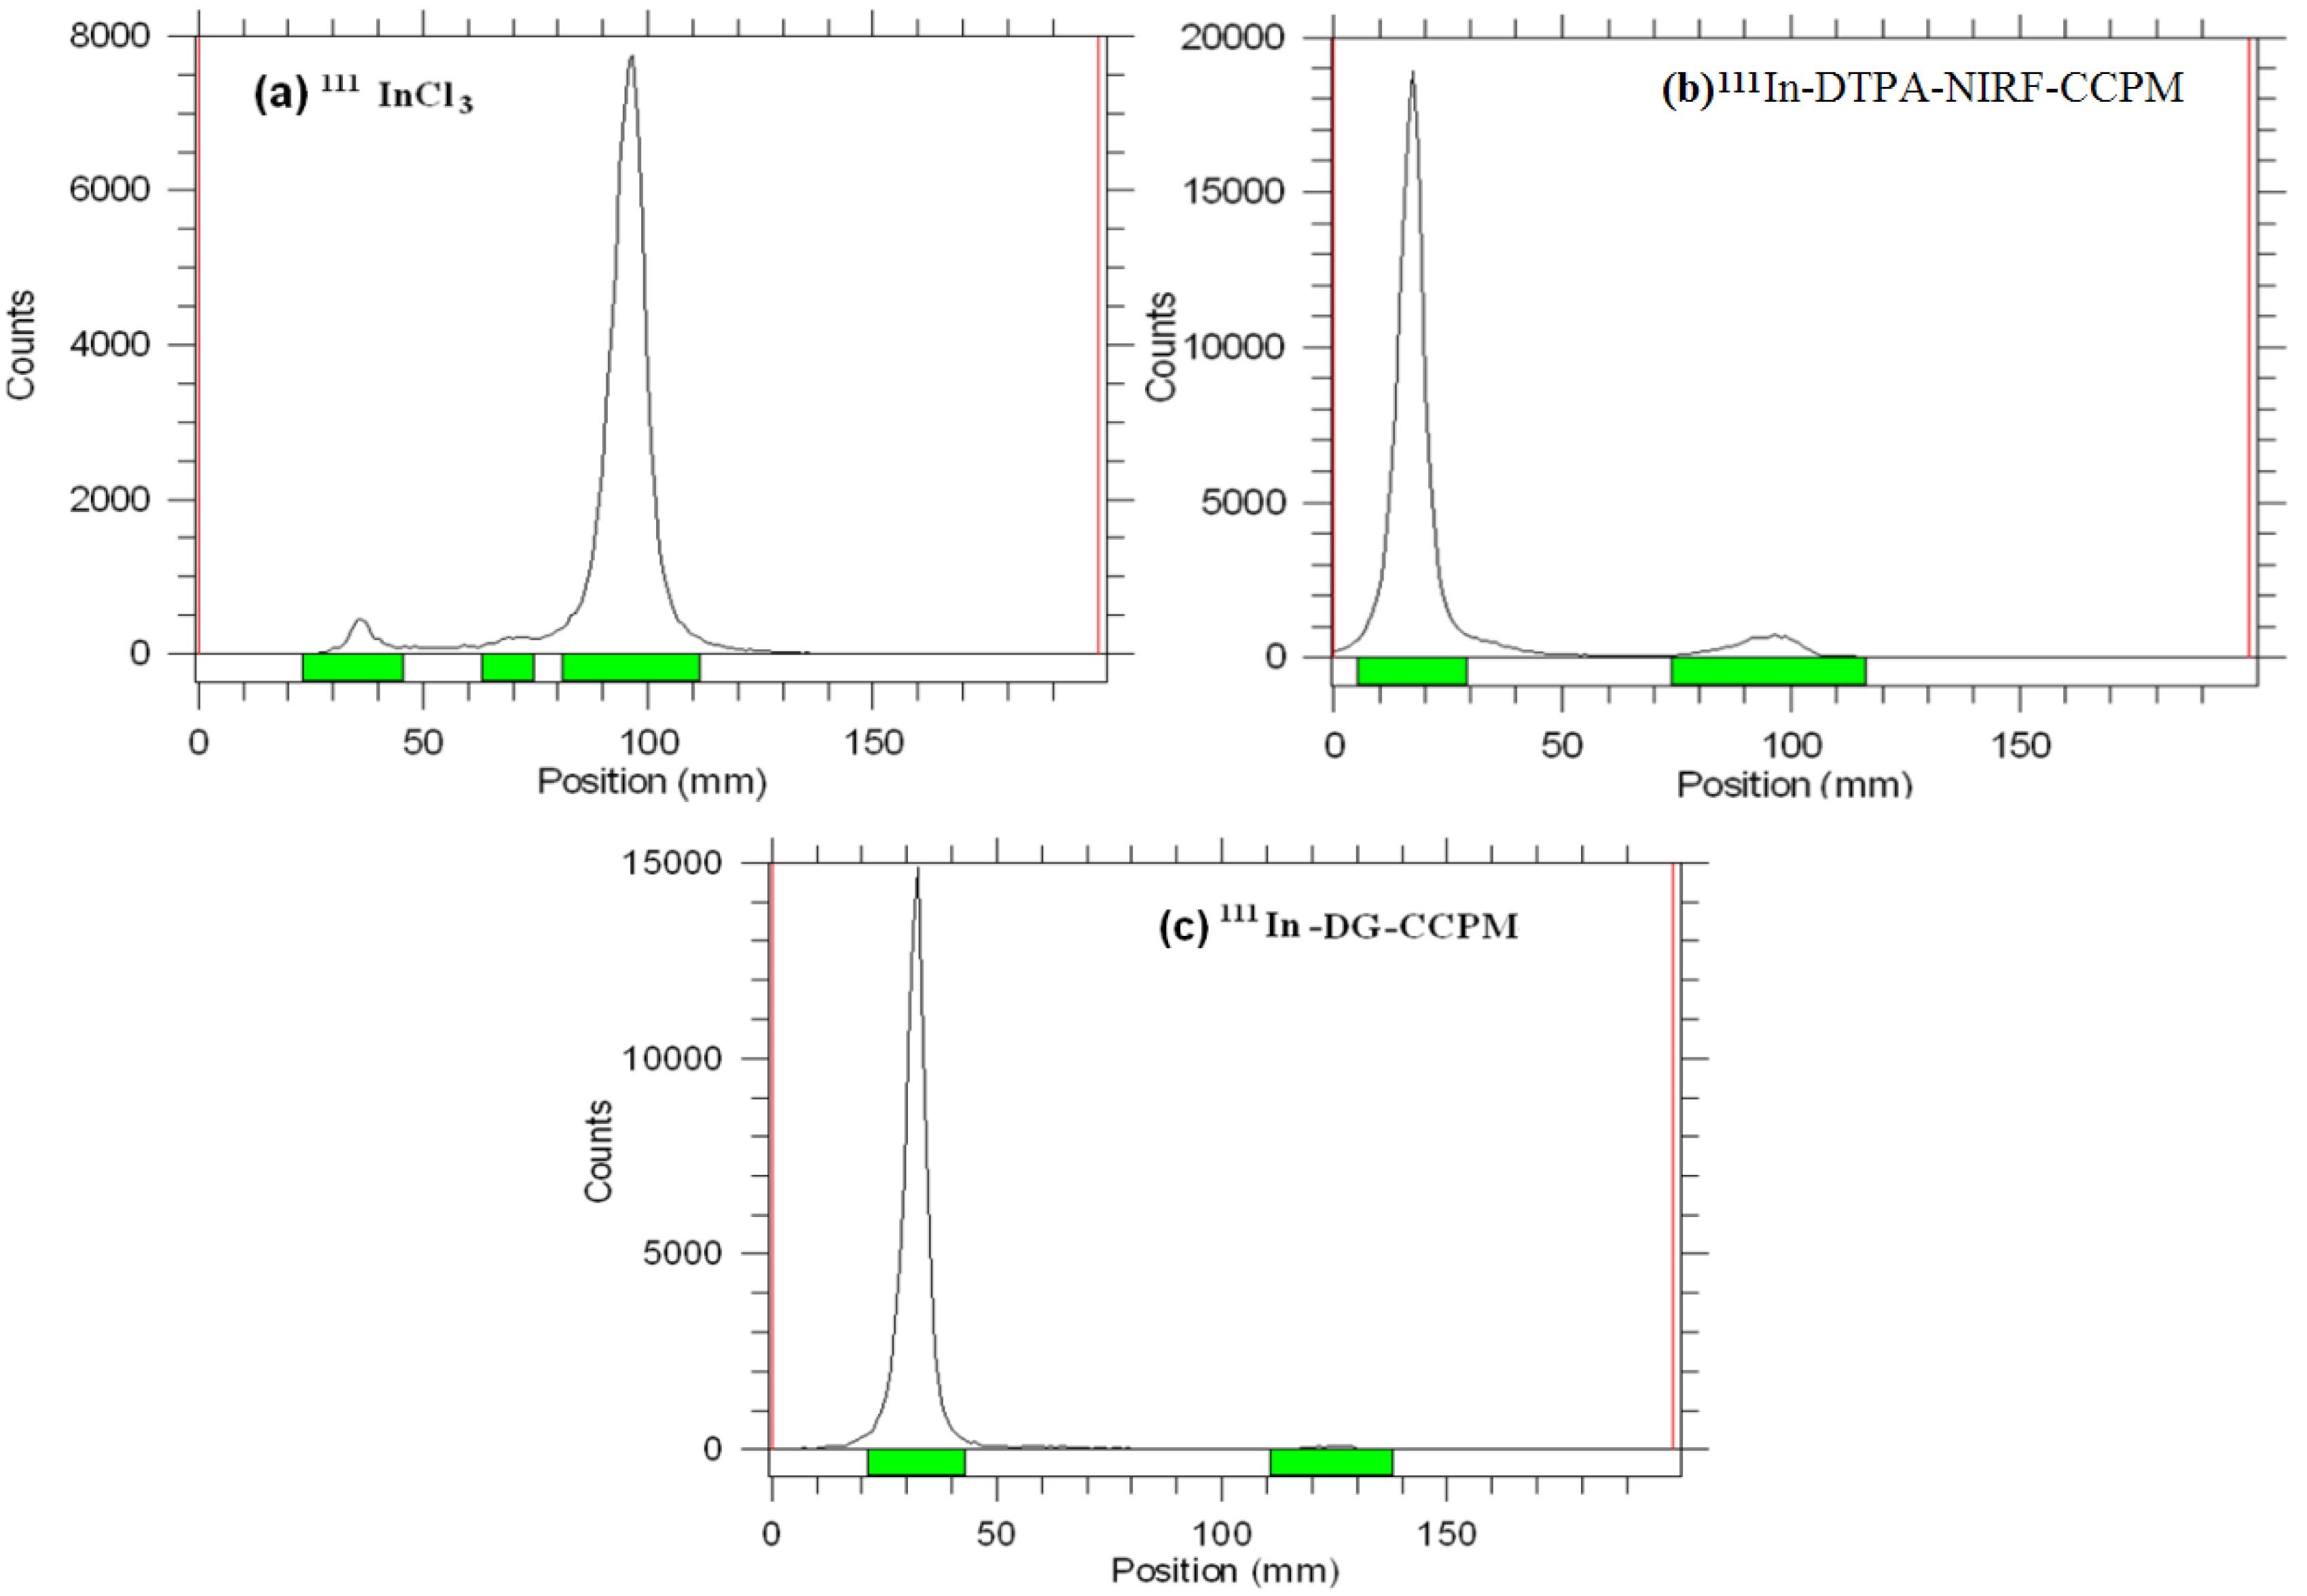
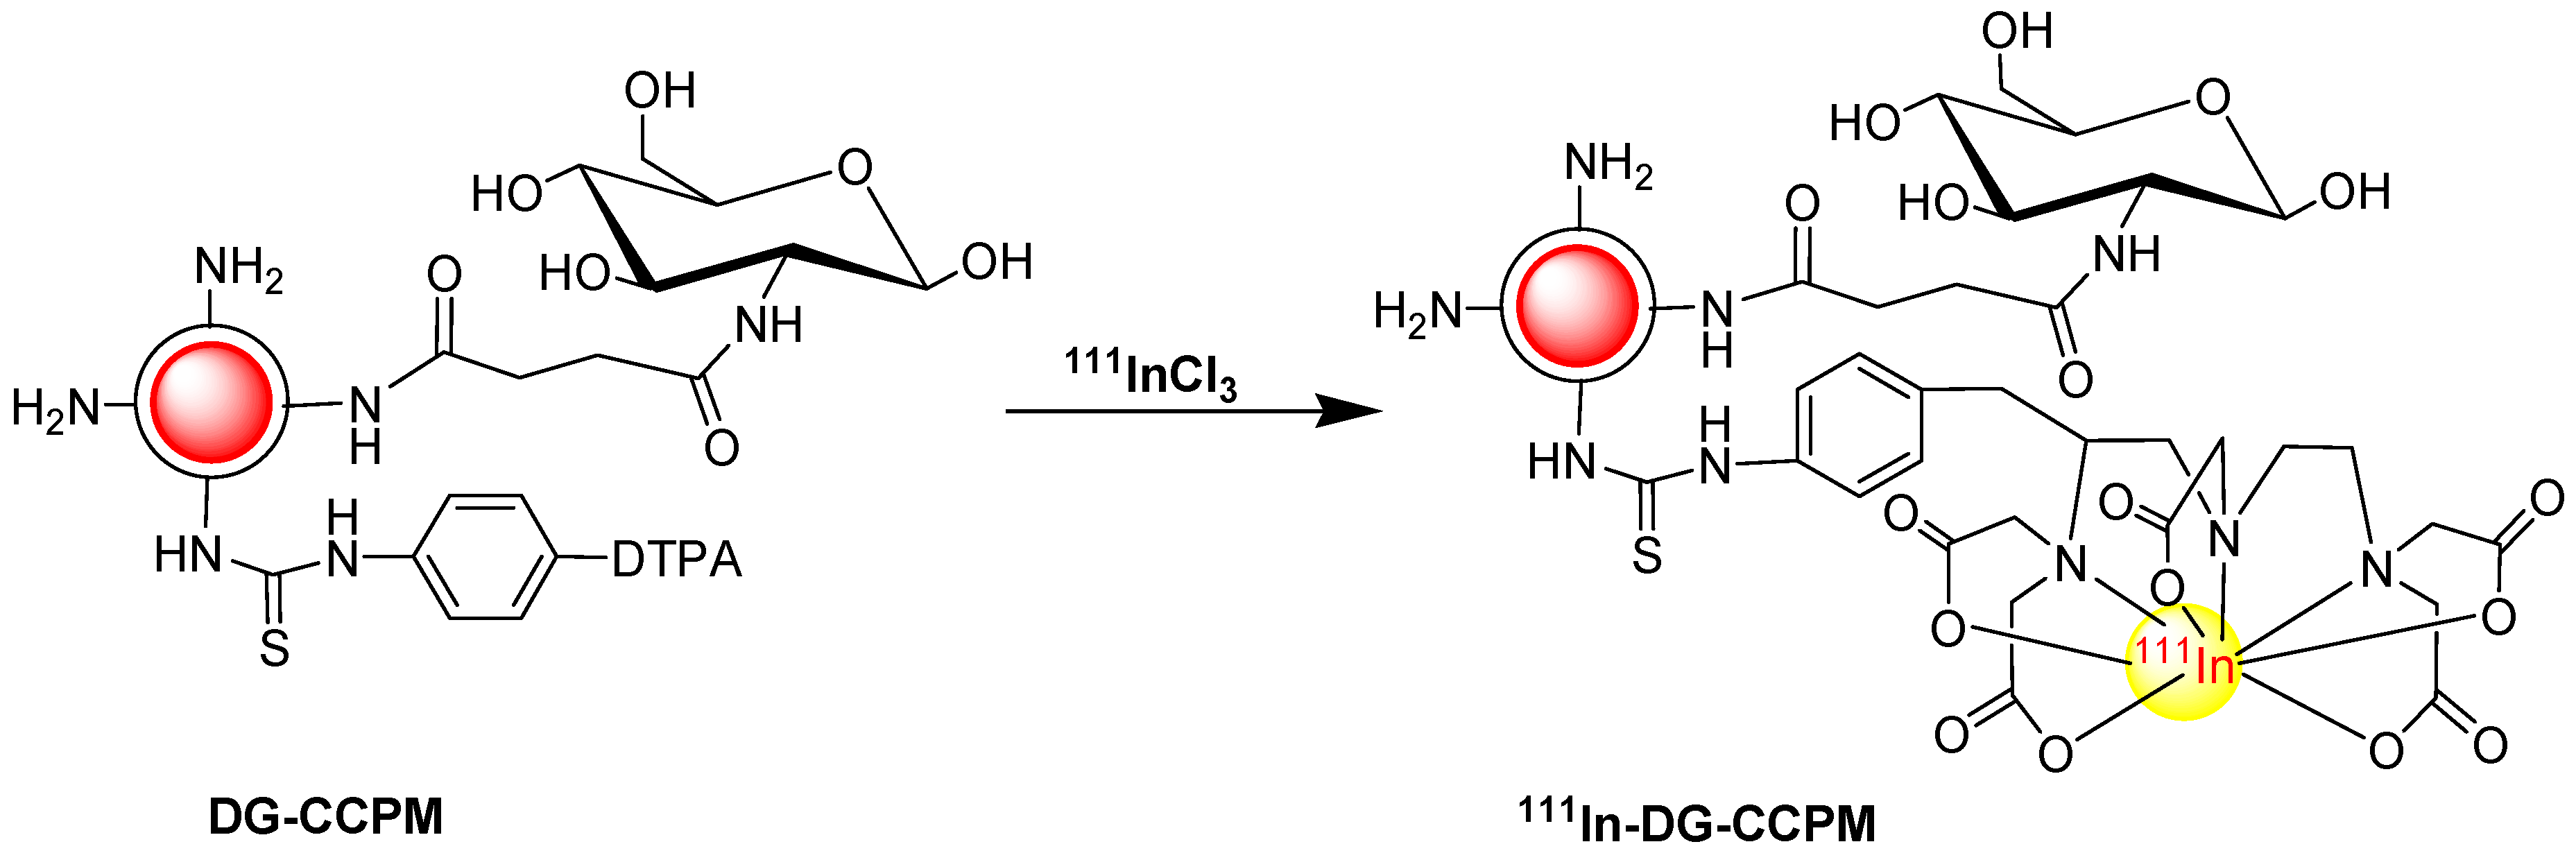
2.2. Radiolabeling of the Nanoparticles

Radiolabeling of the nanoparticles was accomplished through incubation of 111InCl3 with DTPA-NIRF-CCPM or DG-CCPM in 0.1 M NaOAc (pH 5.2) at room temperature, respectively. Under such conditions, a labeling efficiency of greater than 96% was achieved without further purification. As indicated by radio-TLC, most radioactivity was associated with 111In-labeled DTPA-NIRF-CCPM or DG-CCPM nanoparticles (Rf~ 0.0), with less than 5% detectable free 111InCl3 (Rf ~ 0.9) (Figure 2).
Figure 2. Radio-TLC analyses of (a) 111InCl3. (b) 111In-DTPA-NIRF-CCPM. (c) 111In-DG-CCPM.
Molecules 18 06425 g002

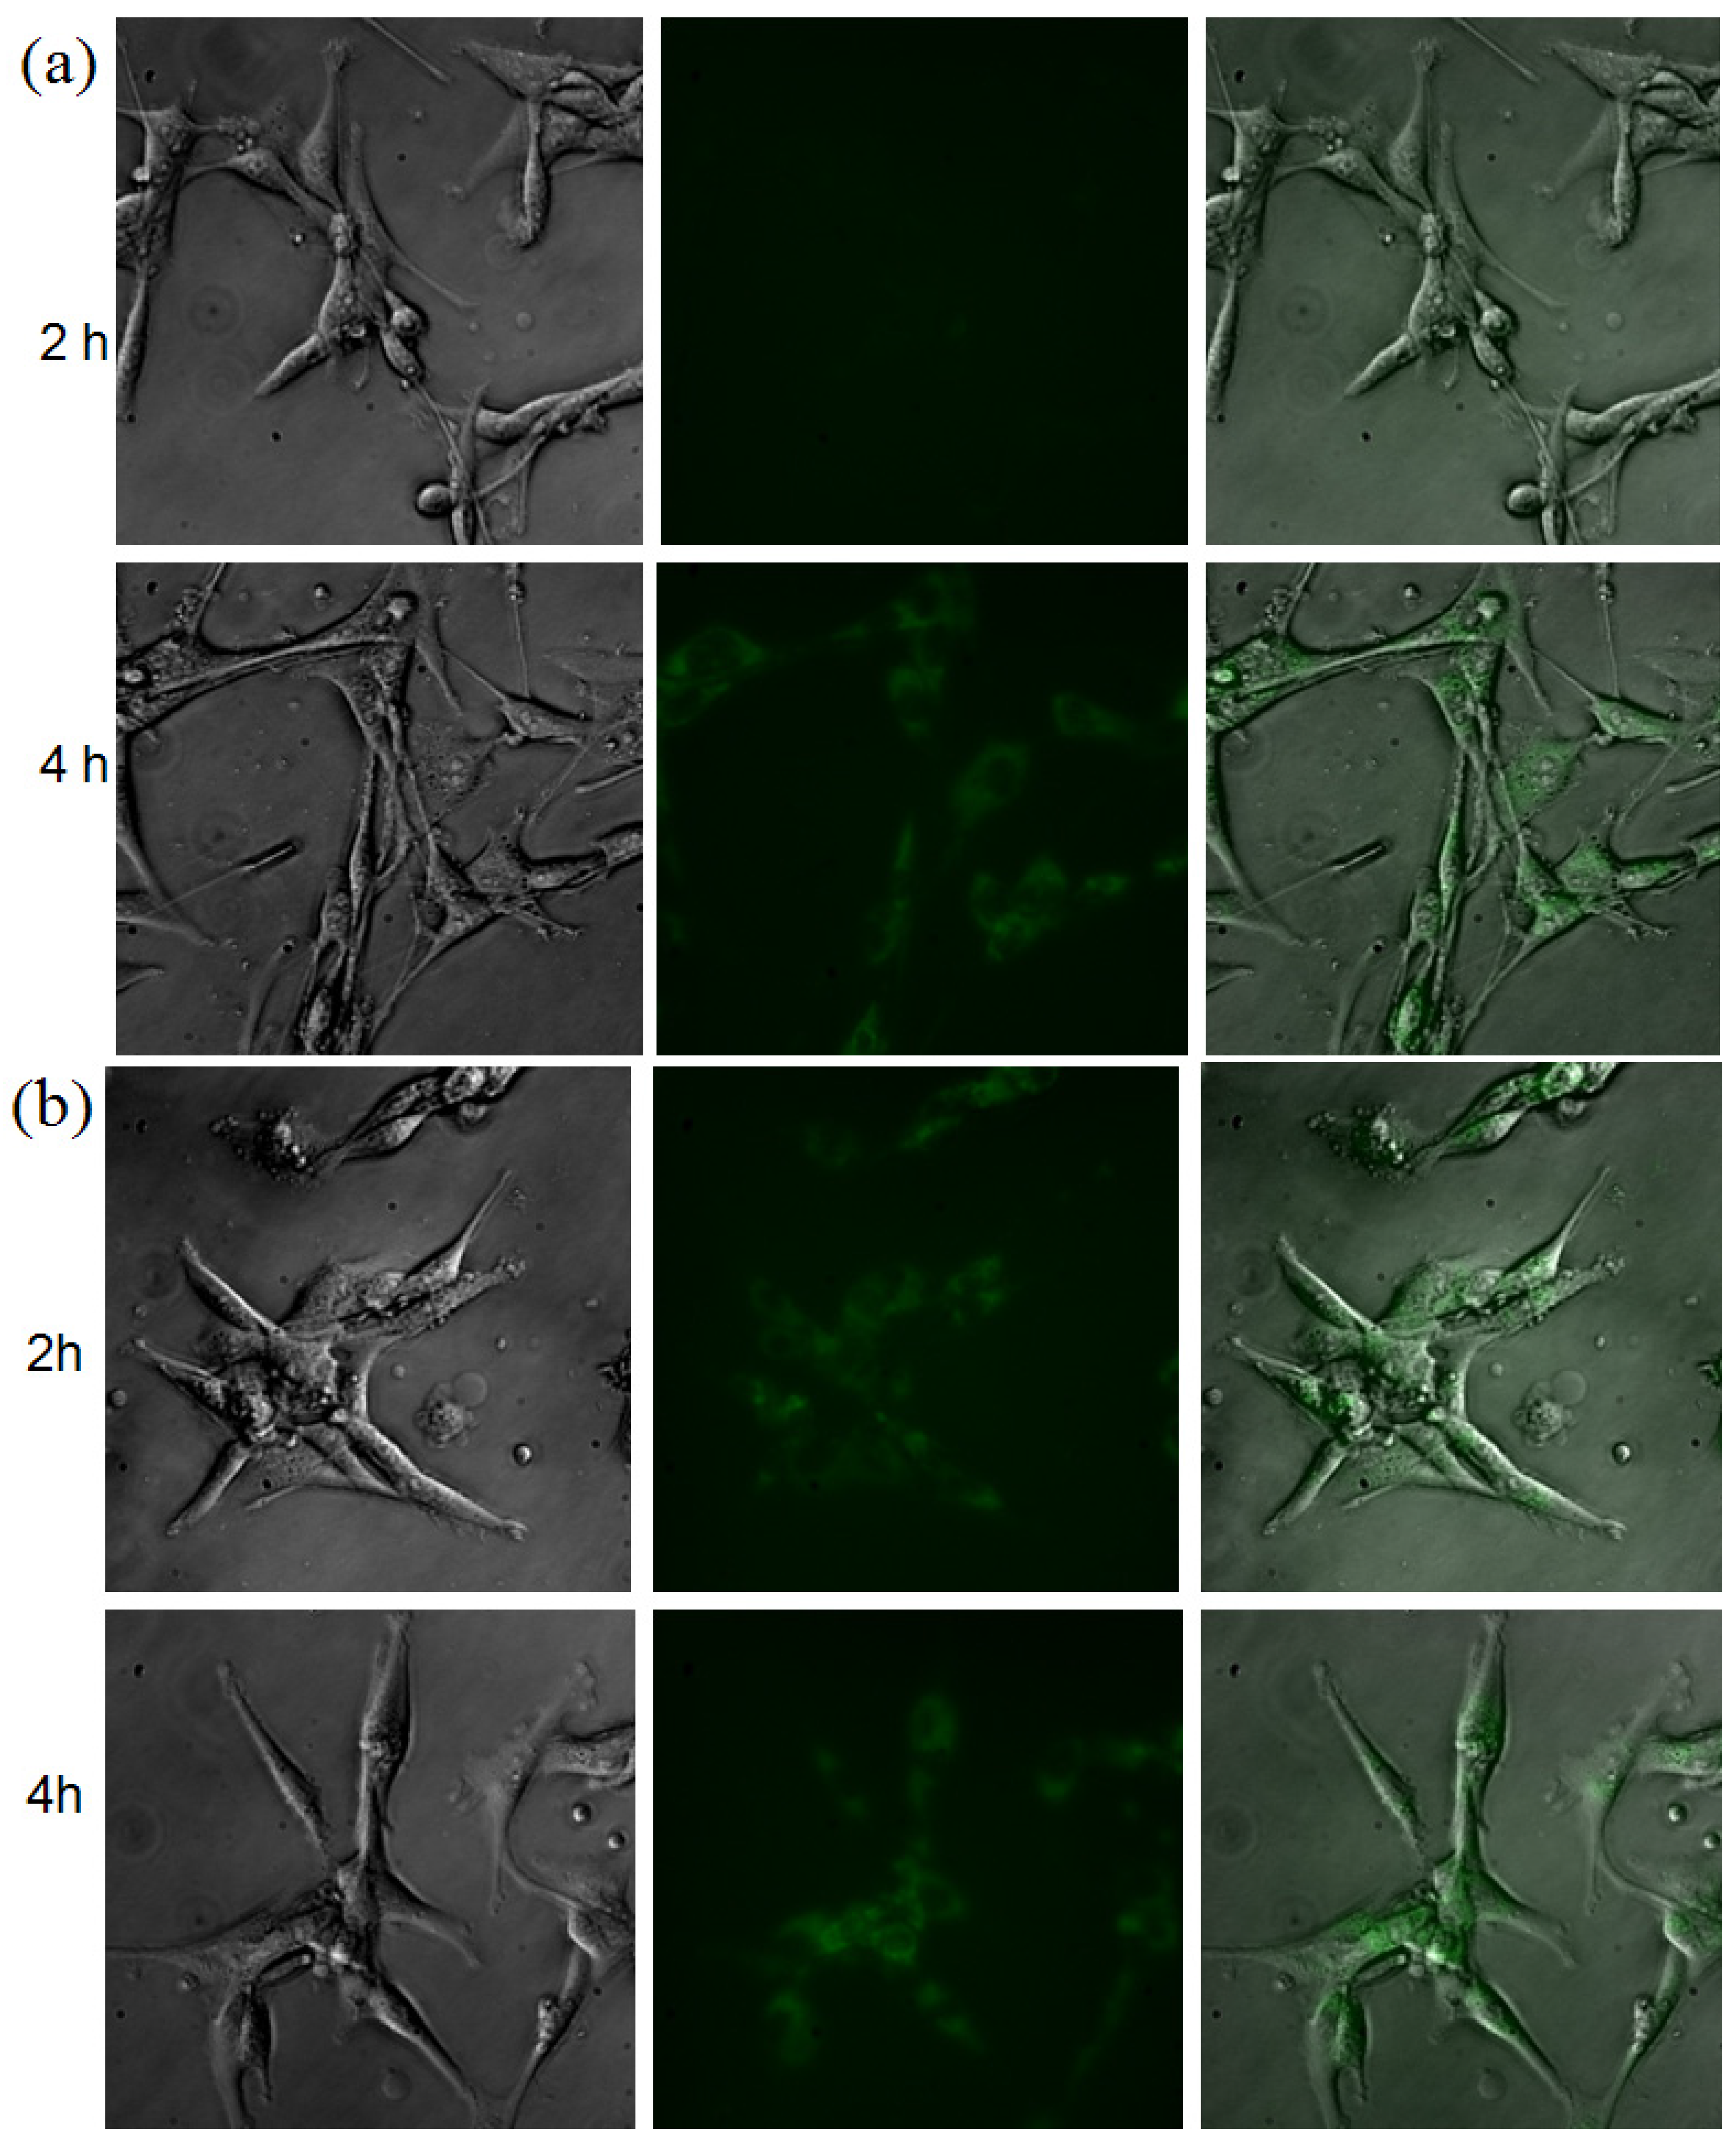
2.3. Microscopic Imaging of DTPA-NIRF-CCPM-DG

The binding of NIRF-CCPM and DG-CCPM to A431 cells was studied by fluorescence microscopy (Figure 3). At two hours after incubation, NIRF-CCPM did not uptake in these cells. However, at 4 hours after incubation, uptake of NIRF-CCPM in cells was clearly visualized. In comparison, uptake of DG-CCPM in A431 cells were observed at 2-hour time point, and the fluorescent signal intensity appeared to have increased over from 2 to 4 h (Figure 3). The data indicated that both NIRF-CCPM and DG-CCPM could be internalized over time. Cell uptake of NIRF-CCPM could be attributed to nonspecific phagocytic activity of tumor cells. Many studies have demonstrated that 18F-FDG and its fluorescent analogs are substrates of glucose transporters (GLUTs) [20]. Further studies are needed to establish whether uptakes of DG-CCPM in A431 cells are mediated through GLUTs.

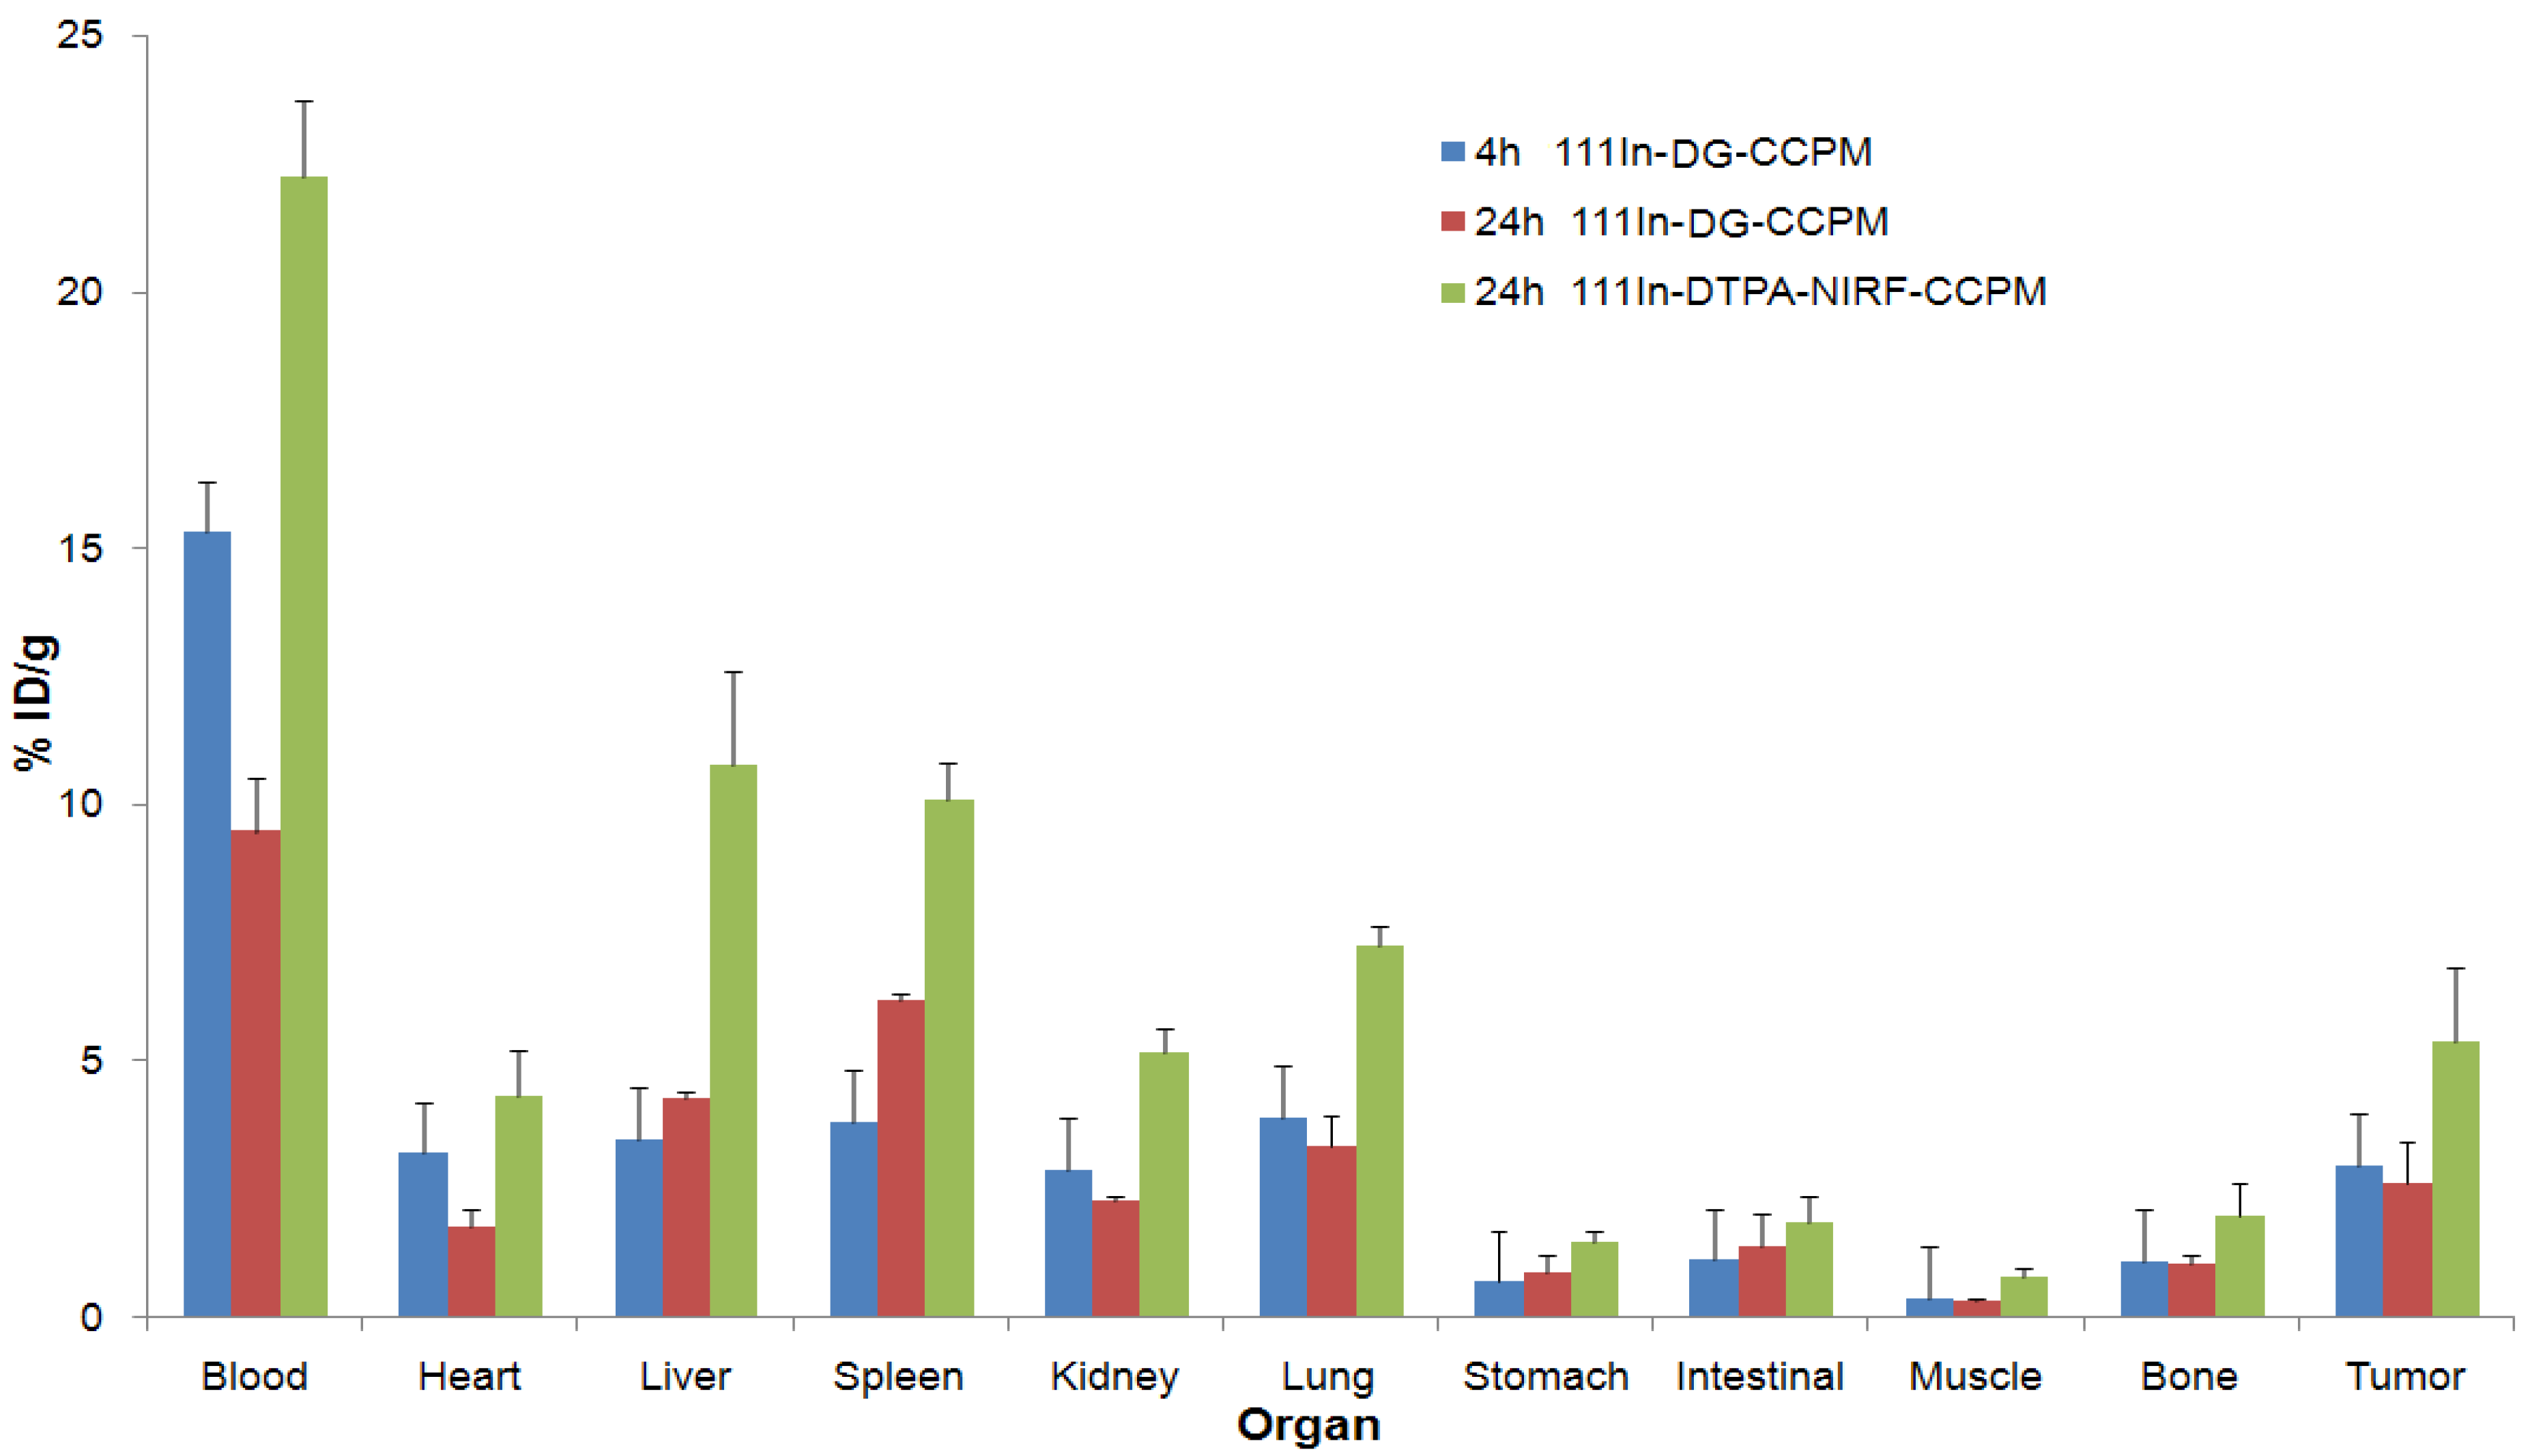
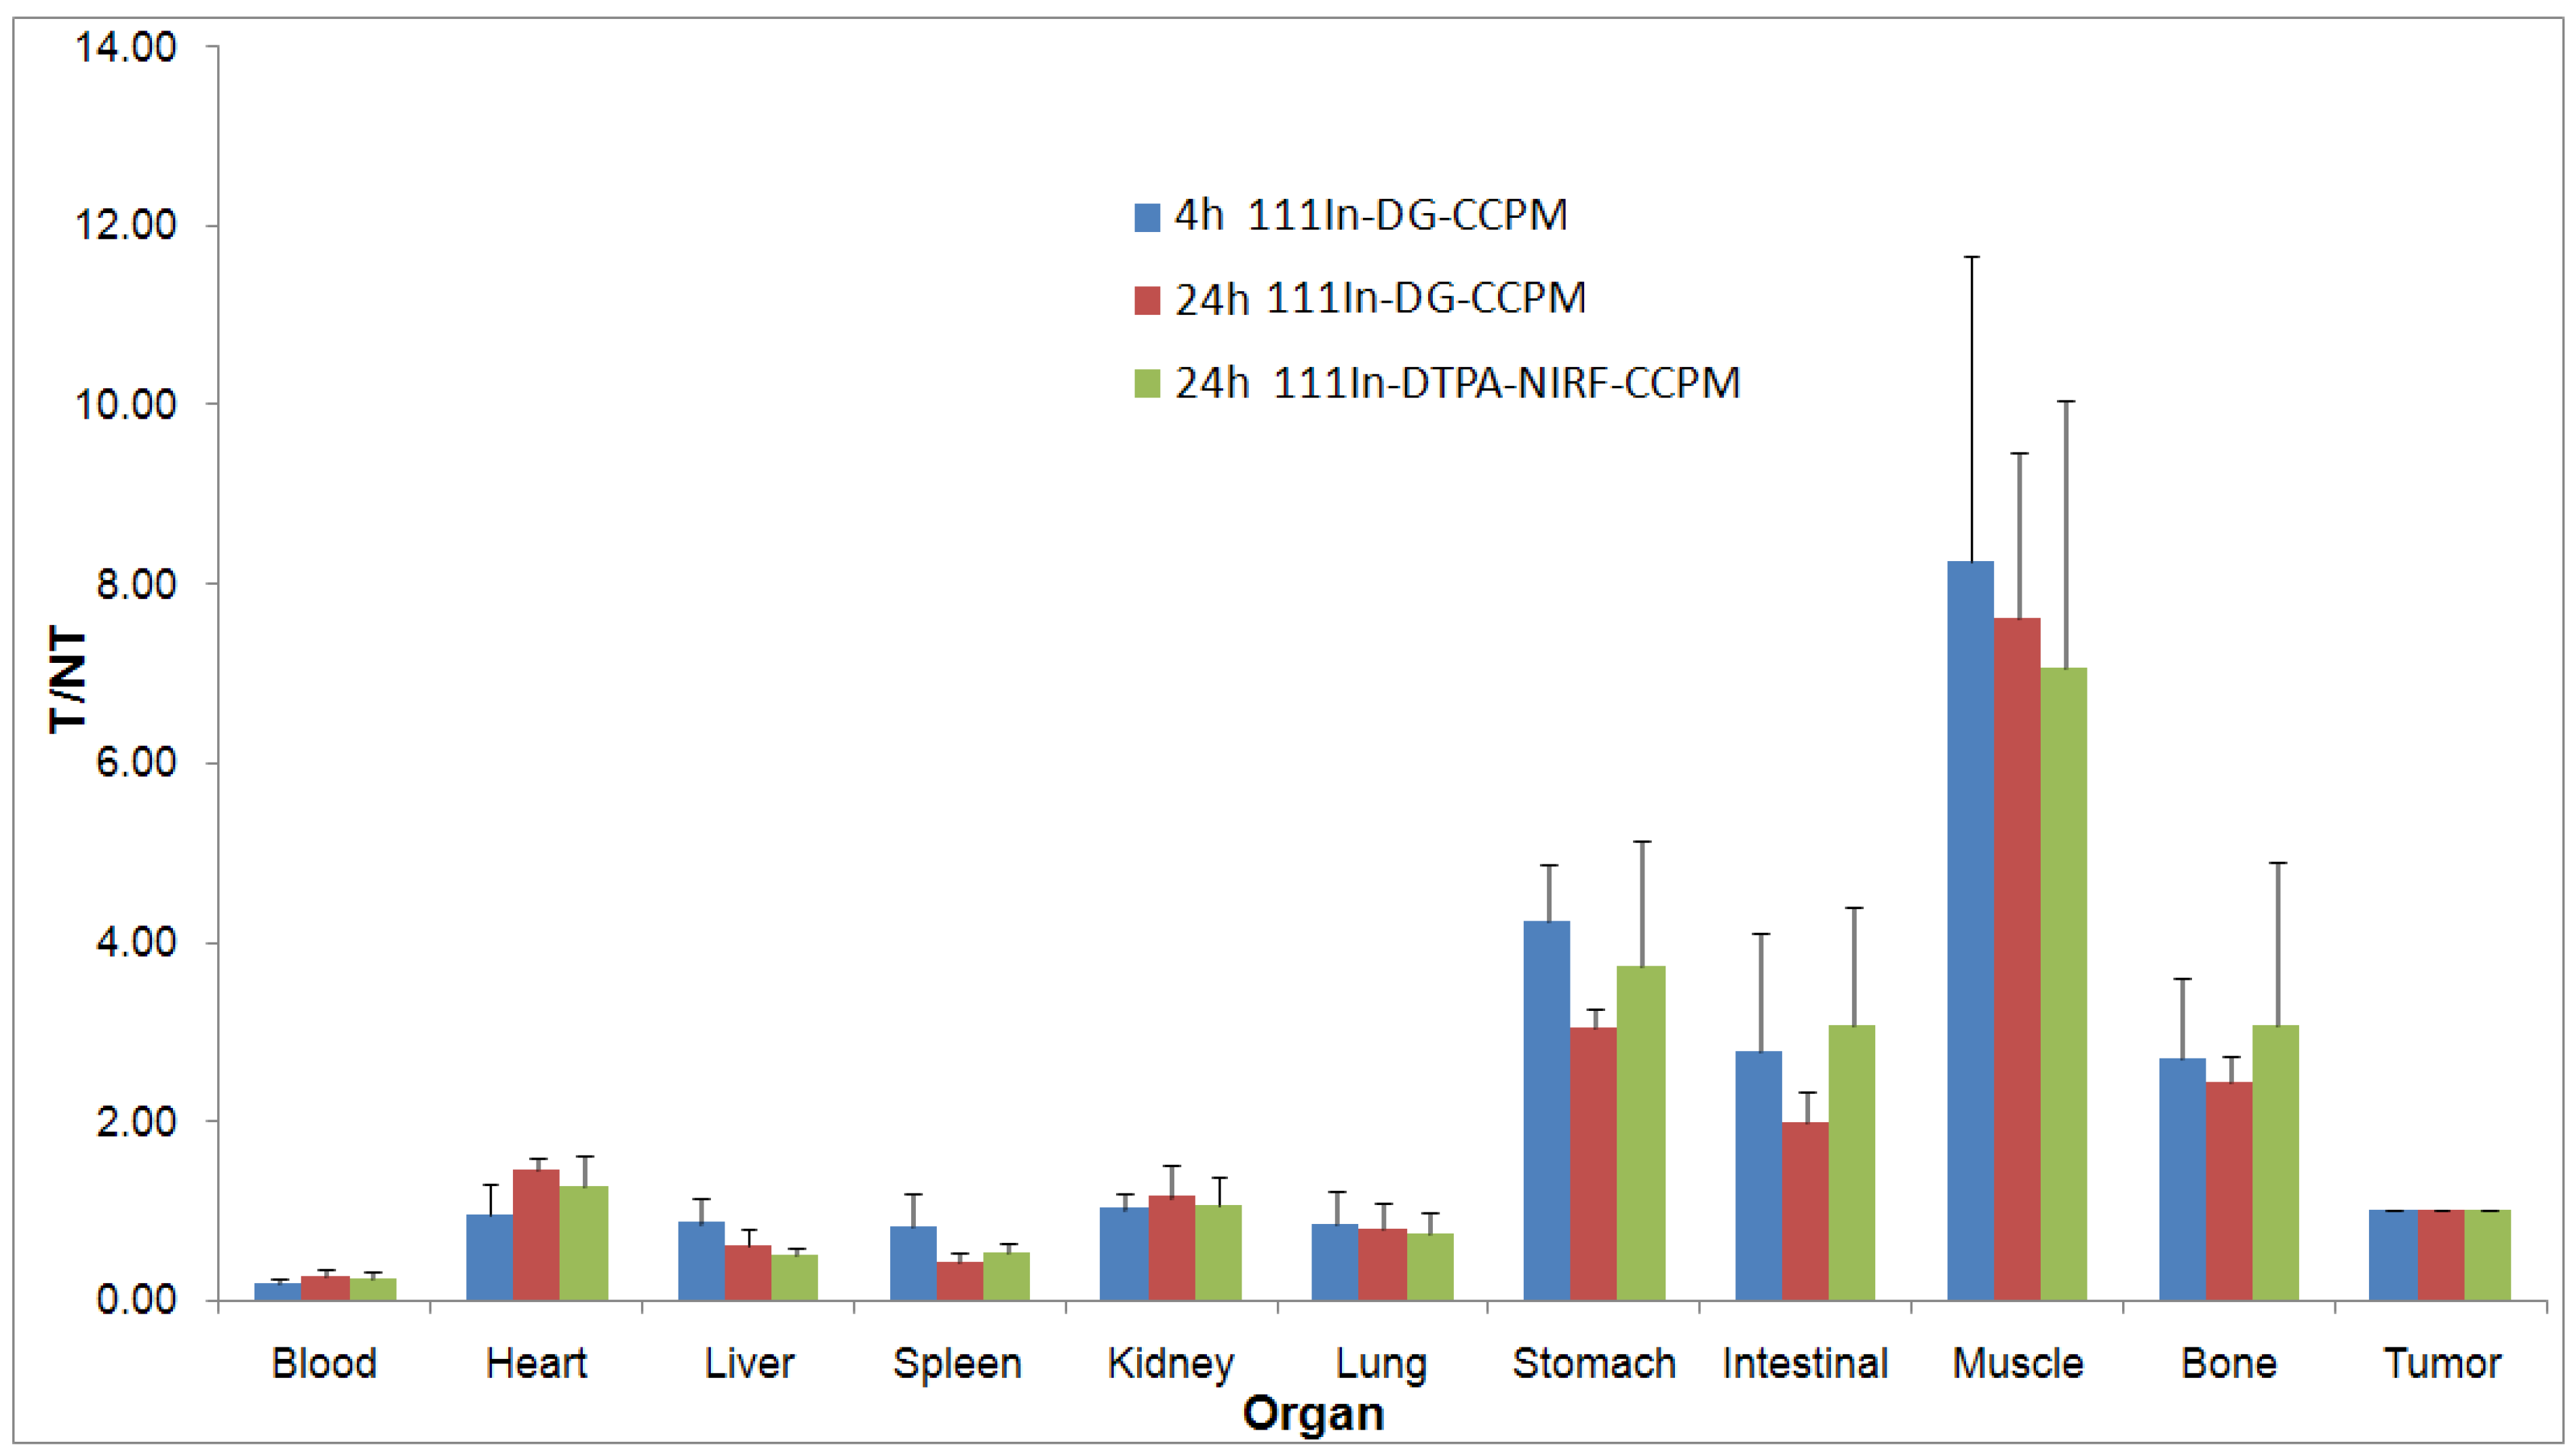
2.4. Biodistribution in Tumor Bearing mice

Biodistribution studies of 111In-DG-CCPM and 111In-DTPA-NIRF-CCPM were carried out in mice bearing subcutaneous A431 tumor. As shown in Figure 4, the percentage of injected dose per gram of tissue (%ID/g) at 24 h after intravenous injection in the liver and the spleen were 4.27 ± 0.15% and 6.2 ± 0.14% for 111In-DG-CCPM, and 10.79 ± 1.81% and 10.1 ± 0.74% for 111In-DTPA-NIRF-CCPM, respectively. 111In-DG-CCPM had significantly lower spleen uptake than that of the 111In-DTPA-NIRF-CCPM (p = 0.0097). On the other hand, 111In-DTPA-NIRF-CCPM had significantly higher activity in the blood (p = 0.0098) and the lung (p = 0.0067). 111In-DTPA-NIRF-CCPM activity was also significantly higher in the tumor (p = 0.046). The higher activity observed with 111In-DTPA-NIRF-CCPM as compared to 111In-DG-CCPM in the liver, spleen, lung, and tumor may be attributed to higher blood pool activity of 111In-DTPA-NIRF-CCPM.
Figure 3. Representative microphotographs of A431 cells after incubation with (a) NIRF-CCPM and (b) DG-CCPM under (left) bright light, (middle) fluorescence microscope at 750 nm, and (right) overlap of bright light and fluorescence images. Original magnification × 20 object.
Molecules 18 06425 g003
Figure 4. Biodistribution studies of 111In labeled CCPM in nude mice bearing A 431 tumors at 4 h and 24 h.
Molecules 18 06425 g004
However, the distribution patterns for each particle were similar, with the liver and the spleen being the major organs taking up the radio-labeled glyco-nanoparticles. Figure 5 compares the tumor-to-normal tissue (T/NT) uptake ratio of 111In-DG-CCPM and 111In-DTPA-NIRF-CCPM. 111In-DTPA-NIRF-CCPM did not show significantly higher T/NT ratios compared with 111In-DG-CCPM at 24 h post injection.
Figure 5. Comparison of tumor-to-normal tissue uptake ratio (T/NT) between 111In-DTPA-NIRF-CCPM and 111In-DG-CCPM in nude mice bearing A 431 tumors at 4 h and 24 h.
Molecules 18 06425 g005

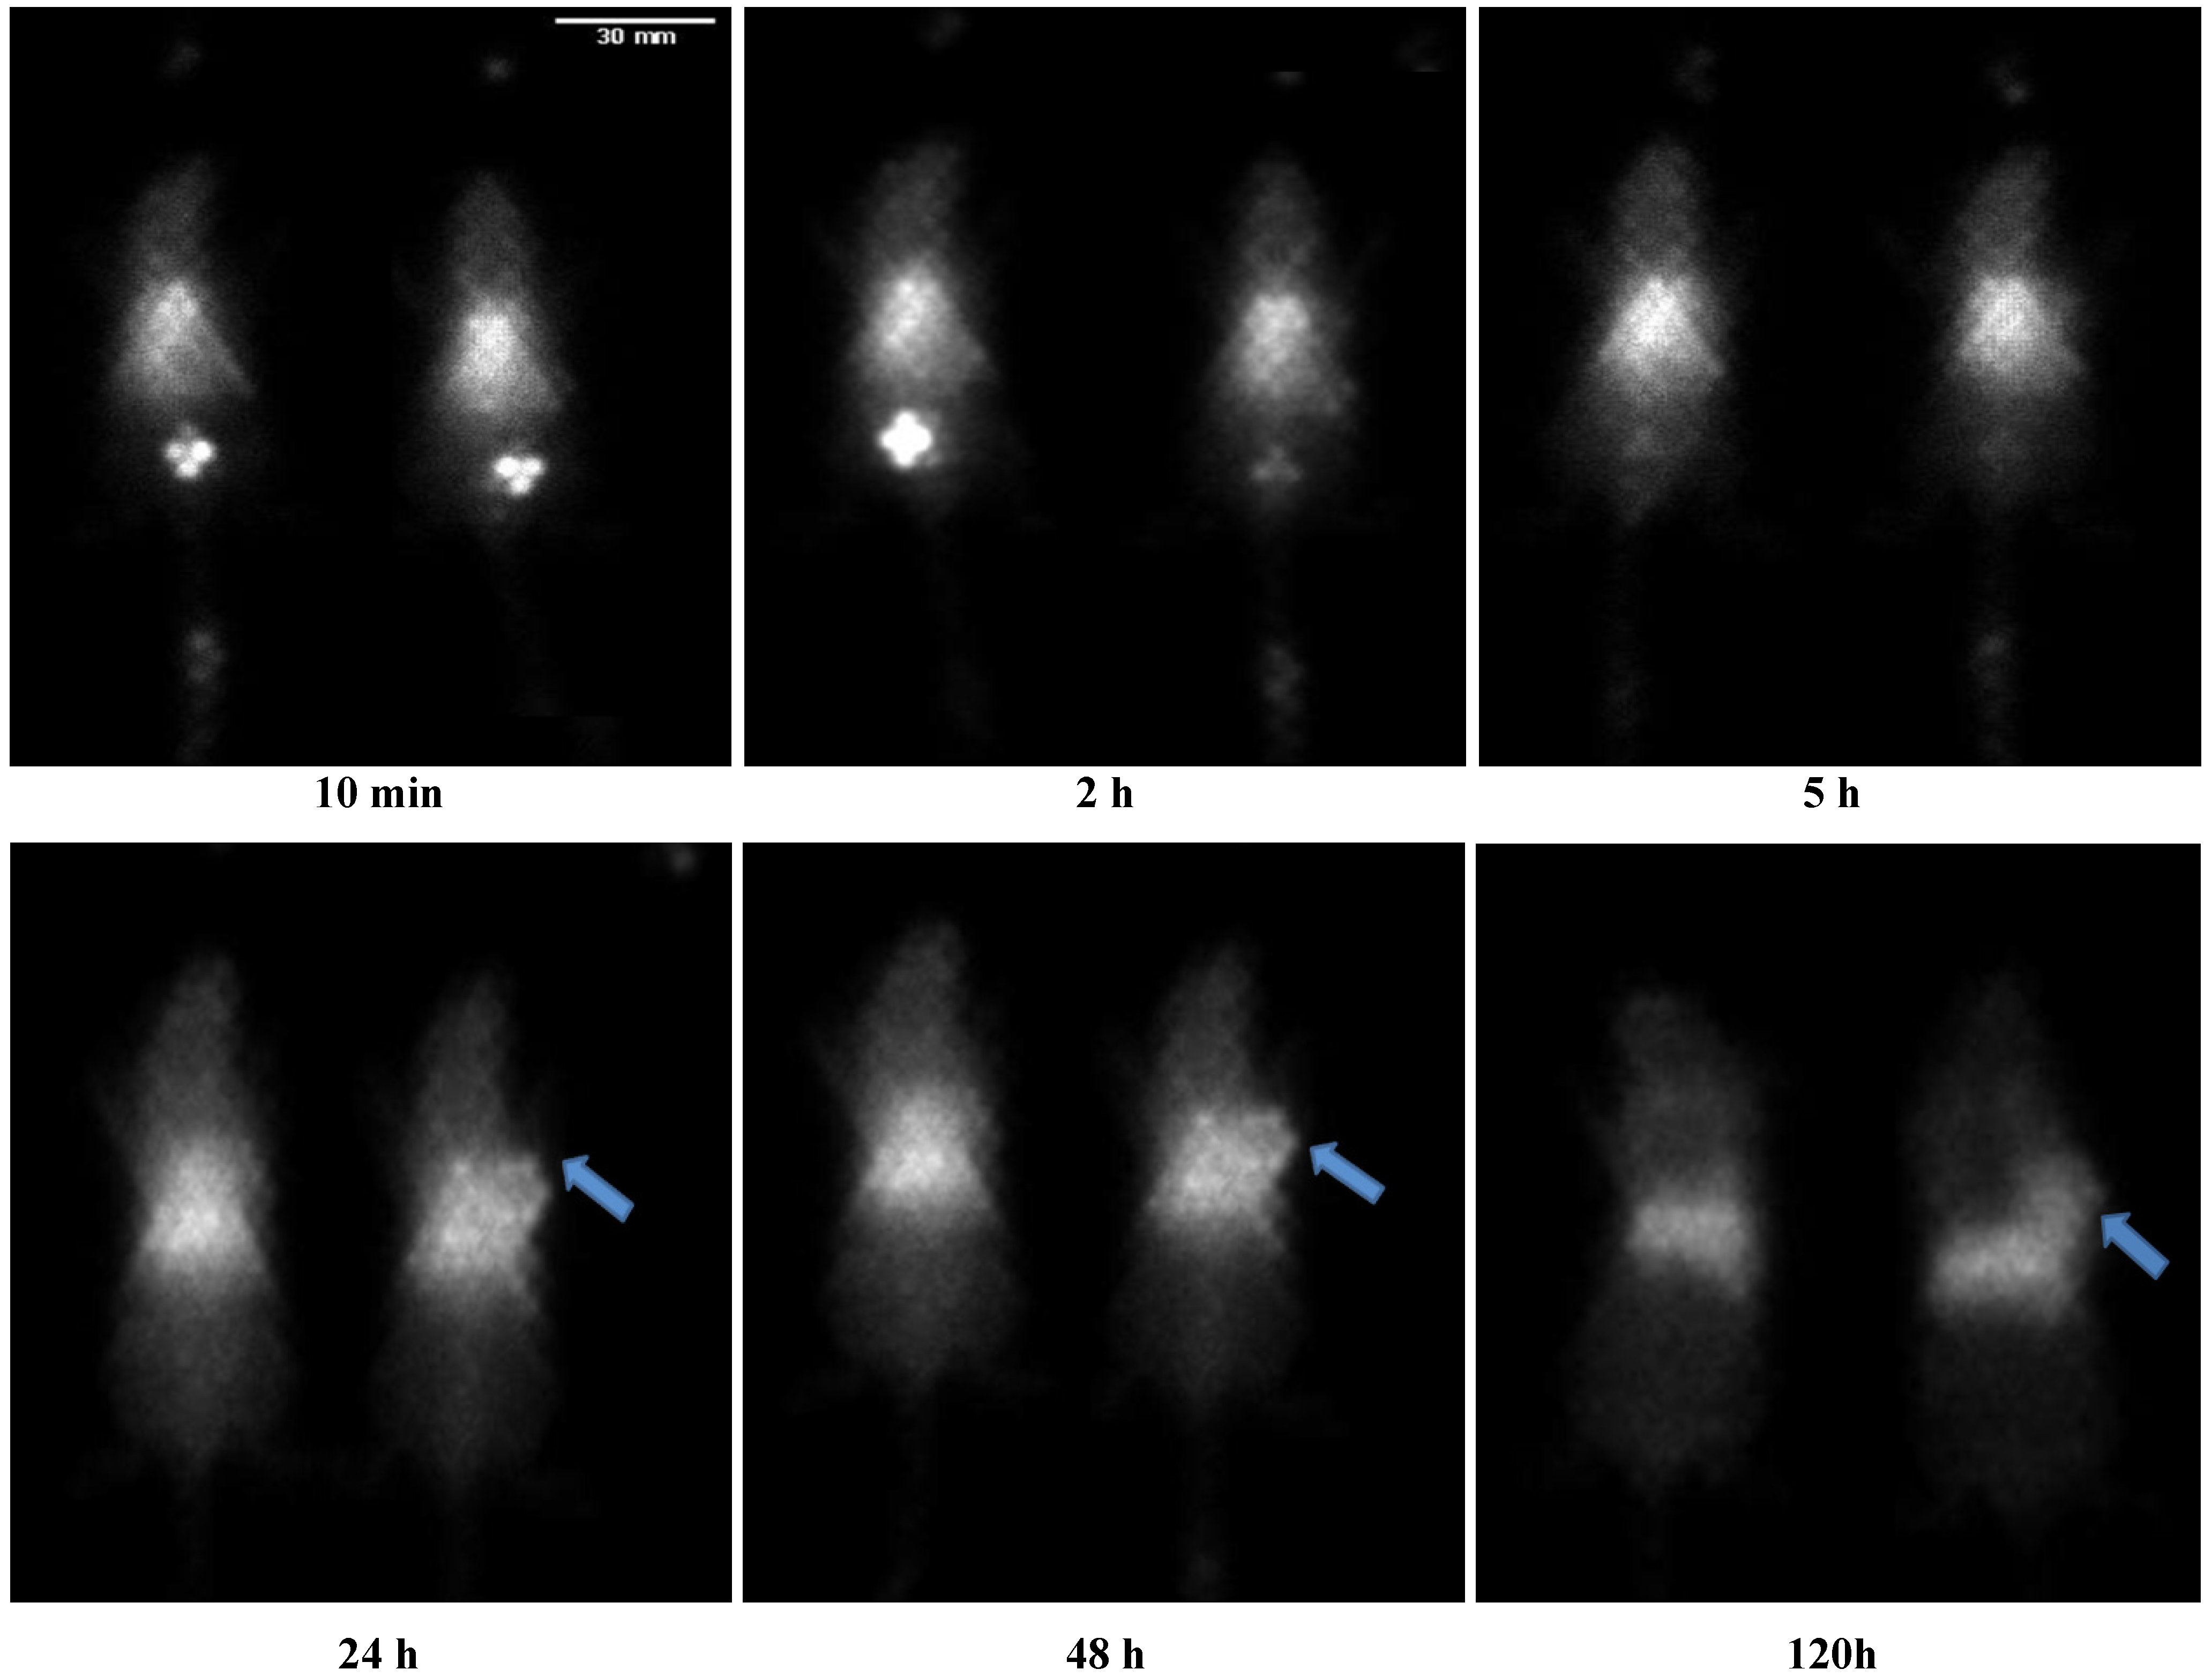
2.5. In Vivo Gamma Imaging

Figure 6 shows the representative gamma images obtained at various time points after injection of 111In-DTPA-NIRF-CCPM (300µCi/2.6 × 1014particles/mouse) and 111In-DG-CCPM (300µCi/4 × 1013 particles/mouse). Both nanoparticles exhibited sustained blood pool activity, prominent and persistent accumulation in the liver and the spleen for up to 120 h, and gradual accumulation in the tumor. The cardiac area was clearly seen up to 48 h post injection, reflecting a long blood circulation time for CCPMs. Uptake in the tumor was clearly visualized by 120 h post injection with γ-scintigraphy. Tumors in the mice received intravenous injection of 111In-DG-CCPM, but not in mice received 111In-DTPA-NIRF-CCPM, were visualized at later time points (24–72 h post injection) (Figure 6).
Figure 6. Representative gamma images of A 431 bearing nude mice at various times (left: 111In-DTPA-NIRF-CCPM; right: 111In-DG-CCPM). Arrows indicate the presence of tumors.
Molecules 18 06425 g006

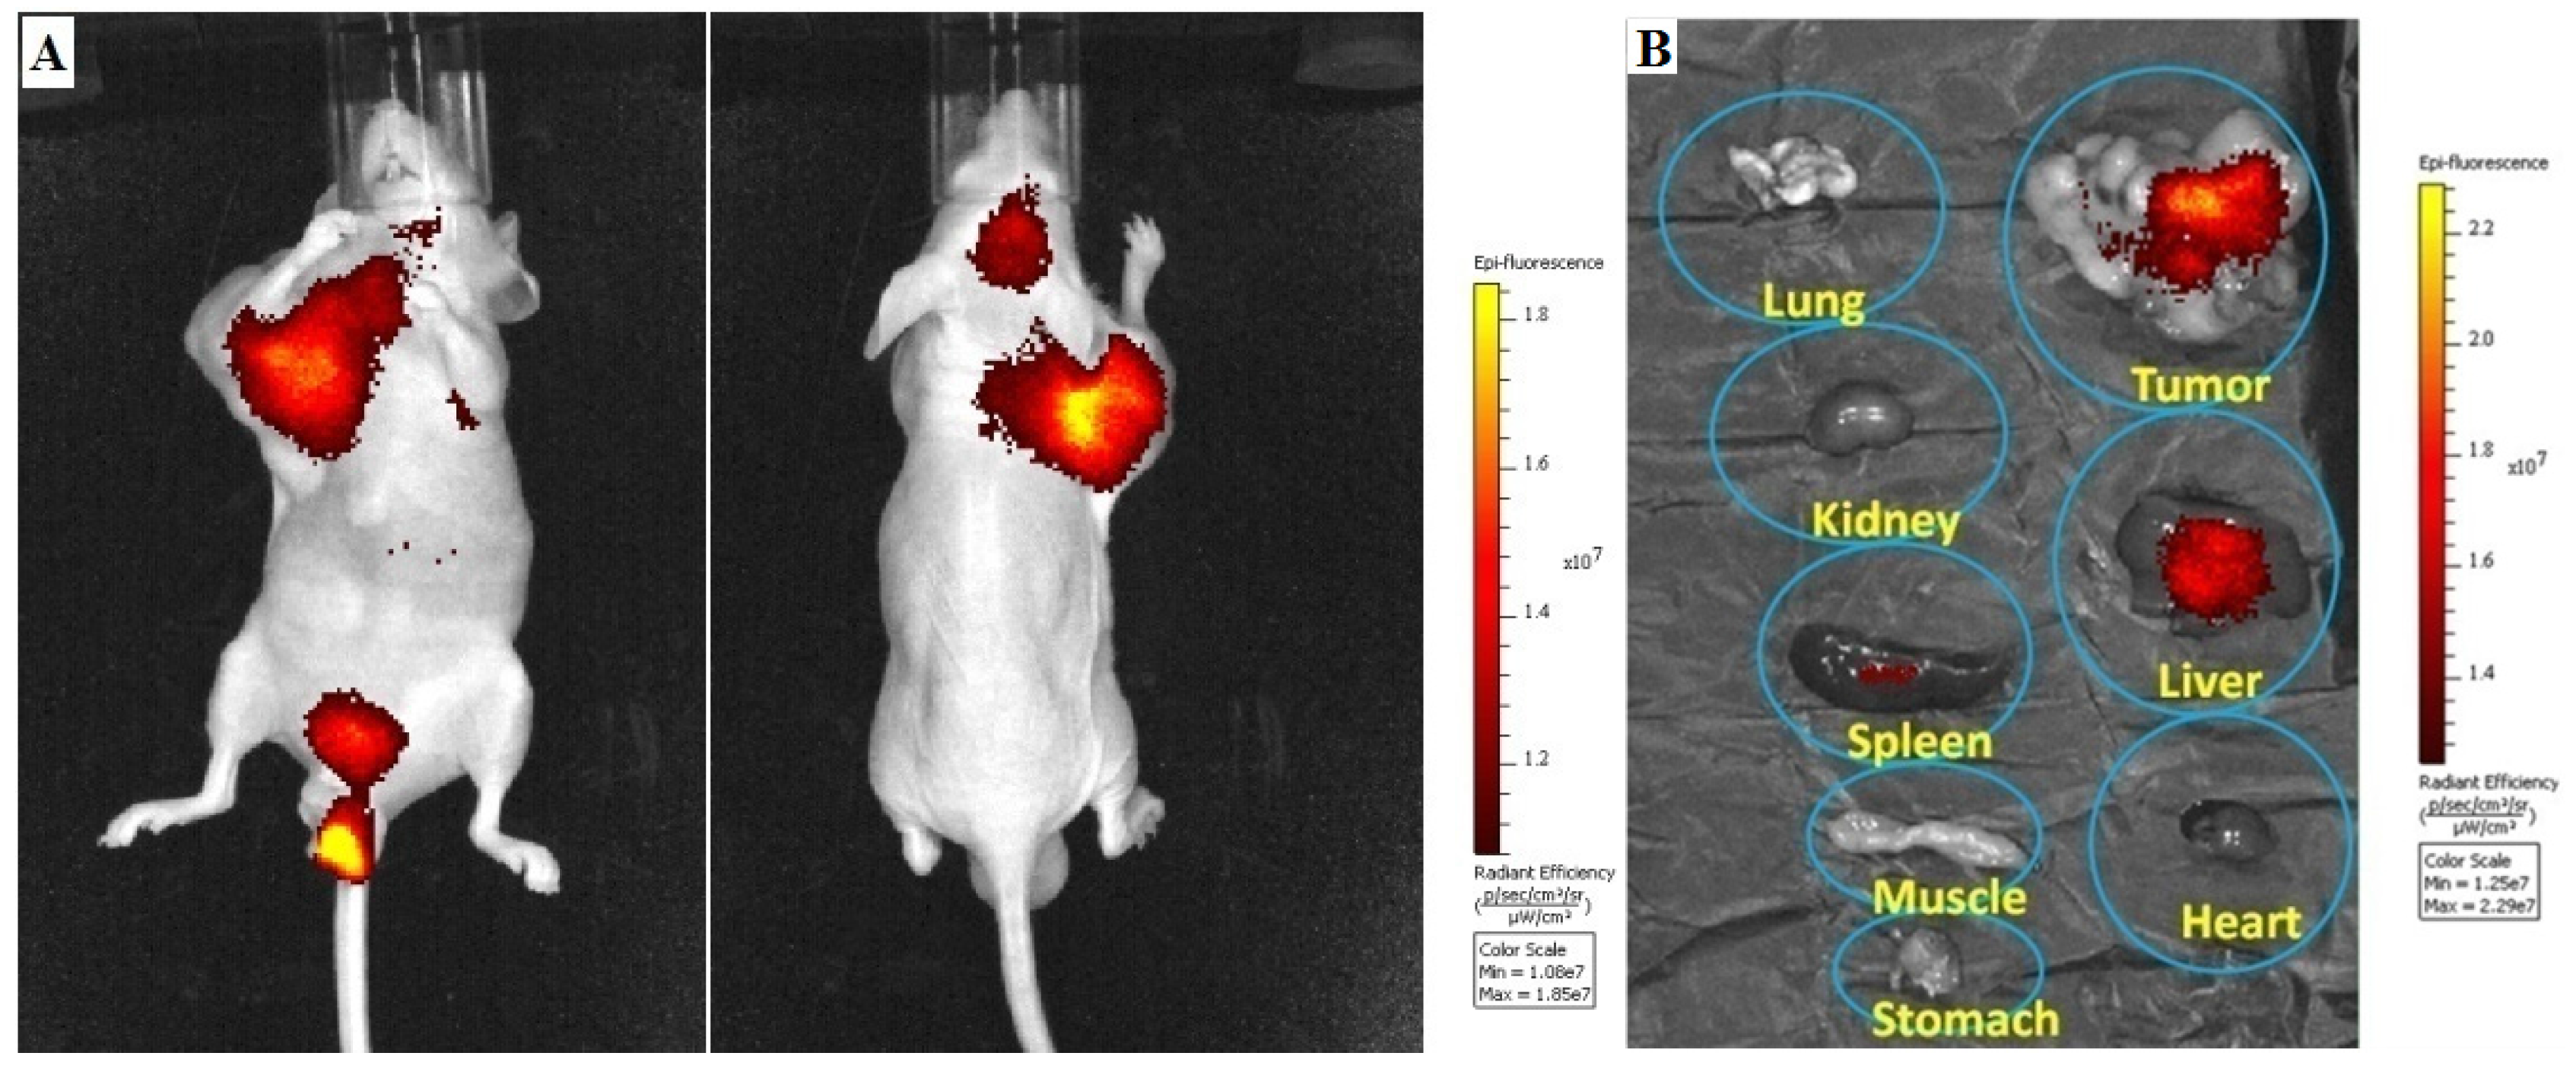
2.6. In vivo NIRF Imaging

The biodistribution of 111In-DG-CCPM (4 × 10¹³ particles) in A431-bearing mice was also determined by in and ex vivo analysis of the fluorescence signal intensities of excised tissues (Figure 7A,B). Accumulation of 111In-DG-CCPM nanoparticles in the tumor could be readily visualized with optical imaging (Figure 7A). In consistent with gamma imaging finding, the highest activity was found in the tumor, the liver and the spleen (Figure 7B). This indicates that glyco-CCPM nanoparticles displayed a strong and persistent fluorescence signal in vivo. Clearly, nuclear imaging and NIRF optical imaging techniques provided complementary information.
Figure 7. (A) Representative NIRF images of A 431 bearing nude mice at 120 h after intravenous injection of 111In-DG-CCPM. (B) Representative NIRF images of various excised tissues from a mouse received 111In-DG-CCPM at the end of the imaging sessions (120 h post-injection).
Molecules 18 06425 g007
Although our biodistribution data do not support active targeting of DG-CCPM to A431 tumors at 24 h after injection, the imaging data appears to show better tumor delineation with 111In-DG-CCPM than with 111In-DTPA-NIRF-CCPM at 24–72 h post injection. One possible explanation is the relatively small size of DG (MW = 278 Dalton), which could be easily masked by much larger PEG chains on nanoparticles’ surface. Our finding in the current study differs from that of an earlier report which did validate active targeting when the same NIRF-CCPM was used but with a different targeting ligand. In that study, the targeting ligand is annexin V, which has a molecular weight of ~35,000 Dalton [21]. Larger ligand relative to CCPM may be less prone to the masking effect of PEG. Another possibility is heterogeneous intratumoral distribution of 111In-DG-CCPM, which could lead to insignificant change in tumor uptake value because the radioactivity counting method averages out contribution from the entire tumor mass. Although our data do not conclusively support active targeting with 111In-DG-CCPM, these data provide valuable insight that may help design better ligand-CCPM conjugate for targeted nanoparticle delivery.

3. Experimental

3.1. General

D-Glucosamine (DG), sodium acetate (NaOAc), phosphate-buffered saline (PBS), N-methyl-morpholine (NMM), succinic anhydride (SA) was purchased from Sigma-Aldrich (St. Louis, MO, USA). 2-(4-Isothiocyanatobenzyl)-diethylenetriamine-pentaacetic acid (NCS-Bz-DTPA) was purchased from Macrocyclics (Dallas, TX, USA). 111InCl3 was obtained from Iso-Tex Diagnostics (Houston, TX, USA). Other commercial chemicals were purchased from VWR International (San Diego, CA, USA). All reagents were analyzed before use. Particle size was measured using dynamic light scattering with a Malvern ZetaSizer Nano-ZS system (Malvern Instruments Ltd., Worcestershire, UK). Zeta potential was determined using a ZetaPlus Analyzer (Brookhaven Instruments Corp., Holtsville, NY, USA).
1H-NMR spectra were recorded on a Varian XL-300 spectrometer (Varian, Inc., Palo Alto, CA, USA) operating at 300 MHz with tetramethylsilane (TMS) as an internal standard. The samples were separated using two 7.5 × 300 mm PLgel mixed-Columns’ (Polymer Laboratories, Amherst, MA, USA) eluted with1,1,1,3,3,3-hexafluoroisopropanol containing 0.01 M tetraethyl ammonium nitrate at a flow rate of 1.0 mL/min. Instant thin-layer chromatograms were recorded using a Bioscan scanner (Bioscan, IAR-2000, Washington, DC, USA). Radioactivity was counted using an automated gamma scintillation counter (Perkin Elmer, 1470-002, Boston, MA, USA). High performance liquid chromatography (HPLC) was performed using a Dionex P680 system equipped with a tunable absorption detector and a PDA-100 photodiode-array detector using a Hypersil BDS C-18 reversed-phase column (5 μm, 250 mm × 4.6 mm). The column was eluted with 0.1%TFA in H2O (solvent A) and 0.1%TFA in acetonitrile (solvent B). The eluting conditions were as follow: Solvent B: 0%~10% from 0–5 min, Solvent B: 10%~50% from 5–8 min, Solvent B: 50%~80% from 8–10 min, and Solvent B: 80%~10% from10–12 min.

3.2. Synthesis and Characterization of DG-CCPM

3.2.1. Synthesis of d-Glucosamine-NH-SA

d-Glucosamine-NH-SA (DG-COOH) was synthesized by treating commercially available d-Glucosamine hydrochloride with succinic anhydride using NMM as a base. Briefly, succinic anhydride (1.0 mmol) and NMM (0.2 mL) were added to a solution of d-Glucosamine hydrochloride (1.0 mmol) in 10 mL of dimethylformamide (DMF)/H2O (9/1, v/v). The mixture was stirred at ambient temperature for 12 h. After evaporation of the solvents under vacuum, the residue was washed with ether. Residue was dissolved in water and purified by HPLC to yield a white powder.

3.2.2. Conjugation of DG-COOH to CCPM

DTPA-CCPM was synthesized according to previously reported procedures with some modification (Scheme 1) [7]. An aqueous solution of CCPM nanoparticles (2 mL, 2 mg dry weight/mL of water) was placed in an amber vial. The pH of the solution was adjusted to 7.5 using 2% sodium bicarbonate solution. NCS-Bz-DTPA (0.013 mg, 1.54 × 10⁻³ M in PBS) was added to the vial. The reaction was stirred under nitrogen overnight. Unreacted NCS-Bz-DTPA was removed by centrifugal filtration using a membrane with a molecular weight cutoff of 30, 000. The unreacted NCS-Bz-DTPA was quantified by capillary electrophoresis. Approximately 70% of the DTPA used was attached to the particles.
To couple DG-COOH to the primary amines on the surface of CCPM, DG-COOH (17.0 mg in 2.0 mL 0.1 M PBS) was allowed to react with EDC (50 µL 2.232 mg/mL) at room temperature (RT) for 30 min. Then 0.5 mL CCPM (1.54 × 10¹⁵ particles/mL) was added and the reaction mixture was stirred at RT overnight. The molar ration between amine groups in CCPM and DG-COOH was 1:3. The reaction mixture was purified with PD-10 column, which was eluted with 0.01 M PBS (pH7.4). The amount of amines before and after treatment with DG-COOH was were determined by 2,4,6-trinitrobenzenessulfonate (TNBS) assay.
Scheme 1. Synthetic strategy of DG-CCPM.
Molecules 18 06425 g008

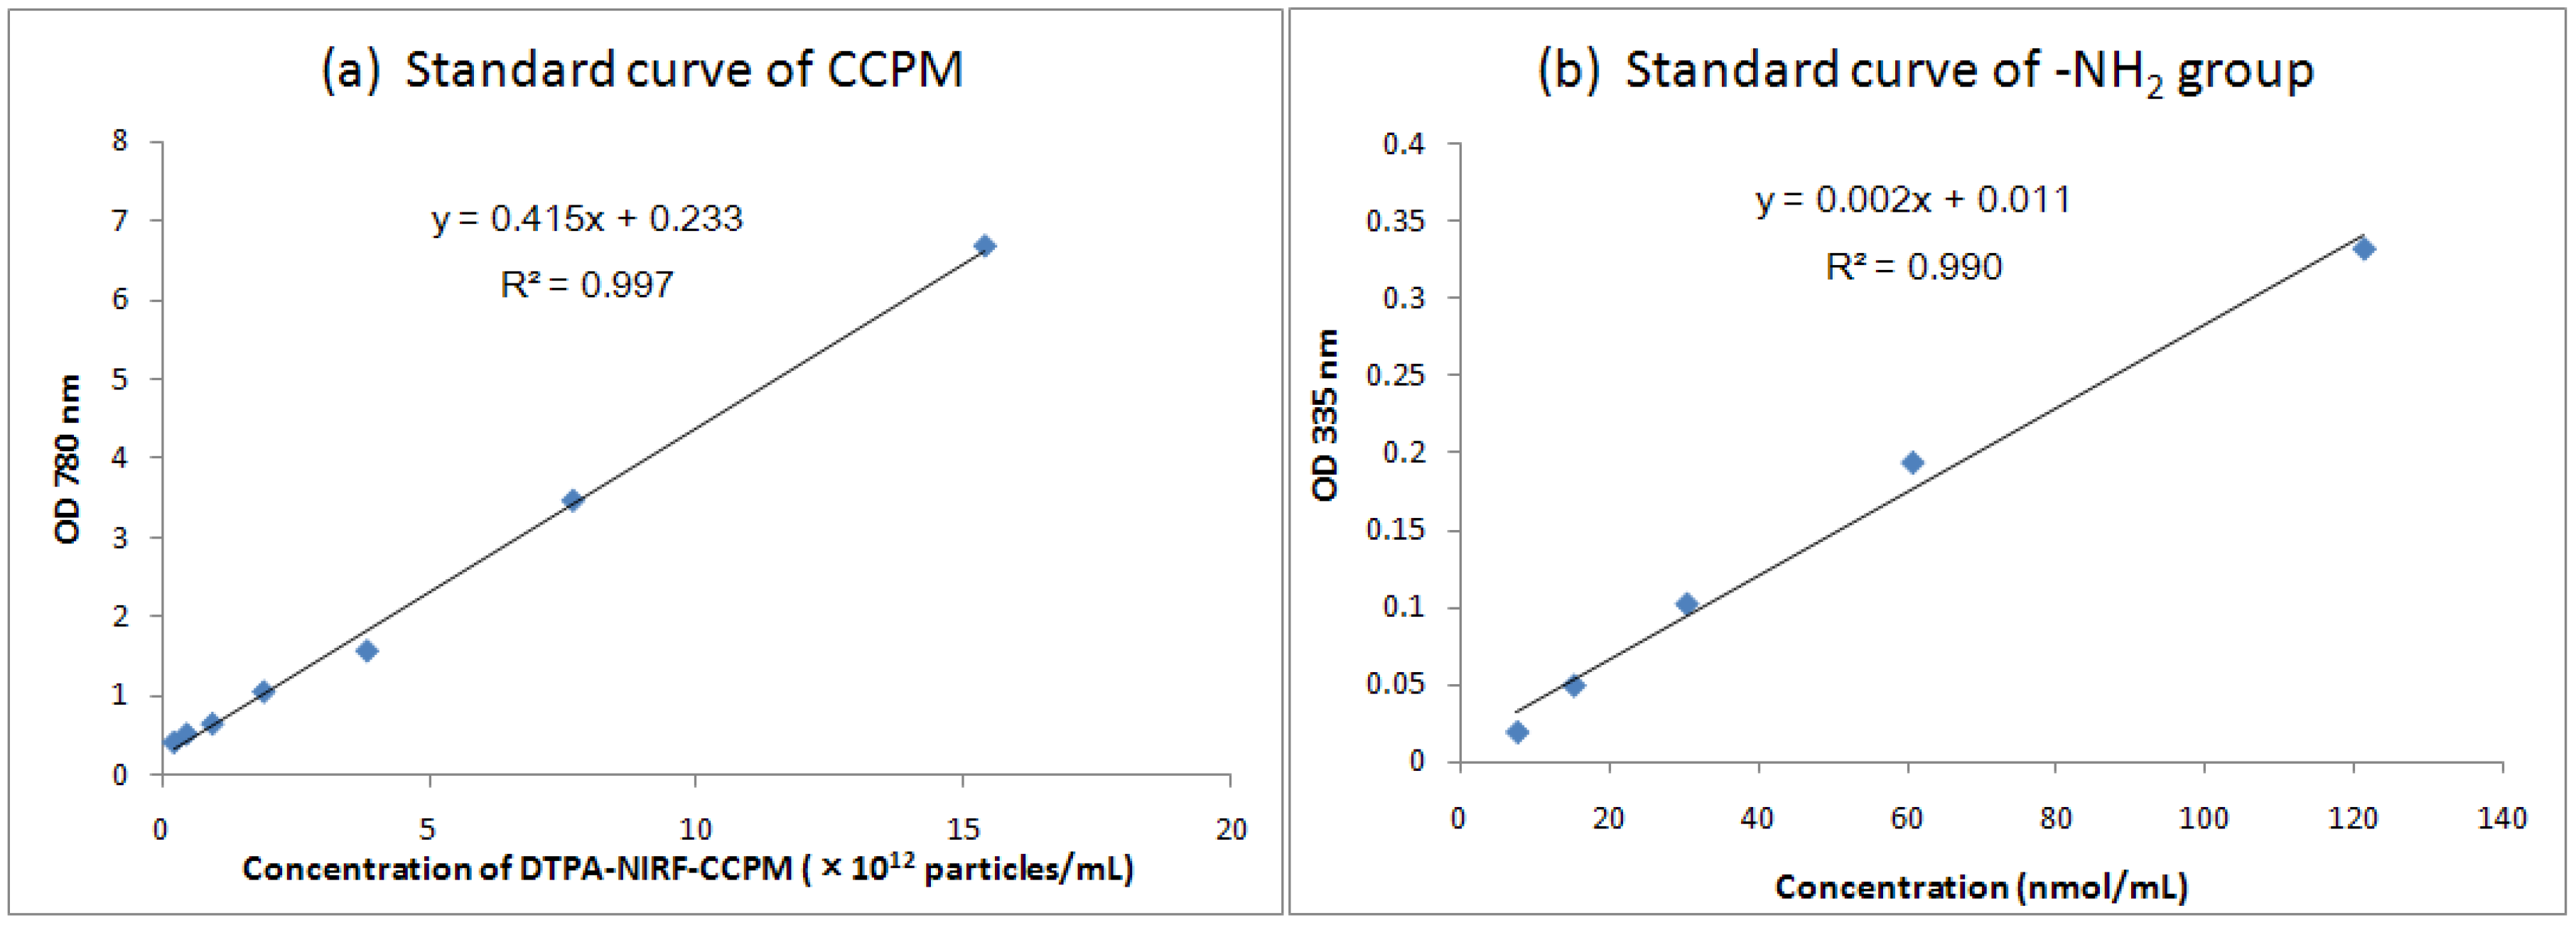
3.2.3. Standard Curves of DTPA-NIRF-CCPM

The concentration of DTPA-NIRF-CCPM nanoparticles was quantified by comparing UV-Vis absorption at 780 nm with a standard curve. DTPA-NIRF-CCPM in 0.01 M pH 7.4 PBS was serially diluted with PBS to obtain concentrations ranging from 15.4 × 10¹²/mL to 2.4 × 10¹¹/mL, and their UV/Vis spectra measured with a UV-Vis spectrometer.
2,4,6-Trinitrobenzenesulfonate (TNBS) was used to quantify the number of primary amines in CCPM. Briefly, 0.5 mL TNBS in 0.1 M pH 8.5 sodium bicarbonate (0.01%, w/v) was added to each 1 mL solution of phenylalanine standard in NaHCO3 buffer ranging from 2 to 20 μg/mL. The mixtures were then incubate at 37 °C for 2 h, followed by addition of 0.5 mL of 10% sodium dodecyl sulfate (SDS) and 0.25 mL of 1 M HCl to each sample. The absorbance of the solutions was measured with UV/Vis spectrometer at 335 nm.

3.3. Radiolabeling

The radiolabeling of DG-CCPM was shown in Scheme 2. Into 0.2 mL aqueous solution of DG-CCPM containing 6.5 × 10¹³ particles was added 10 µL 1M pH 5.2 NaOAc buffer, 40Μl 111InCl3(520µCi).
Scheme 2. 111InCl3radio-labeling DG-CCPM.
Molecules 18 06425 g009
The mixture was allowed to stand at RT for 30 min. Radiolabeled nanoparticles were analyzed using a thin layer chromatography (radio-TLC) system. The Radio-TLC strips were developed with 0.01 M PBS (pH 7.4) containing 4 mM EDTA and quantified using a Bioscan IAR-2000 TLC Imaging Scanner (Washington, DC, USA). Free 111In3+ moved to the solvent front (Rf~0.9), and the nanoparticles remained at the original (Rf~0.0). The labeling efficiency for DG-CCPM was >96%. The radiochemical purity was > 96%. DTPA-NIRF-CCPM was labeled with111Inas a control using similar procedures.

3.4. Fluorescence Microscopy Study

Binding of NIRF-CCPM and DG-CCPM to tumor cells was studied using a human epithelial carcinoma A431 cell line. Cells were incubated with NIRF-CCPM (1.54 × 10¹⁵ particles/mL) and DG-CCPM (3.4 × 10¹⁴ particles/mL) at 37 °C on cover slips in a 24-well plate (Becton Dickinson Labware, Franklin Lakes, NJ, USA). Each well contained 0.5 ml of Dulbecco’s modified Eagle’s medium/nutrient mixture F-12 Ham (DMEM/F12) containing 10% fetal bovine serum (Gibco, Grand Island, NY). The final concentration of the NIRF-CCPM and DG-CCPM were calculated on the basis of the standard curve. Cells were washed twice with PBS at the end of incubation (2 h or 4 h) and fixed in 95% ethyl alcohol. Data were recorded using a Leica DMR microscope (Leica Microsystems, Bannockburn, IL, USA) equipped with a 75W xenon lamp (750 nm excitation, Chroma Technology, Brattleboro, VT, USA), a Hamamatsu B/W Chilled CCD camera (Hamamatsu Photonics K.K., Hamamatsu City, Japan) and Image-Pro Plus 4.5.1 software (Media Cybernetics, L.P., Silver Spring, MD, USA).

3.5. Biodistribution Studies

All animal studies were approved by Institutional Animal Care and Use Committee (IACUC), and were handled and maintained according to IACUC guidelines. The mice were kept under specific pathogen free conditions. A-431 tumor cells were inoculated subcutaneously in the right thigh of nude mice (20–25 g; Harlan Sprague Dawley, Inc., Indianapolis, IN, USA) by injecting 1 × 10⁶ viable tumor cells in suspension in PBS. When tumors had grown to 8–12 mm in average diameter, mice were randomly allocated into 3 groups, with each group consisting of three mice. Mice in group 1 and 2 were injected with 111In-DG-CCPM and were euthanized at 4 h and 24 h after injection, respectively. Mice in group 3 were injected with 111In-DTPA-NIRF-CCPMand were euthanized at 24 h after injection. Mice in each group were injected intravenously with 111In-labeled DG-CCPM at a dose of 1.3 × 10¹² particles/mouse (10 μCi/mouse). Animals were euthanized by CO2 exposure 48 h after injection. Blood, lung, muscle, spleen, kidney, liver, and tumor tissues were removed, weighed, and counted for radioactivity with a Packard Cobra gamma counter (Downers Grove, IL, USA). Uptakes of nanoparticles in various tissues were calculated as the percentage of the injected dose per gram of tissue (%ID/g).

3.6. In Vivo Gamma Imaging

Nude mice bearing subcutaneous A431 tumors on their upper arm, in two groups of three mice each, were injected intravenously with either 111In-DG-CCPM or 111In-DTPA-NIRF-CCPMat a dose of 300µCi/4 × 1013 particles/mouse. For gamma imaging, mice were placed in the anterior position. Prior to imaging, mice were anesthetized with 2% isoflurane gas (Iso-Thesia, Rockville, NY, USA) in oxygen. During imaging, mice were maintained in an anesthetized state with 0.5%–1.5% isofluranein oxygen. gamma images were acquired using an M-Camgamma camera equipped with medium-energy collimatorand ICON software (Siemens, Hoffman Estates, IL, USA). Images were acquired with the following parameters: matrix: 512 pixels × 512 pixels; zoom: 3.20; energy peak: 247 keV (15%) and 172 keV (15%); total counts: 500 k.

3.7. In Vivo NIRF Imaging

Whole-body optical imaging was done at various time points up to 120 h after injection using Xenogen—IVIS ® Lumina II imaging system (Hopkinton, MA, USA).The field of view was 12.5 cm in diameter. For ex vivo imaging, each organ resected at the end of the imaging study (120 h after injection) were imaged with ICG filter sets (excitation, 745 nm; emission, 810–875 nm). The camera settings included CCD Size 1.3 × 1.3 cm, 1024pixel × 1024pixel resolution, 13 microns pixel size and an exposure time of 1.0 s.

3.8. Statistical Analysis

Biodistribution data were analyzed using two-tailed, unpaired Student's t tests, with p < 0.05 considered to be statistically significant. The in vitro percentage in vivo percentage of injected dose per gram (%ID/g) of wet tissue weight, and tumor-to-normal tissue ratios are presented as means ± standard errors of the means. All statistical computations were processed by using a computer software program (Excel; Microsoft, Redmond, WA, USA).

4. Conclusions

We successfully synthesized novel glyco-nanoparticles DG-CCPM.It was labeled with 111In through radiometal chelator diethylentriaminepentaaceticacid (DTPA) with high radiolableing efficiency. There were no significant differences with respect to tumor-to-normal tissue uptake ratios between 111In-DG-CCPM and its corresponding control 111In-DTPA-NIRF-CCPM at 4 h and 24 h post injection. However, both nuclear imaging and optical imaging delineated tumor only in mice injected with 111In-DG-CCPM at later time points (24–72 h post injection). Further studies to compare the pharmacokinetics and to validate specific tumor uptake of 111In-DG-CCPM are needed in order to understand the behaviors of ligand-conjugated CCPM as a platform for targeted delivery of nanoparticles for dual nuclear/NIRF fluorescence imaging.

Acknowledgments

This work was supported by National Natural Science Foundation of China (No. 81071198, No. 81172082) and Beijing Natural Science Foundation (No.7132040). Peking University Cancer Hospital & Institute Research Foundation (2013 ZiZhu 12).

Conflicts of Interest

The authors declare no conflict of interest.

References

  1. Ntziachristos, V.; Bremer, C.; Weissleder, R. Fluorescence imaging withnear-infrared light: New technological advances that enable in vivo molecular imaging. Eur. Radiol. 2003, 13, 195–208. [Google Scholar]
  2. Gurfinkel, M.; Ke, S.; Wen, X.; Li, C.; Sevick-Muraca, E.M. Near-infrared fluorescence optical imaging and tomography. Dis. Markers 2003, 19, 107–121. [Google Scholar]
  3. Matsumura, Y.; Maeda, H. A new concept for macromolecular therapeutics in cancer chemotherapy: Mechanism of tumor itropic accumulation of proteins and the antitumor agent smancs. Cancer Res. 1986, 46, 6387–6392. [Google Scholar]
  4. Torchilin, V.P. Targeted pharmaceutical nano carriers for cancer therapy and imaging. AAPS J. 2007, 9, E128–E147. [Google Scholar]
  5. Moore, A.; Medarova, Z.; Potthast, A.; Dai, G. In Vivo targeting of underglycosylatedmuc-1 tumor antigen using a multimodal imaging probe. Cancer Res. 2004, 64, 1821–1827. [Google Scholar] [CrossRef]
  6. Lisy, M.R.; Hartung, A.; Lang, C.; Schuler, D.; Richter, W.; Reichenbach, J.R.; Kaiser, W.A.; Hilger, I. Fluorescent bacterial magnetic nanoparticles as bimodal contrast agents. Invest. Radiol. 2007, 42, 235–241. [Google Scholar] [CrossRef]
  7. Zheng, S.Y.; Harrison, W.J.; Harder, J.; Wen, X.X.; Gelovani, J.G.; Qiao, A.; Li, C. Long-circulating near-infrared fluorescence core-cross-linked polymeric micelles: Synthesis, Characterization, and dual nuclear/optical imaging. Biomacromolecules 2007, 8, 3422–3428. [Google Scholar]
  8. Yang, Z.; Leon, J.; Martin, M.; Harder, J.W.; Zhang, R.; Liang, D.; Lu, W.; Tian, M.; Gelovani, J.G.; Qiao, A.; Li, C. Pharmacokinetics and bioredistribution of near-infrared fluorescent polymeric nanoparticles. Nanotechnology 2009, 20, 165101. [Google Scholar] [CrossRef]
  9. Torchilin, V.P. Structure and design of polymeric surfactant-based drug delivery systems. J. Controlled Release 2001, 73, 137–172. [Google Scholar]
  10. Marradi, M.; Martín-Lomas, M.; Penadés, S. Glyconanoparticles polyvalent tools to study carbohydrate-based interactions. Adv. Carbohydr. Chem. Biochem. 2010, 64, 211–290. [Google Scholar] [CrossRef]
  11. EI-Boubbou, K.; Huang, X. Glyco-nanomaterials: translating insights from the “sugar-code” to biomedical applications. Curr. Med. Chem. 2011, 18, 2060–2078. [Google Scholar] [CrossRef]
  12. Gamblin, D.P.; Scanlan, E.M.; Davis, B.G. Glycoprotein synthesis: an update. Chem. Rev. 2009, 109, 131–163. [Google Scholar] [CrossRef]
  13. Gorityala, B.K.; Lu, Z.; Leow, M.L.; Ma, J.; Liu, X.W. Design of a “turn-off/turn-on” biosensor: Understanding carbohydrate-lectin interactions for use in noncovalent drug delivery. J. Am. Chem. Soc. 2012, 134, 15229–15232. [Google Scholar]
  14. Yang, Z.; Zhu, H. Synthesis and Revaluation of New nuclides Ga-68 Labeled D-Glucose for Potential PET imaging agent. Acta Chim. Sinica 2012, 70, 1066–1072. [Google Scholar] [CrossRef]
  15. Yang, Z.; Xiong, C.Y.; Zhang, R.; Zhu, H.; Li, C. Synthesis and evaluation of 68Ga-labeled DOTA-2-deoxy-d-Glucosamine as a potential radiotracer in μPET imaging. Am. J. Nucl. Med. Mol. Imaging 2012, 2, 499–507. [Google Scholar]
  16. Yang, Z.; Zhu, H.; Lin, X.F. Synthesis and evaluation of 111In-labeled D-glucose as a potential SPECT imaging agent. J. Radioanal. Nucl. Chem. 2013, 295, 1371–1375. [Google Scholar]
  17. Habeeb, A.F.S.A. Determination of free amino groups in protein by trinitrobenzene sulfonic acid. Anal. Biochem. 1966, 14, 328–336. [Google Scholar] [CrossRef]
  18. Inman, J.K.; Dintzis, H.M. The derivatization of cross-linked polyacrylamide beads. Controlled introduction of functional groups for the preparation of special-purpose, biochemicaladsorbents. Biochemistry 1969, 8, 4047–4082. [Google Scholar]
  19. Sashidhar, R.B.; Capoor, A.K.; Ramana, P. Quantitation of ε-amino group using amino acidsas reference standards by trinitrobenzene sulfonic acid. J. Immunol. Meth. 1994, 167, 121–127. [Google Scholar] [CrossRef]
  20. Millon, S.R.; Ostrander, J.H.; Brown, J.Q.; Raheja, A.; Seewaldt, V.L.; Ramanujam, N. Uptake of 2-NBDG as a method to monitor therapy response in breast cancer cell lines. Breast Cancer Res. Treat. 2011, 126, 55–62. [Google Scholar]
  21. Zhang, R.; Lu, W.; Wen, X.X.; Huang, M.; Zhou, M.; Liang, D.; Li, C. Annexin V-conjugated polymeric micelles for multimodal detection of apoptosis. J. Nucl. Med. 2011, 52, 958–964. [Google Scholar]
  • Sample Availability: Samples of the compounds are available from the authors.

