Characterization of Flavonoids and Phenolic Acids in Myrcia bella Cambess. Using FIA-ESI-IT-MSn and HPLC-PAD-ESI-IT-MS Combined with NMR


Abstract
:1. Introduction
2. Results and Discussion
2.1. Identification of Constituents by Combination of NMR and FIA-ESI-IT-MS/MSn


| Peak (compound) | Rt (min) | UV-vis (λmáx.) | LC-MS ions | ESI-IT-MS/MSn ions | Identification | Mode of identification |
|---|---|---|---|---|---|---|
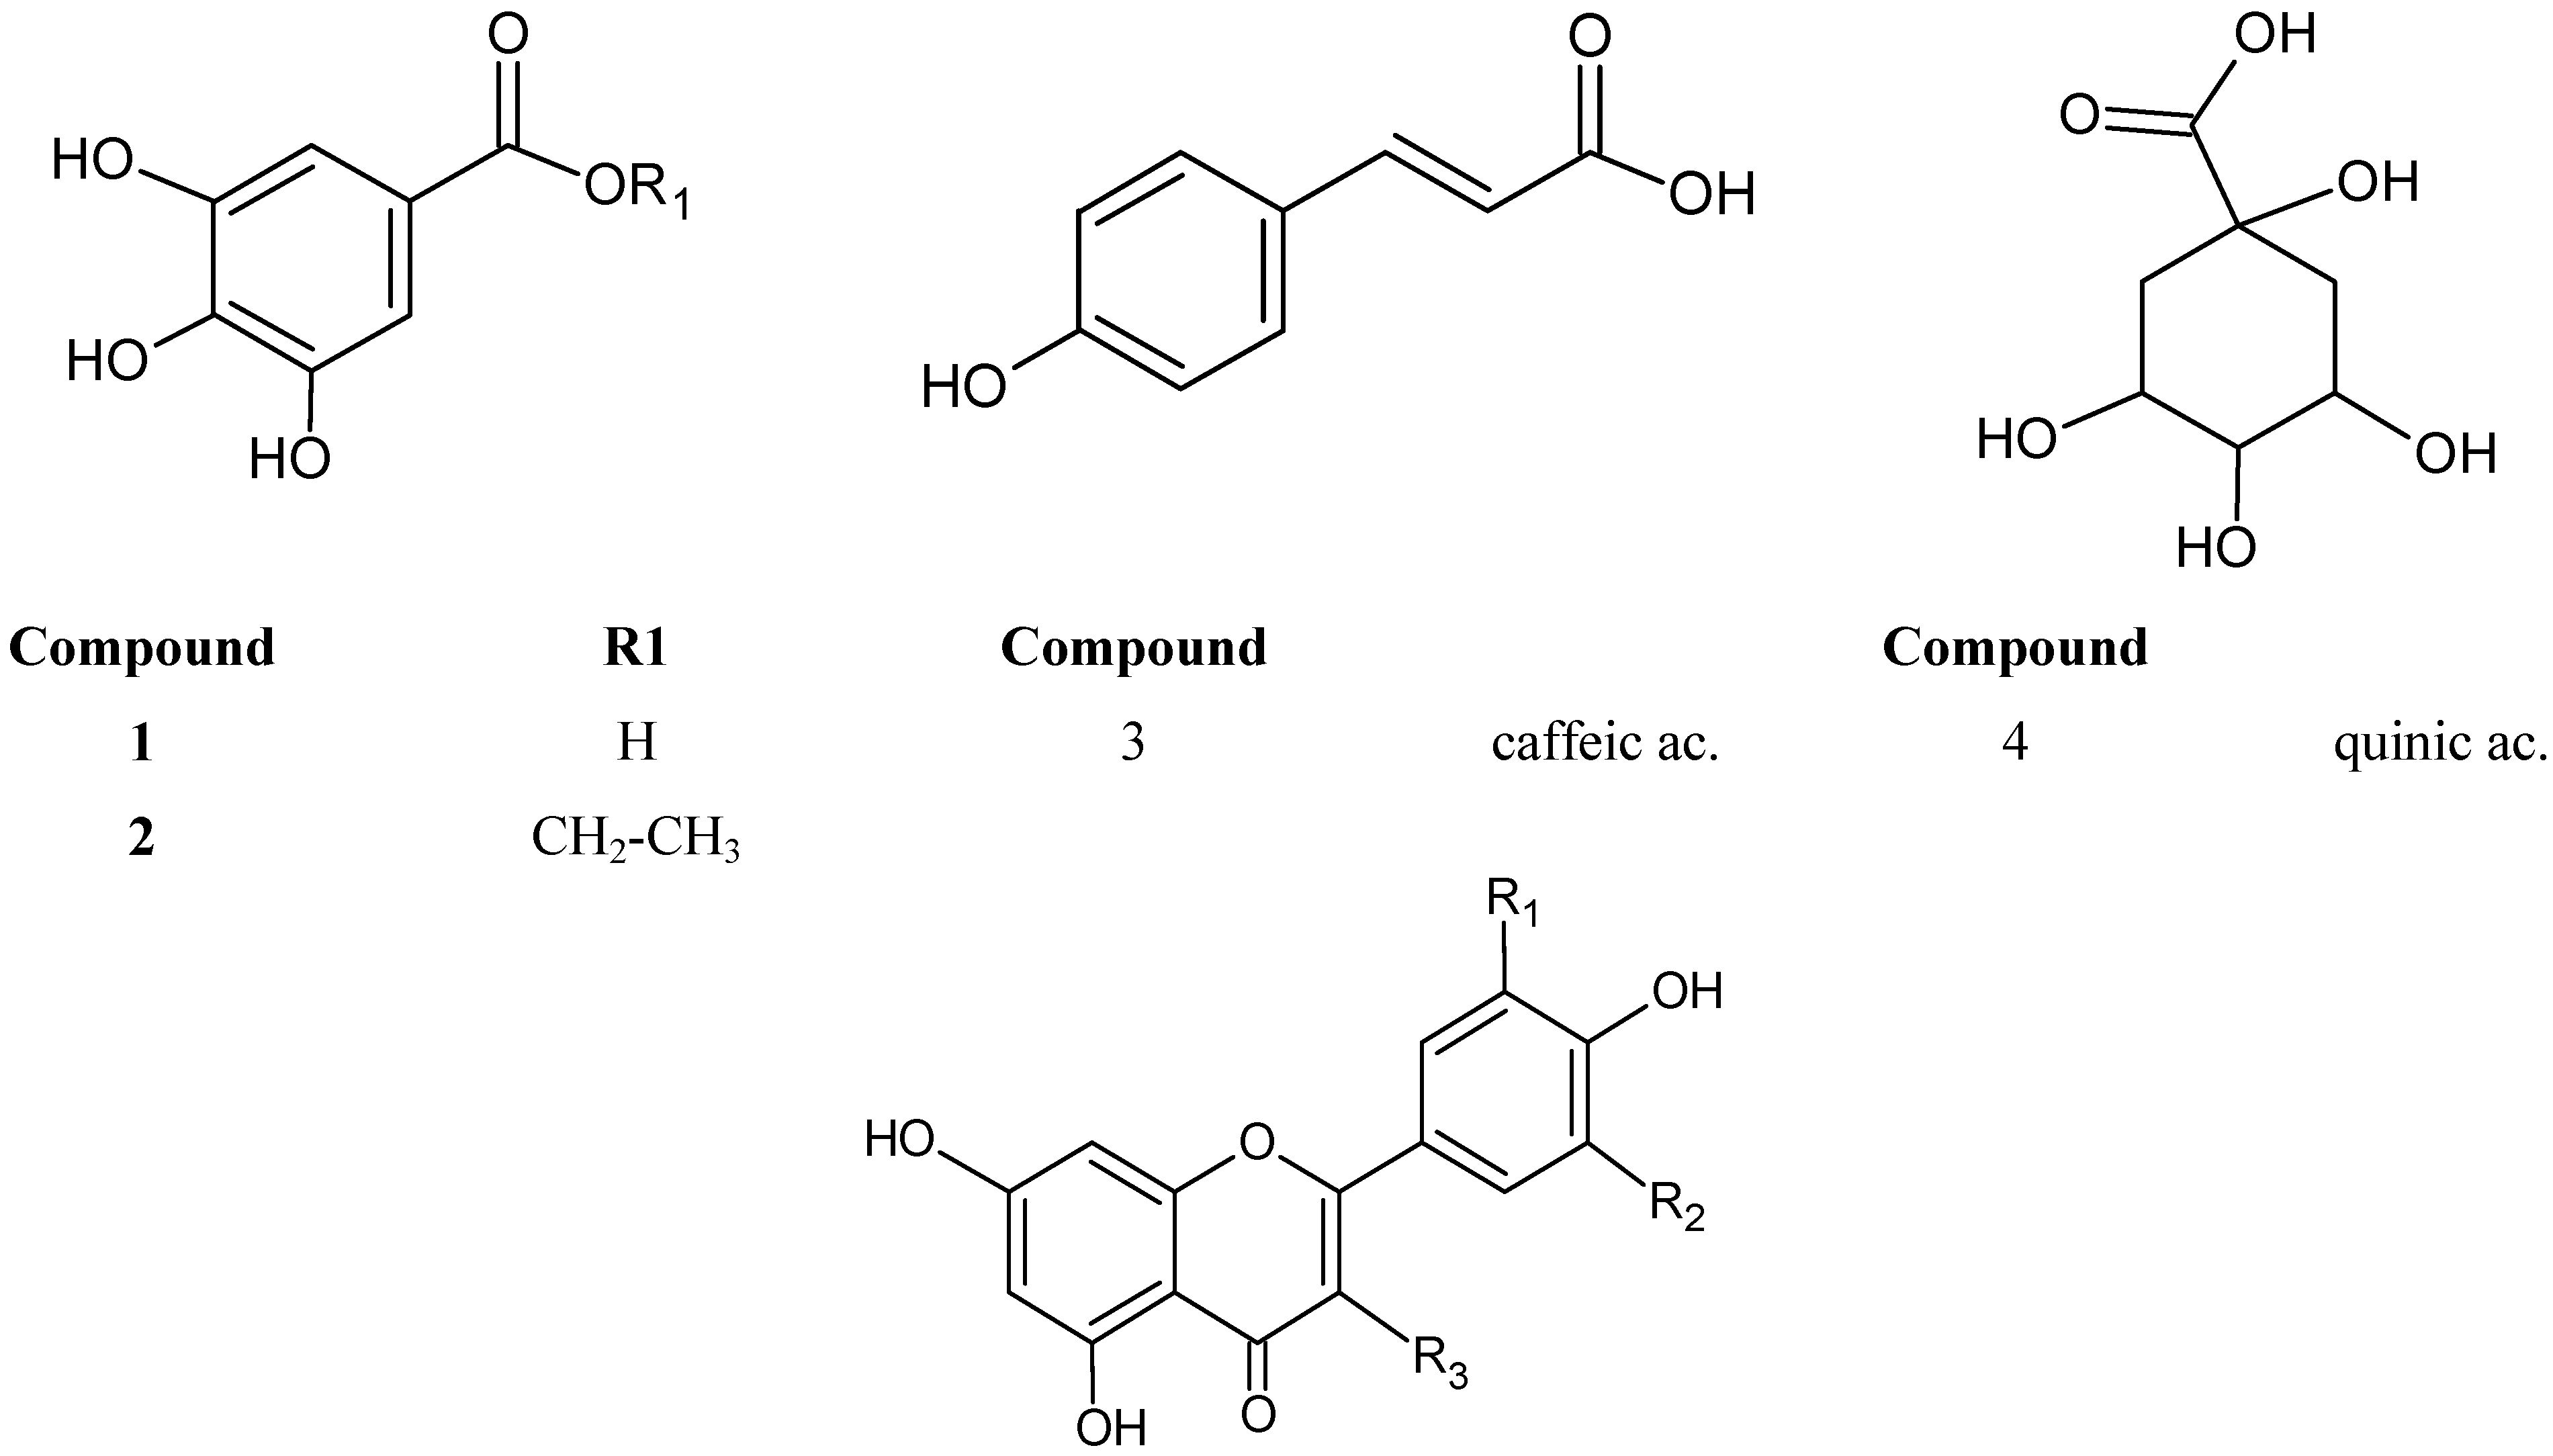
| 1(3) | 3.7 | -- | 179 | -- | caffeic ac. | UV/MS + std |
| 2(4) | 4.1 | -- | 191 | 191, 173, 127, 85 | quinic ac. | UV/MS+ std |
| 3 | 11.3 | 212, 278 | 633 | -- | n.i. | -- |
| 4 | 82.3 | 212, 272 | 635 | -- | n.i. | -- |
| 5 | 92.1 | -- | 469 | -- | n.i. | -- |
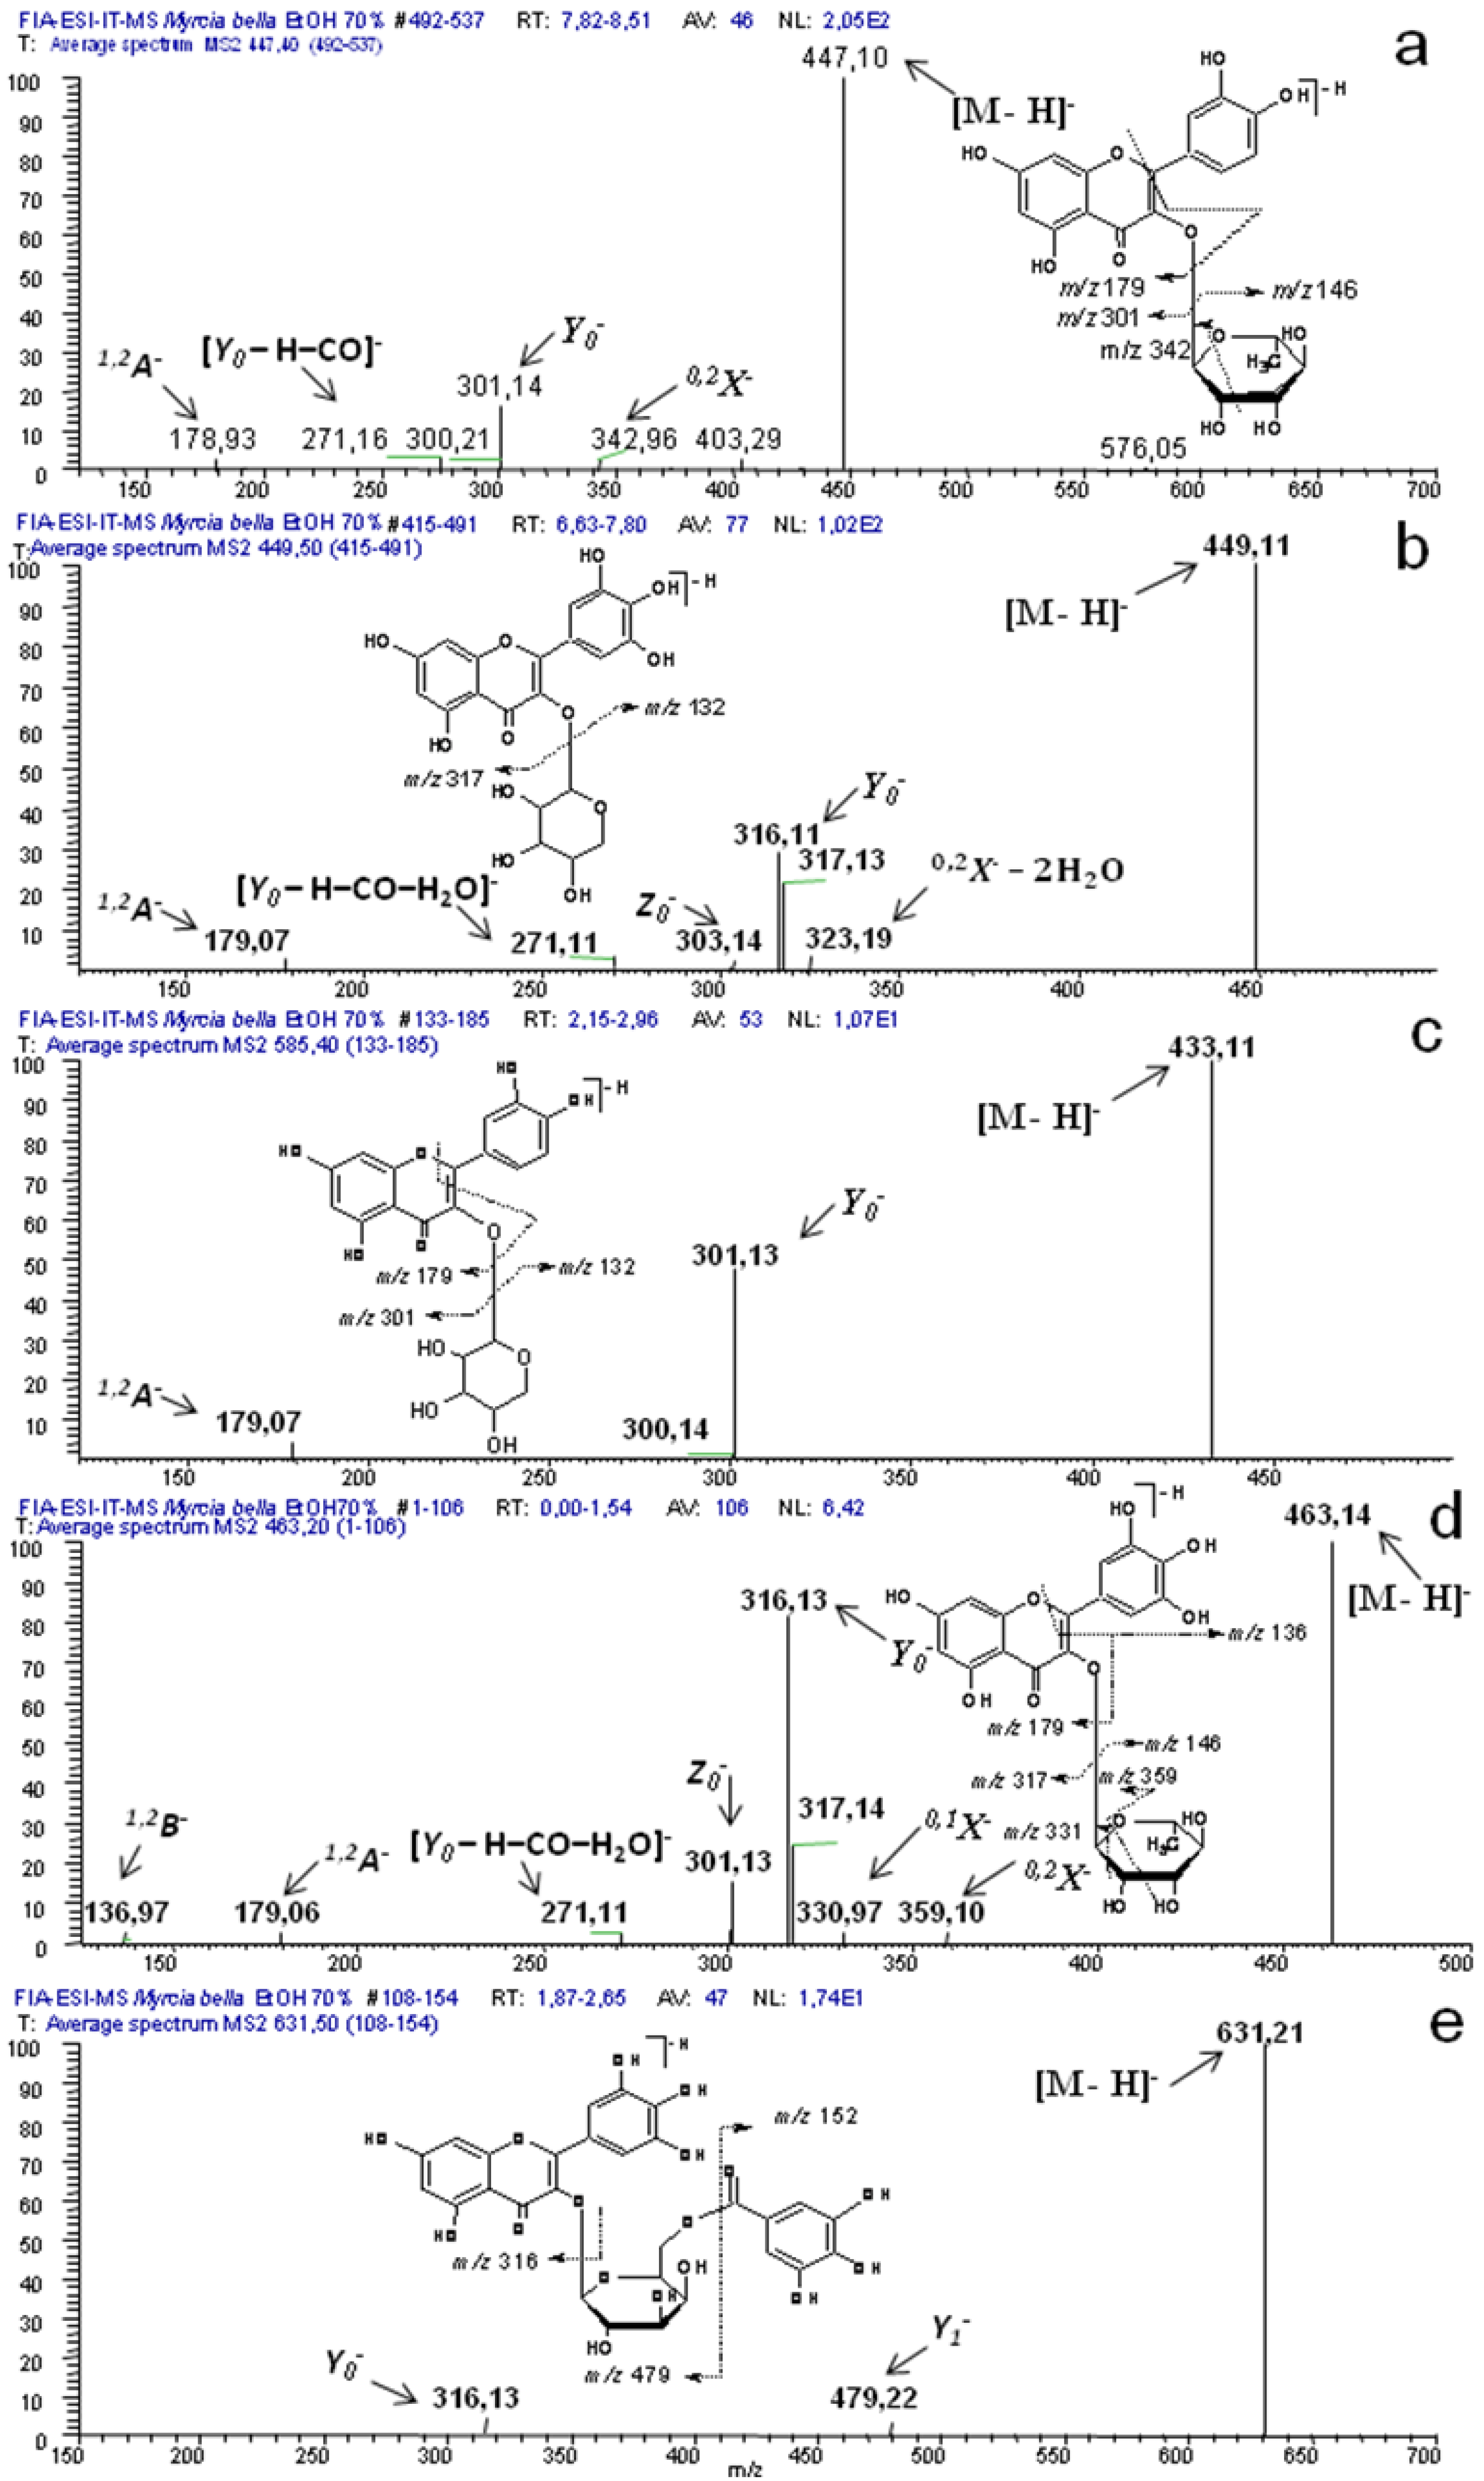
| 6(10) | 106.6 | 266, 356 | 631 | 479, 317, 271, 179, 151 | myricetin-O-(O-galloyl)-hexoside | UV/MS + NMR |
| 7(7) | 119.5 | 266, 350 | 479 | 316, 271 | myricetin-3-O-β-D-galactopyranoside | UV/MS + NMR |
| 8(9) | 123.4 | 266, 362 | 449 | 316, 271, 179 | myricetin-3-O-α-arabinopyranoside | UV/MS + NMR |
| 9(23) | 127.8 | 266, 356 | 615 | 463, 301, 271 | quercetin-O-(O-galloyl)-hexoside | UV/MS tentatively |
| 10(18) | 129.8 | 260, 356 | 615 | 463, 301, 271 | quercetin-3-O-(6’’-O-galloyl)-β-galactopyranoside | UV/MS + NMR |
| 11(8) | 132.7 | 260, 356 | 449 | 317, 303, 271, 231, 179 | myricetin-3-O-α-arabinofuranoside | UV/MS + NMR |
| 12(11) | 133.9 | 260, 350 | 463 | 317, 301, 271, 179, 136 | myricetin-3-O-α-L-rhamnopyranoside | UV/MS + NMR |
| 13(12) | 141.4 | 260, 350 | 463 | 301, 273, 179, 151 | quercetin-3-O-β-D-galactopyranoside | UV/MS + NMR |
| 14(21) | 144.3 | 254, 362 | 463 | 301, 273, 179, 151 | quercetin-O-hexoside | UV/MS tentatively |
| 15(16) | 148.5 | 260, 356 | 433 | 301, 261, 191 | quercetin-3-O-β-D-xylopyranoside | UV/MS + NMR |
| 16(15) | 152.3 | 254, 356 | 433 | 301, 261, 191 | quercetin-3-O-β-D-xylofuranoside | UV/MS + NMR |
| 17(22) | 155.9 | 266, 352 | 601 | 449 | myricetin-O-(O-galloyl)-pentoside | UV/MS tentatively |
| 18 | 159.7 | -- | 467 | -- | n.i. | -- |
| 19(17) | 160.0 | 266, 356 | 433 | 301, 191 | quercetin-O-α-L-arabinofuranoside | UV/MS + NMR |
| 20(14) | 164.0 | 254, 350 | 447 | 301, 271, 255, 179 | quercetin-3-O-α-L-rhamnopyranoside | UV/MS + NMR |
| 21 | 163.8 | -- | 483 | -- | n.i. | -- |
| 22 | 169.2 | -- | 477 | -- | n.i. | -- |
| 23(24) | 171,0 | 266, 356 | 615 | 463, 317 | myricetin-O-(O-galloyl)-deoxyhexoside | UV/MS tentatively |
| 24(20) | 176.8 | 260, 356 | 585 | 433, 301, 179, 151 | quercetin- O-(O-galloyl)-pentoside | UV/MS + NMR |
| 25 | 181,0 | -- | 631 | -- | n.i. | -- |
| 26(19) | 189.4 | 254, 374 | 301 | 137 | quercetin | UV/MS + NMR |


2.2. Validation Data
2.2.1. Linearity, Repeatability of the Standards, LOD, LOQ and Precision
| Analytes | Concentration (μg·mL−1) | Precision | |||
|---|---|---|---|---|---|
| Intra-day (mean ± SD) | RSD % | Inter-day (mean ± SD) | RSD % | ||
| Gallic ac. | 50 | 41.66 ± 1.0 | 2.40 | 35.93 ± 0.85 | 2.36 |
| (n = 3) | 100 | 77.53 ± 0.25 | 0.32 | 74.16 ± 0.49 | 0.66 |
| 200 | 143.2 ± 0.95 | 0.66 | 142.13 ± 0,75 | 0.52 | |
| Quercetin | 50 | 45.23 ± 0.30 | 0.66 | 42.63 ± 0.63 | 1.47 |
| (n = 3) | 100 | 85.2 ± 2.6 | 3.0 | 86.43 ± 0.81 | 0.93 |
| 200 | 163.36 ± 0.64 | 0.39 | 169.73 ± 0.8 | 0.47 | |
| Compound | Concentration ± SD (µg.mL−1) | Standard |
|---|---|---|
| gallic ac. | 12.13 ± 2.35 | GA |
| n.i. | 7.19 ± 0.87 | GA |
| n.i. | 8.07 ± 0.71 | GA |
| n.i. | 8.40 ± 0.57 | GA |
| Myricetin-3-O-β-D-galactopyranoside | 9.92 ± 0.91 | Q |
| Quercetin-O-(6’’-O-galloyl)-β-galactopyranoside | 5.46 ± 0.65 | Q |
| Quercetin-3-O-β-D-galactopyranoside | 21.82 ± 2.05 | Q |
| Quercetin-O-hexoside | 11.09 ± 1.05 | Q |
| Quercetin-3-O β-D-xylopyranoside | 7.01 ± 0.78 | Q |
| Quercetin-3-O-β-D-xylofuranoside | 14.06 ± 1.33 | Q |
| Quercetin-3-O-α-L-arabinofuranoside | 29.99 ± 3.37 | Q |
| Quercetin-O-α-L-rhamnopyranoside | 15.81 ± 1.49 | Q |
| Quercetin | 9.83 ± 1.47 | Q |
| Phenolic acid estimative | 35.80 | |
| Flavonoids estimative | 129.02 |
2.3. Quantitative Analysis
3. Material and Methods
3.1. Solvents and Chemicals
3.2. Plant Material
3.3. Standards
3.4. Isolation of the Characteristic Constituents
3.5. HPLC-PAD Analysis Instrumentation
3.6. FIA-ESI-IT-MS/MSn and HPLC-ESI-IT-MS Analysis Instrumentation
3.7. Identification of Peaks and Peak Purity
3.8. Linearity Limitation of Detection, Limitation of Quantification and Precision
3.9. Quantitative Determination of Constituents
3.10. NMR Analysis
4. Conclusions
Acknowledgments
Conflicts of Interest
References
- Calixto, J.B. Efficacy, safety, quality control, marketing and regulatory guidelines for herbal medicines (phytotherapeutic agents). Braz. J. Med. Biol. Res. 2000, 33, 179–189. [Google Scholar] [CrossRef]
- Mosihuzzaman, M.; Choudhary, M.I. Protocols on safety, efficacy, standardization, and documentation of herbal medicine (IUPAC Technical Report). Pure Appl. Chem. 2008, 80, 2195–2230. [Google Scholar] [CrossRef]
- Wolfender, J.L. HPLC in natural product analysis: The detection issue. Planta Med. 2009, 75, 719–734. [Google Scholar] [CrossRef]
- Xing, J.; Xie, C.F.; Lou, H.X. Recent applications of liquid chromatography-mass spectrometry in natural products bioanalysis. J. Pharm. Biomed. Anal. 2007, 44, 368–378. [Google Scholar] [CrossRef]
- Gouveia, S.C.; Castilho, P.C. Characterization of phenolic compounds in Helichrysum melaleucum by high-performance liquid chromatography with on-line ultraviolet and mass spectrometry detection. Rapid Commun. Mass Spectrom. 2010, 24, 1851–1868. [Google Scholar] [CrossRef]
- Huang, X.; Liu, Y.; Song, F.R.; Liu, Z.Q.; Liu, S.Y. Studies on principal components and antioxidant activity of different Radix astragali samples using high performance liquid chromatography/electrospray ionization multiple-stage tandem mass spectrometry. Talanta 2009, 78, 1090–1101. [Google Scholar] [CrossRef]
- Rauter, A.P.; Martins, A.; Lopes, R.; Ferreira, J.; Serralheiro, L.M.; Araújo, M.E.; Borges, C.; Justino, J.; Silva, F.V.; Goulart, M.; et al. Bioactivity studies and chemical profile of the antidiabetic plant Genista tenera. J. Ethnopharmacol. 2009, 122, 384–393. [Google Scholar] [CrossRef]
- Tiberti, L.A.; Yariwake, J.H.; Ndjoko, K.; Hostettmann, K. Identification of flavonols in leaves of Maytenus ilicifolia and M. aquifolium (Celastraceae) by LC/UV/MS analysis. J. Chromatogr. B 2007, 846, 378–384. [Google Scholar] [CrossRef]
- Myers, N.; Mittermeier, R.A.; Mittermeier, C.G.; Fonseca, G.A.B.; Kent, J. Biodiversity hotspots for conservation priorities. Nat. Lond. 2000, 403, 853–858. [Google Scholar] [CrossRef]
- Durigan, G.; Franco, G.A.D.C.; Siqueira, M.F. The Vegetation of Cerrado Remnant in São Paulo State. In Viability of Conservation of Cerrado Remnants São Paulo State; Bitencourt, M.D., Mendonça, R.R., Eds.; Annablume: São Paulo, Brazil, 2004; pp. 29–56. [Google Scholar]
- Landrum, L.R.; Kawasaki, M.L. The genera of Myrtaceae in Brazil—An illustrated synoptic treatment and identification keys. Brittonia 1997, 49, 508–536. [Google Scholar] [CrossRef]
- Carvalho, M.B.; Ishara, K.L.; Maimoni-Rodella, R.C.S. Vascular Flora of a Cerrado sensu stricto remnant in Pratânia, state of São Paulo, southeastern Brazil. Check List: J. Species Lists and Distribution 2010, 6, 350–357. [Google Scholar]
- Ishara, K.L.; Déstro, G.F.G.; Maimoni-Rodella, R.C.S.; Yanagizawa, Y.A.N.P. Floristic composition of sensu stricto cerrado remnants in Botucatu, SP. Brazilian J. Botany 2008, 31, 575–586. [Google Scholar] [CrossRef]
- Hashimoto, G. Illustrade Cyclopedia of Brazilian Medicinal Plants; Aboc-Sha: Kamakura, Japan, 1996. [Google Scholar]
- Russo, E.M.K.; Reichelt, A.A.J.; De-sá, J.R.; Furlanetto, R.P.; Moisés, R.C.S.; Kasamatsu, T.S.; Chacra, A.R. Clinical trial of Myrcia uniflora and Bauhinia forficata leaf extracts in normal and diabetic patients. Brazilian J. Med. Biol. Res. 1990, 23, 11–20. [Google Scholar]
- Cerqueira, M.D.; Souza-Neta, L.; Passos, M.G.V.M.; Lima, E.O.; Roque, N.F.; Martins, D.; Guedes, M.L.S.; Cruz, F.G. Seasonal variation and antimicrobial activity of Myrcia myrtifolia essential oils. J. Braz. Chem. Soc. 2007, 18, 998–1003. [Google Scholar] [CrossRef]
- Cole, R.A.; Haber, W.A.; Setzer, W.N. The leaf oil composition of Myrcia splendens from Monteverde, Costa Rica. J. Essent. Oil Bear. Plants 2008, 11, 41–44. [Google Scholar] [CrossRef]
- Henriques, A.T.; Sobral, M.; Bridi, R.; Vérin, P.; Menut, C.; Lamaty, G.; Bessière, J.M. Essential oils from five southern brazilian species of Myrcia (Myrtaceae). J. Essent. Oil Res. 1997, 9, 13–18. [Google Scholar]
- Limberger, R.P.; Sobral, M.; Henriques, A.T.; Menut, C.; Bessière, J. Óleos voláteis de espécies de Myrcia nativas do Rio Grande do Sul. Quim. Nova 2004, 27, 916–919. [Google Scholar] [CrossRef]
- Reynertson, K.A.; Yang, H.; Jiang, B.; Basile, M.J.; Kennelly, E.J. Quantitative analysis of antiradical phenolic constituents from fourteen edible Myrtaceae fruits. Food Chem. 2008, 109, 883–890. [Google Scholar] [CrossRef]
- Yoshikawa, M.; Shimada, H.; Nishida, N.; Li, Y.; Toguchida, I.; Yamahara, J.; Matsuda, H. Antidiabetic principles of natural medicines. II. Aldose reductase and alpha-glucosidase inhibitors from Brazilian natural medicine, the leaves of Myrcia multiflora DC. (Myrtaceae): Structures of myrciacitrins I and II and myrciaphenones A and B. Chem. Pharm. Bull. 1998, 46, 113–119. [Google Scholar] [CrossRef]
- Matsuda, H.; Nishida, N.; Yoshikawa, M. Antidiabetic principles of natural medicines. V. Aldose reductase inhibitors from Myrcia multiflora DC. (2): Structures of myrciacitrins III, IV, and V. Chem. Pharm. Bull. 2002, 50, 429–431. [Google Scholar] [CrossRef]
- Ferreira, A.C.; Neto, J.C.; da Silva, A.C.; Kuster, R.M.; Carvalho, D.P. Inhibition of thyroid peroxidase by Myrcia uniflora flavonoids. Chem. Res. Toxicol. 2006, 19, 351–355. [Google Scholar]
- Pepato, M.T.; Oliveira, J.R.; Kettelhut, I.C.; Migliorini, R.H. Assessment of the antidiabetic activity of Myrcia uniflora extracts in streptozotocin diabetic rats. Diabetes Res. 1993, 22, 49–57. [Google Scholar]
- Anvisa 2010. Resolution-RDC n. 14: Registration of herbal drugs. Official Diary of the Union. Available online: http://www.in.gov.br/visualiza/index.jsp?data=05/04/2010&jornal=1&pagina=85&totalArquivos=160 (accessed on 18 April 2013).
- Ma, Y.L.; Li, Q.M.; van den Heuvel, H.; Claeys, M. Characterization of flavone and flavonol aglycones by collision-induced dissociation tandem mass spectrometry. Rapid Commun. Mass Spectrom. 1997, 11, 1357–1364. [Google Scholar] [CrossRef]
- Domon, B.; Costello, C.E. A systematic nomenclature for carbohydrate fragmentations in FAB-MS/MS spectra of glycoconjugates. Glycoconj. J. 1998, 5, 397–409. [Google Scholar] [CrossRef]
- Li, Q.M.; Claeys, M. Characterization and differentiation of diglycosyl flavonoids by positive ion fast atom bombardment and tandem mass spectrometry. Biol. Mass Spectrom. 1994, 23, 406–416. [Google Scholar] [CrossRef]
- Agrawal, P.K. Carbon 13C- NMR of Flavonoids; Elsevier: New York, NY, USA, 1989. [Google Scholar]
- Harborne, J.B. The Flavonoids: Advances in Research since 1986; Chapman & Hall: London, UK, 1994. [Google Scholar]
- Andersen, O.M.; Markhan, K.R. Flavonoides: Chemistry, Biochemistry and Applications; Taylor & Francis Group: New York, NY, USA, 2006. [Google Scholar]
- Lu, Y.; Foo, L.Y. Identification and quantification of major polyphenols in apple pomace. Food Chem. 1997, 59, 187–194. [Google Scholar] [CrossRef]
- Chua, L.S.; Latiff, N.A.; Lee, S.Y.; Lee, C.T.; Sarmid, M.R.; Aziz, R.A. Flavonoids and phenolic acids from Labisia pumila (Kacip Fatimah). Food Chem. 2011, 127, 1186–1192. [Google Scholar] [CrossRef]
- Ablajan, K.; Abliz, Z.; Shang, X.Y.; He, J.M.; Zhang, R.P.; Shi, J.G. Structural characterization of flavonol 3,7-di-O-glycosides and determination of the glycosylation position by using negative ion electrospray ionization tandem mass spectrometry. J. Mass Spectrom. 2006, 41, 352–360. [Google Scholar] [CrossRef]
- Prista, L.N. Pharmaceutic Tecnology; Calouste Foundation Gulbenkian: Lisboa, Portugal, 1995. [Google Scholar]
© 2013 by the authors; licensee MDPI, Basel, Switzerland. This article is an open access article distributed under the terms and conditions of the Creative Commons Attribution license (http://creativecommons.org/licenses/by/3.0/).
Share and Cite
Saldanha, L.L.; Vilegas, W.; Dokkedal, A.L. Characterization of Flavonoids and Phenolic Acids in Myrcia bella Cambess. Using FIA-ESI-IT-MSn and HPLC-PAD-ESI-IT-MS Combined with NMR. Molecules 2013, 18, 8402-8416. https://doi.org/10.3390/molecules18078402
Saldanha LL, Vilegas W, Dokkedal AL. Characterization of Flavonoids and Phenolic Acids in Myrcia bella Cambess. Using FIA-ESI-IT-MSn and HPLC-PAD-ESI-IT-MS Combined with NMR. Molecules. 2013; 18(7):8402-8416. https://doi.org/10.3390/molecules18078402
Chicago/Turabian StyleSaldanha, Luiz L., Wagner Vilegas, and Anne L. Dokkedal. 2013. "Characterization of Flavonoids and Phenolic Acids in Myrcia bella Cambess. Using FIA-ESI-IT-MSn and HPLC-PAD-ESI-IT-MS Combined with NMR" Molecules 18, no. 7: 8402-8416. https://doi.org/10.3390/molecules18078402