Article

Solid-, Solution-, and Gas-state NMR Monitoring of 13C-Cellulose Degradation in an Anaerobic Microbial Ecosystem

1
Research Planning and Management Group, Kajima Technical Research Institute, KAJIMA Corporation, 2-19-1 Tobitakyu, Chofu, Tokyo 182-0036, Japan
2
Graduate School of Medical Life Science, Yokohama City University, 1-7-29 Suehirocho, Tsurumi-ku, Yokohama, Kanagawa 230-0045, Japan
3
RIKEN Center for Sustainable Resource Science, 1-7-22 Suehirocho, Tsurumi-ku, Yokohama, Kanagawa 230-0045, Japan
4
Graduate School of Bioagricultural Sciences, Nagoya University, 1 Furo-cho, Chikusa-ku, Nagoya, Aichi 464-0810, Japan
5
Biomass Engineering Program, RIKEN Research Cluster for Innovation, 2-1 Hirosawa, Wako 351-0198, Japan
*
Author to whom correspondence should be addressed.
Molecules 2013, 18(8), 9021-9033; https://doi.org/10.3390/molecules18089021
Submission received: 27 June 2013 / Revised: 10 July 2013 / Accepted: 19 July 2013 / Published: 29 July 2013
(This article belongs to the Special Issue NMR of Proteins and Small Biomolecules)

Abstract

:
Anaerobic digestion of biomacromolecules in various microbial ecosystems is influenced by the variations in types, qualities, and quantities of chemical components. Nuclear magnetic resonance (NMR) spectroscopy is a powerful tool for characterizing the degradation of solids to gases in anaerobic digestion processes. Here we describe a characterization strategy using NMR spectroscopy for targeting the input solid insoluble biomass, catabolized soluble metabolites, and produced gases. 13C-labeled cellulose produced by Gluconacetobacter xylinus was added as a substrate to stirred tank reactors and gradually degraded for 120 h. The time-course variations in structural heterogeneity of cellulose catabolism were determined using solid-state NMR, and soluble metabolites produced by cellulose degradation were monitored using solution-state NMR. In particular, cooperative changes between the solid NMR signal and 13C-13C/13C-12C isotopomers in the microbial degradation of 13C-cellulose were revealed by a correlation heat map. The triple phase NMR measurements demonstrated that cellulose was anaerobically degraded, fermented, and converted to methane gas from organic acids such as acetic acid and butyric acid.

1. Introduction

Anaerobic metabolism in complex microbial ecosystems degrades highly polymerized biomass into biogas through certain short-chain fatty acids [1]. It represents one of the most significant anaerobic events on Earth [2] and has received increasing attention as a means to safely produce energy from renewable feedstocks such as industrial organic wastes [3]. Therefore, anaerobic digestion is an indispensable metabolic process for generating organic matter both in Nature and for industrial purposes.
In anaerobic digestion, it is difficult to evaluate and elucidate the metabolic dynamics in the characterization of the degradation processes for refractory polymeric macromolecules such as cellulose. This is due to the complexity of polymeric macromolecules with supermolecular structures and their sequential metabolism resulting from diverse and extensive interactions and competition in microbial ecosystems. For example, natural cellulose, the most abundant polymeric macromolecule on Earth, is a partially crystalline polymer of 1→4-linked β-D-glucose units, and the supermolecular structure of cellulose polymers influences its physical properties and reactivity in synthetic and biological reactions [4]. Natural cellulose exists as crystalline types Iα and Iβ as well as in an amorphous form. In natural cellulose type I fibers, cellulose chains aggregate and form fibrils that are deposited in the cell wall during biosynthesis [5]. These complex structures make it difficult to monitor their anaerobic digestion.
To address the challenge of the structural heterogeneity of polymeric biomacromolecules, solid-state nuclear magnetic resonance (NMR) spectroscopy provides a powerful tool for characterizing the structure and dynamics of biomacromolecules [6,7,8]. For example, it enables observations of crystalline and amorphous structures of cellulose, although not all carbon atoms such as C2, C3, and C5 that overlap in 1-dimensional 13C-NMR spectra can be identified. In solid-state NMR, cross-polarization (CP)/magic angle spinning (MAS) is frequently used to analyze the supermolecular structures of cellulose in order to characterize the differences between crystalline and amorphous forms [9,10,11,12].
Moreover, microbial communities can generate acetic acid and butyric acid as metabolites by anaerobic digestion of polymeric macromolecules. Solution-state NMR, NMR-based metabolomics, or metabonomics in combination with multivariate statistical analysis are powerful tools for evaluating metabolic dynamics in microbial ecosystems and have been extensively used to investigate a wide range of biological systems in diverse environments [13,14,15,16,17]. Furthermore, because the low natural abundance (1.11%) of 13C contributes to the significantly lower sensitivity of 13C-NMR spectroscopy, stable isotope labeling technology is also a powerful tool. We previously developed an approach to monitor metabolic dynamics in microbial ecosystems in order to link relationships between microbial communities and their metabolic potential [18]. The final products of anaerobic microbial metabolism are biogases that can be measured using gas chromatography or gas-state NMR [19,20,21,22]. Therefore, the microbial degradation of complex substrates and the metabolic dynamics of the anaerobic digestion of ubiquitous polymeric macromolecules can be effectively assessed using NMR spectroscopy.
Our previous study characterized the anaerobic degradation of glucose, starch, and cellulose in an ecosystem by determining the metabolic reaction pathway [23]; however, the structural characteristics of cellulose were not evaluated because of the lower sensitivity for detecting carbon. To overcome this obstacle, we prepared 13C-labeled bacterial cellulose (BC) to monitor the degradation profiles of anaerobic microbial digestion. 13C-BC was added to the anaerobic ecosystem, and its degradation was monitored using solid-, solution-, and gas-state NMR spectroscopy.

2. Results and Discussion

This present study focused on characterizing anaerobic digestion catalyzed by microbial ecosystems using solid-, solution-, and gas-state NMR combined with stable isotope labeling technology and multivariate statistical analysis. We characterized the anaerobic digestion of BC, which generates biogas from acetic acid and butyric acid precursors.

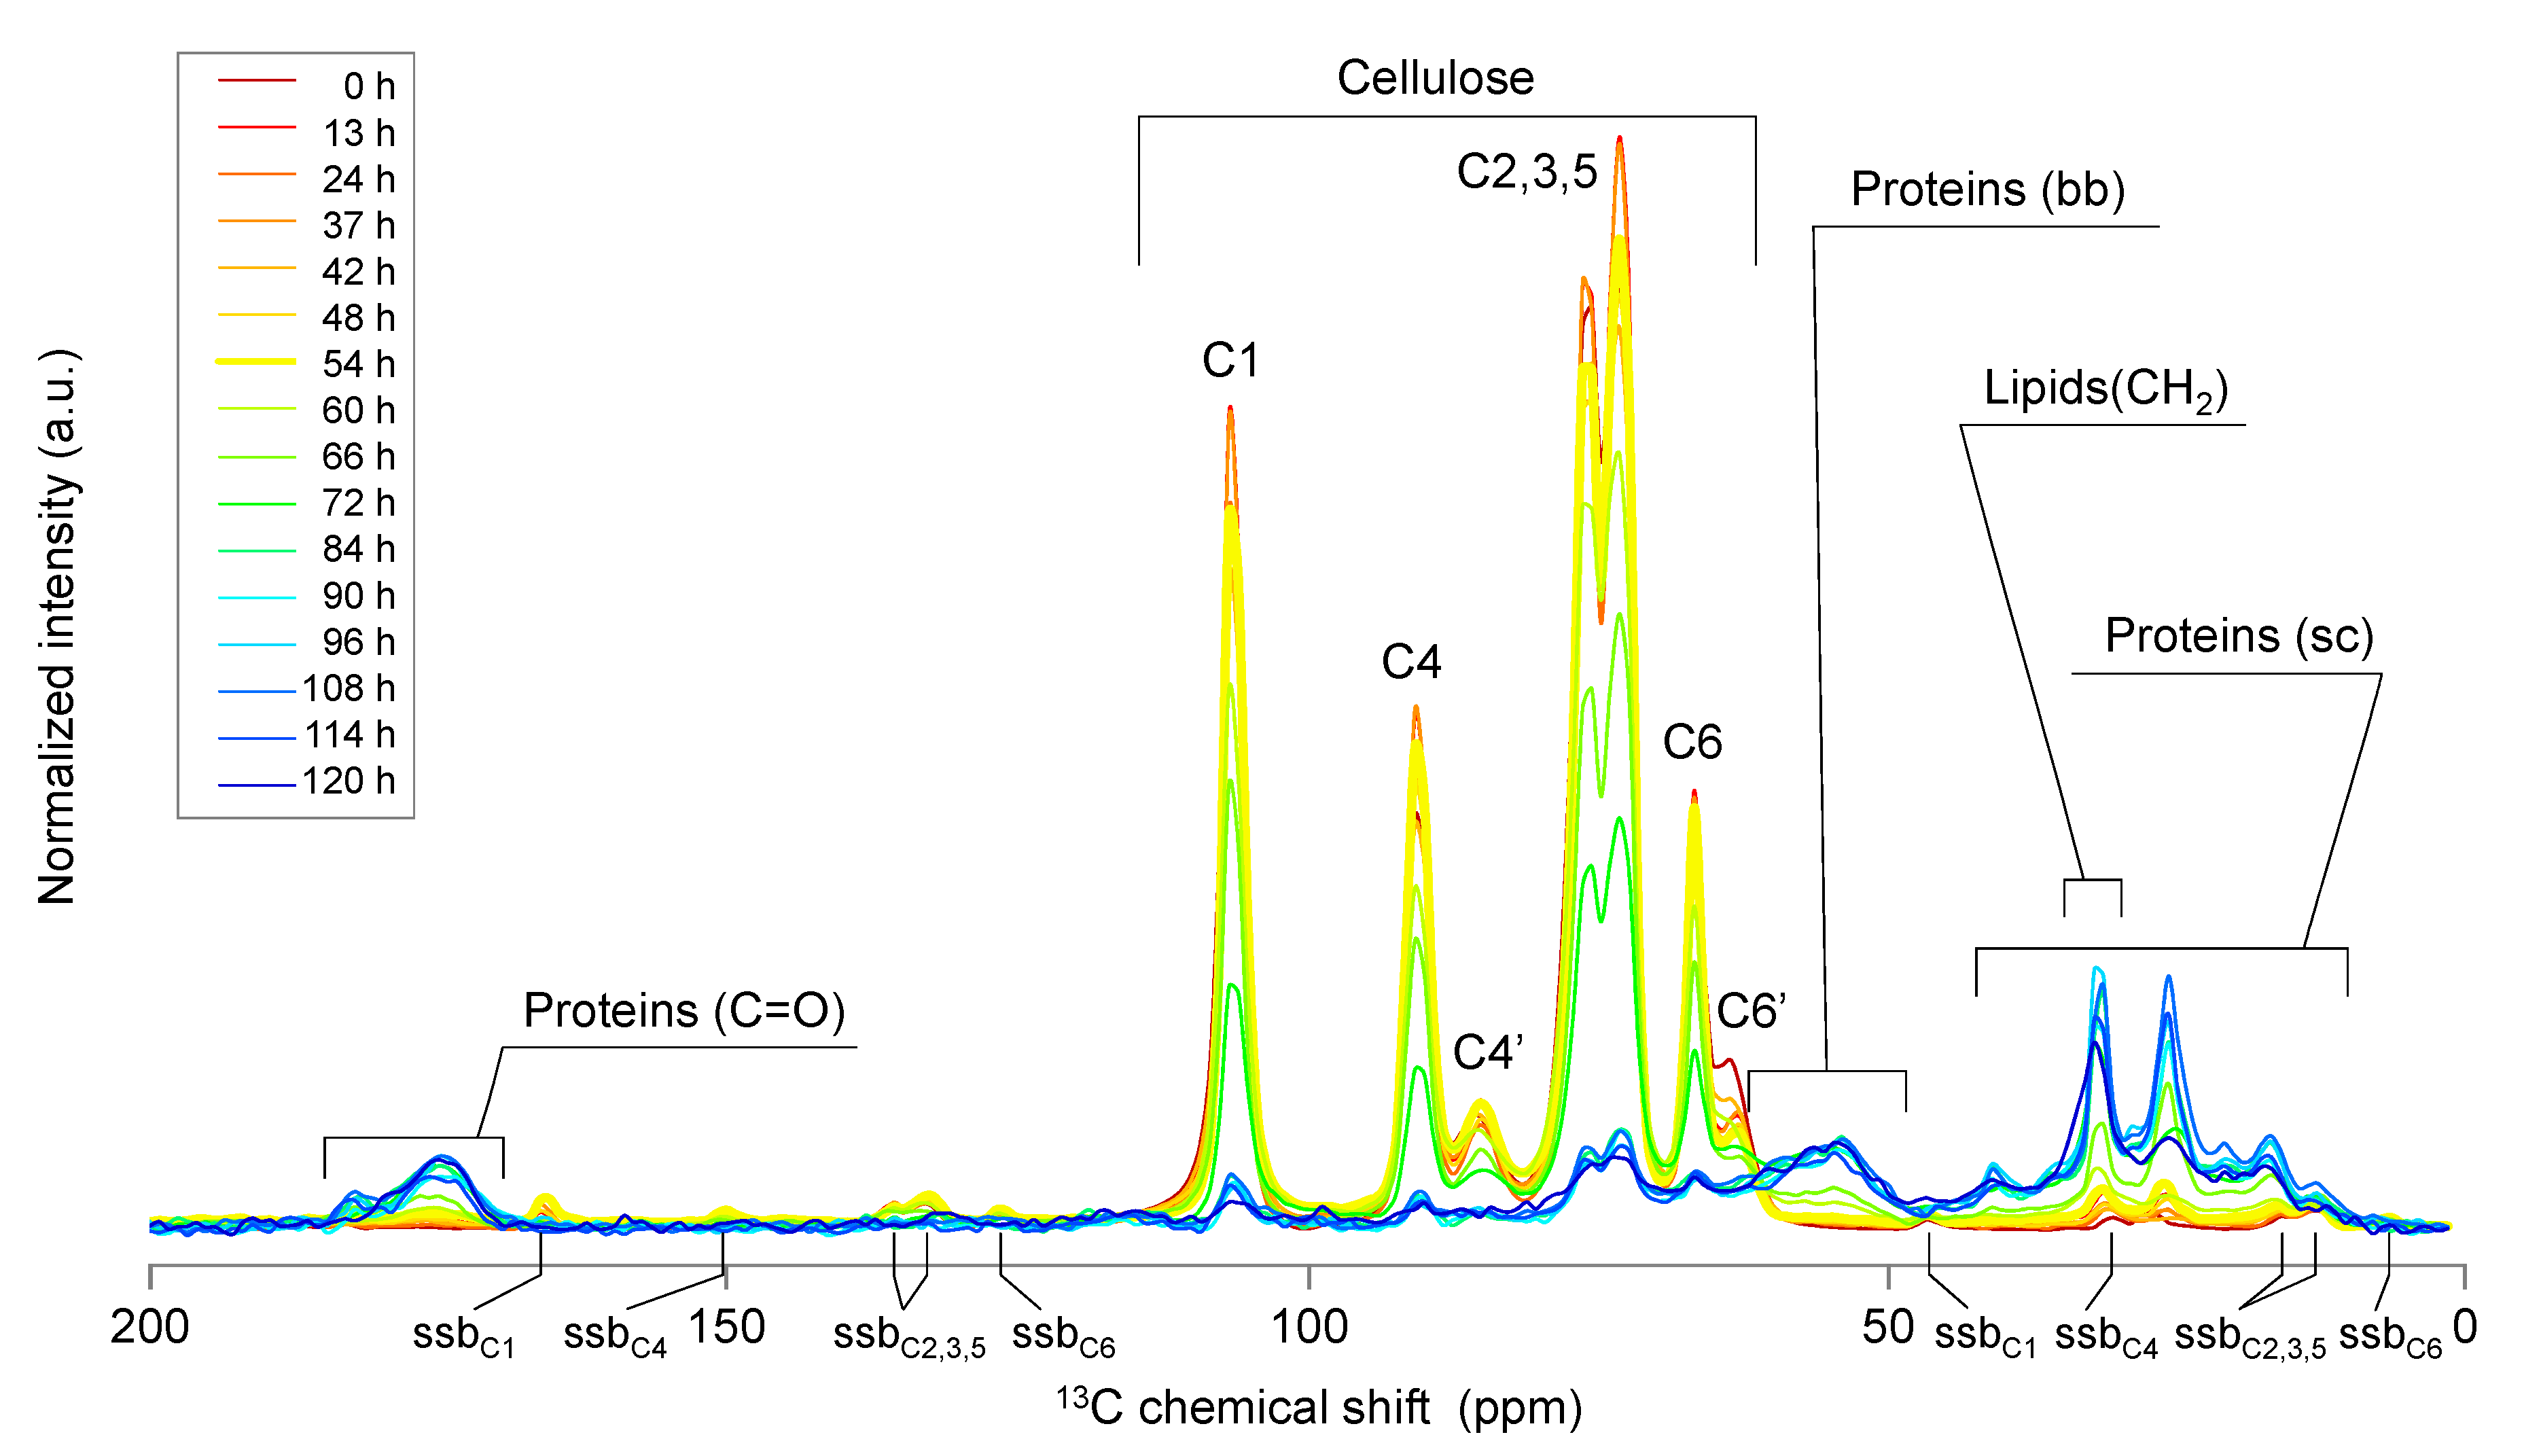
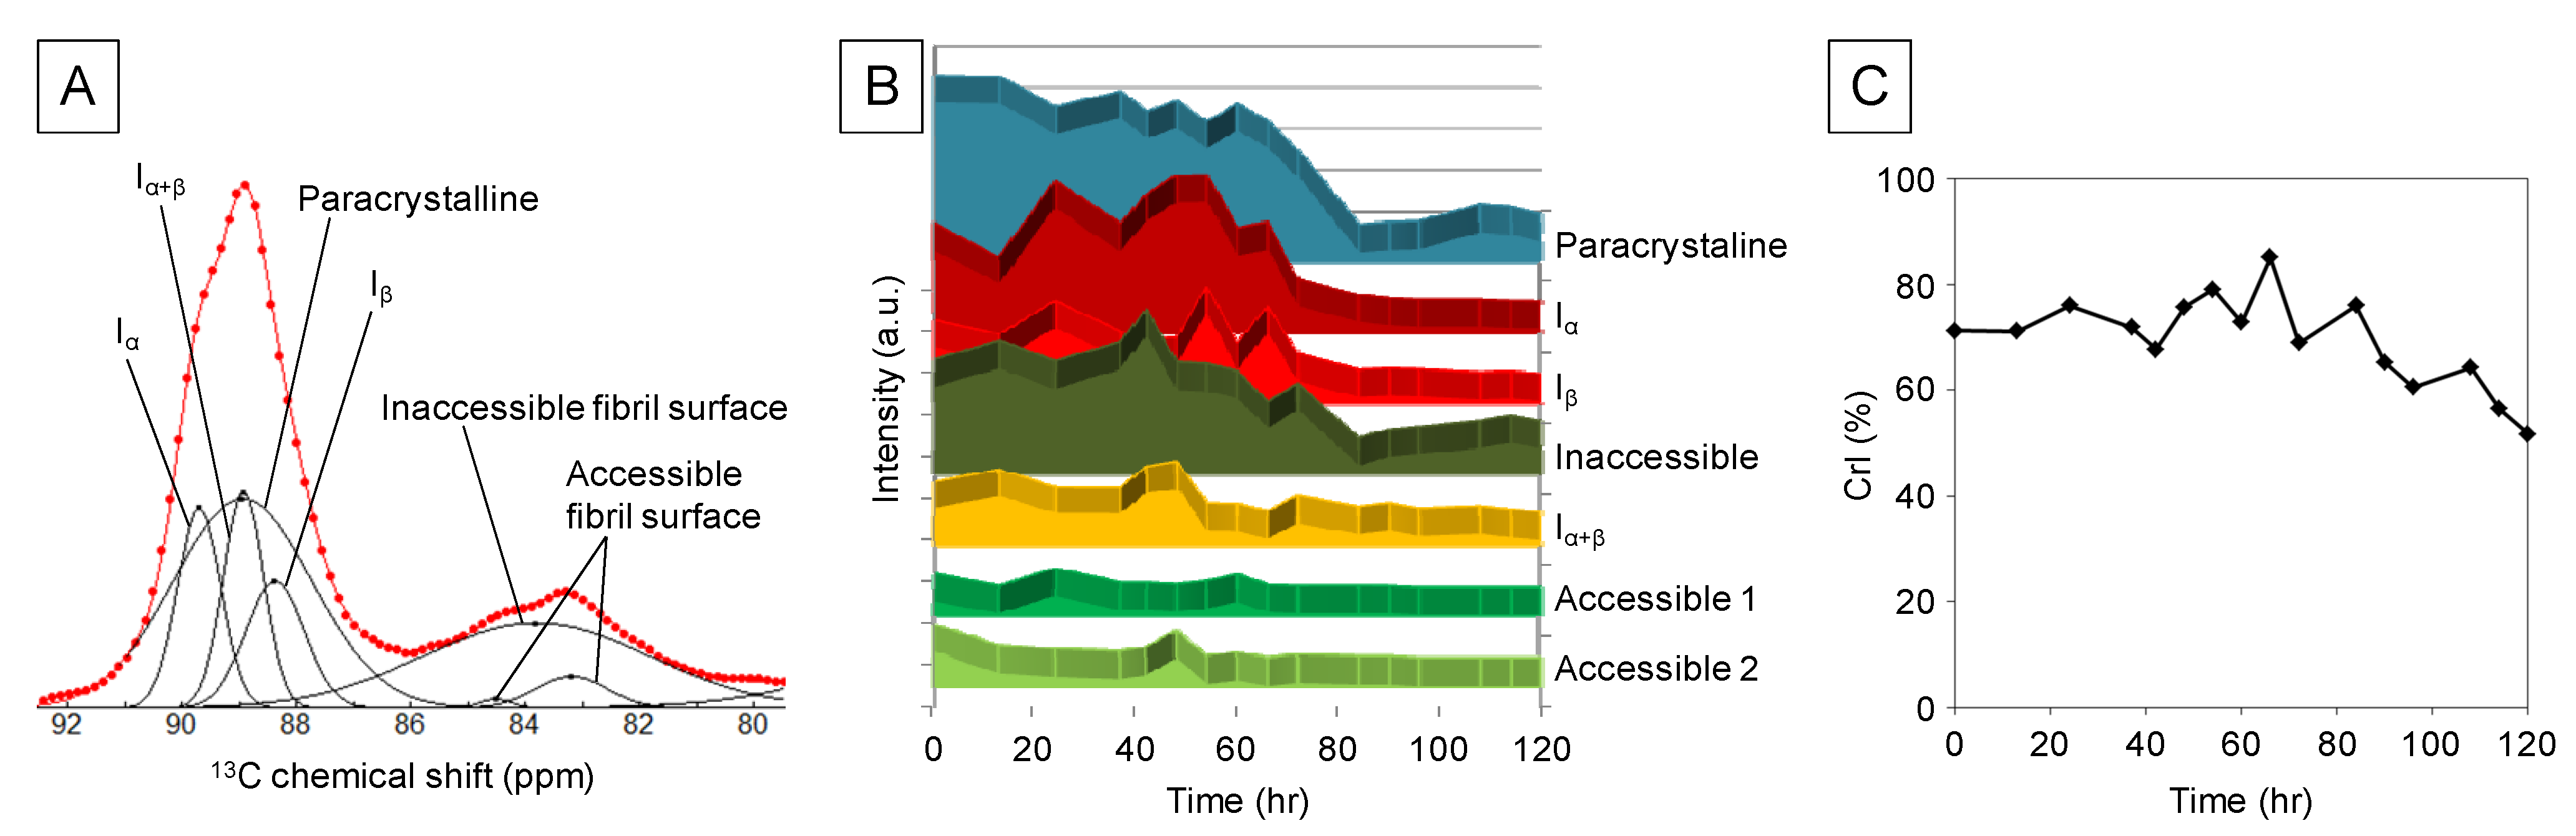
2.1. Solid-State NMR Spectroscopy

Degradation of 13C-labeled BC was monitored using solid-state NMR, and the signals generated by proteins and lipids were assigned according to our previous report [24]. We detected each hexose-ring carbon atom (C1–C6) of crystalline and amorphous BC using 13C-CP/MAS spectroscopy (Figure 1). The signals specific for BC slightly decreased after its addition to the reactor and remained stable at a low level for 60–84 h after starting the reaction. In contrast, an increase in protein and lipid signals was observed during the same period (Figure 1).
Figure 1. 13C-CP/MAS-NMR spectra of anaerobic microbial degradation of BC. Sampling time is indicated by the colored lines described in the figure.
Molecules 18 09021 g001
Each cellulose peak (for example, the cellulose C4 region) comprises many peaks representing different molecular structures of cellulose, such as cellulose Iα and cellulose Iβ. Therefore, the data were processed to discriminate between the peaks for cellulose Iα, Iβ, Iα+β, paracrystalline, inaccessible, and accessible fibril surfaces (Figure 2A) [25,26,27]. The variations in each BC structure as a function of reaction time are shown in Figure 2B. The signal of the paracrystalline structure slightly decreased at an early stage in the reaction and then immediately decreased (60–84 h). In contrast, cellulose Iα and Iβ signals increased and decreased, respectively, at an early stage and then decreased to the level of the paracrystalline form after 72 h. The signals of the amorphous inaccessible fibril surfaces likely varied proportionally to those of the paracrystalline form and inversely to those of the Iβ form by 72 h. The amorphous structures of accessible fibril surfaces 1 and 2 were detected at low levels, suggesting that the structures were degraded to low-molecular-weight metabolites compared with the other forms of cellulose. Furthermore, the signal intensities of the Iα, Iβ, Iα + β, and inaccessible fibrils decreased after an initial small increase that accompanied the changes in the intact crystalline structures (Figure 2B).
The crystallinity index was calculated as follows (1) [28]:
CrI = Cry/(Cry + Amo)
where CrI: crystallinity index, Cry: the total area of crystal peaks, Amo: the total area of amorphous peaks.
The crystallinity index was approximately 70%. It fluctuated until 84 h and decreased significantly with the decrease in the cellulose signal (Figure 2C). This result indicates that the degradation rate of amorphous cellulose was faster than that of the crystalline structure. This result is consistent with the small variations in signal intensity of accessible fibril surfaces 1 and 2 (Figure 2B).
Figure 2. The variations in each BC structure as a function of reaction time. (A) Spectral fitting and peak separations of the C4 region of a 13C-CP/MAS-NMR spectrum of a representative sample acquired after 13 h. The red dots and the red and black lines represent the raw NMR spectral data, the fitting model, and functions of each allomorph, respectively. (B) Intensity fluctuations of each allomorph determined by spectral fitting analysis of the 13C-CP/MAS-NMR spectra. (C) Time-dependent fluctuation of CrI determined by spectral fitting analysis of 13C-CP/MAS-NMR spectra.
Molecules 18 09021 g002

2.2. Solution-State NMR Spectroscopy

To identify and characterize the metabolism of low-molecular-weight molecules, solution-state 1H- and 13C-NMR analyses were performed (Figures S1 and S2). The major low-molecular-weight compounds generated from BC were acetic acid, butyric acid, propionic acid, formic acid, and ethanol (Table S1). The 13C-NMR chemical shift data were digitized and evaluated, and principal component analysis (PCA) was performed (Figure S3). The PCA score plots show that the metabolic profiles gradually shifted from negative PC1 to positive PC1 directions and from negative PC2 to positive PC2 directions and then returned to negative directions over time. Loading plot analysis revealed that the molecules that contributed to the positive PC1 direction were acetic acid, propionic acid, butyric acid, HCO3/CO32−, and CO2. In contrast, the factors that contributed to the positive PC2 direction or were present in significant amounts in the solutions at 48–72 h were ethanol, acetic acid, and formic acid. These results indicate that these low-molecular-weight metabolites were gradually produced and then accumulated during the first 60 h, and subsequently the concentrations of ethanol and formic acid decreased significantly.
The intensity of the 13C-HCO3/CO32− signals in solution increased significantly at 40–70 h after the start of reactor operation (Figure S4). There was only a small increase in the intensity of the CO2 signal over the same period because the state balance between ions and molecules was dominated by chemical equilibrium [29,30]. The significant increase in 13C-HCO3/CO32− signals coincided with the decrease in signals of inaccessible fibril surfaces Iα and Iβ, suggesting that the degradation of amorphous and crystalline cellulose occurred simultaneously with the hydrolysis of the polymers.

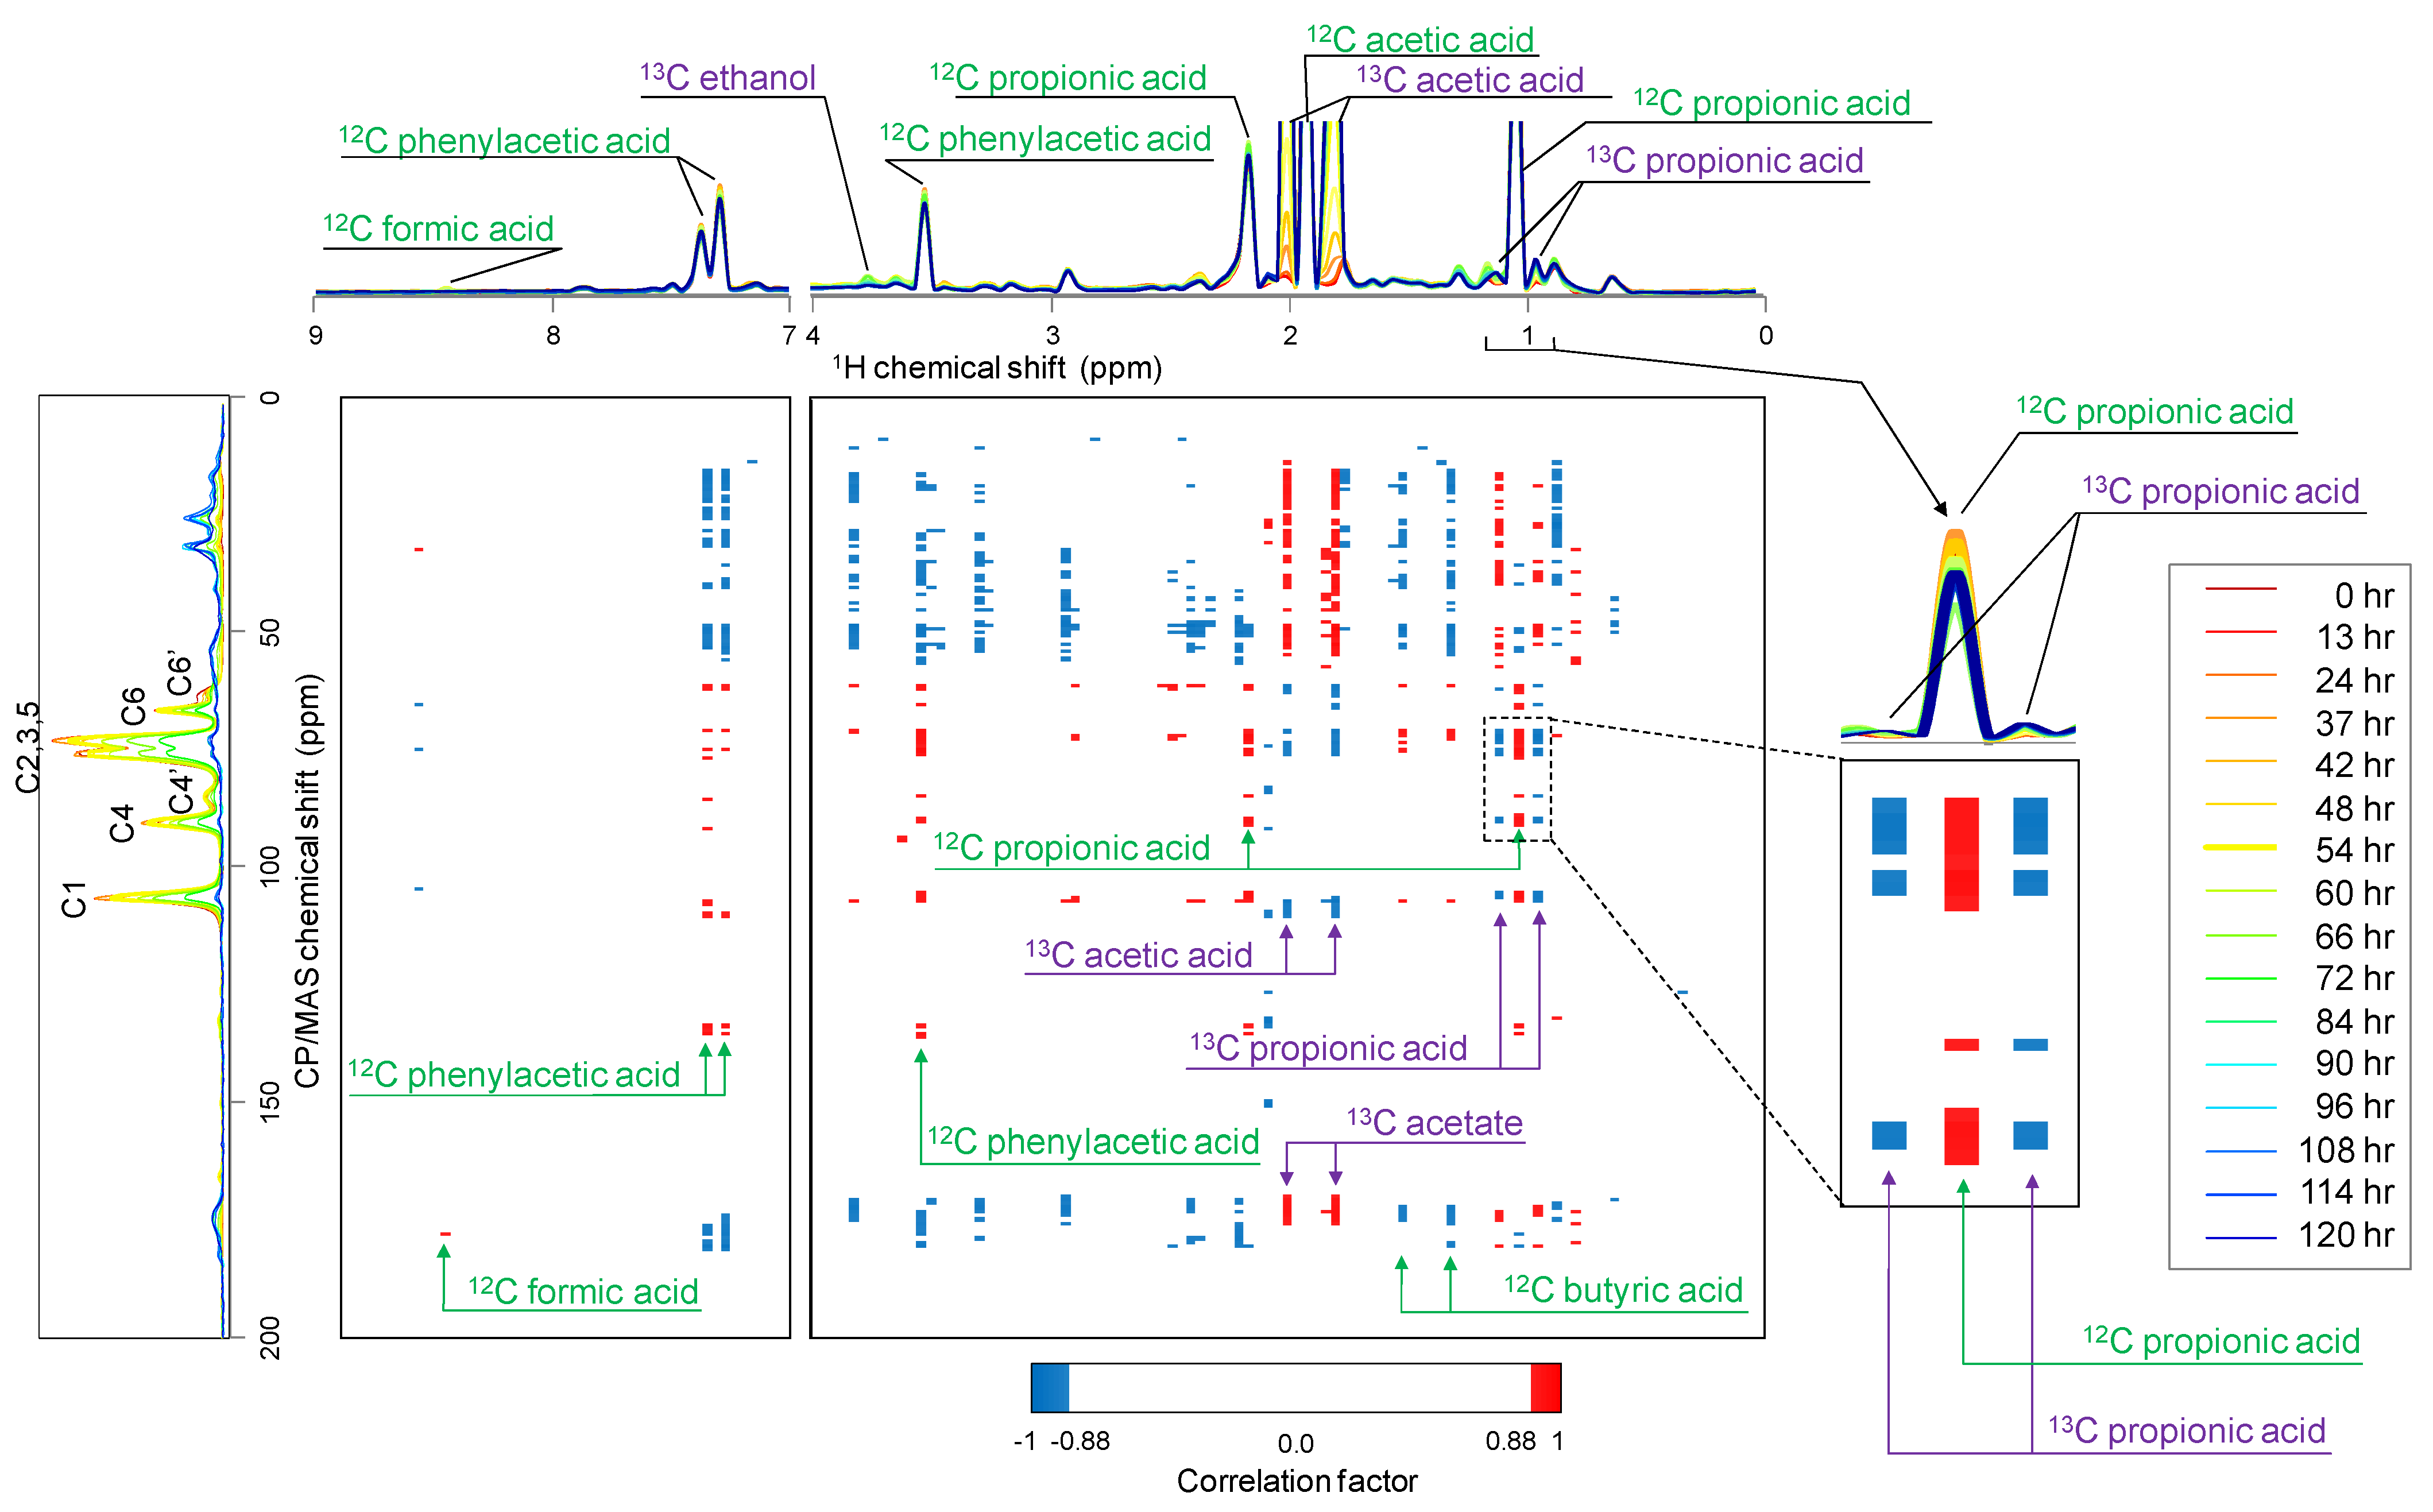
2.3. Relationship between 13C-BC Degradation and Production of 13C-Labeled Metabolites

The digitized solution-state 1H-NMR and 13C-NMR chemical shift data were statistically compared with 13C-CP/MAS spectra using correlation analysis (Figure 3). The heat map generated by correlation analysis between 13C-CP/MAS and solution-state 1H-NMR (i.e., the correlation between the structural heterogeneity of cellulose and metabolite heterogeneity) indicated that numerous 13C-CP/MAS peaks representing 13C-BC correlated positively with 12C-1H peaks and negatively with 13C-labeled low-molecular-weight compounds (Figure 3).
The organic compounds indicated by the 12C-1H peaks were intrinsically included in the initial anaerobic digestion sludge, and the peak heights decreased as a function of time and cellulose degradation. In contrast, the levels of 13C-labeled low-molecular-weight compounds such as acetic acid, ethanol, and propionic acid increased as cellulose was degraded, suggesting that the generation of 13C-labeled organic acids was caused by the anaerobic degradation of 13C-labeled cellulose. This heat map revealed the relationships of the variations in time course between solid biomass degradation and metabolic dynamics by the microbial communities. In particular, significant cooperative changes between the solid-state NMR signal and 13C-13C/13C-12C isotopomers generated by the microbial degradation of 13C-BC were revealed by correlation analysis.
Figure 3. Heat maps comparing solid-state 13C-CP/MAS and solution-state 1H-NMR spectra. Sampling time is indicated by the colored lines described in the figure. The threshold value of the correlation coefficient was set to a cutoff value of 0.88 as the absolute value in the correlation heat map. Red and blue denote positive and negative correlations, respectively.
Molecules 18 09021 g003

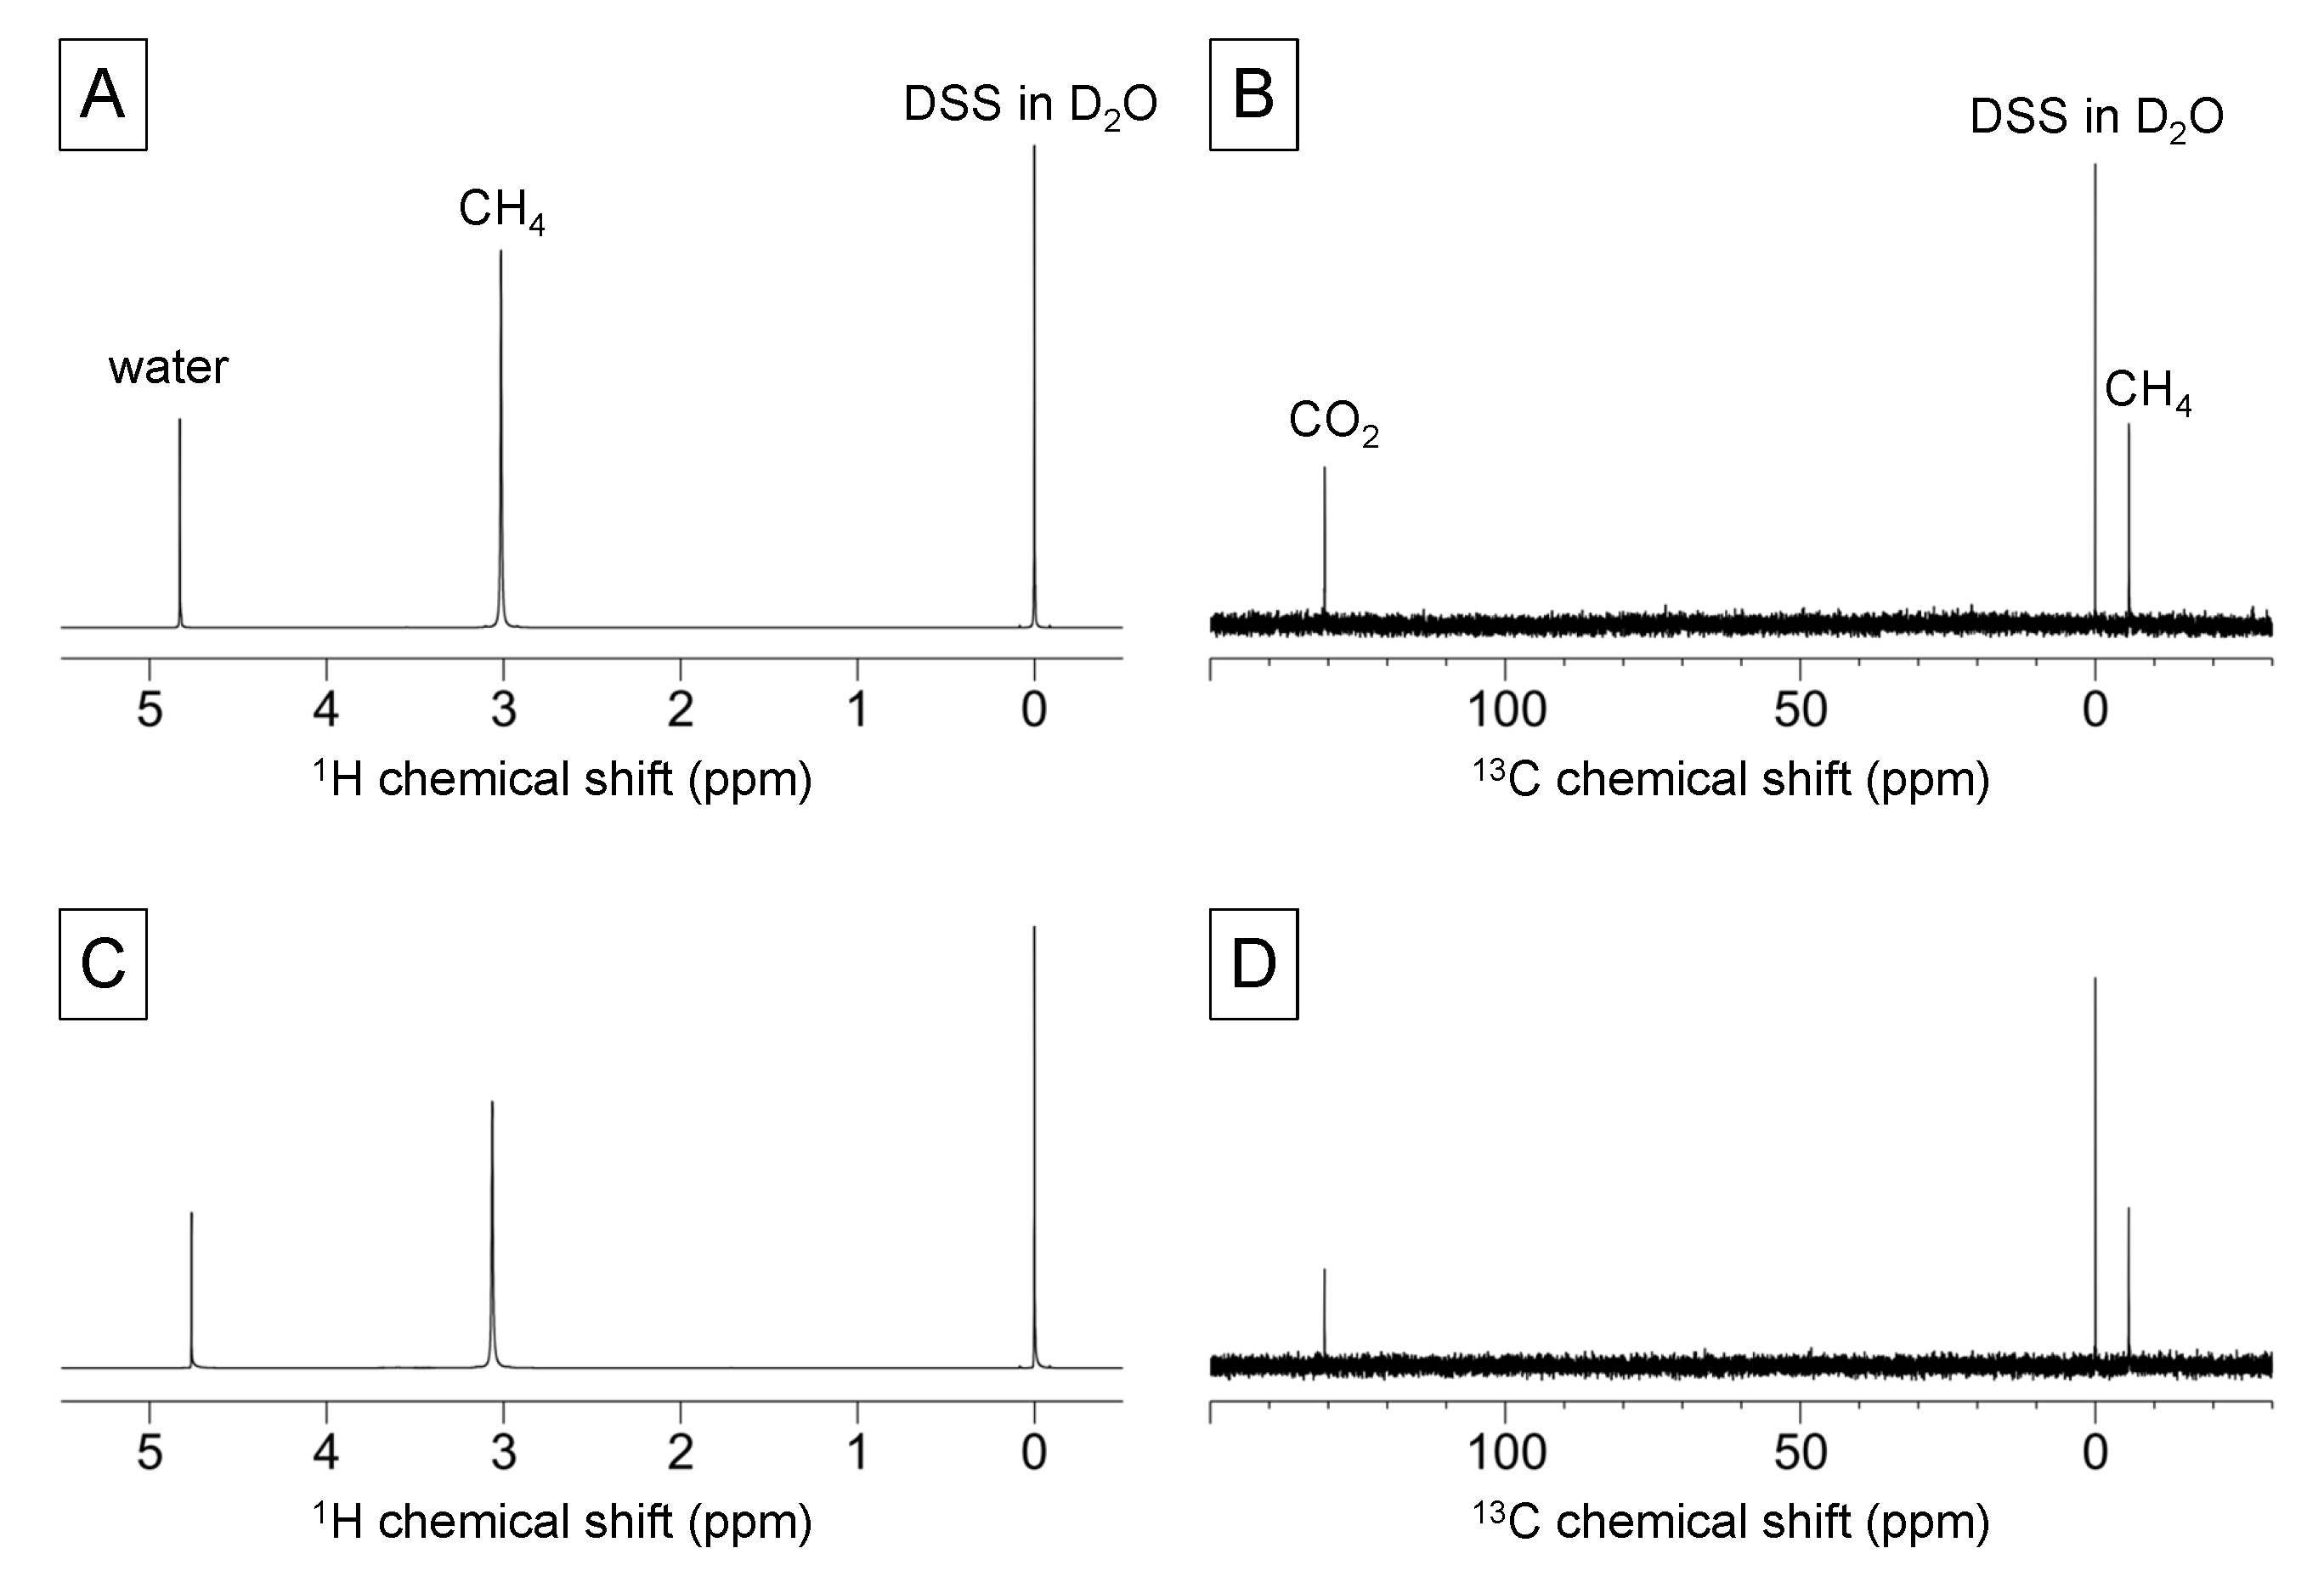
2.4. Gas-State NMR Spectroscopy

The end products of the anaerobic catabolism of BC are CH4 and CO2 gas. To detect methane and carbon dioxide gas using gas-state NMR spectroscopy, we first prepared a standard mixture of 70% methane and 30% carbon dioxide gas under 4 atmospheres in an NMR tube. The standard mixture was measured using 1H- and 13C-NMR spectroscopy, and the spectra are displayed in Figure 4A,B. Following this, the gas sample obtained from anaerobic digestion was measured in the same manner, and the 1H- and 13C-NMR spectra are displayed in Figure 4C,D. The NMR chemical shifts of the standard mixture and the sample were little different between the spectra, suggesting an effect of the partial pressure of each gas [20]. Taken together, this study enabled monitoring of the metabolic dynamics of anaerobic cellulose degradation, short-chain fatty acid production, and methane gas production using solid-, solution-, and gas-state (triple-phase) NMR spectroscopy.

2.5. Triple-Phase Monitoring of Anaerobic Digestion Using NMR Spectroscopy

The results of the present study, acquired using triple-phase NMR spectroscopy, are schematically summarized in Figure 5 and show the entire microbial anaerobic degradation process, starting with a solid biomass substrate composed of crystalline and amorphous BC and resulting in the generation of biogases and low-molecular-weight soluble end products (Figure 5). Through the thermophilic anaerobic digestion of crystalline and amorphous BC, we were able to observe one of the material circulations from solid biomass. Carbon dioxide was initially generated and accompanied by an allomorphic change in the crystalline structure of BC. Following this, the crystalline and amorphous forms of BC were converted to organic acids such as acetic acid and propionic acid. When BC was converted to low-molecular-weight products, the signals of incompletely fermented carbohydrates, for example, glucose, were not detected. We attribute this to the immediate conversion of glucose to organic acids such that the levels of glucose during the process were below the detection limit.
Figure 4. Gas-state 1H- and 13C-NMR spectra using a double-tube method. (A) 1H- and (B) 13C-NMR spectra of a mixture of standard gases (70% CH4 and 30% CO2). (C) 1H- and (D) 13C-NMR spectra of biogas from the anaerobic digestion ecosystem.
Molecules 18 09021 g004
Figure 5. Summary of the thermophilic microbial degradation of BC. The reactions are divided into 3 stages as follows: hydrolysis, acidification, and CH4 production. The starting BC substrate was highly crystalline, and its CrI decreased during hydrolysis. Once BC was degraded to glucose, it was immediately catabolized to mainly C2 to C4 metabolites by acidification (top left). C2 acetate was the main source of CH4 and CO2 (top right).
Molecules 18 09021 g005
We monitored the entire anaerobic degradation process, starting with a solid biomass substrate and resulting in the generation of gases, using only NMR spectroscopy, which is the only available technique for simultaneously determining triple-phase reactants and products. We believe that this represents a significant advancement in analyzing novel and ready-made bioprocesses such as the methane fermentation process, reported in this manuscript. Moreover, NMR analysis promises to promote further understanding of chemical reactions occurring in microbial community. Such knowledge is indispensable to maximize the efficiency of microbial processes in practical applications.

3. Experimental

3.1. General

13C-labeled BC produced by G. xylinus was used as substrate. BC (420 mg) was added to 100 mL anaerobic sludge in 200 mL stirred tank reactors at a constant temperature of 55 °C and gradually incubated for 120 h with microbiota in the anaerobic sludge. The identities and levels of 13C-labeled BC degradation products were determined from CP/MAS spectra recorded on a Bruker AV800 spectrometer, and 1H- and 13C-NMR spectra were recorded on a Bruker AV700 spectrometer. Data were analyzed using multivariate statistical analyses that included PCA and 2D correlation analysis (see below).

3.2. Materials

13C-labeled BC was produced by cultures of G. xylinus supplemented with 13C6-glucose (13C > 99%) purchased from Cambridge Isotope Laboratories (Andover, MA, USA) as described previously [9,10,11,12]. The pellicles of 13C-BC produced by G. xylinus were converted into powder using an automill machine (Tokken Inc., Chiba, Japan). Powdered 13C-BC was incubated in stirred tank reactors at a constant temperature of 55 °C for 120 h with thermophilic anaerobic digestion sludge provided by Kajima Corporation, Japan as described previously [23]. Two mL of samples were collected from the reactors at 0, 13, 24, 37, 42, 48, 54, 60, 66, 72, 84, 96, 108, 114, and 120 h after addition of the 13C-BC. The samples were centrifuged (16,500 × g for 15 min at room temperature) to separate the pellets from the supernatants for solid- and solution-state NMR measurements.

3.3. Solid-State NMR Spectroscopy

Solid-state NMR experiments were performed using an AVANCE-800 spectrometer (Bruker-BioSpin, Billerica, MA, USA) with a Bruker 4-mm MAS triple resonance probe according to previous reports, with slight modifications [9,11]. The rotor was filled with 5–20 mg of precipitate containing 13C-BC using polytetrafluoroethylene (PTFE) thread-seal tape (AS ONE Co., Ltd.) as a spacer. The MAS frequency was fixed at 12 kHz. The contact time for CP/MAS and the recycle delay were set to 1 ms and 2 s, respectively. Glycine (specifically, the 13C-chemical shift of its carbonyl carbon at 176.03 ppm) was used as the external reference. The acquired spectra were manually phased and baseline-corrected. For peak separation, the line-broadening factor was set to 100 Hz for 0–72 h and 200 Hz for 84–120 h. The NMR data were reduced by subdividing spectra into sequential 0.15 ppm regions between 13C-chemical shifts of 50–112 ppm. The binned data were normalized according to the signal-to-noise ratio of each spectrum and the total intensity. Peak separation was performed using Fityk 0.9.8 [31] with the following parameters: “Function type” was “Gaussian”, “fit method” was “Levenberg–Marquardt,” and “add peak” was “manual” [32,33].

3.4. Solution-State NMR Spectroscopy

Supernatants suspended in 10% (v/v) deuterium oxide (D2O) and 1 mM sodium 2,2-dimethyl-2-silapentane-5-sulfonate (DSS)-d6 served as an internal standard. All NMR spectra were recorded using a Bruker AVENCEII-700 spectrometer equipped with an 1H inverse triple-resonance cryoprobe with Z-axis gradients. The temperature of NMR samples was maintained at 298 K. For 1H NMR spectra, 32768 data points with a spectral width of 12,500 Hz were collected into 256 transients and 1 dummy scan, and residual water signals were suppressed using a Watergate pulse sequence with a recycle delay of 1 s and mixing time of 500 ms. Before Fourier transformation, the free induction decays were multiplied by an exponential window function corresponding to a 2.0-Hz line-broadening factor. For 13C-NMR spectra, 66,560 data points with a spectral width of 42,613.637 Hz were collected into 3,072 transients and 2 dummy scans with a recycle delay of 3 s. Before Fourier transformation, the free induction decays were multiplied by an exponential window function corresponding to a 10.0-Hz line-broadening factor. The acquired spectra were manually phased and baseline-corrected. NMR spectra were processed using NMRPipe software [34] and assigned using the SpinAssign program on the PRIMe website [35,36,37].

3.5. Gas-State NMR Spectroscopy

Methane and carbon dioxide gas (99.9% pure) were purchased from GL Sciences Inc. (Tokyo, Japan). Biogas was collected in a plastic bag and used for gas-state NMR analysis. We performed NMR analysis using a 5-mm-diameter normal NMR tube (sealed with a rubber plug) with the thin NMR tube (2-mm diameter) that was filled with 100 mM DSS-d6/D2O solution and flame-sealed. The produced biogas was introduced into the 5-mm NMR tube with the thin NMR tube at 4 atmospheres using a gas-tight syringe after evacuation. The thin NMR tube plays important roles in solvent lock, tuning of the shim, and as a semi-internal standard for quantification. Gas-state NMR spectra were measured using a Bruker AVANCEII-700 spectrometer equipped with a 1H inverse triple-resonance CryoProbe with Z-axis gradients. The temperature of the NMR samples was maintained at 298 K. For 1H-NMR spectra, 65,536 data points with a spectral width of 9,803.922 Hz were collected into 64 transients and 1 dummy scan. For 13C-NMR spectra, 65,536 data points with a spectral width of 52083.332 Hz were collected into 256 transients and 4 dummy scans. Before Fourier transformation, the free induction decays were multiplied by an exponential window function corresponding to 0.3-Hz and 1.0-Hz line-broadening factors. The acquired spectra were manually phased and baseline-corrected. NMR spectra were processed using TopSpin 3.1 (Bruker).

3.6. Statistical Analysis

1H- and 13C-solution-state NMR data were reduced by subdividing spectra into sequential 0.04 ppm-designated regions between 1H chemical shifts of −0.5 to 9.5 ppm and 0.05 ppm-designated regions between 13C-chemical shifts of 8–65 and 113–200 ppm. After exclusion of water resonance, each region was integrated and normalized to the total of the DSS-d6 integral regions. 13C-solid-state NMR data were reduced by subdividing spectra into sequential 0.8 ppm-designated regions between 13C-chemical shifts of 3–200 ppm. The binned data were statistically evaluated by PCA using “R” software according to a previous study [23,38]. A 2D correlation map was calculated as an asymmetric matrix between 13C-CP-MAS/NMR data and 1H- or 13C-solution-state NMR data using Spearman’s rank correlation coefficient according to previous studies [18,23].

4. Conclusions

In the present study, we show that anaerobic microbial degradation can be evaluated using a conventional metabolomic analysis strategy applied to plant and animal systems for solution-state NMR in combination with solid- and gas-state NMR using compounds labeled with stable isotopes. We successfully monitored the metabolic dynamics of BC degradation and the production and consumption of short-chain fatty acids and methane using triple-phase NMR spectroscopy, which is the only available method that analyzes the reactions of solid, liquid, and gas phases using a single instrument. Further advancements in NMR analysis will help establish highly efficient microbial processes for producing materials and/or energy. Such microbial processes are indispensable factors to realize the sustainable society.

Supplementary Materials

Supplementary materials can be accessed at: https://www.mdpi.com/1420-3049/18/8/9021/s1.

Acknowledgments

The authors wish to thank Eisuke Chikayama and Yuuri Tsuboi (RIKEN) for stimulating discussion, technical assistance, and useful advice on NMR measurements and analysis. This research was supported in part by Grants-in-Aid for Scientific Research (C) (J.K.) and Advanced Low Carbon Technology Research and Developmental Program (ALCA to J.K.) from the Ministry of Education, Culture, Sports, Science, and Technology, Japan.

Conflicts of Interest

The authors declare no conflict of interest.

References

  1. Schink, B. Energetics of syntrophic cooperation in methanogenic degradation. Microbiol. Mol. Biol. Rev. 1997, 61, 262–280. [Google Scholar]
  2. Wahlen, M. The Global Methane Cycle. Annu. Rev. Earth Planet. Sci. 1993, 21, 407–426. [Google Scholar] [CrossRef]
  3. Chynoweth, D.P.; Owens, J.M.; Legrand, R. Renewable methane from anaerobic digestion of biomass. Renewable Energy 2001, 22, 1–8. [Google Scholar] [CrossRef]
  4. Klemm, D.; Heublein, B.; Fink, H.P.; Bohn, A. Cellulose: Fascinating biopolymer and sustainable raw material. Angew. Chem. Int. Ed. Engl. 2005, 44, 3358–3393. [Google Scholar] [CrossRef]
  5. Rubin, E.M. Genomics of cellulosic biofuels. Nature 2008, 454, 841–845. [Google Scholar] [CrossRef]
  6. Kikuchi, J.; Asakura, T. Use of 13C conformation-dependent chemical shifts to elucidate the local structure of a large protein with homologous domains in solution and solid state. J. Biochem. Biophys. Methods 1999, 38, 203–208. [Google Scholar] [CrossRef]
  7. Mao, J.D.; Holtman, K.M.; Franqui-Villanueva, D. Chemical structures of corn stover and its residue after dilute acid prehydrolysis and enzymatic hydrolysis: Insight into factors limiting enzymatic hydrolysis. J. Agric. Food Chem. 2010, 58, 11680–11687. [Google Scholar] [CrossRef]
  8. Mao, J.D.; Schmidt-Rohr, K. Accurate quantification of aromaticity and nonprotonated aromatic carbon fraction in natural organic matter by 13C solid-state nuclear magnetic resonance. Environ. Sci. Technol. 2004, 38, 2680–2684. [Google Scholar] [CrossRef]
  9. Mori, T.; Chikayama, E.; Tsuboi, Y.; Ishida, N.; Shisa, N.; Noritake, Y.; Moriya, S.; Kikuchi, J. Exploring the conformational space of amorphous cellulose using NMR chemical shifts. Carbohydr. Polym. 2012, 90, 1197–1203. [Google Scholar] [CrossRef]
  10. Ogura, T.; Date, Y.; Kikuchi, J. Differences in cellulosic supramolecular structure of compositionally similar rice straw affect biomass metabolism by paddy soil microbiota. PLoS One 2013, 8, e66919. [Google Scholar] [CrossRef]
  11. Okushita, K.; Chikayama, E.; Kikuchi, J. Solubilization mechanism and characterization of the structural change of bacterial cellulose in regenerated states through ionic liquid treatment. Biomacromolecules 2012, 13, 1323–1330. [Google Scholar] [CrossRef]
  12. Okushita, K.; Komatsu, T.; Chikayama, E.; Kikuchi, J. Statistical approach for solid-state NMR spectra of cellulose derived from a series of variable parameters. Polym. J. 2012, 44, 895–900. [Google Scholar] [CrossRef]
  13. Everroad, R.C.; Yoshida, S.; Tsuboi, Y.; Date, Y.; Kikuchi, J.; Moriya, S. Concentration of metabolites from low-density planktonic communities for environmental metabolomics using nuclear magnetic resonance spectroscopy. J. Vis. Exp. 2012, 62, e3163. [Google Scholar]
  14. Nakanishi, Y.; Fukuda, S.; Chikayama, E.; Kimura, Y.; Ohno, H.; Kikuchi, J. Dynamic omics approach identifies nutrition-mediated microbial interactions. J. Proteome Res. 2010, 10, 824–836. [Google Scholar]
  15. Ellis, J.K.; Athersuch, T.J.; Thomas, L.D.K.; Teichert, F.; Perez-Trujillo, M.; Svendsen, C.; Spurgeon, D.J.; Singh, R.; Jarup, L.; Bundy, J.G.; et al. Metabolic profiling detects early effects of environmental and lifestyle exposure to cadmium in a human population. BMC Med. 2012, 10, 61. [Google Scholar] [CrossRef] [Green Version]
  16. Sekiyama, Y.; Chikayama, E.; Kikuchi, J. Evaluation of a semipolar solvent system as a step toward heteronuclear multidimensional NMR-based metabolomics for 13C-labeled bacteria, plants, and animals. Anal. Chem. 2011, 82, 1643–1652. [Google Scholar] [CrossRef]
  17. Viant, M.R.; Bearden, D.W.; Bundy, J.G.; Burton, I.W.; Collette, T.W.; Ekman, D.R.; Ezernieks, V.; Karakach, T.K.; Lin, C.Y.; Rochfort, S.; et al. International NMR-based environmental metabolomics intercomparison exercise. Environ. Sci. Technol. 2009, 43, 219–225. [Google Scholar] [CrossRef]
  18. Date, Y.; Nakanishi, Y.; Fukuda, S.; Kato, T.; Tsuneda, S.; Ohno, H.; Kikuchi, J. New monitoring approach for metabolic dynamics in microbial ecosystems using stable-isotope-labeling technologies. J. Biosci. Bioeng. 2010, 110, 87–93. [Google Scholar] [CrossRef]
  19. Ebrahimi, H.P.; Shaghaghi, H.; Tafazzoli, M. Gauge invariant atomic orbital-density functional theory prediction of accurate gas phase H-1 and C-13 NMR chemical shifts. Concepts Magn. Reson. Part A 2011, 38A, 269–279. [Google Scholar] [CrossRef]
  20. LeMaster, C.B. Nuclear magnetic resonance spectroscopy of molecules in the gas phase. Prog. Nucl. Magn. Reson. Spectrosc. 1997, 31, 119–154. [Google Scholar]
  21. Makulski, W. An 2H(D) isotope shift in the 1H NMR spectra of water in gaseous environment of fluoromethanes. J. Mol. Struct. 2007, 839, 90–93. [Google Scholar] [CrossRef]
  22. Tafazzoli, M.; Shaghaghi, H.; Jalali-Heravi, M. Calculations of gas phase 1H NMR chemical shifts of alcohols: An approach to optimize basis functions using factorial design. Concepts Magn. Reson. Part A 2008, 32A, 157–167. [Google Scholar] [CrossRef]
  23. Date, Y.; Iikura, T.; Yamazawa, A.; Moriya, S.; Kikuchi, J. Metabolic sequences of anaerobic fermentation on glucose-based feeding substrates based on correlation analyses of microbial and metabolite profiling. J. Proteome Res. 2012, 11, 5602–5610. [Google Scholar]
  24. Kikuchi, J.; Williamson, M.P.; Shimada, K.; Asakura, T. Structure and dynamics of photosynthetic membrane-bound proteins in Rhodobacter Sphaeroides, studied with solid-state NMR spectroscopy. Photosynth. Res. 2000, 63, 259–267. [Google Scholar] [CrossRef]
  25. Larsson, P.T.; Westermark, U.; Iversen, T. Determination of the cellulose I alpha allomorph content in a tunicate cellulose by CP/MAS C-13-NMR spectroscopy. Carbohydr. Res. 1995, 278, 339–343. [Google Scholar] [CrossRef]
  26. Larsson, P.T.; Wickholm, K.; Iversen, T. A CP/MAS C-13 NMR investigation of molecular ordering in celluloses. Carbohydr. Res. 1997, 302, 19–25. [Google Scholar] [CrossRef]
  27. Wickholm, K.; Larsson, P.T.; Iversen, T. Assignment of non-crystalline forms in cellulose I by CP/MAS C-13 NMR spectroscopy. Carbohydr. Res. 1998, 312, 123–129. [Google Scholar] [CrossRef]
  28. Ek, R.; Wormald, P.; Ostelius, J.; Iversen, T.; Nystrom, C. Crystallinity Index of Microcrystalline Cellulose Particles Compressed into Tablets. Int. J. Pharm. 1995, 125, 257–264. [Google Scholar] [CrossRef]
  29. Morrow, J.S.; Keim, P.; Visscher, R.B.; Marshall, R.C.; Gurd, F.R. Interaction of 13CO2 and bicarbonate with human hemoglobin preparations. Proc. Natl. Acad. Sci. USA 1973, 70, 1414–1418. [Google Scholar] [CrossRef]
  30. O'Leary M, H.; Jaworski, R.J.; Hartman, F.C. C nuclear magnetic resonance study of the CO2 activation of ribulosebisphosphate carboxylase from rhodospirillum rubrum. Proc. Natl. Acad. Sci. USA 1979, 76, 673–675. [Google Scholar] [CrossRef]
  31. Wojdyr, M. Fityk: A general-purpose peak fitting program. J. Appl. Cryst. 2010, 43, 1126–1128. [Google Scholar] [CrossRef]
  32. Kono, H.; Erata, T.; Takai, M. Complete assignment of the CP/MAS C-13 NMR spectrum of cellulose IIII. Macromolecules 2003, 36, 3589–3592. [Google Scholar] [CrossRef]
  33. Kono, H.; Yunoki, S.; Shikano, T.; Fujiwara, M.; Erata, T.; Takai, M. CP/MAS C-13 NMR study of cellulose and cellulose derivatives. 1. Complete assignment of the CP/MAS C-13 NMR spectrum of the native cellulose. J. Am. Chem. Soc. 2002, 124, 7506–7511. [Google Scholar]
  34. Delaglio, F.; Grzesiek, S.; Vuister, G.W.; Zhu, G.; Pfeifer, J.; Bax, A. NMRPipe: A multidimensional spectral processing system based on unix pipes. J. Biomol. NMR 1995, 6, 277–293. [Google Scholar]
  35. Akiyama, K.; Chikayama, E.; Yuasa, H.; Shimada, Y.; Tohge, T.; Shinozaki, K.; Hirai, M.Y.; Sakurai, T.; Kikuchi, J.; Saito, K. PRIMe: A web site that assembles tools for metabolomics and transcriptomics. In Silico Biol. 2008, 8, 339–345. [Google Scholar]
  36. Chikayama, E.; Sekiyama, Y.; Okamoto, Y.; Nakanishi, Y.; Tsuboi, Y.; Akiyama, K.; Saito, K.; Shinozaki, K.; Kikuchi, J. Statistical indices for simultaneous large-scale metabolite detections for a single NMR spectrum. Anal. Chem. 2010, 82, 1653–1658. [Google Scholar] [CrossRef]
  37. Chikayama, E.; Suto, M.; Nishihara, T.; Shinozaki, K.; Kikuchi, J. Systematic NMR analysis of stable isotope labeled metabolite mixtures in plant and animal systems: coarse grained views of metabolic pathways. PLoS One 2008, 3, e3805. [Google Scholar]
  38. Date, Y.; Sakata, K.; Kikuchi, J. Chemical profiling of complex biochemical mixtures from various seaweeds. Polym. J. 2012, 44, 888–894. [Google Scholar] [CrossRef]
  • Sample Availability: Not available.

