Combination of Small Molecule Microarray and Confocal Microscopy Techniques for Live Cell Staining Fluorescent Dye Discovery

Abstract
:1. Introduction
2. Results and Discussion
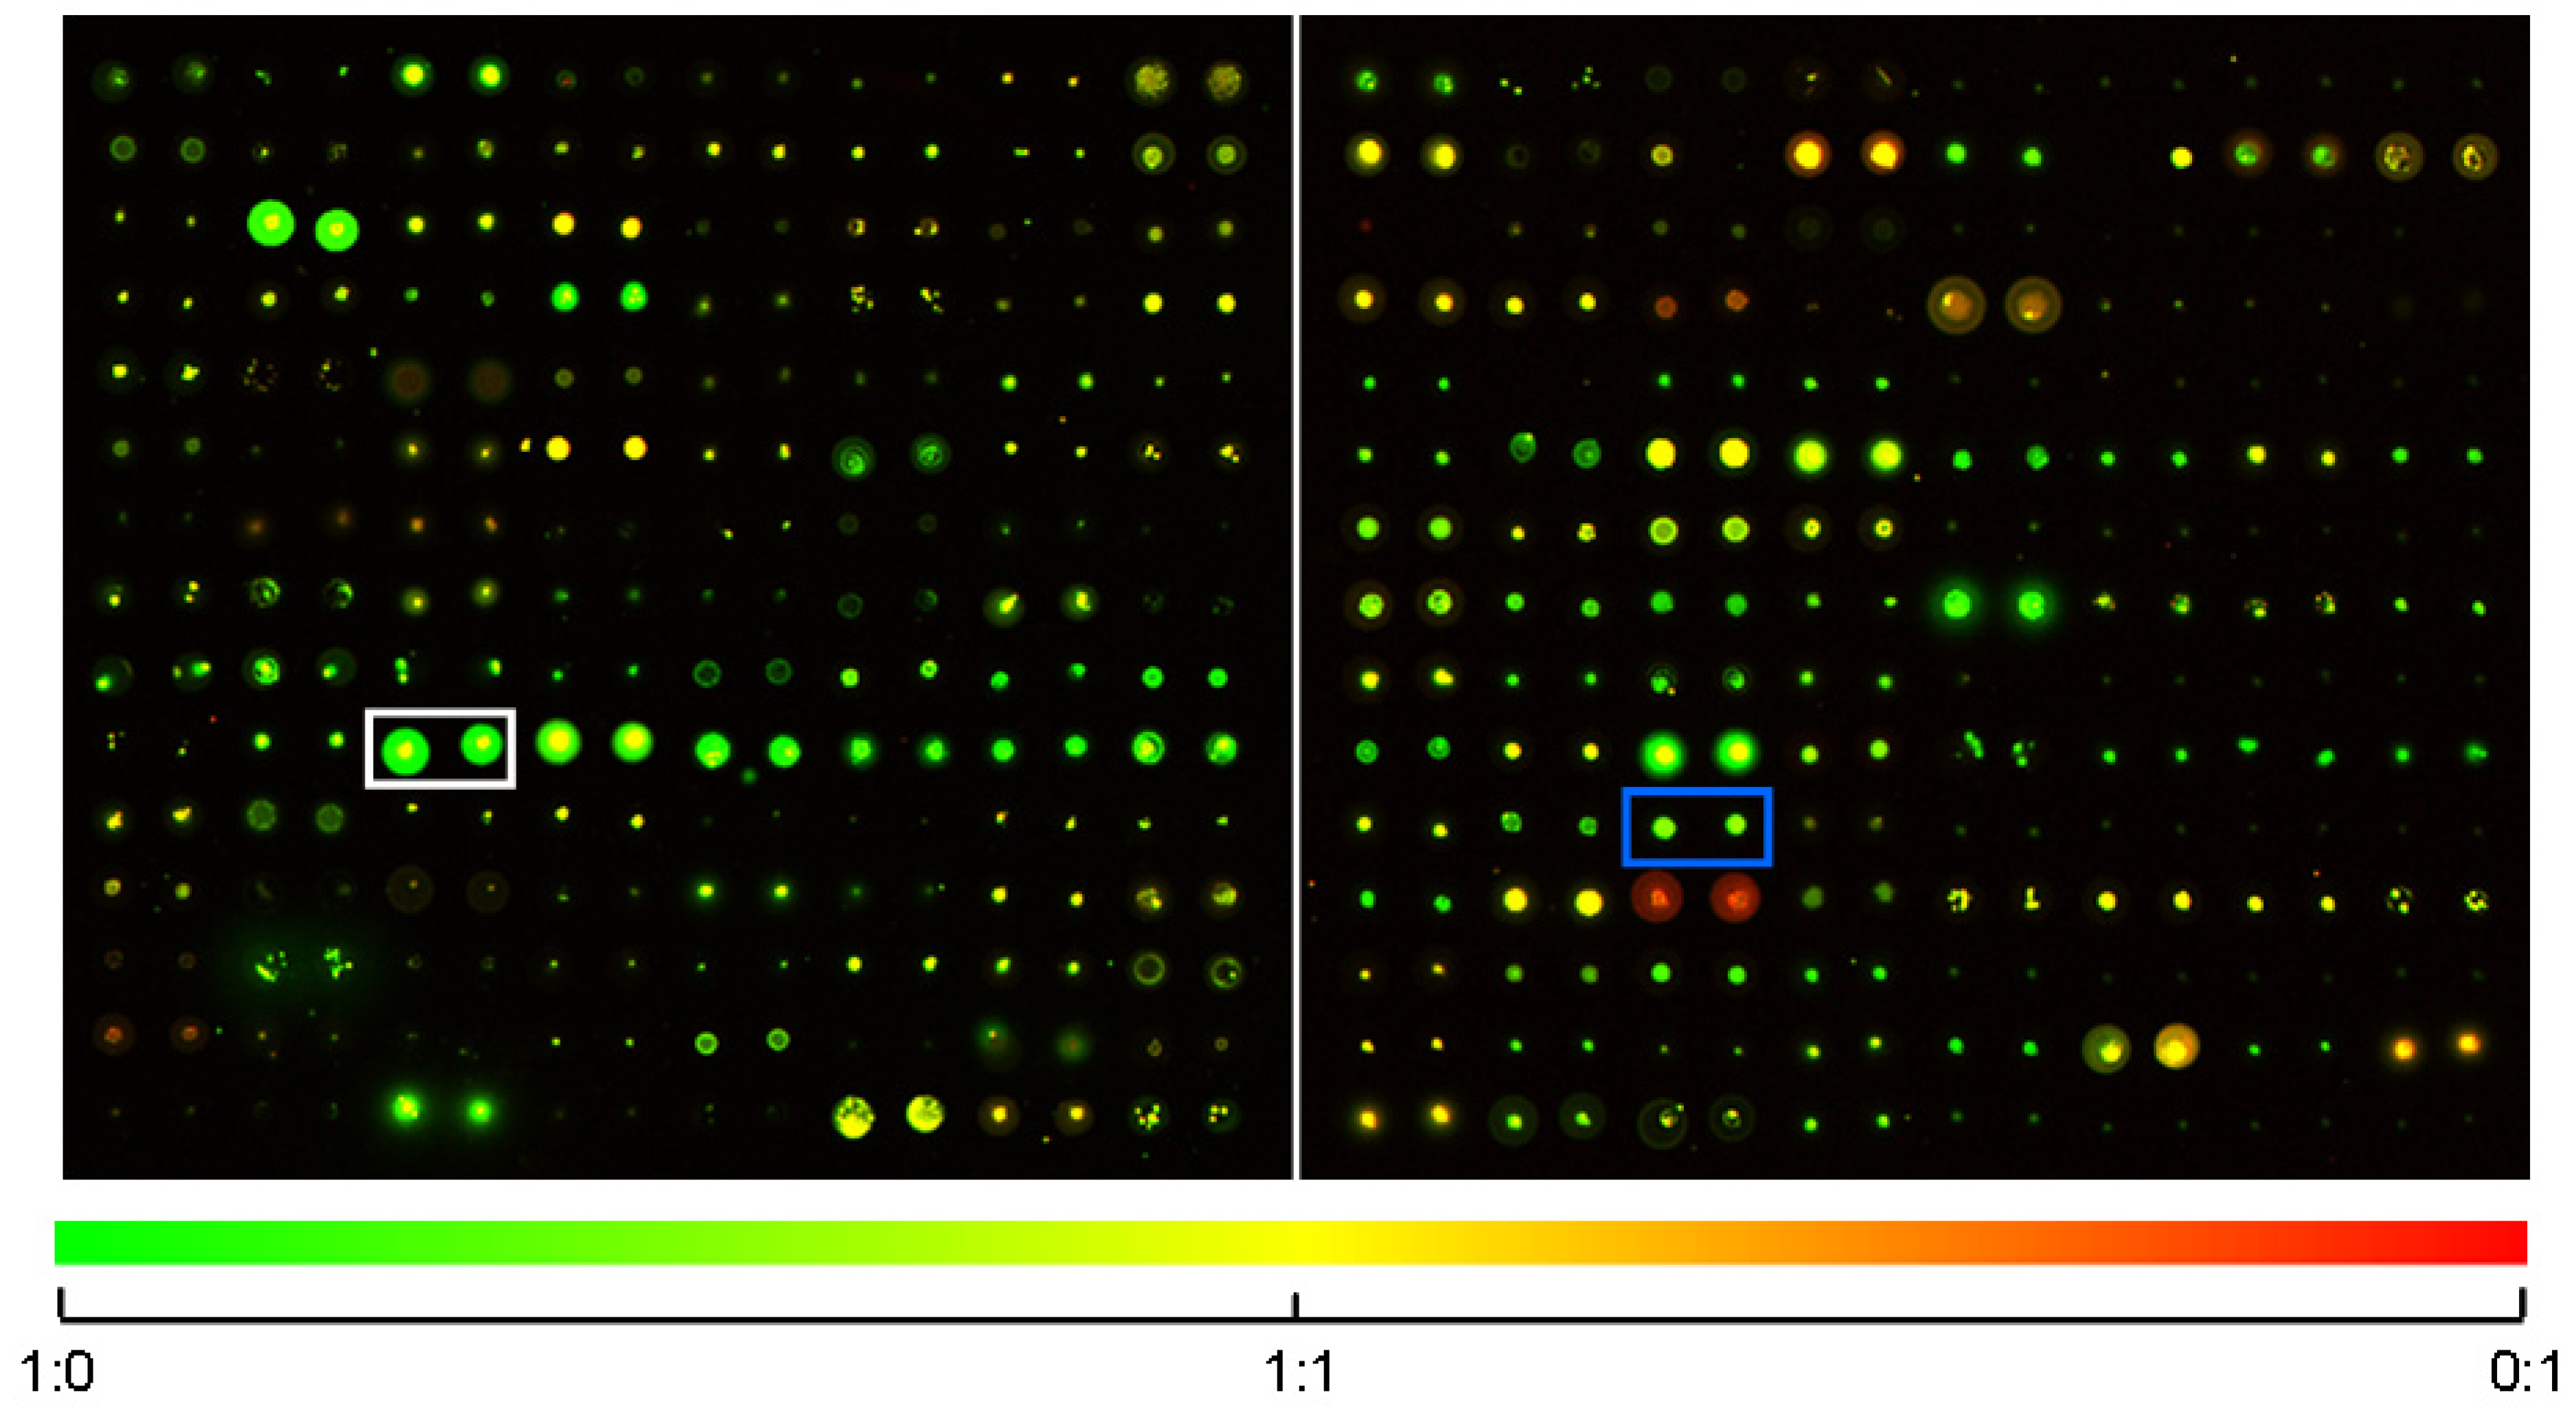
2.1. SMM Prescreening
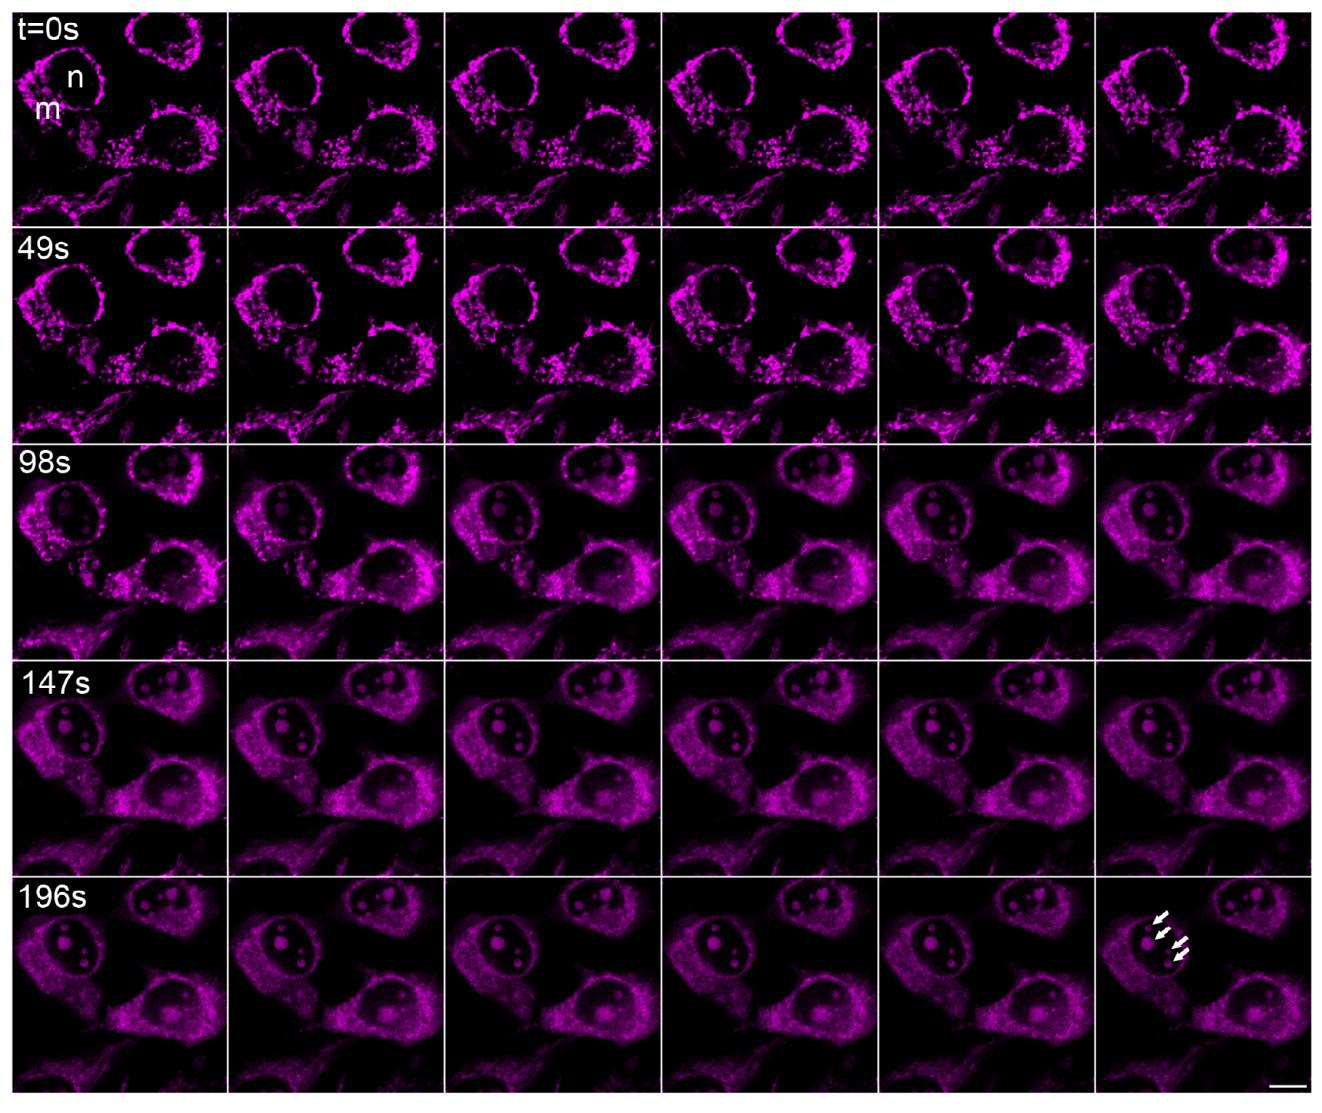
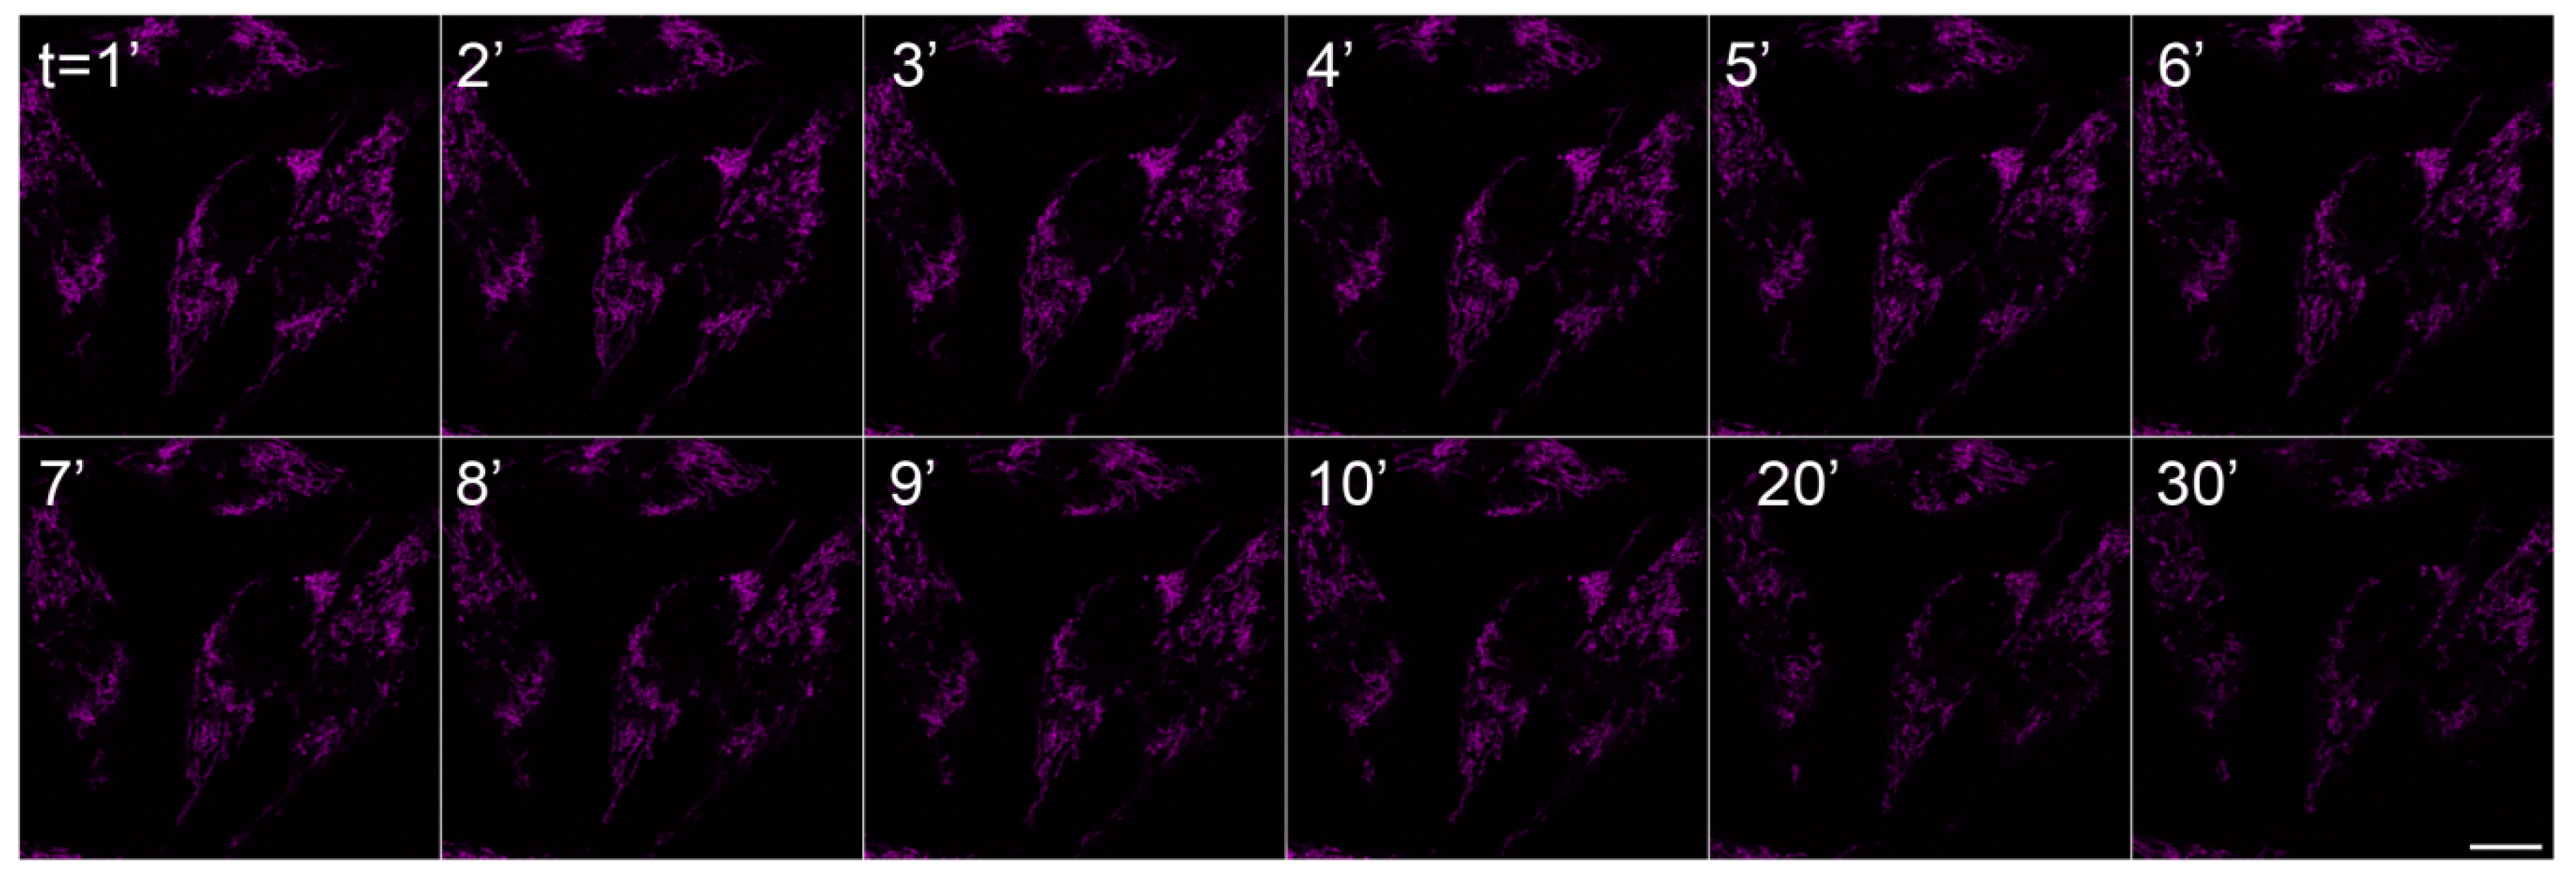
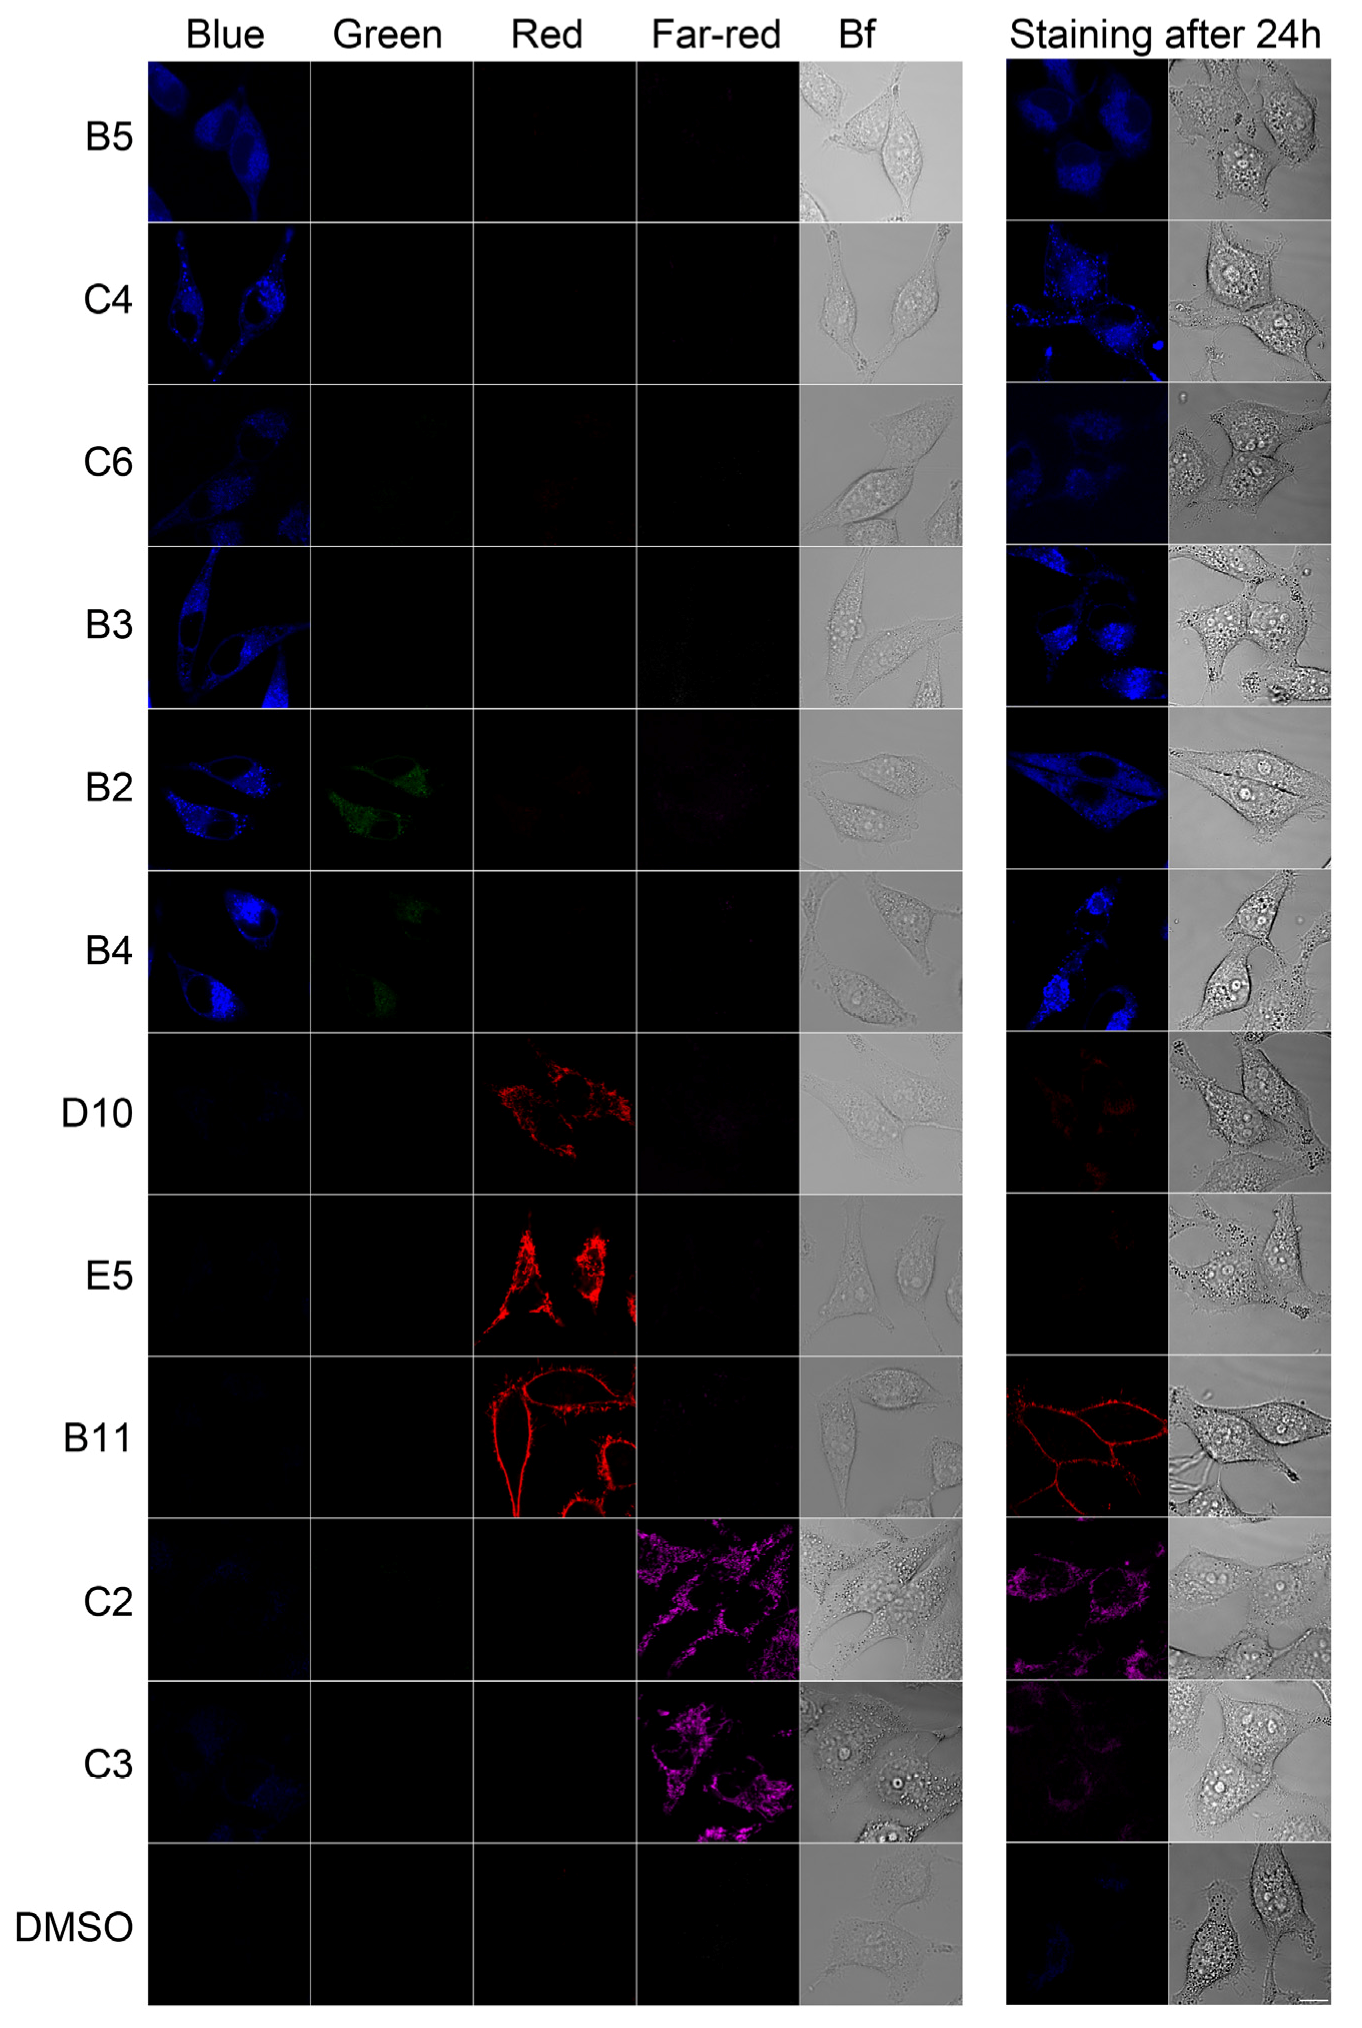
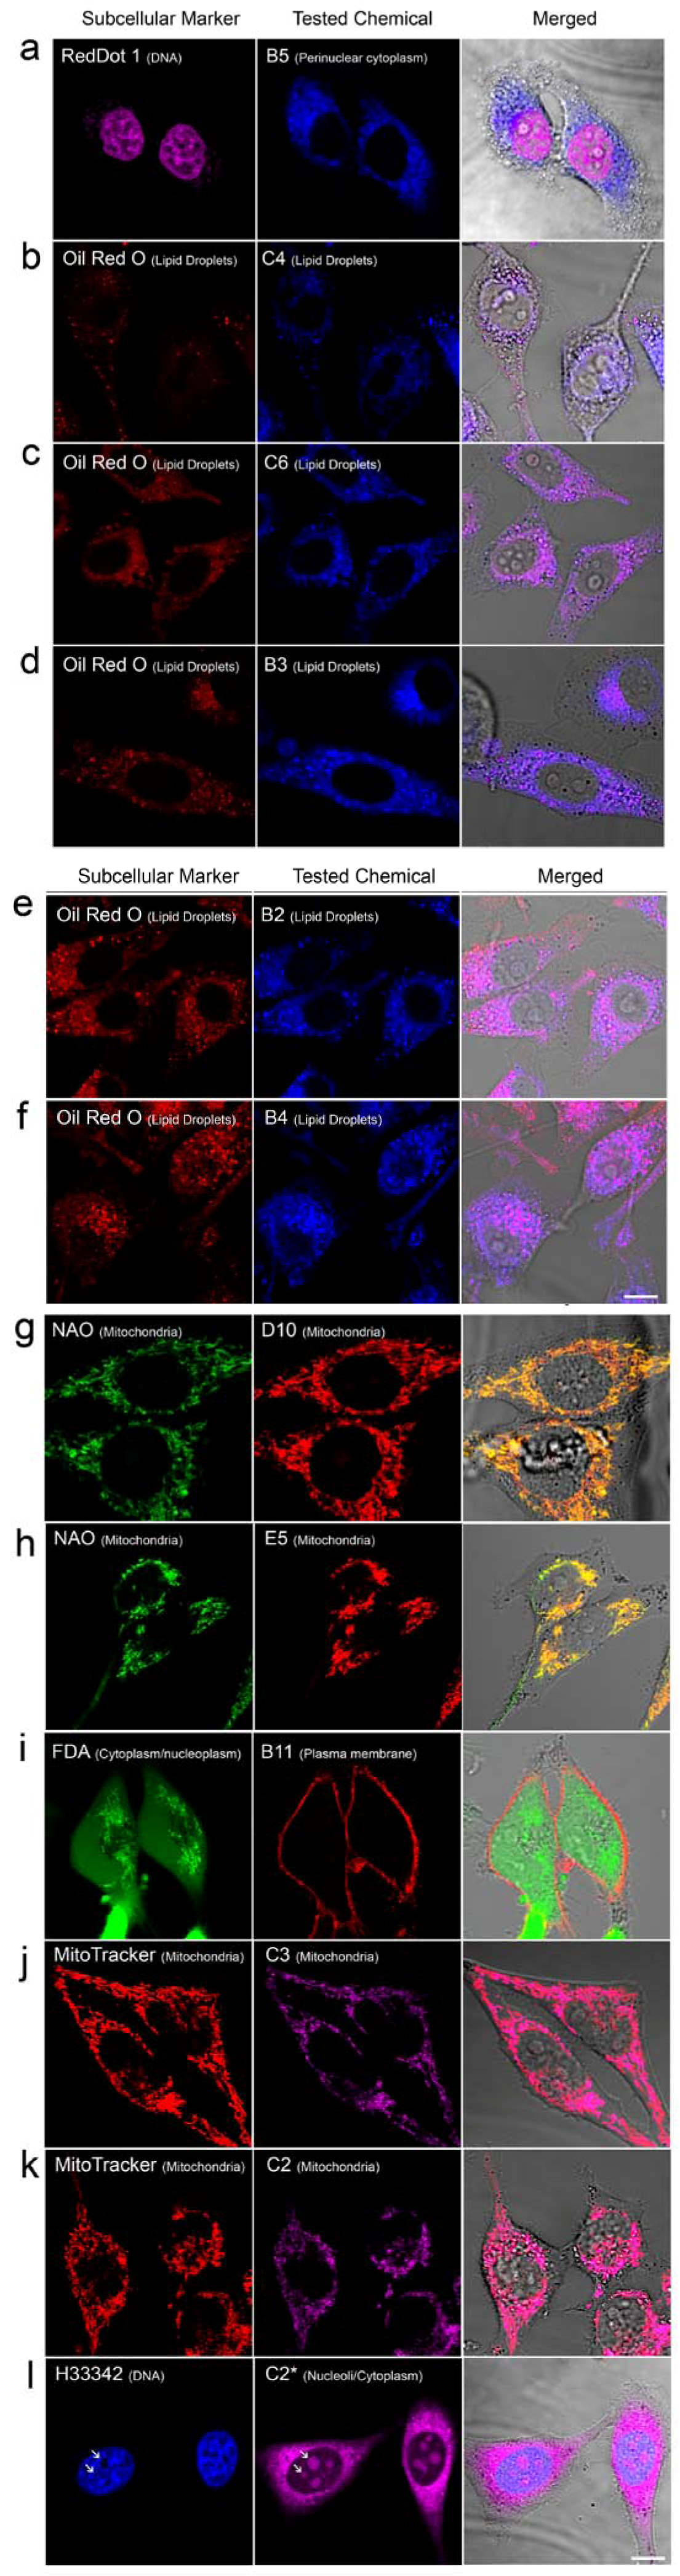
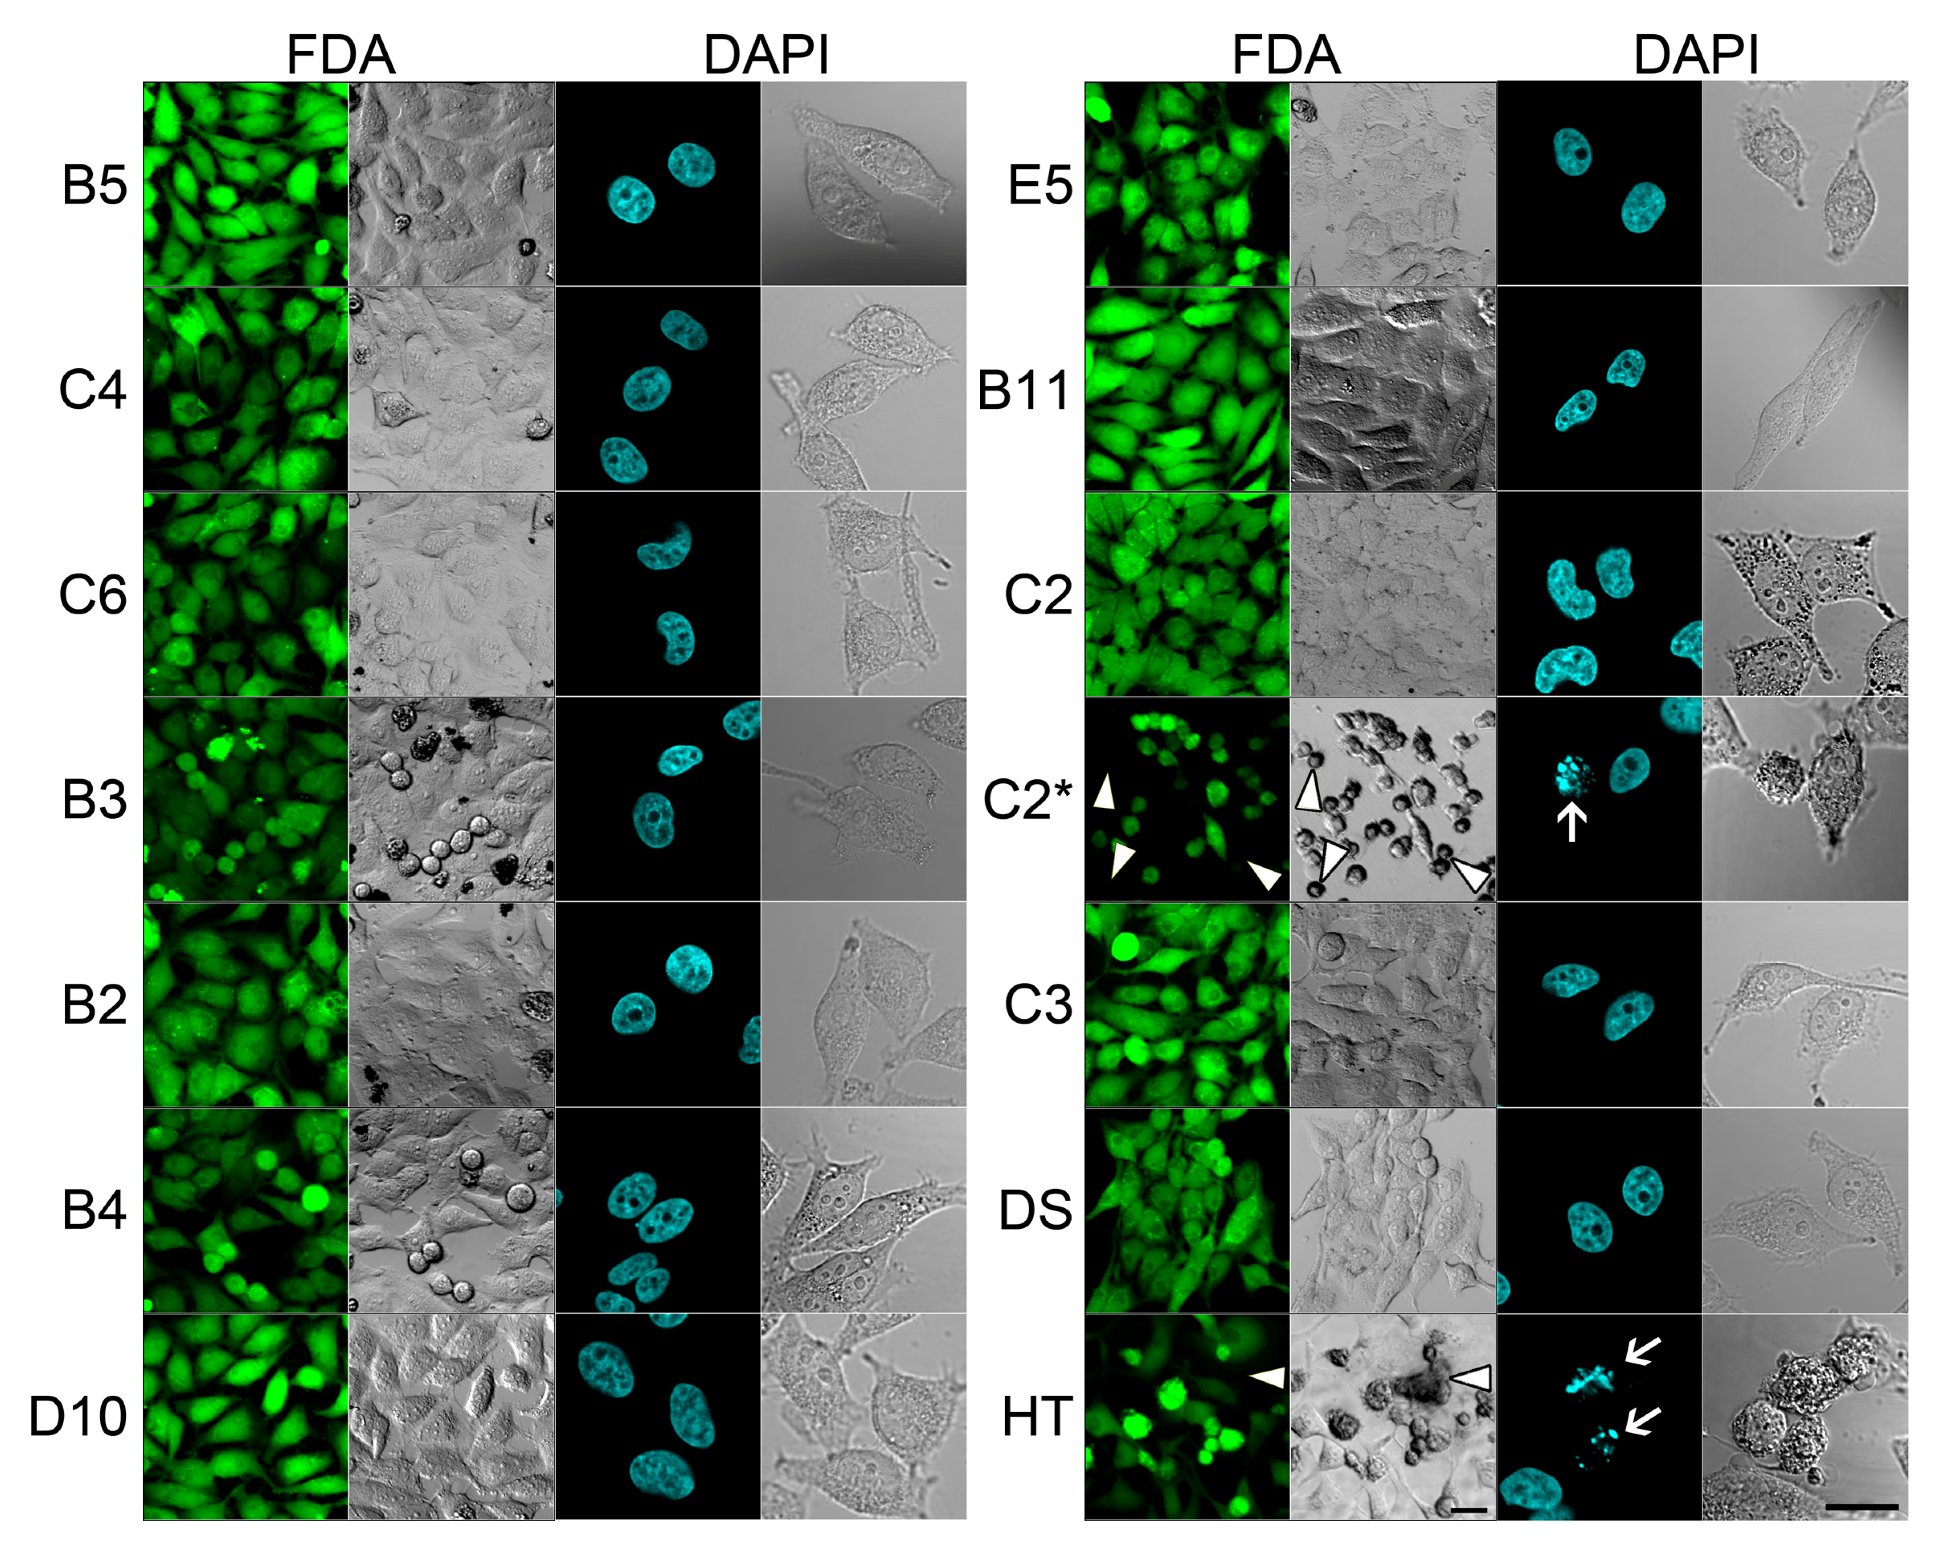
2.2. In Vivo Microscopy Studies

| ID | Structure, Localization, Color | ID | Structure, Localization, Color |
|---|---|---|---|
| B5 |  Perinuclear/cytoplasm (blue) | D10 |  Mitochondria (red) |
| C4 |  Lipid droplets (blue) | E5 | 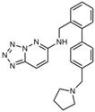 Mitochondria (red) |
| C6 |  Lipid droplets (blue) | B11 | 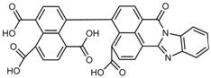 Plasma membrane (red) |
| B3 | 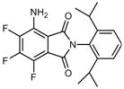 Lipid droplets (blue) | C2 |  Mitochondria/nucleolus convertible(far-red) |
| B2 | 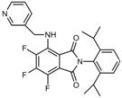 Lipid droplets (blue-green) | C3 |  Mitochondria (far-red) |
| B4 |  Lipid droplets (blue-green) | DMSO |  Solvent used as control (colorless) |


3. Experimental Section
3.1. Materials
3.2. Small Molecule Microarray (SMM)
3.2.1. Preparation
3.2.2. Signal Detection and Data Analysis
3.3. Cell Culturing
3.4. Cell treatment
3.4.1. Treatment with Selected Compounds
3.4.2. Co-Labeling
3.5. Confocal Laser Scanning Microscopy (CLSM)
4. Conclusions
Acknowledgments
Conflicts of Interest
References
- Tsien, R. Building and breeding molecules to spy on cells and tumors. FEBS Lett. 2005, 579, 927–932. [Google Scholar] [CrossRef]
- Weissleder, R.; Pittet, M. Imaging in the era of molecular oncology. Nature 2008, 452, 580–589. [Google Scholar] [CrossRef]
- Giepmans, B.N.G.; Adams, S.R.; Ellisman, M.H.; Tsien, R.Y. The Fluorescent Toolbox for Assessing Protein Location and Function. Science 2006, 312, 217–224. [Google Scholar] [CrossRef]
- Henrich, S.; Salo-Ahen, O.M.H.; Huang, B.; Rippmann, F.F.; Cruciani, G.; Wade, R.C. Computational approaches to identifying and characterizing protein binding sites for ligand design. J. Mol. Recognit. 2010, 23, 209–219. [Google Scholar]
- Manning, H.C.; Lander, A.; McKinley, E.; Mutic, N.J. Accelerating the development of novel molecular imaging probes: A role for high-throughput screening. J. Nucl. Med. 2008, 49, 1401–1404. [Google Scholar] [CrossRef]
- Simeonov, A.; Jadhav, A.; Thomas, C.J.; Wang, Y.; Huang, R.; Southall, N.T.; Shinn, P.; Smith, J.; Austin, C.P.; Auld, D.S.; et al. Fluorescence spectroscopic profiling of compound libraries. J. Med. Chem. 2008, 51, 2363–2371. [Google Scholar] [CrossRef]
- Lea, W.A.; Simeonov, A. Fluorescence polarization assays in small molecule screening. Expert Opin. Drug. Discov. 2011, 6, 17–32. [Google Scholar] [CrossRef]
- Yun, S.W.; Leong, C.; Zhai, D.; Tan, Y.L.; Lim, L.; Bi, X.; Lee, J.J.; Kim, H.J.; Kang, N.Y.; Ng, S.H.; et al. Neural stem cell specific fluorescent chemical probe binding to FABP7. P. Natl. Acad. Sci. USA 2012, 109, 10214–10217. [Google Scholar] [CrossRef]
- Li, Q.; Kim, Y.; Namm, J.; Kulkarni, A.; Rosania, G.R.; Ahn, Y.H.; Chang, Y.T. RNA-selective, live cell imaging probes for studying nuclear structure and function. Chem. Biol. 2006, 13, 615–623. [Google Scholar] [CrossRef]
- Hackler, L., Jr.; Dorman, G.; Kele, Z.; Urge, L.; Darvas, F.; Puskas, L.G. Development of chemically modified glass surfaces for nucleic acid, protein and small molecule microarrays. Mol. Divers. 2003, 7, 25–36. [Google Scholar] [CrossRef]
- Darvas, F.; Dorman, G.; Krajcsi, P.; Puskas, L.G.; Kovari, Z.; Lorincz, Z.; Urge, L. Recent advances in chemical genomics. Curr. Med. Chem. 2004, 11, 3119–3145. [Google Scholar] [CrossRef]
- Molnár, E.; Hackler, L.; Jankovics, T.; Ürge, L.; Darvas, F.; Fehér, L.Z.; Lőrincz, Z.; Dormán, G.; Puskás, L.G. Application of small molecule microarrays in comparative chemical proteomics. QSAR Comb. Sci. 2006, 25, 1020–1026. [Google Scholar] [CrossRef]
- Chen, J.; Armstrong, A.H.; Koehler, A.N.; Hecht, M.H. Small molecule microarrays enable the discovery of compounds that bind the Alzheimer’s Abeta peptide and reduce its cytotoxicity. J. Am. Chem. Soc. 2010, 132, 17015–17022. [Google Scholar] [CrossRef]
- Lee, H.Y.; Park, S.B. Surface modification for small-molecule microarrays and its application to the discovery of a tyrosinase inhibitor. Mol. Biosyst. 2011, 7, 304–310. [Google Scholar] [CrossRef]
- Shi, H.; Liu, K.; Xu, A.; Yao, S.Q. Small molecule microarray-facilitated screening of affinity-based probes (AfBPs) for gamma-secretase. Chem. Commun. 2009, 5030–5032. [Google Scholar]
- Vegas, A.J.; Bradner, J.E.; Tang, W.; McPherson, O.M.; Greenberg, E.F.; Koehler, A.N.; Schreiber, S.L. Fluorous-based small-molecule microarrays for the discovery of histone deacetylase inhibitors. Angew. Chem. Int. Ed. 2007, 46, 7960–7964. [Google Scholar] [CrossRef]
- Barnes-Seeman, D.; Park, S.B.; Koehler, A.N.; Schreiber, S.L. Expanding the functional group compatibility of small-molecule microarrays: Discovery of novel calmodulin ligands. Angew. Chem. Int. Edit. 2003, 42, 2376–2379. [Google Scholar] [CrossRef]
- Oheim, M. Advances and challenges in high-throughput microscopy for live-cell subcellular imaging. Expert Opin. Drug. Dis. 2011, 6, 1299–1315. [Google Scholar] [CrossRef]
- Haugland, R.P.; Spence, M.T.Z.; Johnson, I.D.; Basey, A. The Handbook: A Guide to Fluorescent Probes and Labeling Technologies, 10th ed.; Molecular Probes: Eugene, OR, USA, 2005. [Google Scholar]
- Puskas, L.G.; Feher, L.Z.; Vizler, C.; Ayaydin, F.; Raso, E.; Molnar, E.; Magyary, I.; Kanizsai, I.; Gyuris, M.; Madacsi, R.; et al. Polyunsaturated fatty acids synergize with lipid droplet binding thalidomide analogs to induce oxidative stress in cancer cells. Lipids Health Dis. 2010, 9, 56. [Google Scholar] [CrossRef]
- Marín, M.L.; Miguel, A.; Santos-Juanes, L.; Arques, A.; Amat, A.M.; Miranda, M.A. Involvement of triplet excited states in the electron transfer photodegradation of cinnamic acids using pyrylium and thiapyrylium salts as photocatalysts. Photochem. Photobiol. Sci. 2007, 8, 848–852. [Google Scholar]
- Alvarez, M.; Villanueva, A.; Acedo, P.; Cañete, M.; Stockert, J.C. Cell death causes relocalization of photosensitizing fluorescent probes. Acta Histochem. 2011, 113, 363–368. [Google Scholar] [CrossRef]
- Johnson, V.L.; Ko, S.C.; Holmstrom, T.H.; Eriksson, J.E.; Chow, S.C. Effector caspases are dispensable for the early nuclear morphological changes during chemical-induced apoptosis. J. Cell Sci. 2000, 113, 2941–2953. [Google Scholar]
- Sample Availability: Samples of the compounds B2–4 are available from the authors.
© 2013 by the authors; licensee MDPI, Basel, Switzerland. This article is an open access article distributed under the terms and conditions of the Creative Commons Attribution license (http://creativecommons.org/licenses/by/3.0/).
Share and Cite
Molnár, E.; Kuntam, S.; Cingaram, P.K.R.; Peksel, B.; Suresh, B.; Fábián, G.; Fehér, L.Z.; Bokros, A.; Medgyesi, Á.; Ayaydin, F.; et al. Combination of Small Molecule Microarray and Confocal Microscopy Techniques for Live Cell Staining Fluorescent Dye Discovery. Molecules 2013, 18, 9999-10013. https://doi.org/10.3390/molecules18089999
Molnár E, Kuntam S, Cingaram PKR, Peksel B, Suresh B, Fábián G, Fehér LZ, Bokros A, Medgyesi Á, Ayaydin F, et al. Combination of Small Molecule Microarray and Confocal Microscopy Techniques for Live Cell Staining Fluorescent Dye Discovery. Molecules. 2013; 18(8):9999-10013. https://doi.org/10.3390/molecules18089999
Chicago/Turabian StyleMolnár, Eszter, Soujanya Kuntam, Pradeep Kumar Reddy Cingaram, Begüm Peksel, Bhavyashree Suresh, Gabriella Fábián, Liliána Z. Fehér, Attila Bokros, Ágnes Medgyesi, Ferhan Ayaydin, and et al. 2013. "Combination of Small Molecule Microarray and Confocal Microscopy Techniques for Live Cell Staining Fluorescent Dye Discovery" Molecules 18, no. 8: 9999-10013. https://doi.org/10.3390/molecules18089999