Enhanced QSAR Model Performance by Integrating Structural and Gene Expression Information

Abstract
:
1. Introduction
2. Results
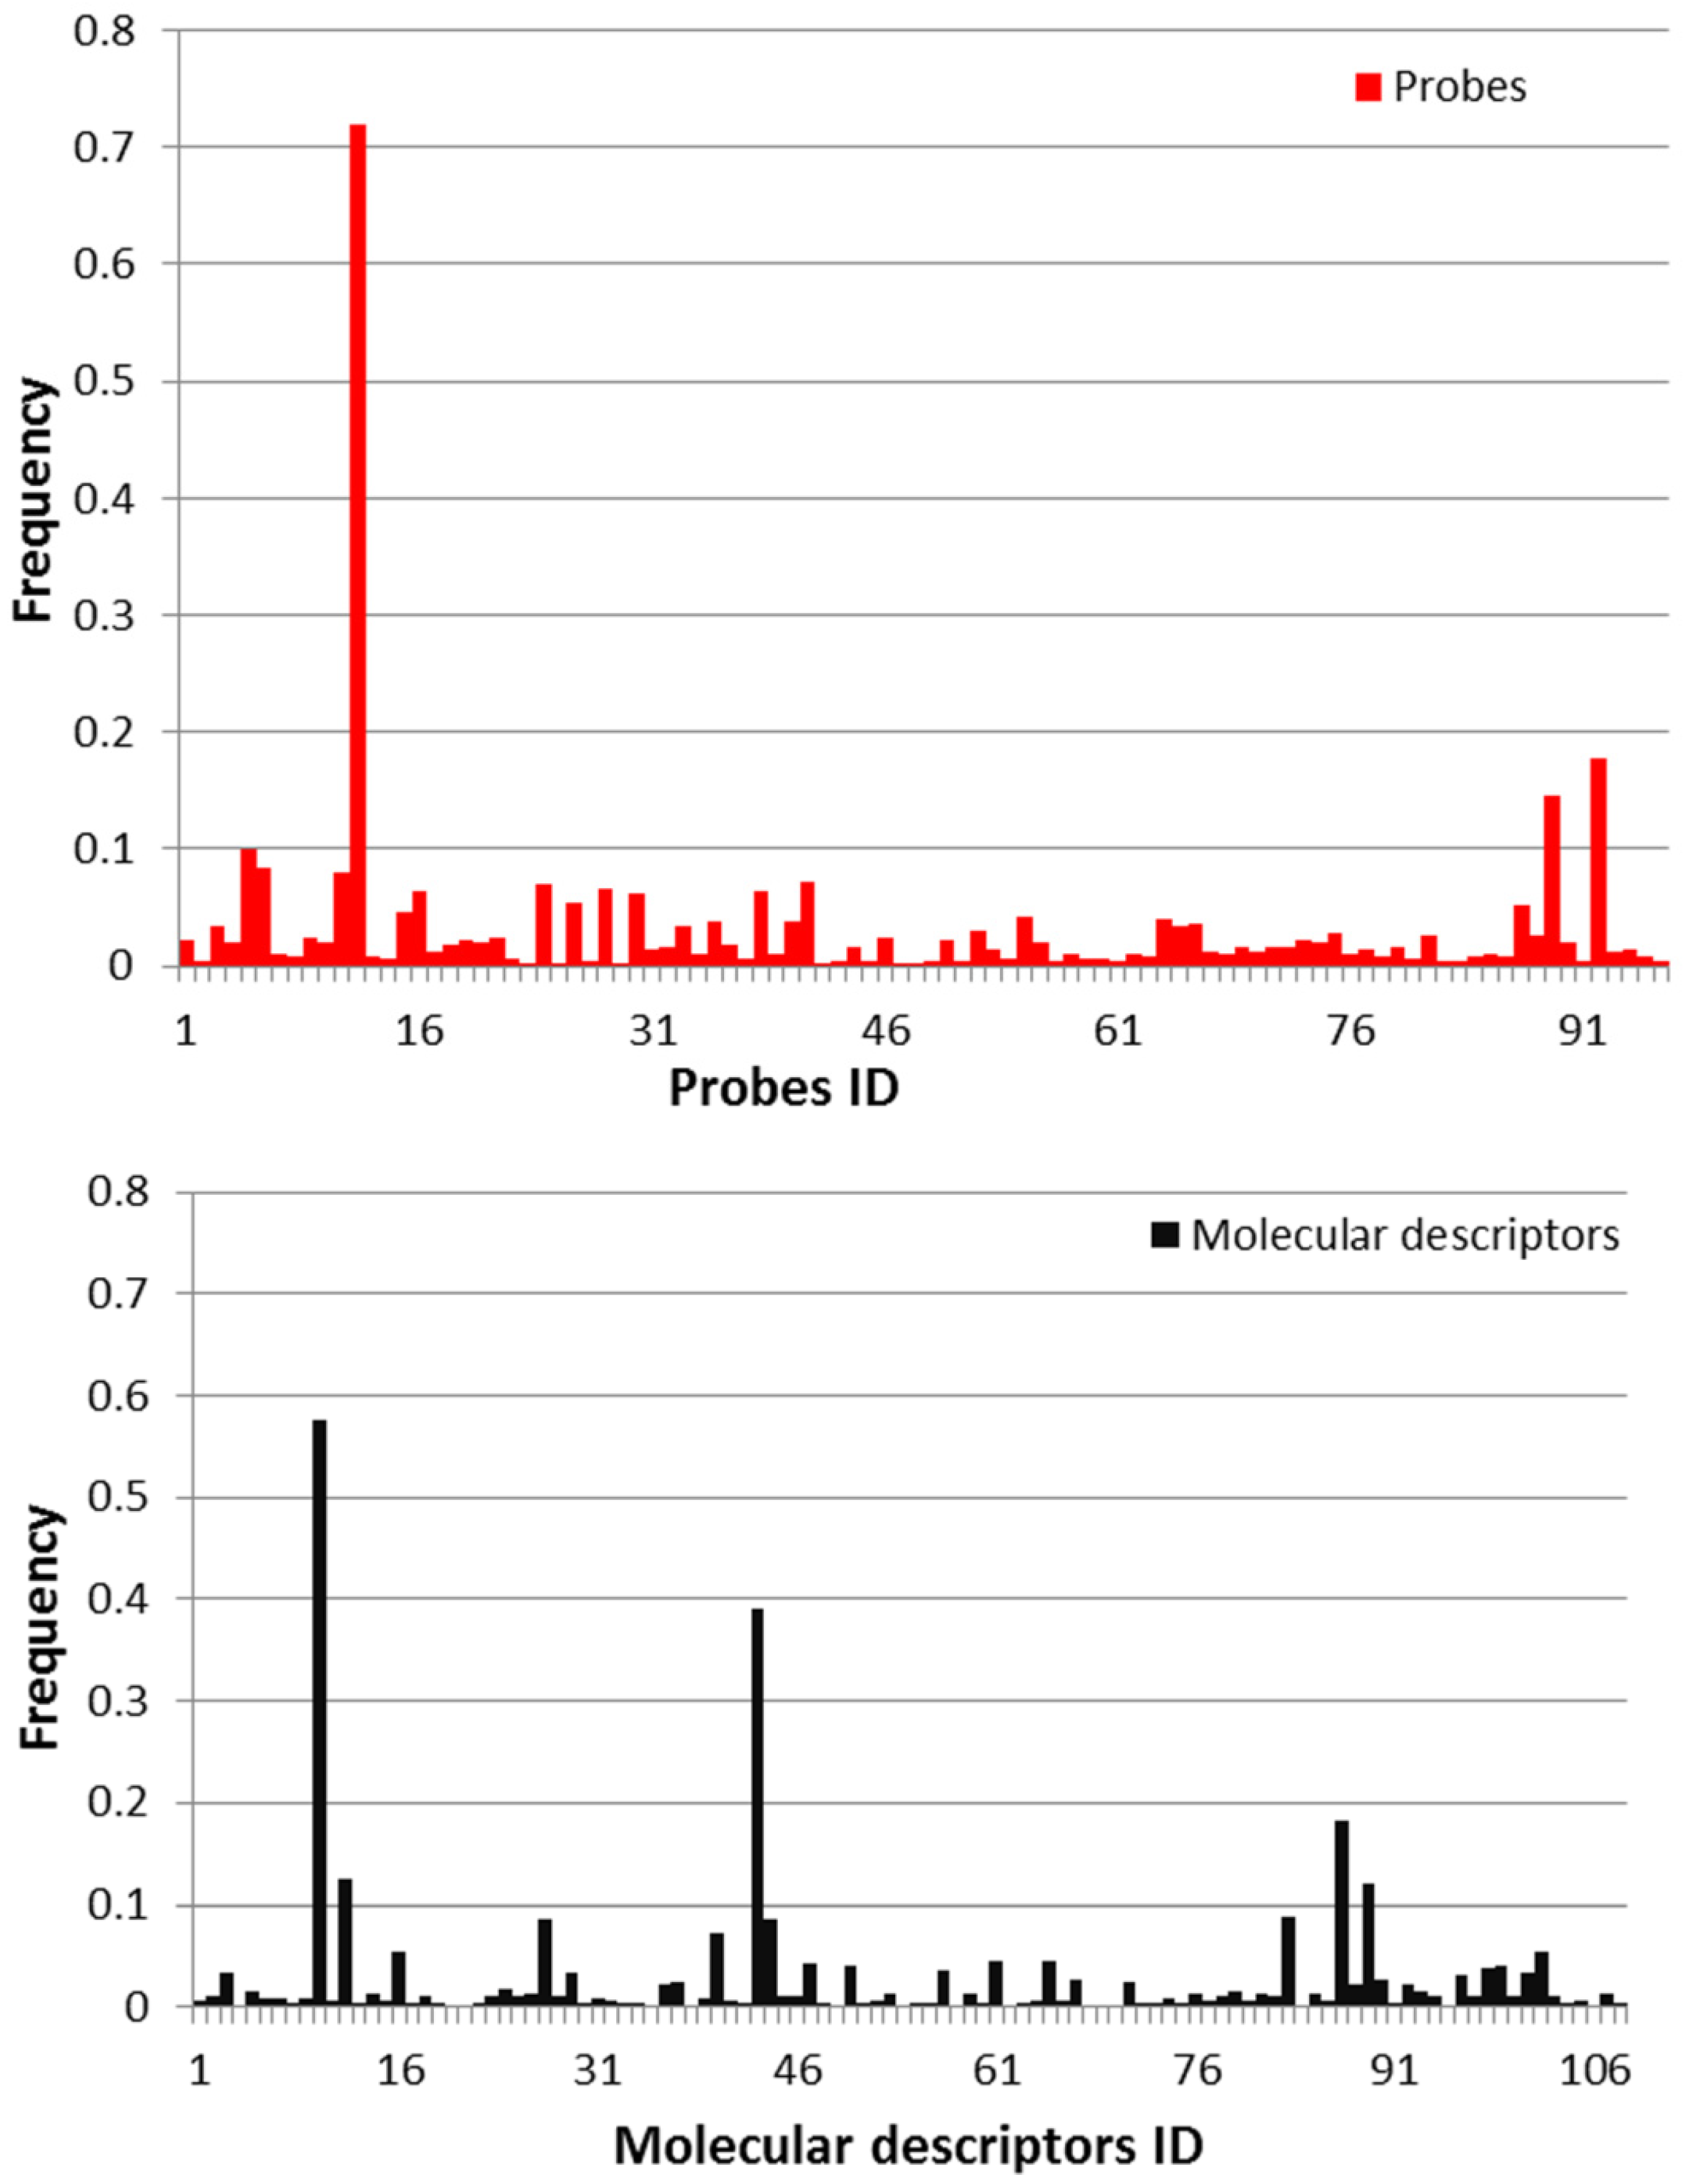
2.1. Molecular Descriptors and Gene Expression Features Selection

| Feature Classes | Descriptors | Descriptions | Frequency |
|---|---|---|---|
| molecular descriptors | nN | number of nitrogen atoms | 0.58 |
| CIC2 | complementary information content (neighborhood symmetry of 2-order) | 0.39 | |
| C-005 | CH3X | 0.18 | |
| nS | number of Sulfur atoms | 0.13 | |
| C-008 | CHR2X | 0.12 | |
| probes | JnJRn0195 | Mt1a | 0.72 |
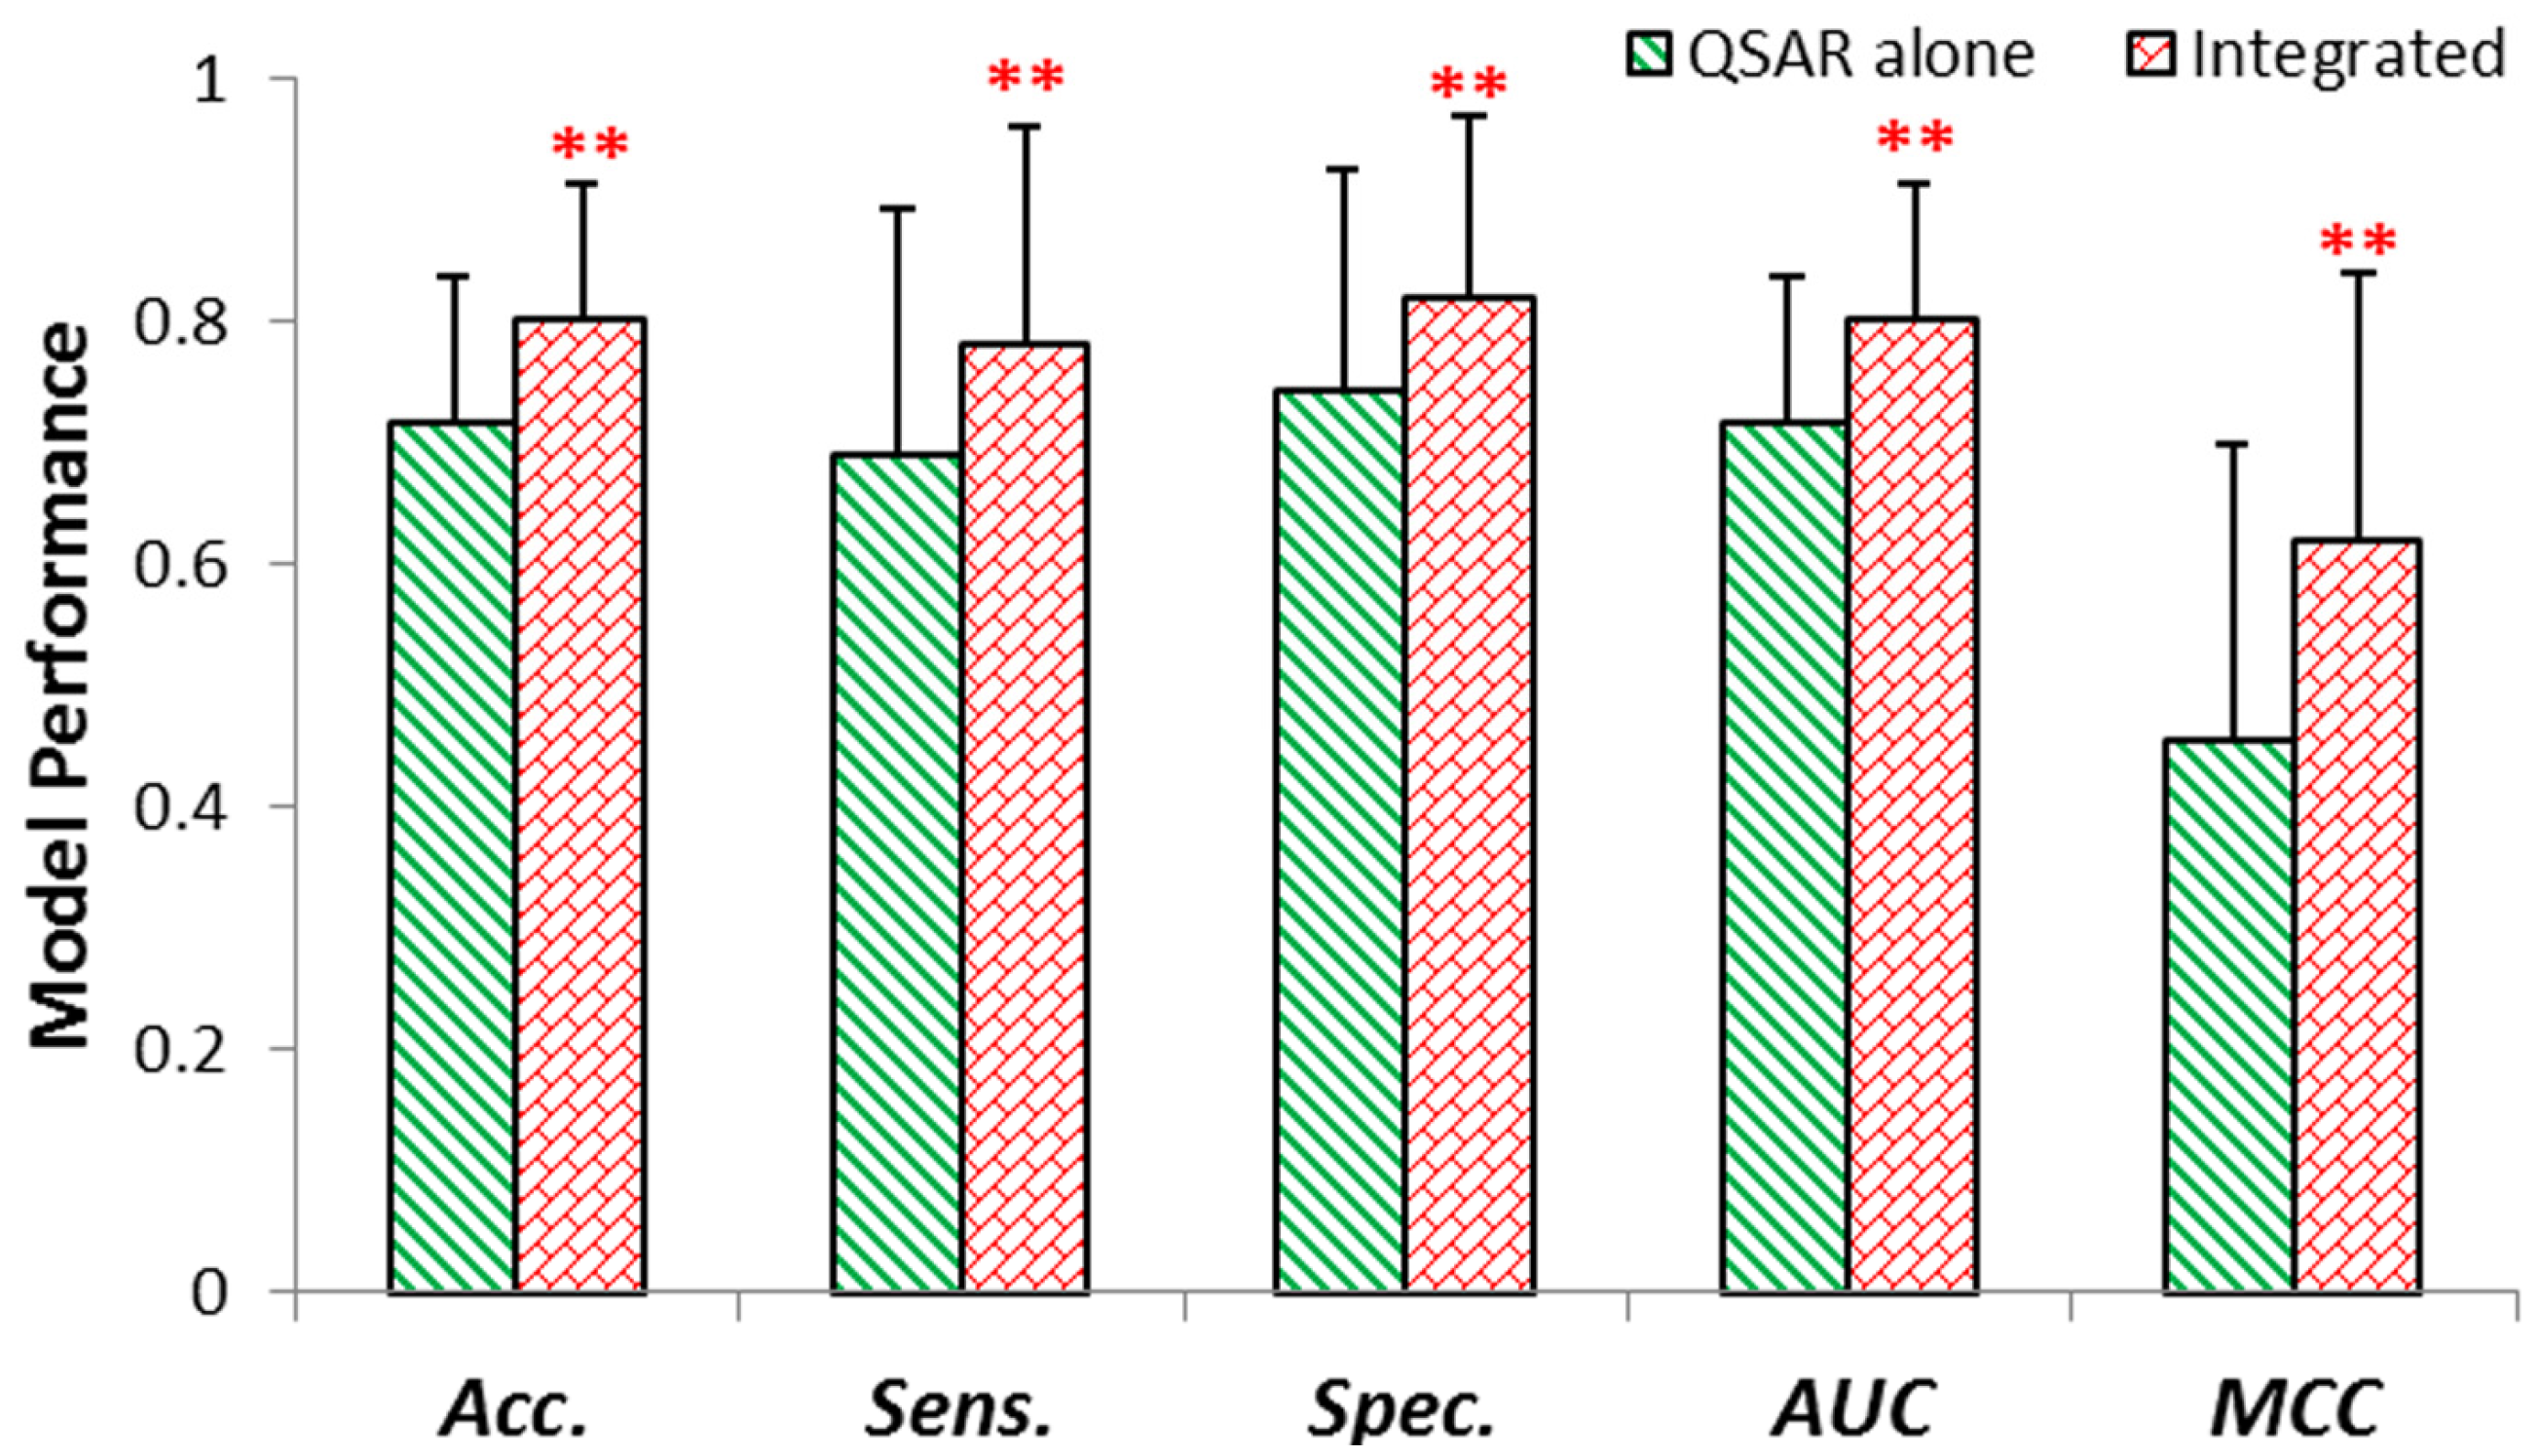
2.2. Internal Validation of QSAR & Integrated Model


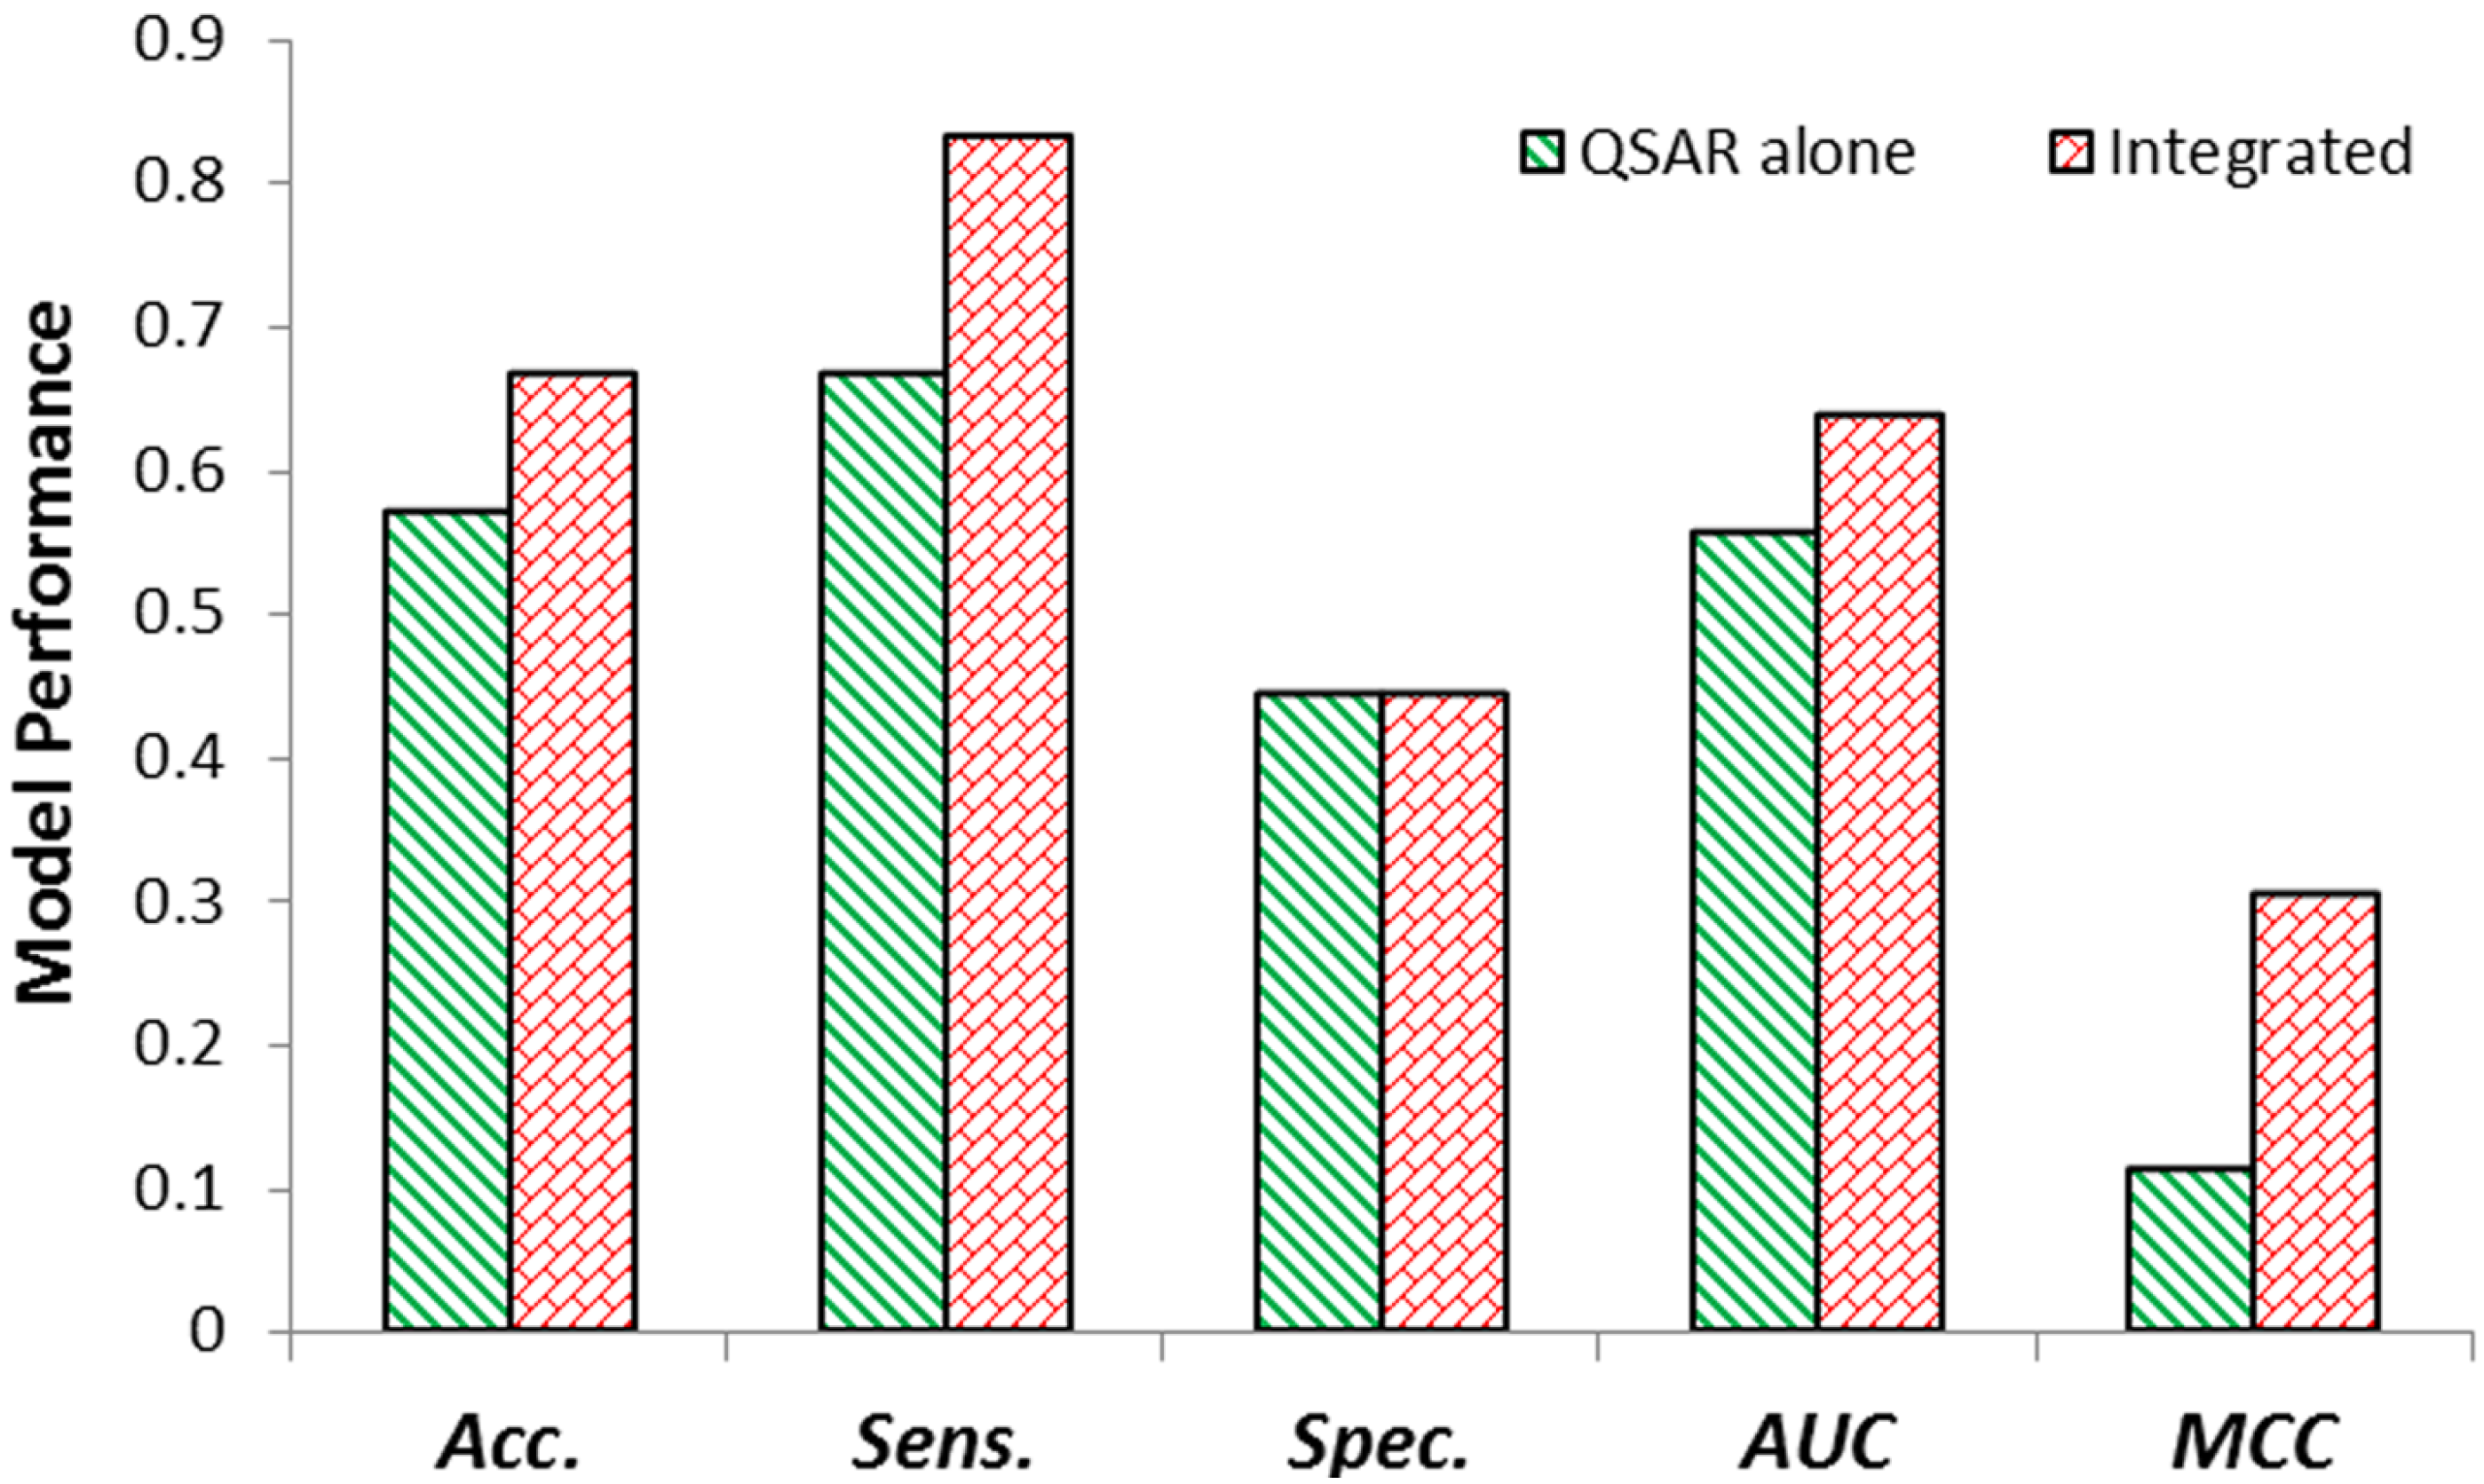
2.3. External Validation of QSAR & Integrated Model
3. Discussion
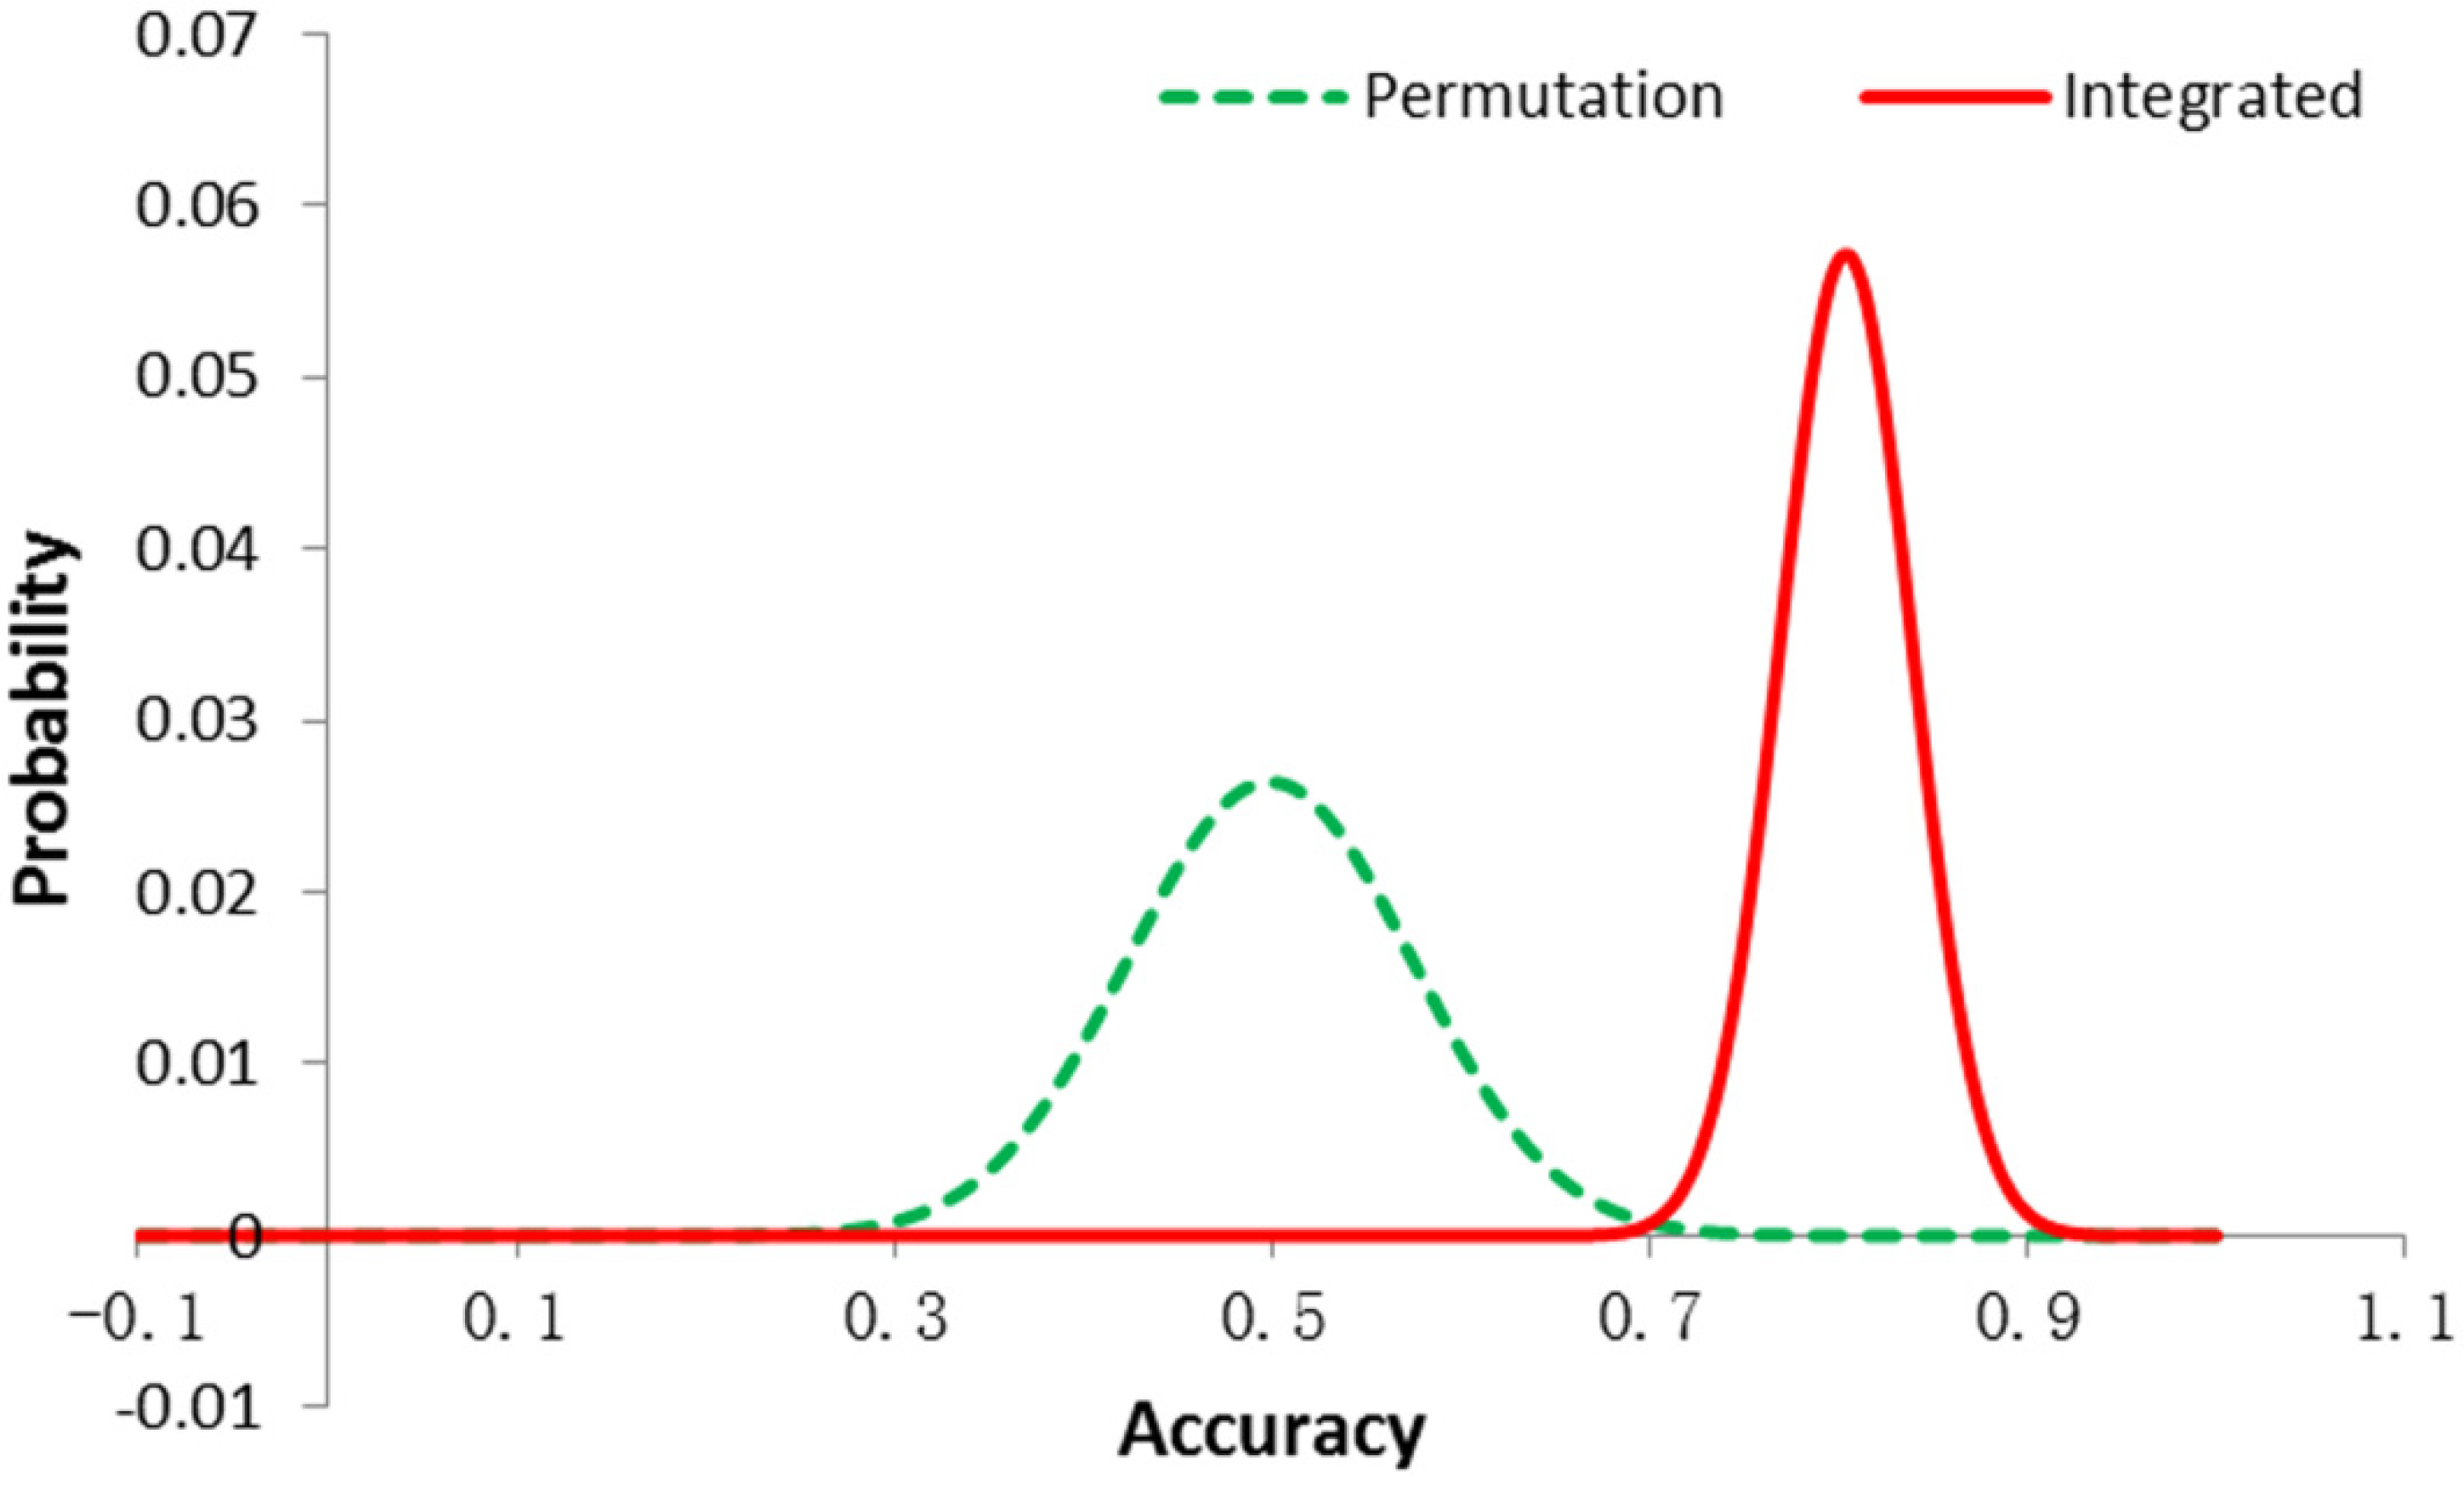
3.1. Permutation Test
3.2. Selection of Descriptors
3.3. Potential Action of the Signature Gene in the Carcinogenesis of Compounds
4. Materials and Methods
4.1. Toxicogenomics Dataset
4.2. Molecular Descriptors
| Training set | Test set | |
|---|---|---|
| Samples | 57 | 21 |
| Actives | 27 | 12 |
| Inactives | 30 | 9 |
| Descriptors | 929→108→5 | |
| Probes | 1471→96→1 | |
4.3. Software
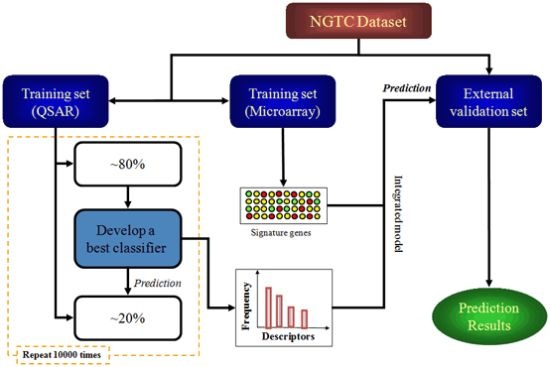
4.4. Study Design
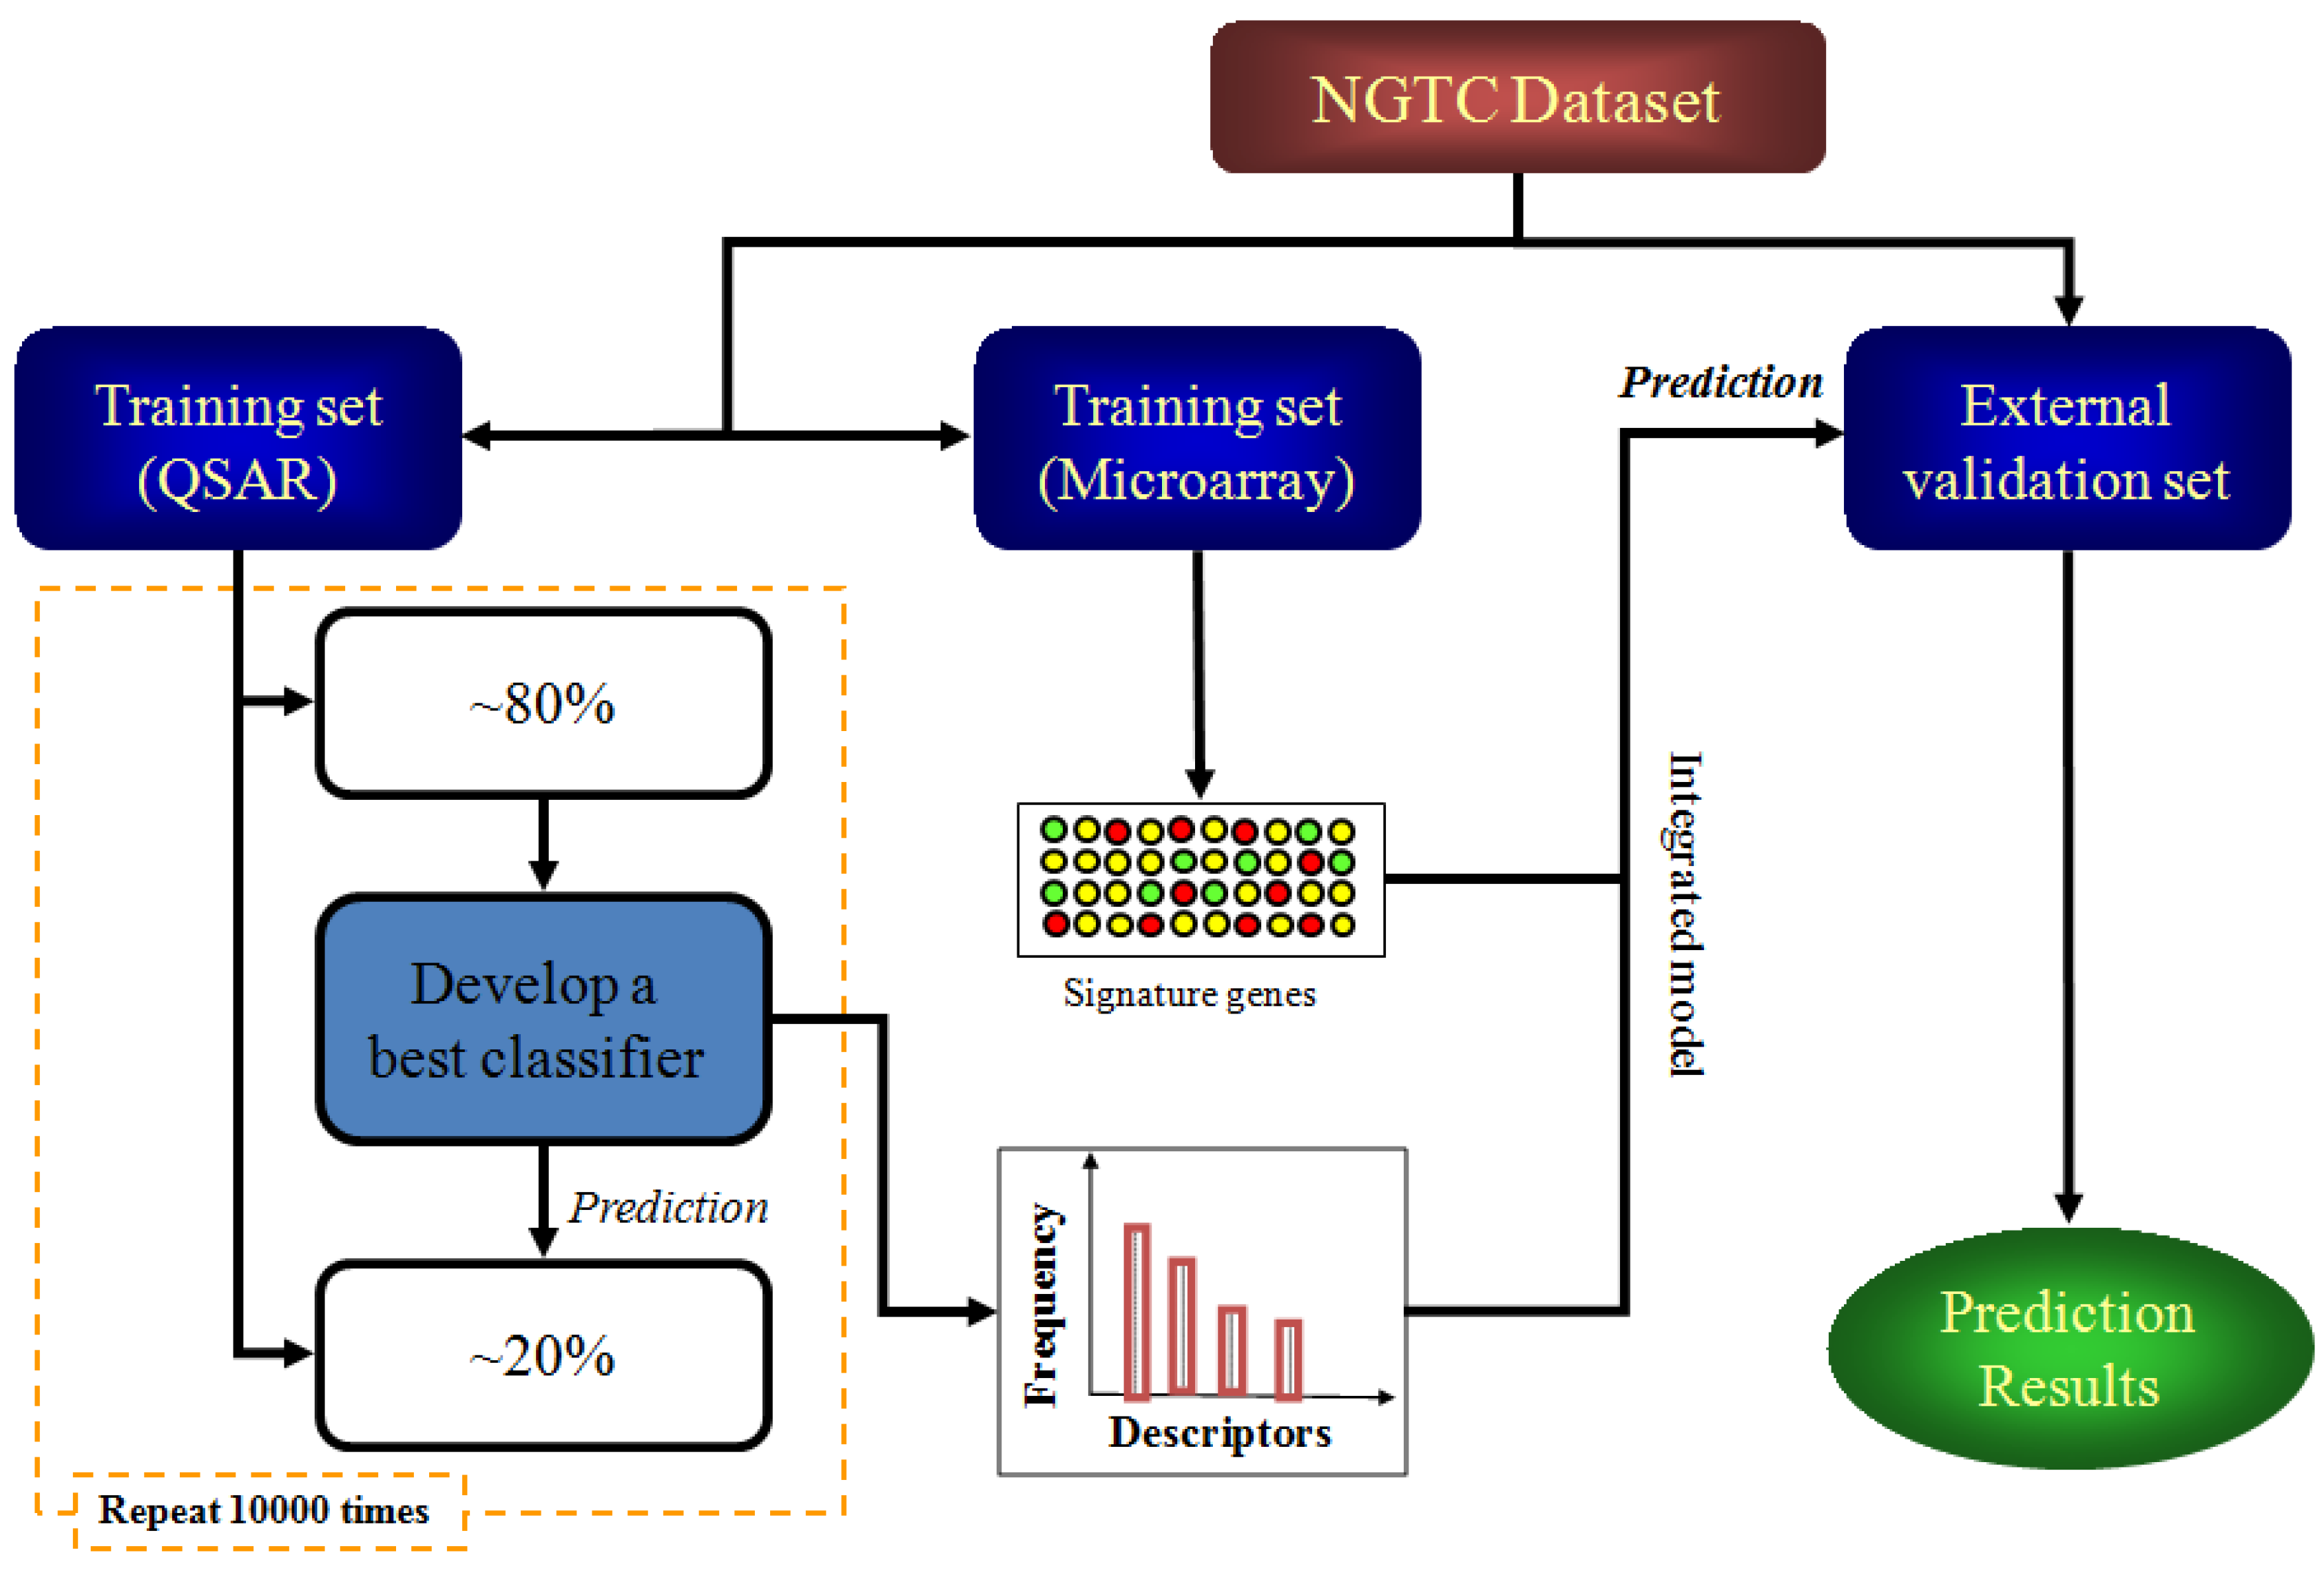
4.5. Model Construction and Validation
5. Conclusions
Supplementary Materials
Acknowledgments
Conflicts of Interest
References
- Bradbury, S.P. Quantitative structure-activity relationships and ecological risk assessment: An overview of predictive aquatic toxicology research. Toxicol. Lett. 1995, 79, 229–237. [Google Scholar] [CrossRef]
- Loizou, G.; Spendiff, M.; Barton, H.A.; Bessems, J.; Bois, F.Y.; d’Yvoire, M.B.; Buist, H.; Clewell, H.J., III; Meek, B.; Gundert-Remy, U. Development of good modelling practice for physiologically based pharmacokinetic models for use in risk assessment: The first steps. Regul. Toxicol. Pharmacol. 2008, 50, 400–411. [Google Scholar] [CrossRef]
- Lill, M.A. Multi-dimensional QSAR in drug discovery. Drug Discov. Today 2007, 12, 1013–1017. [Google Scholar] [CrossRef]
- Frecer, V.; Miertus, S. Design, structure-based focusing and in silico screening of combinatorial library of peptidomimetic inhibitors of Dengue virus NS2B-NS3 protease. J. Comput. Aided Mol. Des. 2010, 24, 195–212. [Google Scholar] [CrossRef]
- González-Díaz, H.; Dea-Ayuela, M.A.; Pérez-Montoto, L.G.; Prado-Prado, F.J.; Agüero-Chapín, G.; Bolas-Fernández, F.; Vazquez-Padrón, R.I.; Ubeira, F.M. QSAR for RNases and theoretic–experimental study of Mol. Divers. on peptide mass fingerprints of a new Leishmania infantum protein. Mol. Divers. 2010, 14, 349–369. [Google Scholar] [CrossRef]
- Mercader, A.G.; Pomilio, A.B. QSAR study of flavonoids and biflavonoids as influenza H1N1 virus neuraminidase inhibitors. Eur. J. Med. Chem. 2010, 45, 1724–1730. [Google Scholar] [CrossRef]
- Enoch, S.; Cronin, M.; Schultz, T.W.; Madden, J. An evaluation of global QSAR models for the prediction of the toxicity of phenols to Tetrahymena pyriformis. Chemosphere 2008, 71, 1225–1232. [Google Scholar] [CrossRef]
- Czermiński, R.; Yasri, A.; Hartsough, D. Use of support vector machine in pattern classification: Application to QSAR studies. Quant. Struct. Act. Relat. 2001, 20, 227–240. [Google Scholar] [CrossRef]
- Afantitis, A.; Melagraki, G.; Sarimveis, H.; Koutentis, P.A.; Igglessi-Markopoulou, O.; Kollias, G. A combined LS-SVM & MLR QSAR workflow for predicting the inhibition of CXCR3 receptor by quinazolinone analogs. Mol. Divers. 2010, 14, 225–235. [Google Scholar] [CrossRef]
- Chang, C.-C.; Lin, C.-J. LIBSVM: A library for support vector machines. ACM TIST 2011, 2, 27. [Google Scholar]
- Burden, F.R.; Winkler, D.A. Predictive Bayesian neural network models of MHC class II peptide binding. J. Mol. Graph. Model. 2005, 23, 481–489. [Google Scholar] [CrossRef]
- Burden, F.R.; Winkler, D.A. Robust QSAR models using Bayesian regularized neural networks. J. Med. Chem. 1999, 42, 3183–3187. [Google Scholar] [CrossRef]
- Svetnik, V.; Wang, T.; Tong, C.; Liaw, A.; Sheridan, R.P.; Song, Q. Boosting: An ensemble learning tool for compound classification and QSAR modeling. J. Chem. Inf. Model. 2005, 45, 786–799. [Google Scholar] [CrossRef]
- Cronin, M.T.; Schultz, T.W. Pitfalls in QSAR. J. Mol. Struct. 2003, 622, 39–51. [Google Scholar] [CrossRef]
- Doweyko, A.M. QSAR: dead or alive? J. Comput. Aided Mol. Des. 2008, 22, 81–89. [Google Scholar] [CrossRef]
- Tetko, I.V.; Bruneau, P.; Mewes, H.-W.; Rohrer, D.C.; Poda, G.I. Can we estimate the accuracy of ADME–Tox predictions? Drug Discov. Today 2006, 11, 700–707. [Google Scholar] [CrossRef]
- Kolossov, E.; Stanforth, R. The quality of QSAR models: Problems and solutions†. SAR QSAR Environ. Res. 2007, 18, 89–100. [Google Scholar] [CrossRef]
- Gramatica, P. Principles of QSAR models validation: Internal and external. QSAR Comb. Sci. 2007, 26, 694–701. [Google Scholar] [CrossRef]
- Dimitrov, S.; Dimitrova, G.; Pavlov, T.; Dimitrova, N.; Patlewicz, G.; Niemela, J.; Mekenyan, O. A stepwise approach for defining the applicability domain of SAR and QSAR models. J. Chem. Inf. Model. 2005, 45, 839–849. [Google Scholar] [CrossRef]
- Tong, W.; Xie, Q.; Hong, H.; Shi, L.; Fang, H.; Perkins, R. Assessment of prediction confidence and domain extrapolation of two structure-activity relationship models for predicting estrogen receptor binding activity. Environ. Health Perspect. 2004, 112, 1249. [Google Scholar] [CrossRef]
- Sushko, I.; Novotarskyi, S.; Körner, R.; Pandey, A.K.; Cherkasov, A.; Li, J.; Gramatica, P.; Hansen, K.; Schroeter, T.; Müller, K.-R. Applicability domains for classification problems: Benchmarking of distance to models for AMES mutagenicity set. J. Chem. Inf. Model. 2010, 50, 2094–2111. [Google Scholar] [CrossRef]
- Maggiora, G.M. On Outliers and Activity Cliffs Why QSAR Often Disappoints. J. Chem. Inf. Model. 2006, 46, 1535. [Google Scholar] [CrossRef]
- Huang, J.; Fan, X. Reliably assessing prediction reliability for high dimensional QSAR data. Mol. Divers. 2013, 17, 63–73. [Google Scholar] [CrossRef]
- Huang, J.; Fan, X. Why QSAR fails: An empirical evaluation using conventional computational approach. Mol. Pharm. 2011, 8, 600–608. [Google Scholar] [CrossRef]
- Martin, Y.C.; Kofron, J.L.; Traphagen, L.M. Do structurally similar molecules have similar biological activity? J. Med. Chem. 2002, 45, 4350–4358. [Google Scholar] [CrossRef]
- Hopkins, A.L. Network pharmacology: The next paradigm in drug discovery. Nat. Chem. Biol. 2008, 4, 682–690. [Google Scholar] [CrossRef]
- Taylor, I.W.; Linding, R.; Warde-Farley, D.; Liu, Y.; Pesquita, C.; Faria, D.; Bull, S.; Pawson, T.; Morris, Q.; Wrana, J.L. Dynamic modularity in protein interaction networks predicts breast cancer outcome. Nat. Biotechnol. 2009, 27, 199–204. [Google Scholar]
- Yildirim, M.A.; Goh, K.-I.; Cusick, M.E.; Barabási, A.-L.; Vidal, M. Drug-target network. Nat. Biotechnol. 2007, 25, 1119. [Google Scholar] [CrossRef]
- Barabási, A.-L.; Gulbahce, N.; Loscalzo, J. Network medicine: A network-based approach to human disease. Nat. Rev. Genet. 2011, 12, 56–68. [Google Scholar] [CrossRef]
- Shao, L.; Wu, L.; Fan, X.; Cheng, Y. Consensus ranking approach to understanding the underlying mechanism with QSAR. J. Chem. Inf. Model. 2010, 50, 1941–1948. [Google Scholar] [CrossRef]
- Klaassen, C.D.; Liu, J.; Diwan, B.A. Metallothionein protection of cadmium toxicity. Toxicol. Appl. Pharmacol. 2009, 238, 215–220. [Google Scholar] [CrossRef]
- Park, J.D.; Liu, Y.; Klaassen, C.D. Protective effect of metallothionein against the toxicity of cadmium and other metals. Toxicology 2001, 163, 93–100. [Google Scholar] [CrossRef]
- Cobbett, C.; Goldsbrough, P. Phytochelatins and metallothioneins: Roles in heavy metal detoxification and homeostasis. Annu. Rev. Plant Biol. 2002, 53, 159–182. [Google Scholar] [CrossRef]
- Krizkova, S.; Ryvolova, M.; Hrabeta, J.; Adam, V.; Stiborova, M.; Eckschlager, T.; Kizek, R. Metallothioneins and zinc in cancer diagnosis and therapy. Drug Metab. Rev. 2012, 44, 287–301. [Google Scholar] [CrossRef]
- Cherian, M.G.; Jayasurya, A.; Bay, B.-H. Metallothioneins in human tumors and potential roles in carcinogenesis. Mutat. Res-Fund. Mol. M. 2003, 533, 201–209. [Google Scholar] [CrossRef]
- McGee, H.M.; Woods, G.M.; Bennett, B.; Chung, R.S. The two faces of metallothionein in carcinogenesis: Photoprotection against UVR-induced cancer and promotion of tumour survival. Photoch. Photobio. Sci. 2010, 9, 586–596. [Google Scholar] [CrossRef]
- Mishra, D.; Sudarshan, M.; Chakraborty, A. Elemental alteration, iron overloading and metallothionein induction in experimental hepatocarcinogenesis: A free radical-mediated process? Toxicol. Lett. 2011, 203, 40–47. [Google Scholar] [CrossRef]
- Abe, M.; Usuda, K.; Hayashi, S.; Ogawa, I.; Furukawa, S.; Igarashi, M.; Nakae, D. Carcinogenic risk of copper gluconate evaluated by a rat medium-term liver carcinogenicity bioassay protocol. Arch. Toxicol. 2008, 82, 563–571. [Google Scholar] [CrossRef]
- Waalkes, M.P.; Liu, J.; Goyer, R.A.; Diwan, B.A. Metallothionein-I/II Double Knockout Mice Are Hypersensitive to Lead-Induced Kidney Carcinogenesis Role of Inclusion Body Formation. Cancer Res. 2004, 64, 7766–7772. [Google Scholar] [CrossRef]
- Mattingly, C.; Rosenstein, M.; Colby, G.; Forrest, J., Jr.; Boyer, J. The Comparative Toxicogenomics Database (CTD): A resource for comparative toxicological studies. J. Exp. Zool. Comp. Exp. Biol. 2006, 305, 689–692. [Google Scholar]
- Uehara, T.; Ono, A.; Maruyama, T.; Kato, I.; Yamada, H.; Ohno, Y.; Urushidani, T. The Japanese toxicogenomics project: Application of toxicogenomics. Mol. Nutr. Food. Res. 2010, 54, 218–227. [Google Scholar] [CrossRef]
- Ganter, B.; Tugendreich, S.; Pearson, C.I.; Ayanoglu, E.; Baumhueter, S.; Bostian, K.A.; Brady, L.; Browne, L.J.; Calvin, J.T.; Day, G.-J. Development of a large-scale chemogenomics database to improve drug candidate selection and to understand mechanisms of chemical toxicity and action. J. Biotechnol. 2005, 119, 219–244. [Google Scholar]
- Nie, A.Y.; McMillian, M.; Brandon Parker, J.; Leone, A.; Bryant, S.; Yieh, L.; Bittner, A.; Nelson, J.; Carmen, A.; Wan, J. Predictive toxicogenomics approaches reveal underlying molecular mechanisms of nongenotoxic carcinogenicity. Mol. Carcinog. 2006, 45, 914–933. [Google Scholar] [CrossRef]
- Mauri, A.; Consonni, V.; Pavan, M.; Todeschini, R. DRAGON software: An easy approach to molecular descriptor calculations. Match 2006, 56, 237–248. [Google Scholar]
- Chen, Y.-W.; Lin, C.-J. Combining SVMs with various feature selection strategies. Feature Extraction 2006, 207, 315–324. [Google Scholar] [CrossRef]
- Liu, Y.; Zheng, Y.F. FS_SFS: A novel feature selection method for support vector machines. Pattern. Recogn. 2006, 39, 1333–1345. [Google Scholar] [CrossRef]
- Maldonado, S.; Weber, R. A wrapper method for feature selection using Support Vector Machines. Inform. Sci. 2009, 179, 2208–2217. [Google Scholar] [CrossRef]
- Matthews, B.W. Comparison of the predicted and observed secondary structure of T4 phage lysozyme. Biochim. Biophys. Acta 1975, 405, 442–451. [Google Scholar] [CrossRef]
- Shao, L.; Wu, L.; Fang, H.; Tong, W.; Fan, X. Does applicability domain exist in microarray-based genomic research? PLoS One 2010, 5, e11055. [Google Scholar]
- Radmacher, M.D.; McShane, L.M.; Simon, R. A paradigm for class prediction using gene expression profiles. J. Comput. Biol. 2002, 9, 505–511. [Google Scholar] [CrossRef]
- Fan, X.; Shi, L.; Fang, H.; Cheng, Y.; Perkins, R.; Tong, W. DNA microarrays are predictive of cancer prognosis: A re-evaluation. Clin. Cancer Res. 2010, 16, 629–636. [Google Scholar] [CrossRef]
- Sample Availability: Not available.
© 2013 by the authors; licensee MDPI, Basel, Switzerland. This article is an open access article distributed under the terms and conditions of the Creative Commons Attribution license (http://creativecommons.org/licenses/by/3.0/).
Share and Cite
Chen, Q.; Wu, L.; Liu, W.; Xing, L.; Fan, X. Enhanced QSAR Model Performance by Integrating Structural and Gene Expression Information. Molecules 2013, 18, 10789-10801. https://doi.org/10.3390/molecules180910789
Chen Q, Wu L, Liu W, Xing L, Fan X. Enhanced QSAR Model Performance by Integrating Structural and Gene Expression Information. Molecules. 2013; 18(9):10789-10801. https://doi.org/10.3390/molecules180910789
Chicago/Turabian StyleChen, Qian, Leihong Wu, Wei Liu, Li Xing, and Xiaohui Fan. 2013. "Enhanced QSAR Model Performance by Integrating Structural and Gene Expression Information" Molecules 18, no. 9: 10789-10801. https://doi.org/10.3390/molecules180910789