A SAR and QSAR Study of New Artemisinin Compounds with Antimalarial Activity

 ,
, 
Abstract
:
1. Introduction
2. Results and Discussion
2.1. Optimization of the Geometry of Artemisinin in Different Methods and Basis Sets


| Parameters [a] | Semiempirical | Hartree-Fock/HF | DFT/B3LYP | Experimental [f] | ||||||
|---|---|---|---|---|---|---|---|---|---|---|
| AM1 [b, c] | PM3 [b, c] | ZINDO [b, c] | 6-31G [b, c] | 6-31G* [b, c] | 6-31G** [d] | 3-21G [e] | 3-21G* [e] | 3-21G**[e] | ||
| Bond Length (Å) | ||||||||||
| O1O2 | 1.288 | 1.544 | 1.237 | 1.447 | 1.391 | 1.390 | 1.524 | 1.524 | 1.524 | 1.469 |
| O2C3 | 1.447 | 1.403 | 1.400 | 1.435 | 1.393 | 1.396 | 1.455 | 1.455 | 1.454 | 1.416 |
| C3O13 | 1.427 | 1.428 | 1.396 | 1.435 | 1.388 | 1.408 | 1.473 | 1.473 | 1.472 | 1.445 |
| O13C12 | 1.416 | 1.403 | 1.392 | 1.403 | 1.400 | 1.376 | 1.430 | 1.430 | 1.430 | 1.379 |
| C12C12a | 1.537 | 1.555 | 1.513 | 1.533 | 1.533 | 1.532 | 1.535 | 1.535 | 1.535 | 1.523 |
| C12aO1 | 1.468 | 1.426 | 1.416 | 1.469 | 1.429 | 1.429 | 1.504 | 1.504 | 1.504 | 1.461 |
| Bond Angle (°) | ||||||||||
| O1O2C3 | 112.530 | 110.340 | 114.310 | 108.800 | 106.100 | 109.460 | 105.590 | 105.590 | 105.480 | 108.100 |
| O2C3O13 | 103.600 | 104.810 | 105.370 | 106.760 | 110.800 | 107.800 | 108.220 | 108.220 | 108.250 | 106.600 |
| C3O13C12 | 115.480 | 116.010 | 115.843 | 117.300 | 112.800 | 115.300 | 113.200 | 113.200 | 113.200 | 114.200 |
| O13C12C12a | 113.510 | 115.200 | 113.270 | 112.280 | 108.700 | 112.300 | 113.300 | 113.300 | 113.230 | 114.500 |
| C12C12aO1 | 111.070 | 113.180 | 107.290 | 110.910 | 110.500 | 110.545 | 112.410 | 112.410 | 112.470 | 110.700 |
| C12aO1O2 | 113.740 | 112.290 | 118.380 | 113.240 | 112.700 | 112.700 | 109.620 | 109.620 | 109.590 | 111.200 |
| Torsion Angle (°) | ||||||||||
| O1O2C3O13 | −77.800 | −73.310 | −70.403 | −71.840 | −73.369 | −73.400 | −76.610 | −76.610 | −76.740 | −75.500 |
| O2C3O13C12 | 42.070 | 52.700 | 36.370 | 33.390 | 31.034 | 31.100 | 33.750 | 33.750 | 33.720 | 36.000 |
| C3O13C12C12a | 11.400 | 2.811 | 17.420 | 25.320 | 27.432 | 27.400 | 29.059 | 29.060 | 29.080 | 25.300 |
| O13C12C12aO1 | −41.770 | −40.510 | −46.610 | −49.410 | −50.100 | −50.143 | −52.190 | −52.190 | −52.030 | −51.300 |
| C12C12aO1O2 | 12.050 | 19.940 | 18.110 | 12.510 | 10.900 | 10.924 | 9.060 | 9.600 | 9.340 | 12.700 |
| C12aO1O2C3 | 47.050 | 35.630 | 40.130 | 46.700 | 48.700 | 48.674 | 51.060 | 51.060 | 51.320 | 47.800 |
| Standard Deviation | 4.776 | 8.388 | 4.372 | 1.663 | 2.484 | 1.762 | 1.915 | 1.855 | 1.987 | - |
2.2. Molecular Docking

| Compounds | EComplex (Kcal mol−1) | Fe–O1 Distance (Å) | Fe–O2 Distance (Å) | Fe–O13 Distance (Å) | Fe–O11 Distance (Å) | logRA |
|---|---|---|---|---|---|---|
| 1 | −6.06 | 2.542 | 3.684 | 5.153 | 5.525 | 0.00000 |
| 3 | −5.09 | 2.457 | 2.778 | 4.811 | 5.202 | 0.55376 |
| 4 | −6.54 | 2.555 | 3.201 | 4.982 | 5.448 | 0.34115 |
| 10 | −5.27 | 2.562 | 3.510 | 5.184 | 5.404 | 0.41754 |
| 11 | −5.37 | 2.616 | 3.684 | 5.300 | 5.364 | 0.02633 |
| 15 | −4.70 | 2.500 | 3.415 | 5.127 | 5.351 | 0.86031 |
| 16 | −5.53 | 2.310 | 2.760 | 4.874 | 4.897 | 0.30707 |
| 19 | −5.99 | 2.523 | 3.490 | 5.158 | 5.357 | 0.35423 |
| 20 | −5.03 | 2.727 | 3.808 | 5.434 | 5.475 | 0.02174 |
| EComplex | 0.06551 | 0.01761 | 0.19250 | −0.20162 | 0.38917 | |
| Fe–O1 | 0.84202 | 0.85273 | 0.83598 | −0.44984 | ||
| Fe–O2 | 0.94792 | 0.81259 | −0.48039 | |||
| Fe–O13 | 0.65135 | −0.48864 | ||||
| Fe–O11 | −0.27755 |
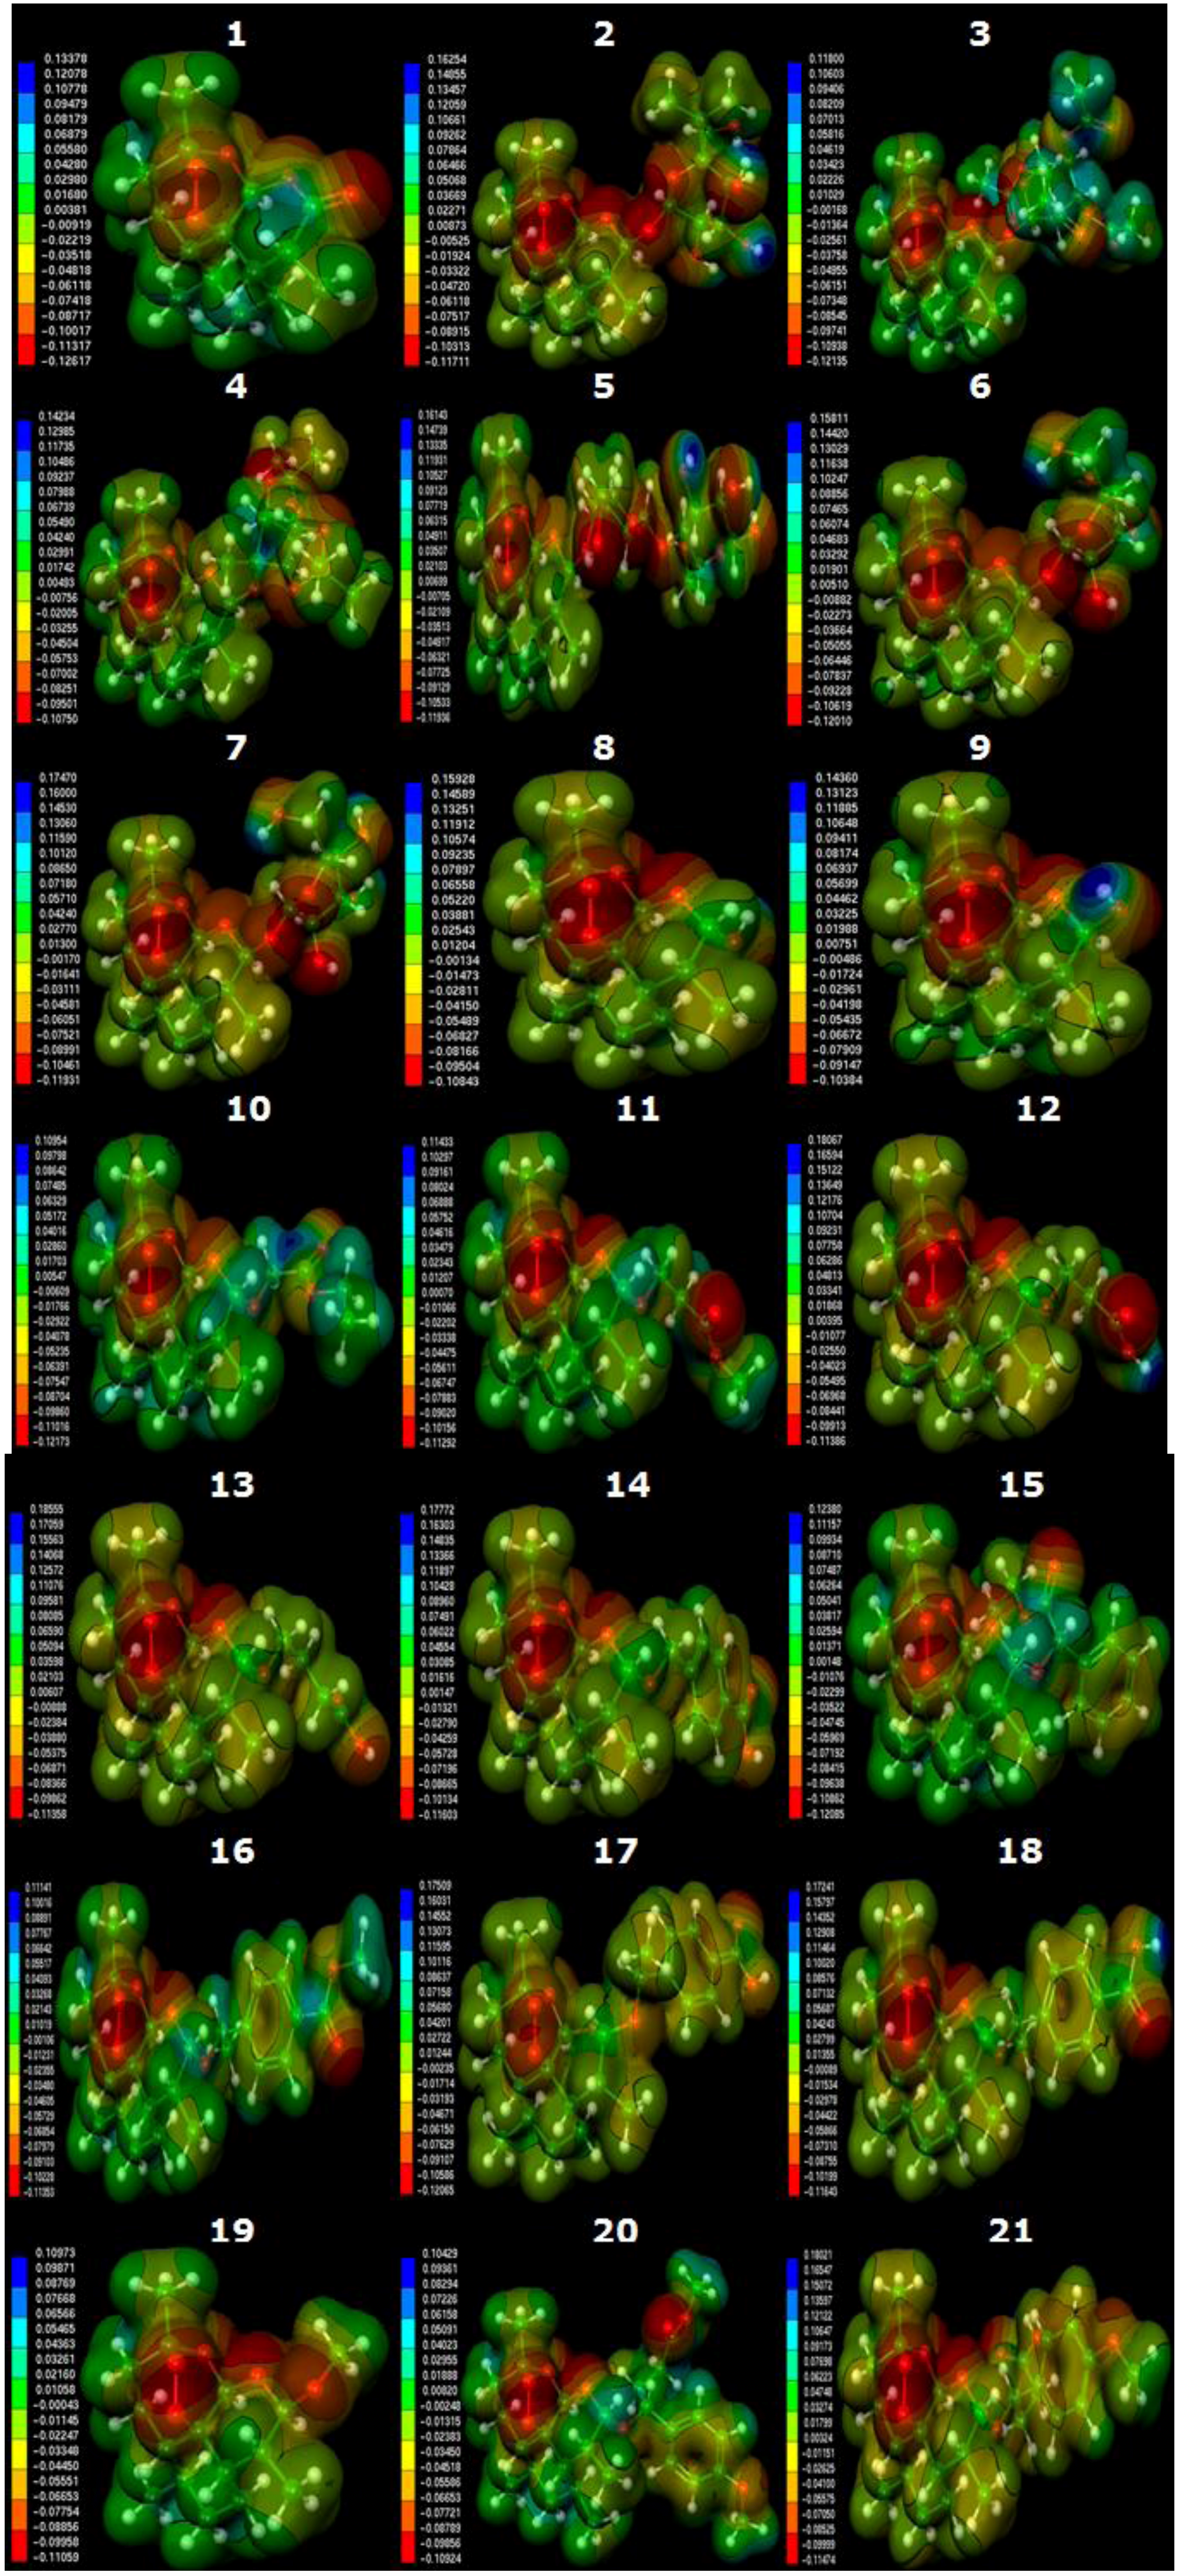
2.3. Molecular Electrostatic Potential Maps
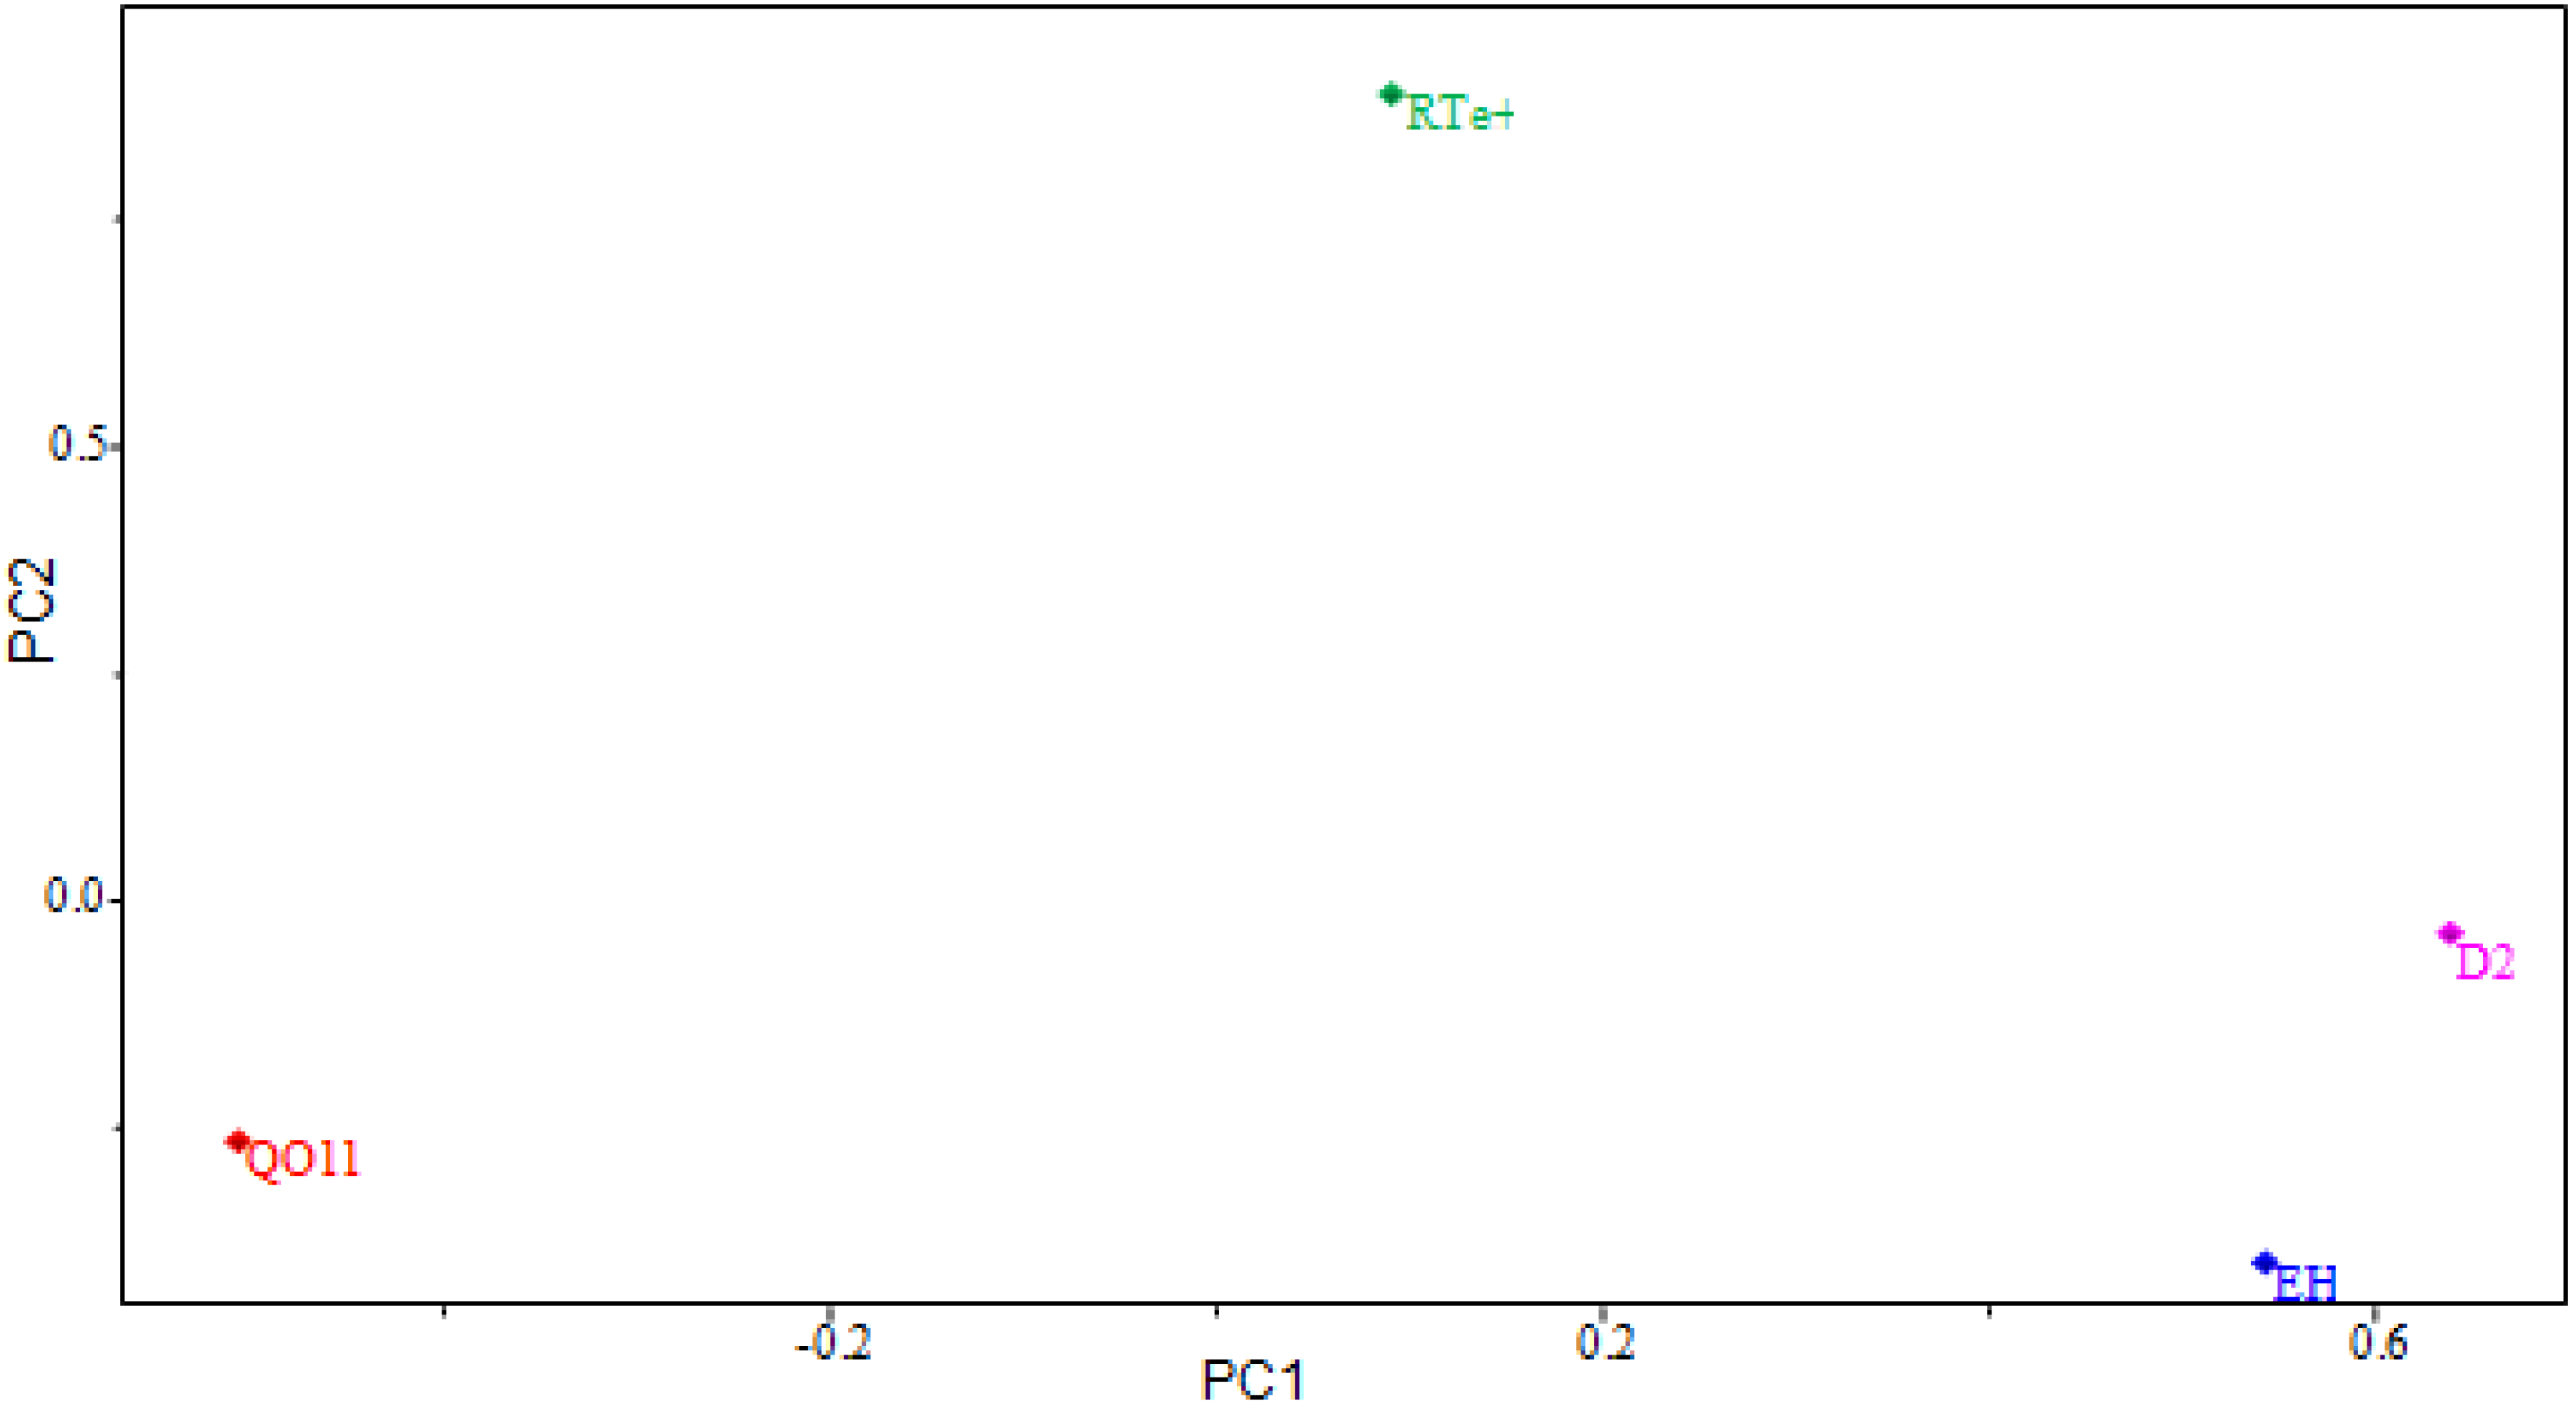
2.4. PCA Results
| Compounds | HE | QO11 | RTe+ | D2 | logRA | RA | IC50 (ng/mL) |
|---|---|---|---|---|---|---|---|
| 1+ | −2.820 | −0.605 | 0.105 | 120.868 | 0.00000 | 1.000000 | 0.6800 |
| 2− | −13.330 | −0.516 | 0.127 | 27.480 | −0.08130 | 0.829268 | 0.8200 |
| 3+ | −4.190 | −0.567 | 0.066 | −62.834 | 0.55376 | 3.578947 | 0.1900 |
| 4+ | −2.970 | −0.558 | 0.069 | 94.272 | 0.34115 | 2.193548 | 0.3100 |
| 5− | −26.220 | −0.558 | 0.079 | −143.766 | −2.40049 | 0.003977 | 171.0000 |
| 6− | −16.200 | −0.547 | 0.123 | −163.237 | −1.72137 | 0.018994 | 35.6000 |
| 7− | −16.640 | −0.517 | 0.135 | −158.396 | −1.69986 | 0.019959 | 34.0700 |
| 8− | −3.690 | −0.631 | 0.187 | 111.395 | −0.00634 | 0.985507 | 0.6900 |
| 9− | −5.670 | −0.676 | 0.126 | 113.465 | −0.00634 | 0.985507 | 0.6900 |
| 10+ | −1.680 | −0.599 | 0.100 | 13.716 | 0.41754 | 2.615385 | 0.2600 |
| 11+ | −3.330 | −0.662 | 0.080 | 124.375 | 0.02633 | 1.062500 | 0.6400 |
| 12− | −8.530 | −0.666 | 0.131 | 105.696 | −1.71943 | 0.019080 | 35.6400 |
| 13− | −8.210 | −0.648 | 0.132 | 138.353 | −1.07275 | 0.084577 | 8.0400 |
| 14− | −7.420 | −0.651 | 0.131 | 127.415 | −0.30737 | 0.492754 | 1.3800 |
| 15+ | −2.930 | −0.675 | 0.068 | −17.600 | 0.86031 | 7.249467 | 0.0938 |
| 16+ | −2.540 | −0.637 | 0.081 | 100.819 | 0.30707 | 2.028035 | 0.3353 |
| 17− | −6.900 | −0.754 | 0.150 | 95.974 | −0.57147 | 0.268245 | 2.5350 |
| 18− | −6.980 | −0.645 | 0.118 | 107.153 | −0.25768 | 0.552486 | 1.2308 |
| 19+ | −1.870 | −0.501 | 0.105 | 114.392 | 0.35423 | 2.260638 | 0.3008 |
| 20+ | −5.560 | −0.641 | 0.082 | 153.908 | 0.02174 | 1.051330 | 0.6468 |
| 21− | −11.120 | −0.651 | 0.141 | 10.910 | −0.70556 | 0.196987 | 3.4520 |
| EH | −0.329 | −0.156 | 0.694 | 0.860 | - | - | |
| QO11 | −0.203 | −0.509 | −0.127 | - | - | ||
| RTe+ | 0.128 | −0.333 | - | - | |||
| D2 | 0.485 | - | - |
| Parameters | Main Component | ||
|---|---|---|---|
| PC1 | PC2 | PC3 | |
| Variance (%) | 40.8865 | 22.7045 | 11.5660 |
| Cumulative Variance (%) | 51.1081 | 79.4887 | 93.9461 |
| Molecular Descriptors | Contribution | ||
| PC1 | PC2 | ||
| EH | 0.5705 | −0.3847 | |
| QO11 | −0.5088 | −0.2987 | |
| RTe+ | 0.0925 | 0.8731 | |
| D2 | 0.6381 | −0.0207 | |

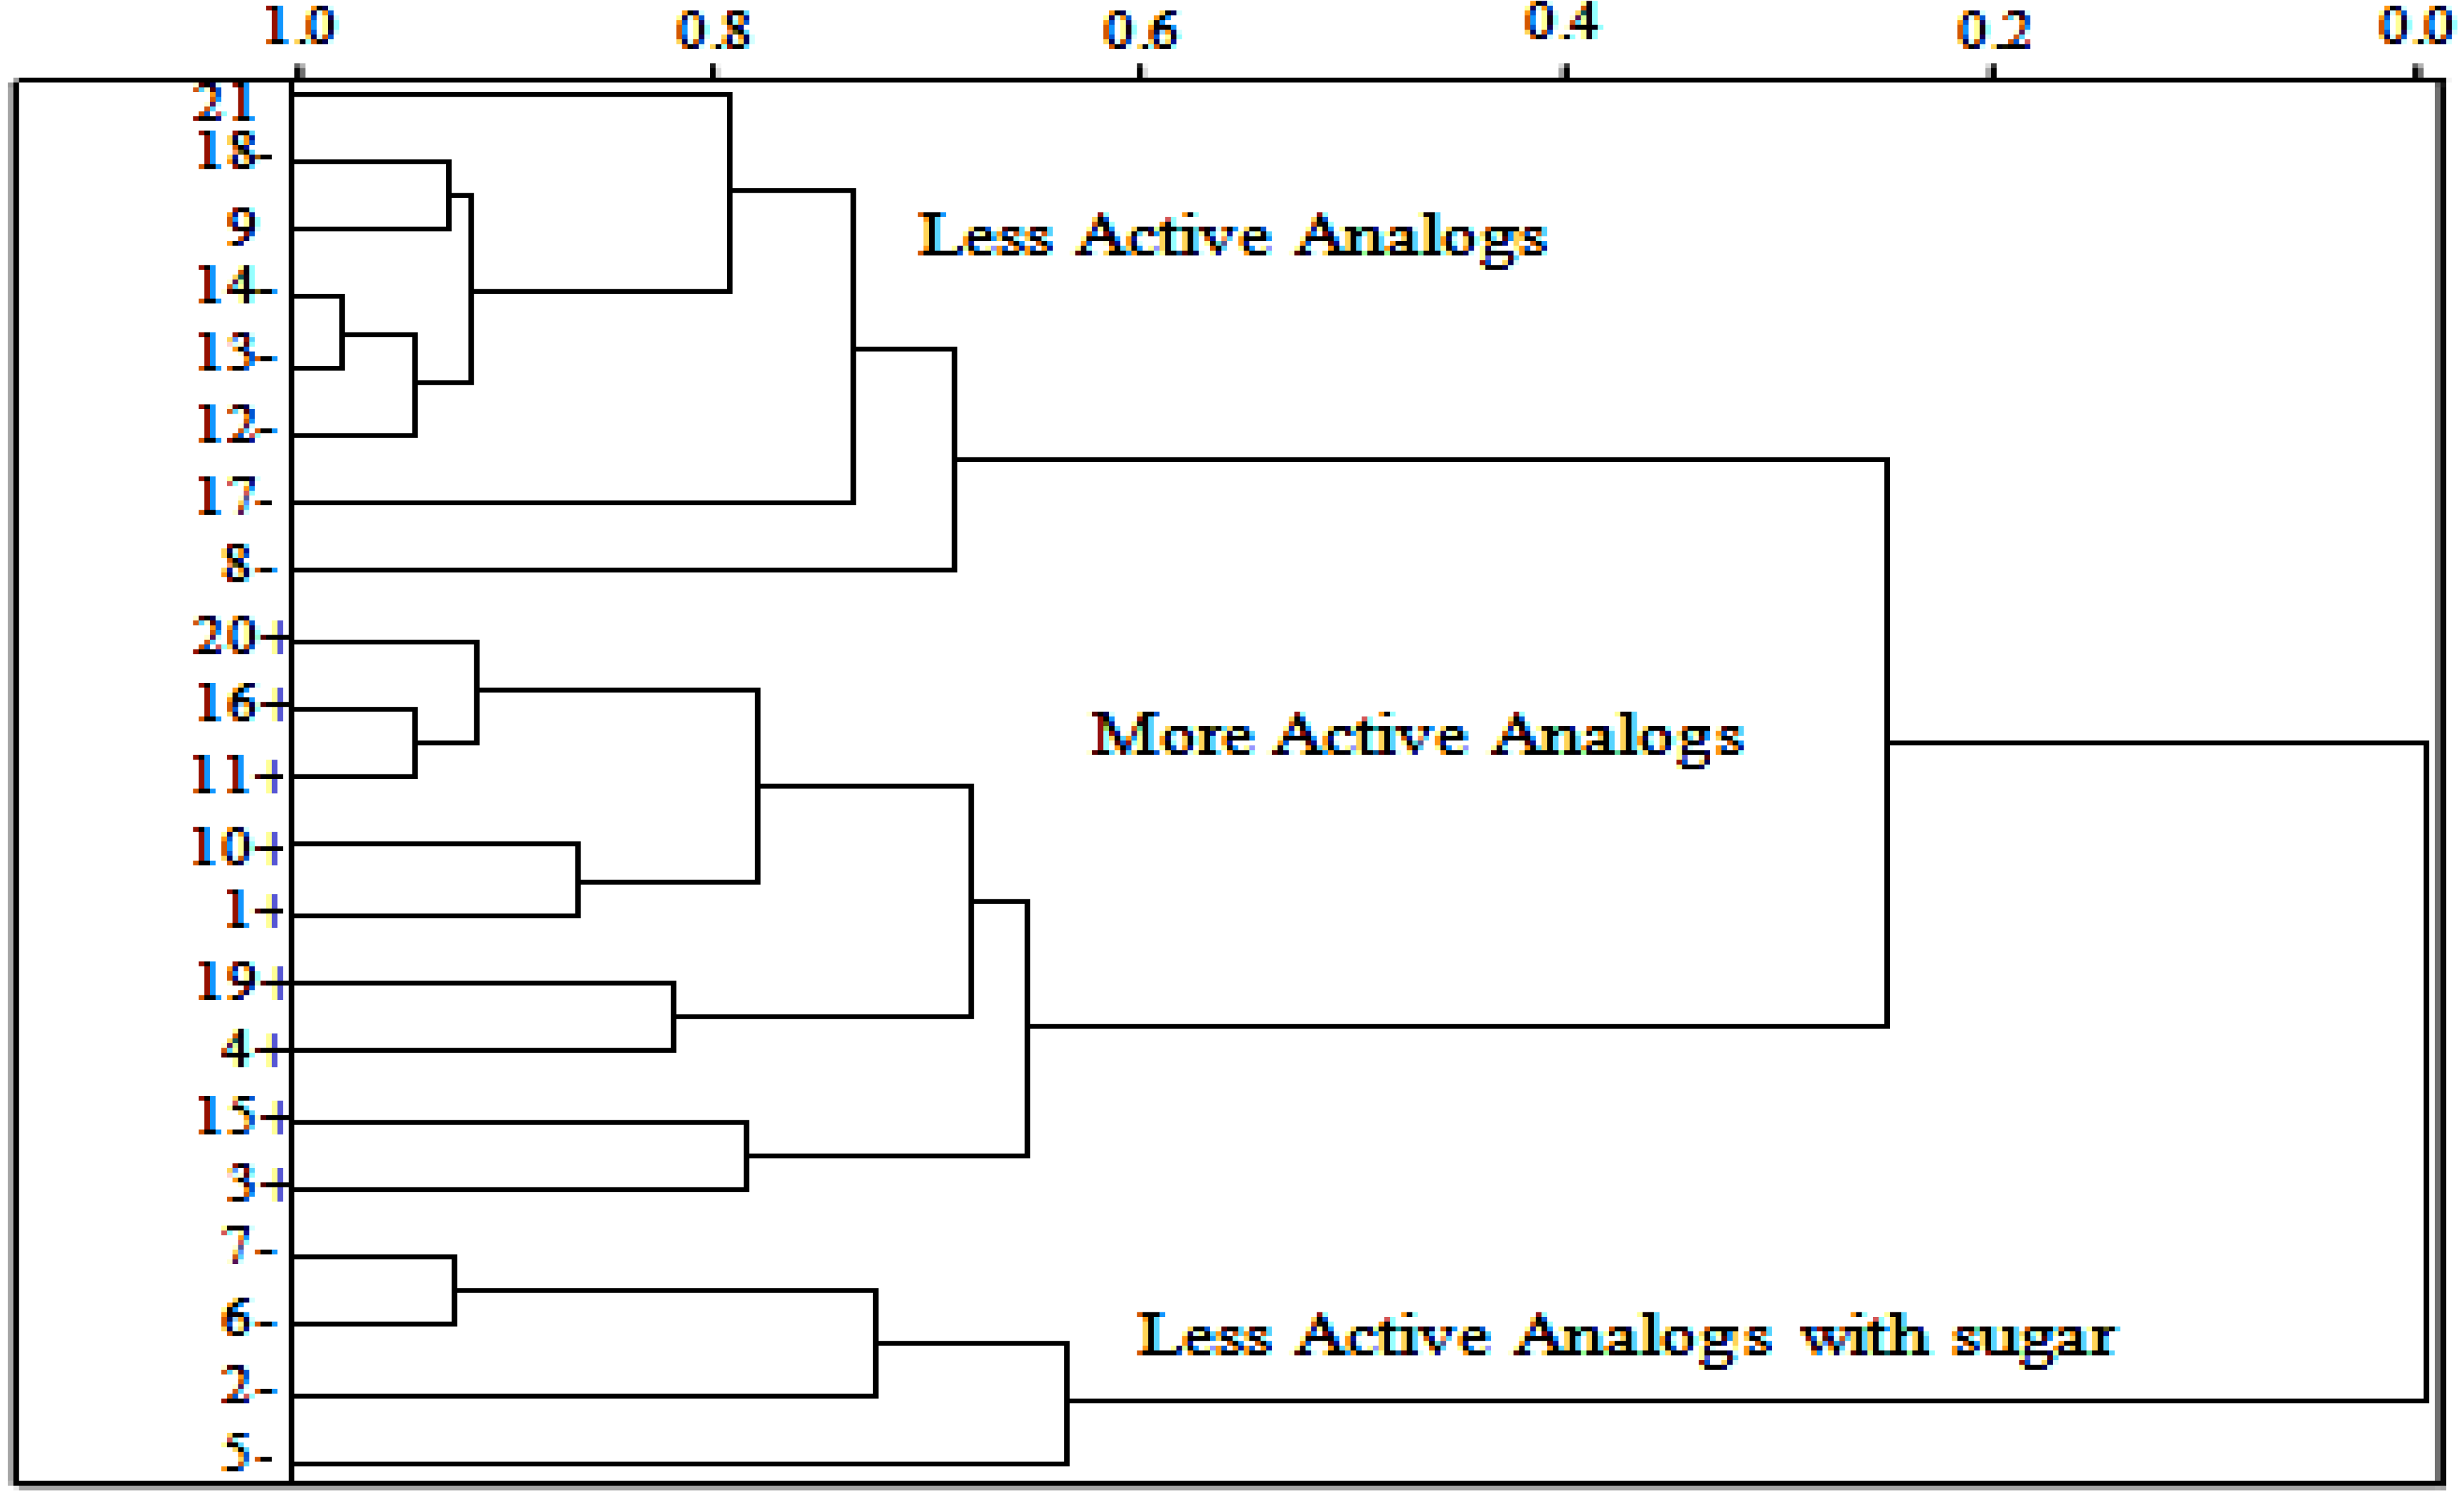
2.5. HCA Results
2.6. Partial Least Squares (PLS) and Principal Component Regression (PCR) Results
| Compounds | Predicted | Validation Error | Experimental | ||
|---|---|---|---|---|---|
| PLS | PCR | PLS | PCR | logRA | |
| 1+ | 0.2548 | 0.0902 | 0.2548 | 0.0902 | 0.0000 |
| 2− [a] | −1.0163 | −0.8805 | −0.935 | −0.7992 | −0.0813 |
| 3+ | −0.2855 | −0.6548 | −0.8392 | −1.2085 | 0.5537 |
| 4+ | 0.2199 | −0.1981 | −0.1212 | −0.5392 | 0.3411 |
| 5− | −2.1192 | −1.7899 | 0.2812 | 0.6105 | −2.4004 |
| 6− | −1.6837 | −1.4214 | 0.0376 | 0.2999 | −1.7213 |
| 7− | −1.8113 | −1.5164 | −0.1115 | 0.1834 | −1.6998 |
| 8− | −0.1174 | 0.2199 | −0.1111 | 0.2262 | −0.0063 |
| 9− | 0.0948 | 0.2284 | 0.1011 | 0.2347 | −0.0063 |
| 10+ | 0.0342 | −0.1872 | −0.3833 | −0.6047 | 0.4175 |
| 11+ | 0.4495 | 0.2485 | 0.4232 | 0.2222 | 0.0263 |
| 12− [a] | −0.1670 | 0.1032 | 1.5524 | 1.8226 | −1.7194 |
| 13− [a] | −0.0920 | 0.1144 | 0.9807 | 1.1871 | −1.0727 |
| 14− | −0.0583 | 0.1144 | 0.249 | 0.4217 | −0.3073 |
| 15+ | 0.1452 | −0.0974 | −0.7151 | −0.9577 | 0.8603 |
| 16+ | 0.3812 | 0.1289 | 0.0742 | −0.1781 | 0.3070 |
| 17− | 0.0203 | 0.4326 | 0.5917 | 1.004 | −0.5714 |
| 18− | −0.0448 | 0.0392 | 0.2128 | 0.2968 | −0.2576 |
| 19+ | 0.0888 | −0.2535 | −0.2654 | −0.6077 | 0.3542 |
| 20+ | 0.3283 | 0.1684 | 0.3066 | 0.1467 | 0.0217 |
| 21− | −0.6913 | −0.3463 | 0.0142 | 0.3592 | −0.7055 |

| Test Set | EH | QO11 | RTe+ | D2 |
|---|---|---|---|---|
| 22 | −3.460 | −0.663 | 0.076 | 7.585 |
| 23 | −3.370 | −0.664 | 0.077 | 141.065 |
| 24 | −4.790 | −0.556 | 0.069 | 130.453 |
| 25 | −5.780 | −0.675 | 0.077 | 98.153 |
| 26 | −8.070 | −0.603 | 0.076 | −76.018 |
| 27 | −4.650 | −0.602 | 0.073 | −4.170 |
| 28 | −7.440 | −0.575 | 0.066 | −9.051 |
| 29 | −15.920 | −0.482 | 0.100 | 73.480 |
| 30 | −4.470 | −0.594 | 0.070 | 125.875 |
| 31 | −15.240 | −0.601 | 0.106 | 9.276 |
| 32 | −4.500 | −0.532 | 0.063 | −37.529 |
| 33 | −13.680 | −0.578 | 0.126 | −83.125 |
| 34 | −4.550 | −0.572 | 0.071 | 8.222 |
| 35 | −13.620 | −0.523 | 0.121 | 32.018 |
| 36 | −4.280 | −0.584 | 0.071 | −27.718 |
| 37 | −2.740 | −0.650 | 0.105 | 152.098 |
| 38 | −2.850 | −0.673 | 0.081 | 101.819 |
| 39 | −2.680 | −0.603 | 0.068 | −13.617 |
| 40 | −3.290 | −0.577 | 0.064 | −65.438 |
| 41 | −10.210 | −0.615 | 0.122 | 10.190 |
| 42 | −7.044 | −0.557 | 0.062 | −13.671 |
| 43 | −7.841 | −0.654 | 0.131 | 127.514 |
| 44 | −2.910 | −0.657 | 0.072 | −25.670 |
| 45 | −2.870 | −0.670 | 0.069 | −19.115 |
| 46 | −7.020 | −0.745 | 0.155 | 95.479 |
| 47 | −4.240 | −0.600 | 0.066 | 122.578 |
| 48 | −8.120 | −0.684 | 0.123 | 131.353 |
| 49 | −8.350 | −0.665 | 0.134 | 105.669 |
| 50 | −5.676 | −0.667 | 0.126 | 113.564 |
| 51 | −3.640 | −0.636 | 0.067 | 7.855 |

| Test Set Compounds | Predicted (logRA) | Residues of Prediction (PLS−PCR) | |
|---|---|---|---|
| PLS | PCR | ||
| 22 | 0.28515 | −0.08153 | 0.36669 |
| 23 | 0.16134 | 0.29643 | −0.13510 |
| 24 | −0.02669 | −0.17894 | 0.15225 |
| 25 | −0.13236 | 0.11823 | −0.25059 |
| 26 | −0.27509 | −0.71065 | 0.43556 |
| 27 | 0.13050 | −0.37989 | 0.51040 |
| 28 | −0.25528 | −0.60997 | 0.35469 |
| 29 | −1.52738 | −1.01052 | −0.51686 |
| 30 | 0.02281 | −0.04421 | 0.06701 |
| 31 | −1.36654 | −0.73626 | −0.63028 |
| 32 | 0.18562 | −0.72371 | 0.90933 |
| 33 | −1.05361 | −0.98490 | −0.06871 |
| 34 | 0.13185 | −0.44910 | 0.58095 |
| 35 | −1.16288 | −0.86252 | −0.30036 |
| 36 | 0.20640 | −0.49559 | 0.70198 |
| 37 | 0.23829 | 0.33770 | −0.09941 |
| 38 | 0.27428 | 0.24533 | 0.02895 |
| 39 | 0.41609 | −0.32859 | 0.74468 |
| 40 | 0.38362 | −0.59287 | 0.97649 |
| 41 | −0.66296 | −0.46071 | −0.20225 |
| 42 | −0.19509 | −0.67464 | 0.47955 |
| 43 | −0.45107 | 0.10809 | −0.55916 |
| 44 | 0.39618 | −0.17717 | 0.57335 |
| 45 | 0.39508 | −0.11549 | 0.51058 |
| 46 | −0.30336 | 0.40099 | −0.70434 |
| 47 | 0.05839 | −0.02784 | 0.08623 |
| 48 | −0.49407 | 0.20276 | −0.69682 |
| 49 | −0.50004 | 0.06913 | −0.56917 |
| 50 | −0.13357 | 0.19691 | −0.33048 |
| 51 | 0.25967 | −0.19372 | 0.45339 |
3. Experimental
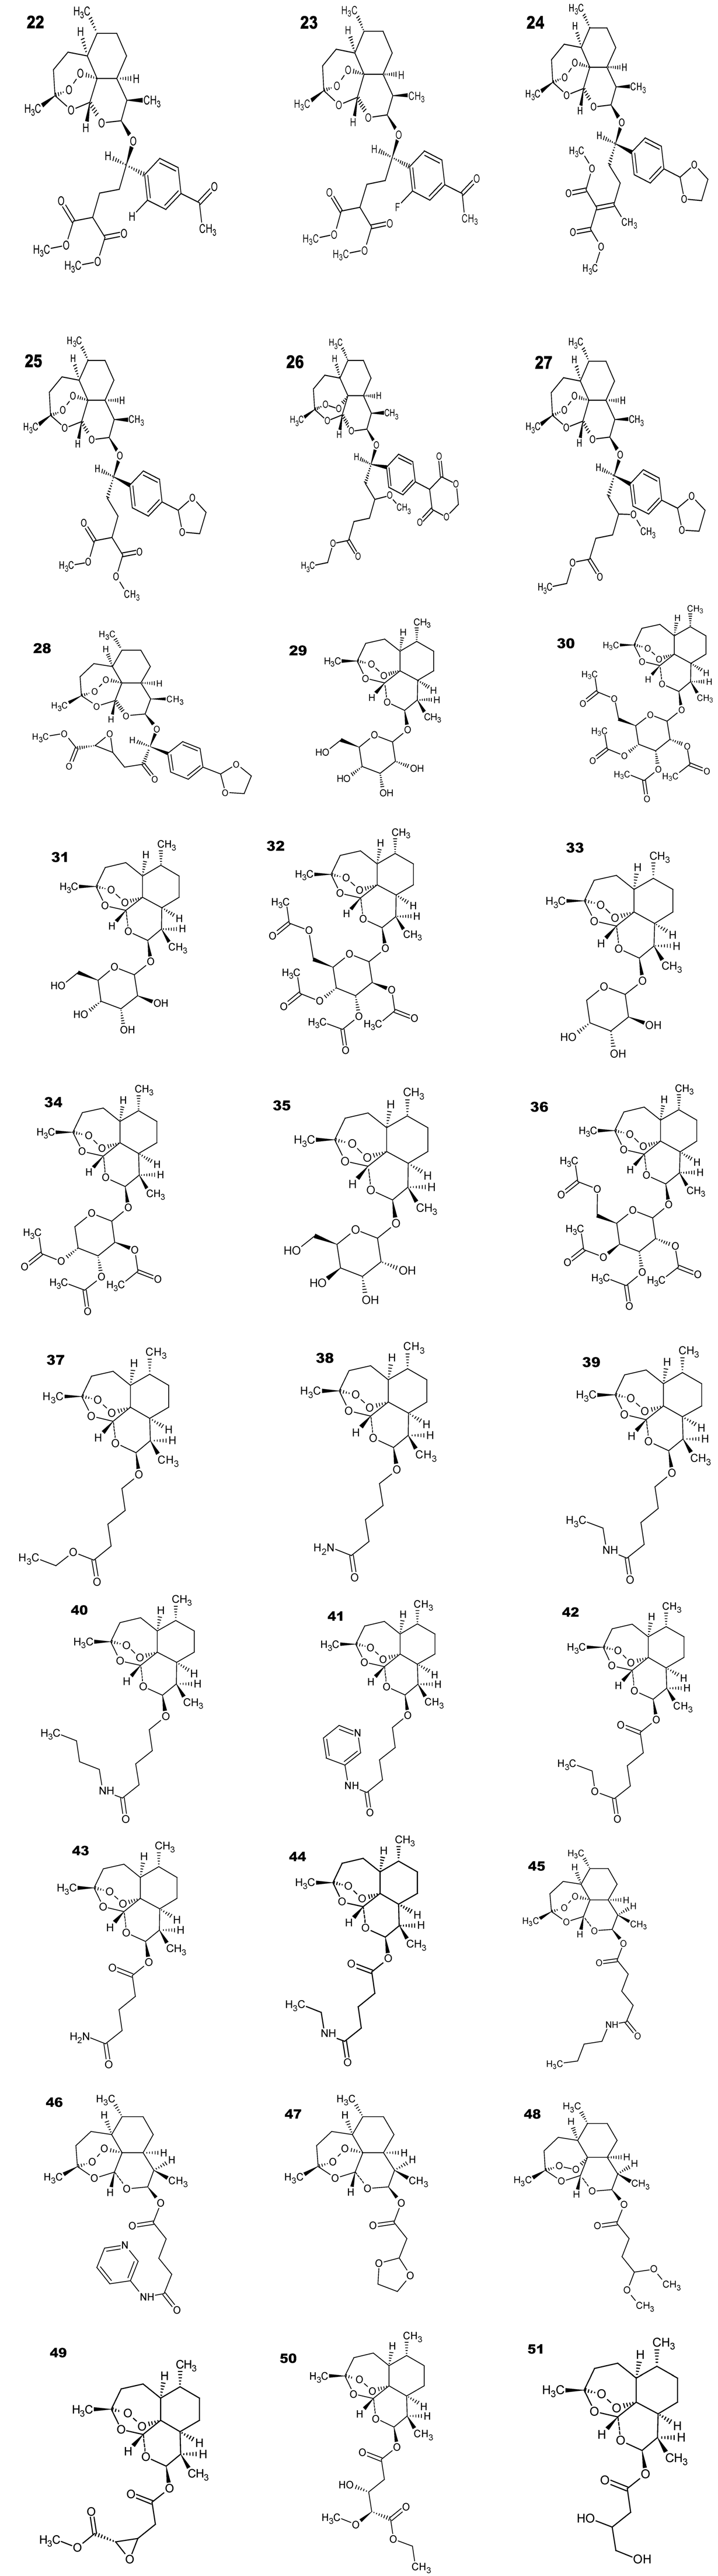
3.1. Compounds Studied
3.2. Geometric Optimization and Descriptor Calculations
- (a)
- MOLECULAR DOCKING descriptors: These were calculated to better represent the interaction between the drug and receptor with the aid of the AutoDock 4.0 program. The following 17 molecular docking descriptors were included in the data matrix: binding energy (BE); partition function (Q), Gibbs free energy (G), internal energy (U), electrostatic energy (EE); bond length (Fe–O1, Fe–O2, Fe–O13 and Fe–O11), bond angle (O2–O1–Fe, O1–O2–Fe, C4–O1–Fe and C5a–O1–Fe); and dihedral angle (O2–O1–Fe–N1, O2–O1–Fe–N2, O2–O1–Fe–N3 and O2–O1–Fe–N4).
- (b)
- QUANTUM CHEMICAL descriptors: In our study, we calculated the following 25 quantum-chemical descriptors: total energy (ET), energy of the highest occupied molecular orbital (HOMO), a level below the energy of the highest occupied molecular orbital (HOMO-1), lowest unoccupied molecular orbital energy (LUMO), a level above the energy of the lowest unoccupied molecular orbital (LUMO + 1), difference in energy between HOMO and LUMO (GAP = HOMO-LUMO), Mulliken electronegativity (χ), molecular hardness (η), molecular softness (1/η), and charge on the atom n (where n = 1, 2, 3, 4, 5, 5a, 6, 7, 8, 8a, 9, 10, 11, 12, 12a, 13). The atomic charges used in this study were obtained with the key word POP = CHELPG using the electrostatic potential [68]. With this strategy, it was possible to obtain the best potential quantum molecular series of points defined around the molecule, and atomic charges offer the general advantage of being physically more satisfactory than Mulliken charges [69].
- (c)
- Descriptors related to quantitative properties of chemical structure and biological activity: In our data matrix, QSAR descriptors were included, i.e., total surface area (TSA), molecular volume (MV), molar refractivity (MR), molar polarizability (MP), coefficient of lipophilicity (logP), molecular mass (MM) and hydration energy (HE) according to the HyperChem 6.02 program. The molecular descriptors were selected to provide valuable information about the influence of electronic, steric, hydrophilic and hydrophobic features on the antimalarial activity of artemisinins.
3.3. Interaction between Artemisinins and Heme
3.4. Molecular Electrostatic Potential Maps

3.5. Variable Selection and Model Building


4. Conclusions
Acknowledgments
Conflicts of Interest
References
- Opsenica, D.M.; Solaja, B.A. Antimalarial peroxides. J. Serb. Chem. Soc. 2009, 74, 1155–1193. [Google Scholar] [CrossRef]
- Arav-Boger, R.; Shapiro, T.A. Molecular mechanisms of resistance in antimalarial chemotherapy: The unmet challenge. Annu. Rev. Pharmacol. Toxicol. 2005, 45, 565–585. [Google Scholar] [CrossRef]
- White, N.J. Antimalarial drug resistance. J. Clin. Invest. 2004, 113, 1084–1092. [Google Scholar]
- Ridley, R.G. Malaria: To kill a parasite. Nature 2003, 424, 887–889. [Google Scholar] [CrossRef]
- O’Neill, P.M.; Searle, N.L.; Kan, K.W.; Storr, R.C.; Maggs, J.L.; Ward, S.A.; Raynes, K.; Park, B.K. Novel, potent, semisynthetic antimalarial carba analogues of the first-generation 1,2,4-trioxane artemether. J. Med. Chem. 1999, 42, 5487–5493. [Google Scholar] [CrossRef]
- Woolfrey, J.R.; Avery, M.A.; Doweyko, A.M. Comparison of 3D quantitative structure-activity relationship methods: Analysis of the in vitro antimalarial activity of 154 artemisinin analogues by hypothetical active-site lattice and comparative molecular field analysis. J. Comput. Aided Mol. Des. 1998, 12, 165–181. [Google Scholar] [CrossRef]
- Klayman, D.L. Qinghaosu (artemisinin): An antimalarial drug from China. Science 1985, 228, 1049–1055. [Google Scholar]
- Srivastava, M.; Singh, H.; Naik, P.K. Molecular modeling evaluation of the antimalarial activity of artemisinin analogues: Molecular docking and rescoring using Prime/MM-GBSA Approach. Curr. Res. J. Biol. Sci. 2010, 2, 83–102. [Google Scholar]
- Creek, D.J.; Chalmers, D.K.; Charman, W.N.; Duke, B.J. Quantum chemical study of the intermediate complex required for iron-mediated reactivity and antimalarial activity of dispiro-1,2,4-trioxolanes. J. Mol. Graph. Model. 2008, 27, 394–400. [Google Scholar] [CrossRef]
- O’Neill, P.M. The therapeutic potential of semi-synthetic artemisinin and synthetic endoperoxide antimalarial agents. Expert Opin. Invest. Drugs 2005, 14, 1117–1128. [Google Scholar] [CrossRef]
- Biagini, G.A.; O’Neill, P.M.; Bray, P.G.; Ward, S.A. Current drug development portfolio for antimalarial therapies. Curr. Opin. Pharmacol. 2005, 5, 473. [Google Scholar] [CrossRef]
- Haynes, R.K.; Vonwiller, S.C. The behaviour of Qinghaosu (Artemisinin) in the presence of Heme Iron (II) and (III). Tetrahedron Lett. 1996, 37, 253–256. [Google Scholar] [CrossRef]
- Posner, G.H.; Wang, D.; Cumming, J.N.; Oh, C.H.; French, A.N.; Bodley, A.L.; Shapiro, T.A. Further evidence supporting the importance of and the restrictions on a carbon-centered radical for high antimalarial activity of 1,2,4-trioxanes like artemisinin. J. Med. Chem. 1995, 38, 2273–2275. [Google Scholar] [CrossRef]
- Araújo, J.Q.; Carneiro, J.W.M.; Araújo, M.T.; Leite, F.H.A.; Taranto, A.G. Interaction between artemisinin and heme. A Density Functional Theory study of structures and interaction energies. Bioorg. Med. Chem. 2008, 16, 5021–5029. [Google Scholar] [CrossRef]
- Jefford, C.W. Why artemisinin and certain synthetic peroxides are potent antimalarials. Implications for the mode of action. Curr. Med. Chem. 2001, 8, 1803–1826. [Google Scholar]
- Ferreira, J.E.V.; Figueiredo, A.F.; Barbosa, J.P.; Crispino, M.G.G.; Macedo, W.J.C.; Silva, O.P.P.; Malheiros, B.V.; Serra, R.T.A.; Pinheiro, J.C. A study of new antimalarial artemisinins through molecular modeling and multivariate analysis. J. Serb. Chem. Soc. 2010, 75, 1533–1548. [Google Scholar] [CrossRef]
- Meshnick, S.R.; Yang, Y.Z.; Lima, V.; Kuypers, F.; Kamchonwongpaisan, S.; Yuthavong, Y. Iron-dependent free radical generation from the antimalarial agent artemisinin (qinghaosu). Antimicrob. Agents Chemother. 1993, 37, 1108–1114. [Google Scholar] [CrossRef]
- Jung, M. Current developments in the chemistry of artemisinin and related compounds. Curr. Med. Chem. 1994, 1, 35–49. [Google Scholar]
- Cumming, J.N.; Ploypradith, P.; Posner, G.H. Antimalarial activity of artemisinin (qinghaosu) and related trioxanes: Mechanism(s) of action. Adv. Pharmacol. 1997, 37, 253–299. [Google Scholar]
- Cohen, N.C. Guidebook on Molecular Modeling in Drug Design; Academic Press: San Diego, CA, USA, 1996. [Google Scholar]
- Sant’Anna, C.M.R. Glossário de Termos Usados no Planejamento de Fármacos (Recomendações da IUPAC para 1997). Quim. Nova 2002, 25, 505–512. [Google Scholar]
- Carvalho, I.; Borges, A.D.L.; Bernardes, L.S.C. Medicinal chemistry and molecular modeling: An integration to teach drug structure-activity relationship and the molecular basis of drug action. J. Chem. Educ. 2005, 82, 588–596. [Google Scholar] [CrossRef]
- Wermuth, C.G. The Practice of Medicinal Chemistry, 3rd ed.; Academic Press: London, UK, 2009. [Google Scholar]
- Ribeiro, F.A.L.; Ferreira, M.M.C. QSPR models of boiling point, octanol-water partition coefficient and retention time index of polycyclic aromatic hydrocarbons. J. Mol. Struct. Theochem. 2003, 663, 109–126. [Google Scholar] [CrossRef]
- Cristino, M.G.G.; Meneses, C.C.F.; Soeiro, M.M.; Ferreira, J.E.V.; Figueiredo, A.F.; Barbosa, J.P.; Almeida, R.C.O.; Pinheiro, J.C.; Pinheiro, A.L.R. Computational modeling of antimalarial 10-substituted deoxoartemisinins. J. Theor. Comput. Chem. 2012, 11, 241–263. [Google Scholar] [CrossRef]
- Gramatica, P. Principles of QSAR models validation: Internal and external. QSAR Comb. Sci. 2007, 26, 694–701. [Google Scholar] [CrossRef]
- Geladi, P.; Kowalski, B.R. Partial least-squares regression: A tutorial. Anal. Chim. Acta 1986, 185, 1–17. [Google Scholar] [CrossRef]
- Geladi, P. Notes on the history and nature of partial least squares (PLS) modeling. J. Chemom. 1988, 2, 231–246. [Google Scholar] [CrossRef]
- Ferreira, M.M.C. Multivariate QSAR. J. Braz. Chem. Soc. 2002, 13, 742–753. [Google Scholar]
- Leach, A. Molecular Modelling—Principles and Applications, 2nd ed.; Pearson Education Limited: Upper Saddle River, NJ, USA, 2001. [Google Scholar]
- Hehre, W.J. A Guide to Molecular Mechanics and Quantum Chemical Calculations; Wavefunction, Inc.: Irvine, CA, USA, 2003. [Google Scholar]
- Mulliken, R.S.; Liu, B. Self-consistent-field wave functions of P2 and PO, and the role of d functions in chemical bonding and of s-p hybridization in N2 and P2. J. Am. Chem. Soc. 1971, 93, 6738–6744. [Google Scholar] [CrossRef]
- Levine, I.N. Quantum Chemistry, 4th ed.; Prentice-Hall: New York, NY, USA, 1991. [Google Scholar]
- Santos, C.B.R.; Lobato, C.C.; Vieira, J.B.; Brasil, D.S.B.; Brito, A.U.; Macêdo, W.J.C.; Carvalho, J.C.T.; Pinheiro, J.C. Evaluation of quantum chemical methods and basis sets applied in the molecular modeling of artemisinin. Comput. Mol. Biosci. 2013, 3, 66–79. [Google Scholar] [CrossRef]
- Pinheiro, J.C.; Kiralj, R.; Ferreira, M.M.C.; Romero, O.A.S. Artemisinin derivatives with antimalarial activity against Plasmodium falciparum designed with the aid of Quantum chemical and partial least squares methods. QSAR Comb. Sci. 2003, 22, 830–842. [Google Scholar] [CrossRef]
- Cardoso, F.J.B.; Costa, R.B.; Figueiredo, A.F.; Barbosa, J.P.; Nava-Junior, I.; Pinheiro, J.C.; Romero, O.A.S. Modeling artemisinin derivatives with potent activity against P. falciparum malaria with ab initio and PLS methods. Int. Electon. J. Mol. Des. 2007, 6, 122–134. [Google Scholar]
- Cardoso, F.J.B.; Figueiredo, A.F.; Lobato, M.S.; Miranda, R.M.; Almeida, R.C.O.; Pinheiro, J.C. A study on antimalarial artemisinin derivatives using MEP maps and multivariate QSAR. J. Mol. Model. 2008, 14, 39–48. [Google Scholar] [CrossRef]
- Santos, C.B.R.; Vieira, J.B.; Formigosa, A.S.; Costa, E.V.M.; Pinheiro, M.T.; Silva, J.O.; Macêdo, W.J.C.; Carvalho, J.C.T. Validation of computational methods applied in molecular modeling of Artemisinin with antimalarial activity. J. Comput. Theor. Nanosci. 2014, 11, 553–561. [Google Scholar] [CrossRef]
- Lisgarten, J.N.; Potter, B.S.; Bantuzeko, C.; Palmer, R.A. Structure, absolute configuration, and conformation of the antimalarial compound, Artemisinin. J. Chem. Cryst. 1998, 28, 539–543. [Google Scholar] [CrossRef]
- Costa, M.S.; Kiralj, R.; Ferreira, M.M.C. Estudo teórico da interação existente entre a artemisinina e o heme. Quim. Nova 2007, 30, 25–31. [Google Scholar]
- Tonmunphean, S.; Parasuk, V.; Kokpol, S. Automated calculation of docking of artemisinin to heme. J. Mol. Model. 2001, 7, 26–33. [Google Scholar]
- Guha, R.; Jurs, P.C. Development of QSAR models to predict and interpret the biological activity of artemisinin analogues. J. Chem. Inf. Comput. Sci. 2004, 44, 1440–1449. [Google Scholar] [CrossRef]
- Cheng, F.; Shen, J.; Luo, X.; Zhu, W.; Gu, J.; Ji, R.; Jiang, H.; Chen, K. Molecular docking and 3D-QSAR studies on the possible antimalarial mechanism of artemisinin analogues. Bioorg. Med. Chem. 2002, 10, 2883–2891. [Google Scholar] [CrossRef]
- Wulfsberg, G. Principles of Descriptive Chemistry; Brooks Cole Publishing: Monterey, CA, USA, 1987. [Google Scholar]
- Karelson, M.; Lobanov, V.S.; Katritzky, A.R. Quantum-chemical descriptors in QSAR/QSPR studies. Chem. Rev. 1996, 96, 1027–1044. [Google Scholar] [CrossRef]
- Consonni, V.; Todeschini, R.; Pavan, M. Structure/response correlations and similarity/diversity analysis by GETAWAY descriptors, 1. Theory of the novel 3D molecular descriptors. Chem. Inf. Comput. Sci. 2002, 42, 682–692. [Google Scholar]
- Consonni, V.; Todeschini, R.; Pavan, M.; Gramatica, P. Structure/response correlations and similarity/diversity analysis by GETAWAY descriptors, 2. Application of the novel 3D molecular descriptors to QSAR/QSPR studies. J. Chem. Inf. Comput. Sci. 2002, 42, 693–705. [Google Scholar] [CrossRef]
- Jefford, C.W.; Vicente, M.G.H.; Jacquier, Y.; Favarger, F.; Mareda, J.; Millasson-Schmidt, P.; Brunner, G.; Burger, U. The Deoxygenation and isomerization of artemisinin and artemether and their relevance to antimalarial action. Helv. Chim. Acta. 1996, 79, 1475–1487. [Google Scholar] [CrossRef]
- Posner, G.H. Mechanism-based design, synthesis, and in vitro antimalarial testing of new 4-methylated trioxanes structurally related to artemisinin: The importance of a carbon-centered radical for antimalarial activity. J. Med. Chem. 1994, 37, 1256–1258. [Google Scholar] [CrossRef]
- Pirouette 3.01; Infometrix Inc.: Seattle, WA, USA, 2001.
- Snedecor, G.W.; Cochran, W.G. Statistical Methods; Oxford and IBH: New Delhi, India, 1967; p. 381. [Google Scholar]
- Chatterjee, S.; Hadi, A.S.; Price, B. Regression Analysis by Examples, 3rd ed.; Wiley VCH: New York, NY, USA, 2000. [Google Scholar]
- Diudea, M.V. QSPR/QSAR Studies for Molecular Descriptors; Nova Science: Huntingdon, NY, USA, 2000. [Google Scholar]
- Bikash, D.; Shovanlal, G.; Subrata, B.; Soma, S.; Tarun, J. QSAR study on some pyridoacridine ascididemin analogues as anti-tumor agents. Bioorg. Med. Chem. 2003, 11, 5493–5499. [Google Scholar] [CrossRef]
- Lin, A.J.; Li, L.Q.; Andersen, S.L.; Klayman, D.L. Antimalarial activity of new dihydroartemisinin derivatives. 5. Sugar analogues. J. Med. Chem. 1992, 35, 1639–1642. [Google Scholar] [CrossRef]
- Lin, A.J.; Klayman, D.L.; Milhous, W.K. Antimalarial activity of new water-soluble dihydroartemisinin derivatives. J. Med. Chem. 1987, 30, 2147–2150. [Google Scholar] [CrossRef]
- Lin, A.J.; Miller, R.E. Antimalarial activity of new dihydroartemisinin derivatives. 6. alpha-Alkylbenzylic ethers. J. Med. Chem. 1995, 38, 764–770. [Google Scholar] [CrossRef]
- Lin, A.J.; Zikry, A.B.; Kyle, D.E. Antimalarial activity of new dihydroartemisinin derivatives. 7. 4-(p-substituted phenyl)-4(R or S)-[10(alpha or beta)-dihydroartemisininoxy]butyric acids. J. Med. Chem. 1997, 40, 1396–1400. [Google Scholar] [CrossRef]
- GaussView 3.07; Gaussian Inc.: Pittsburgh, PA, USA, 1997.
- Allen, F.H. The Cambridge Structural Database: A quarter of a million crystal structures and rising. Acta Cryst. B 2002, 58, 380–388. [Google Scholar] [CrossRef]
- Frisch, M.J. Gaussian 98 Revision A.11; Gaussian, Inc.: Pittsburgh, PA, USA, 2001. [Google Scholar]
- Estrada, E.; Molina, E. Novel local (fragment-based) topological molecular descriptors for QSPR/QSAR and molecular design. J. Mol. Graph. Modell. 2001, 20, 54–64. [Google Scholar]
- Virtual Computational Laboratory, VCCLAB. 2005. Available online: http://www.vcclab.org/ (accessed on 20 January 2013).
- Tetko, I.V.; Gasteiber, J.; Todeschini, R.; Mauri, A.; Livingstone, D.; Ertl, P.; Palyulin, V.A.; Radchenko, E.V.; Zefirov, N.S.; Makarenko, A.S.; et al. Virtual computational chemistry laboratory–design and description. J. Comput.Aided Mol. Des. 2005, 19, 453–463. [Google Scholar] [CrossRef]
- Auto-Dock 4.0. The scripps research institute, department of molecular biology: La Jolla, CA, USA, 2007.
- Molekel 4.3; Swiss Center for Scientific Computing: Manno, Switzerland, 2000.
- ChemPlus. In Modular Extensions to HyperChem, Release 6.02, Molecular Modeling for Windows; Hyper, Inc.: Gainesville, FL, USA, 2000.
- Breneman, C.M.; Winberg, K.B. Determining atom-centered monopoles from molecular electrostatic potentials. The need for high sampling density in formamide conformational analysis. J. Comput. Chem. 1990, 11, 361–373. [Google Scholar] [CrossRef]
- Singh, U.C.; Kollman, P.A. An approach to computing electrostatic charges for molecules. J. Comput. Chem. 1984, 5, 129–145. [Google Scholar] [CrossRef]
- Vojtechovsky, J.; Chu, K.; Berendzen, J.; Sweet, R.M.; Schlichting, I. Crystal structures of myoglobin-ligand complexes at near-atomic resolution. Biophys. J. 1999, 77, 2153–2174. [Google Scholar] [CrossRef]
- Bernardinelli, G.; Jefford, C.W.; Marić, D.; Thomson, C.; Weber, J. Computational studies of the structures and molecules. Int. J. Quantum Chem. 1994, 21, 117–131. [Google Scholar]
- Politzer, P.; Murray, J.S. The fundamental nature and role of the electrostatic potential in atoms and molecules. Theor. Chem. Acc. 2002, 108, 134–142. [Google Scholar] [CrossRef]
- Custódio, R.; Andrade, J.C.; Augusto, F.O. Ajuste de Funções Matemáticas a Dados Experimentais. Quim. Nova 1997, 20, 219–225. [Google Scholar] [CrossRef]
- Pimentel, M.; Neto, B.B. Calibração: Uma Revisão para Químicos Analíticos. Quim. Nova 1996, 19, 268–277. [Google Scholar]
- Gaudio, A.C.; Zandonade, E. Proposição, validação e análise dos modelos que correlacionam estrutura química e atividade biológica. Quim. Nova 2001, 24, 658–671. [Google Scholar] [CrossRef]
- Sample Availability: Not available.
© 2013 by the authors. Licensee MDPI, Basel, Switzerland. This article is an open access article distributed under the terms and conditions of the Creative Commons Attribution license ( http://creativecommons.org/licenses/by/3.0/).
Share and Cite
Santos, C.B.R.; Vieira, J.B.; Lobato, C.C.; Hage-Melim, L.I.S.; Souto, R.N.P.; Lima, C.S.; Costa, E.V.M.; Brasil, D.S.B.; Macêdo, W.J.C.; Carvalho, J.C.T. A SAR and QSAR Study of New Artemisinin Compounds with Antimalarial Activity. Molecules 2014, 19, 367-399. https://doi.org/10.3390/molecules19010367
Santos CBR, Vieira JB, Lobato CC, Hage-Melim LIS, Souto RNP, Lima CS, Costa EVM, Brasil DSB, Macêdo WJC, Carvalho JCT. A SAR and QSAR Study of New Artemisinin Compounds with Antimalarial Activity. Molecules. 2014; 19(1):367-399. https://doi.org/10.3390/molecules19010367
Chicago/Turabian StyleSantos, Cleydson Breno R., Josinete B. Vieira, Cleison C. Lobato, Lorane I. S. Hage-Melim, Raimundo N. P. Souto, Clarissa S. Lima, Elizabeth V. M. Costa, Davi S. B. Brasil, Williams Jorge C. Macêdo, and José Carlos T. Carvalho. 2014. "A SAR and QSAR Study of New Artemisinin Compounds with Antimalarial Activity" Molecules 19, no. 1: 367-399. https://doi.org/10.3390/molecules19010367