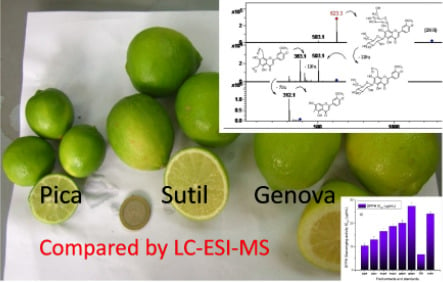
HPLC-UV-MS Profiles of Phenolic Compounds and Antioxidant Activity of Fruits from Three Citrus Species Consumed in Northern Chile


Abstract
:
1. Introduction

2. Results and Discussion
2.1. Total Phenolic, Ascorbic Acid, Flavonoid Contents and Antioxidant Capacity of Citrus Extracts
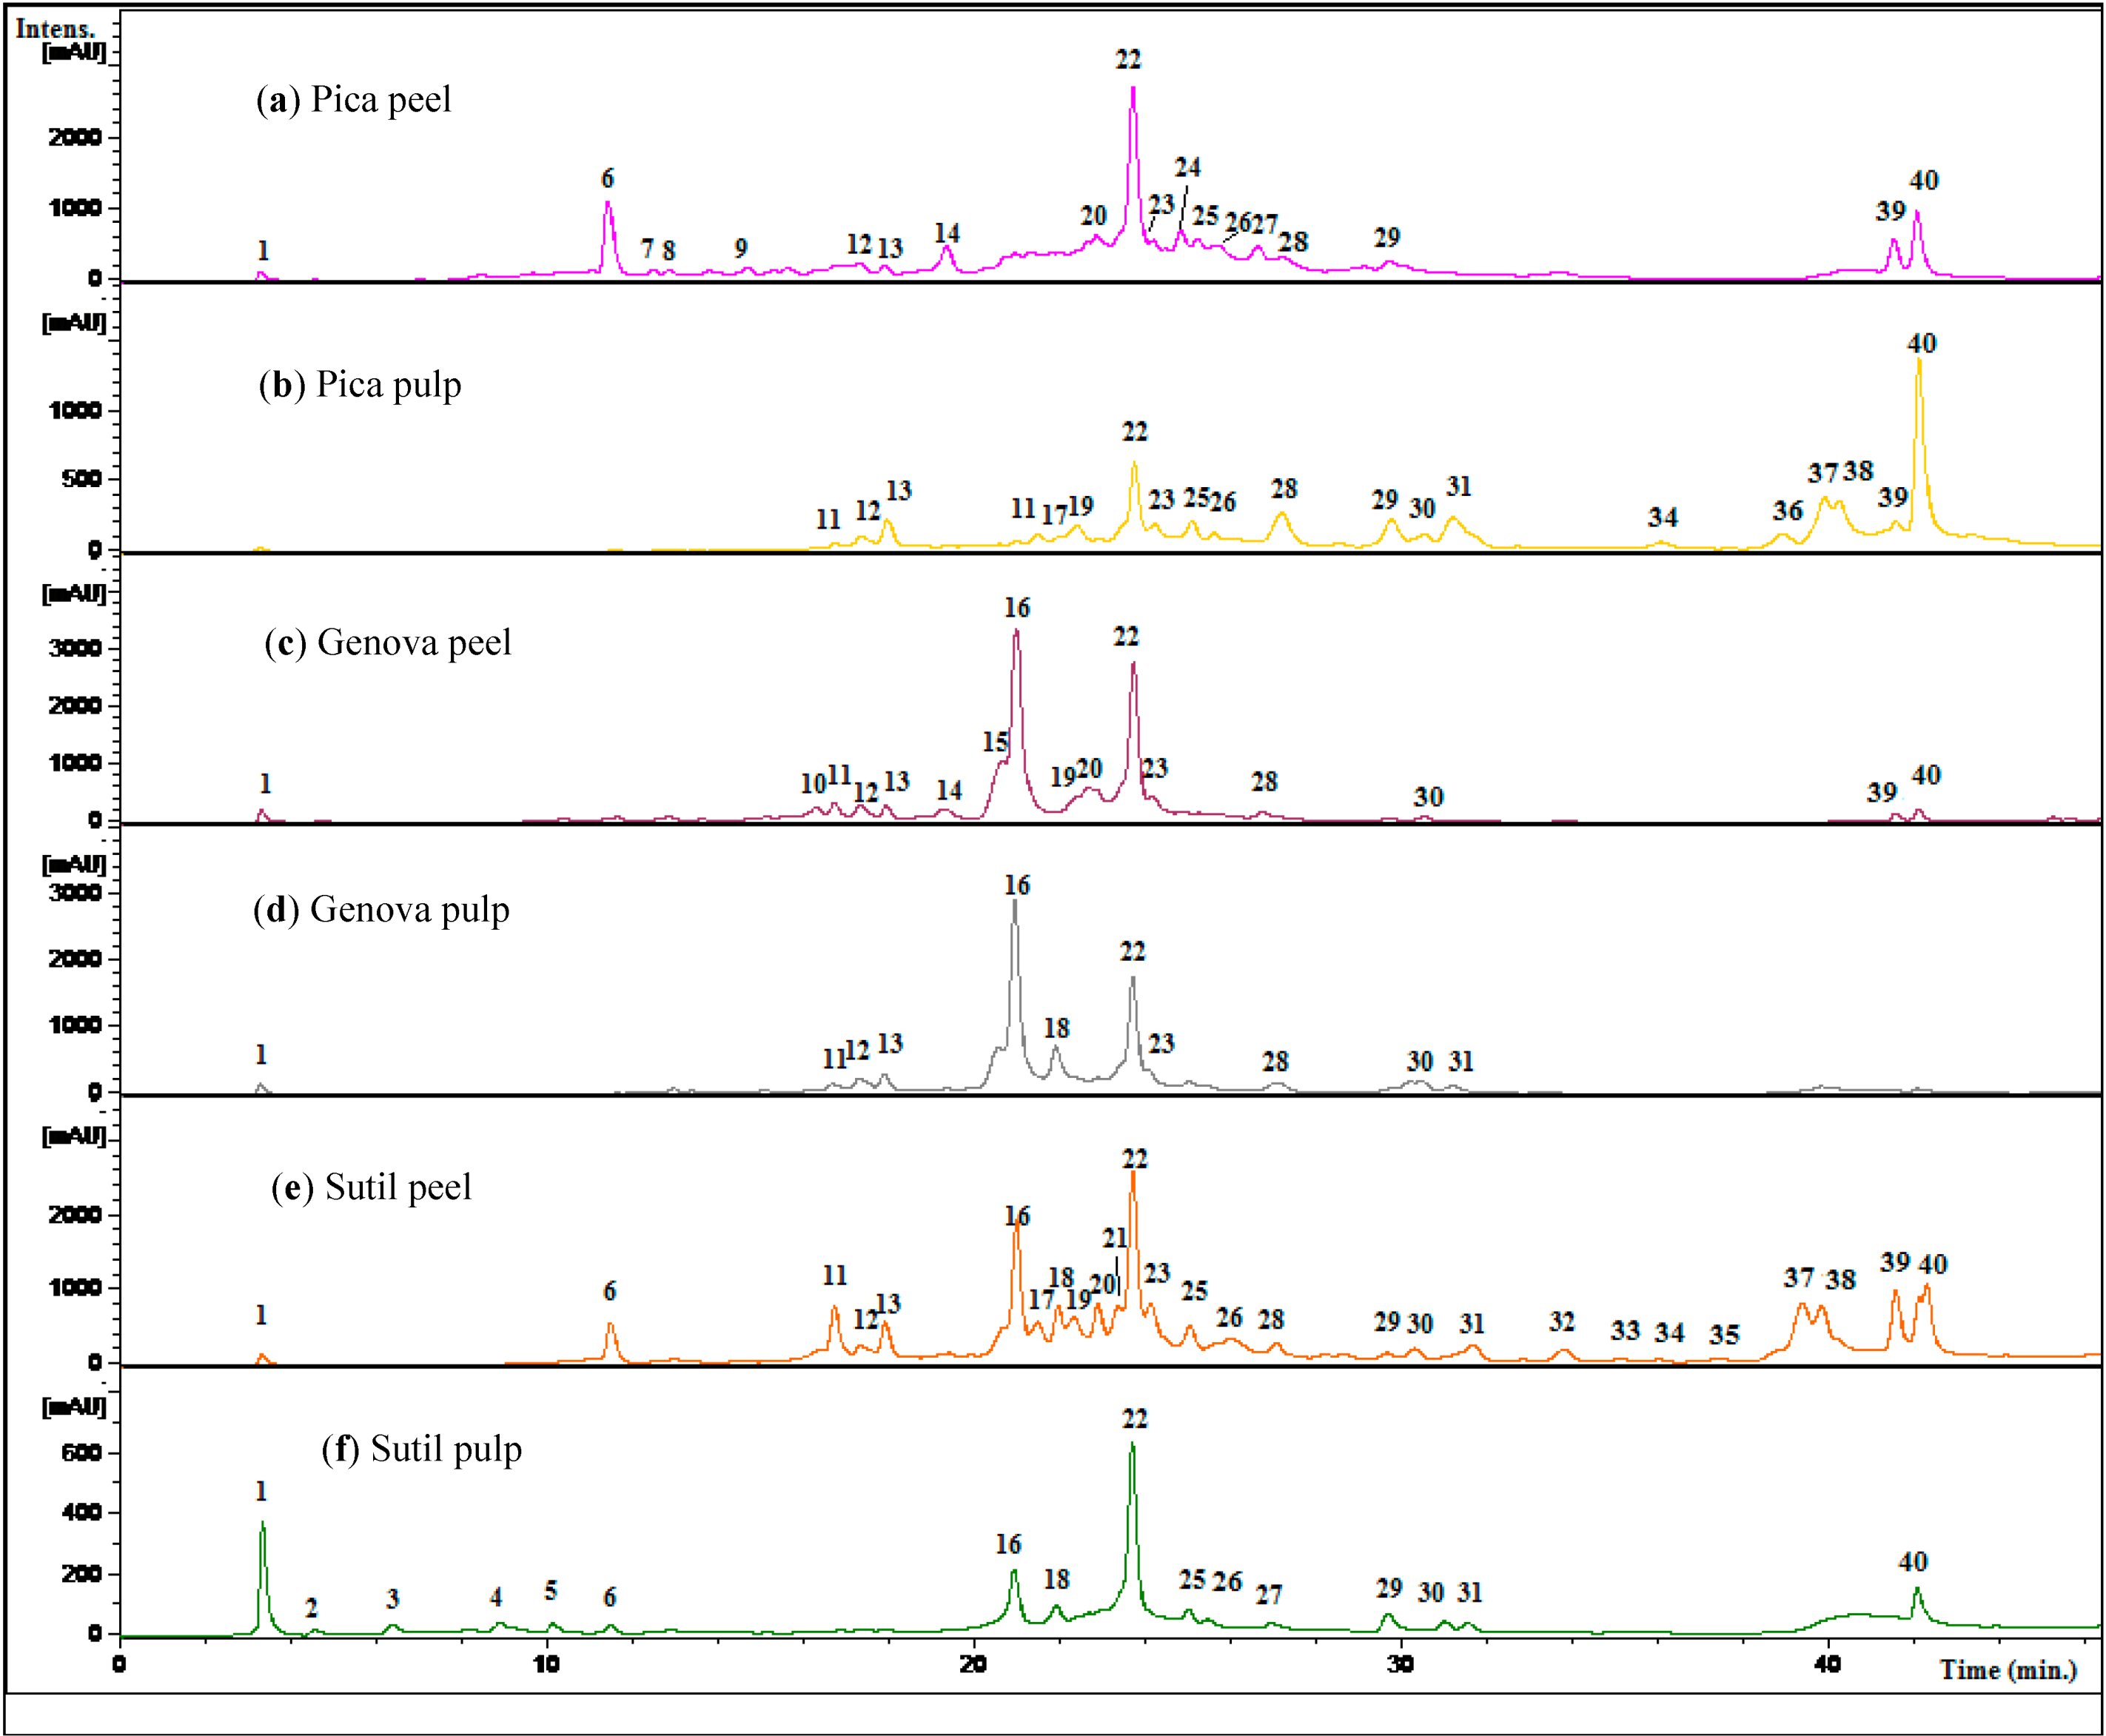
2.2. Identification of Phenolic Constituents in Citrus Fruits by HPLC-UV and ToF-ESI-MS/MS


| Peak | Rt (min) | HPLC DAD λ Max (nm) | [M−H]−/[M+H]+ (m/z) | MS2 Ions (m/z) | MSn Ions (m/z) | [2M−H]− or [2M+H]+ (m/z) | Tentative Identification | Species/Plant Part |
|---|---|---|---|---|---|---|---|---|
| 1 | 3.5 | - | 191 | 145 | 129, 111 | Citric acid | Ppe, gpe, gpu, spe, spu | |
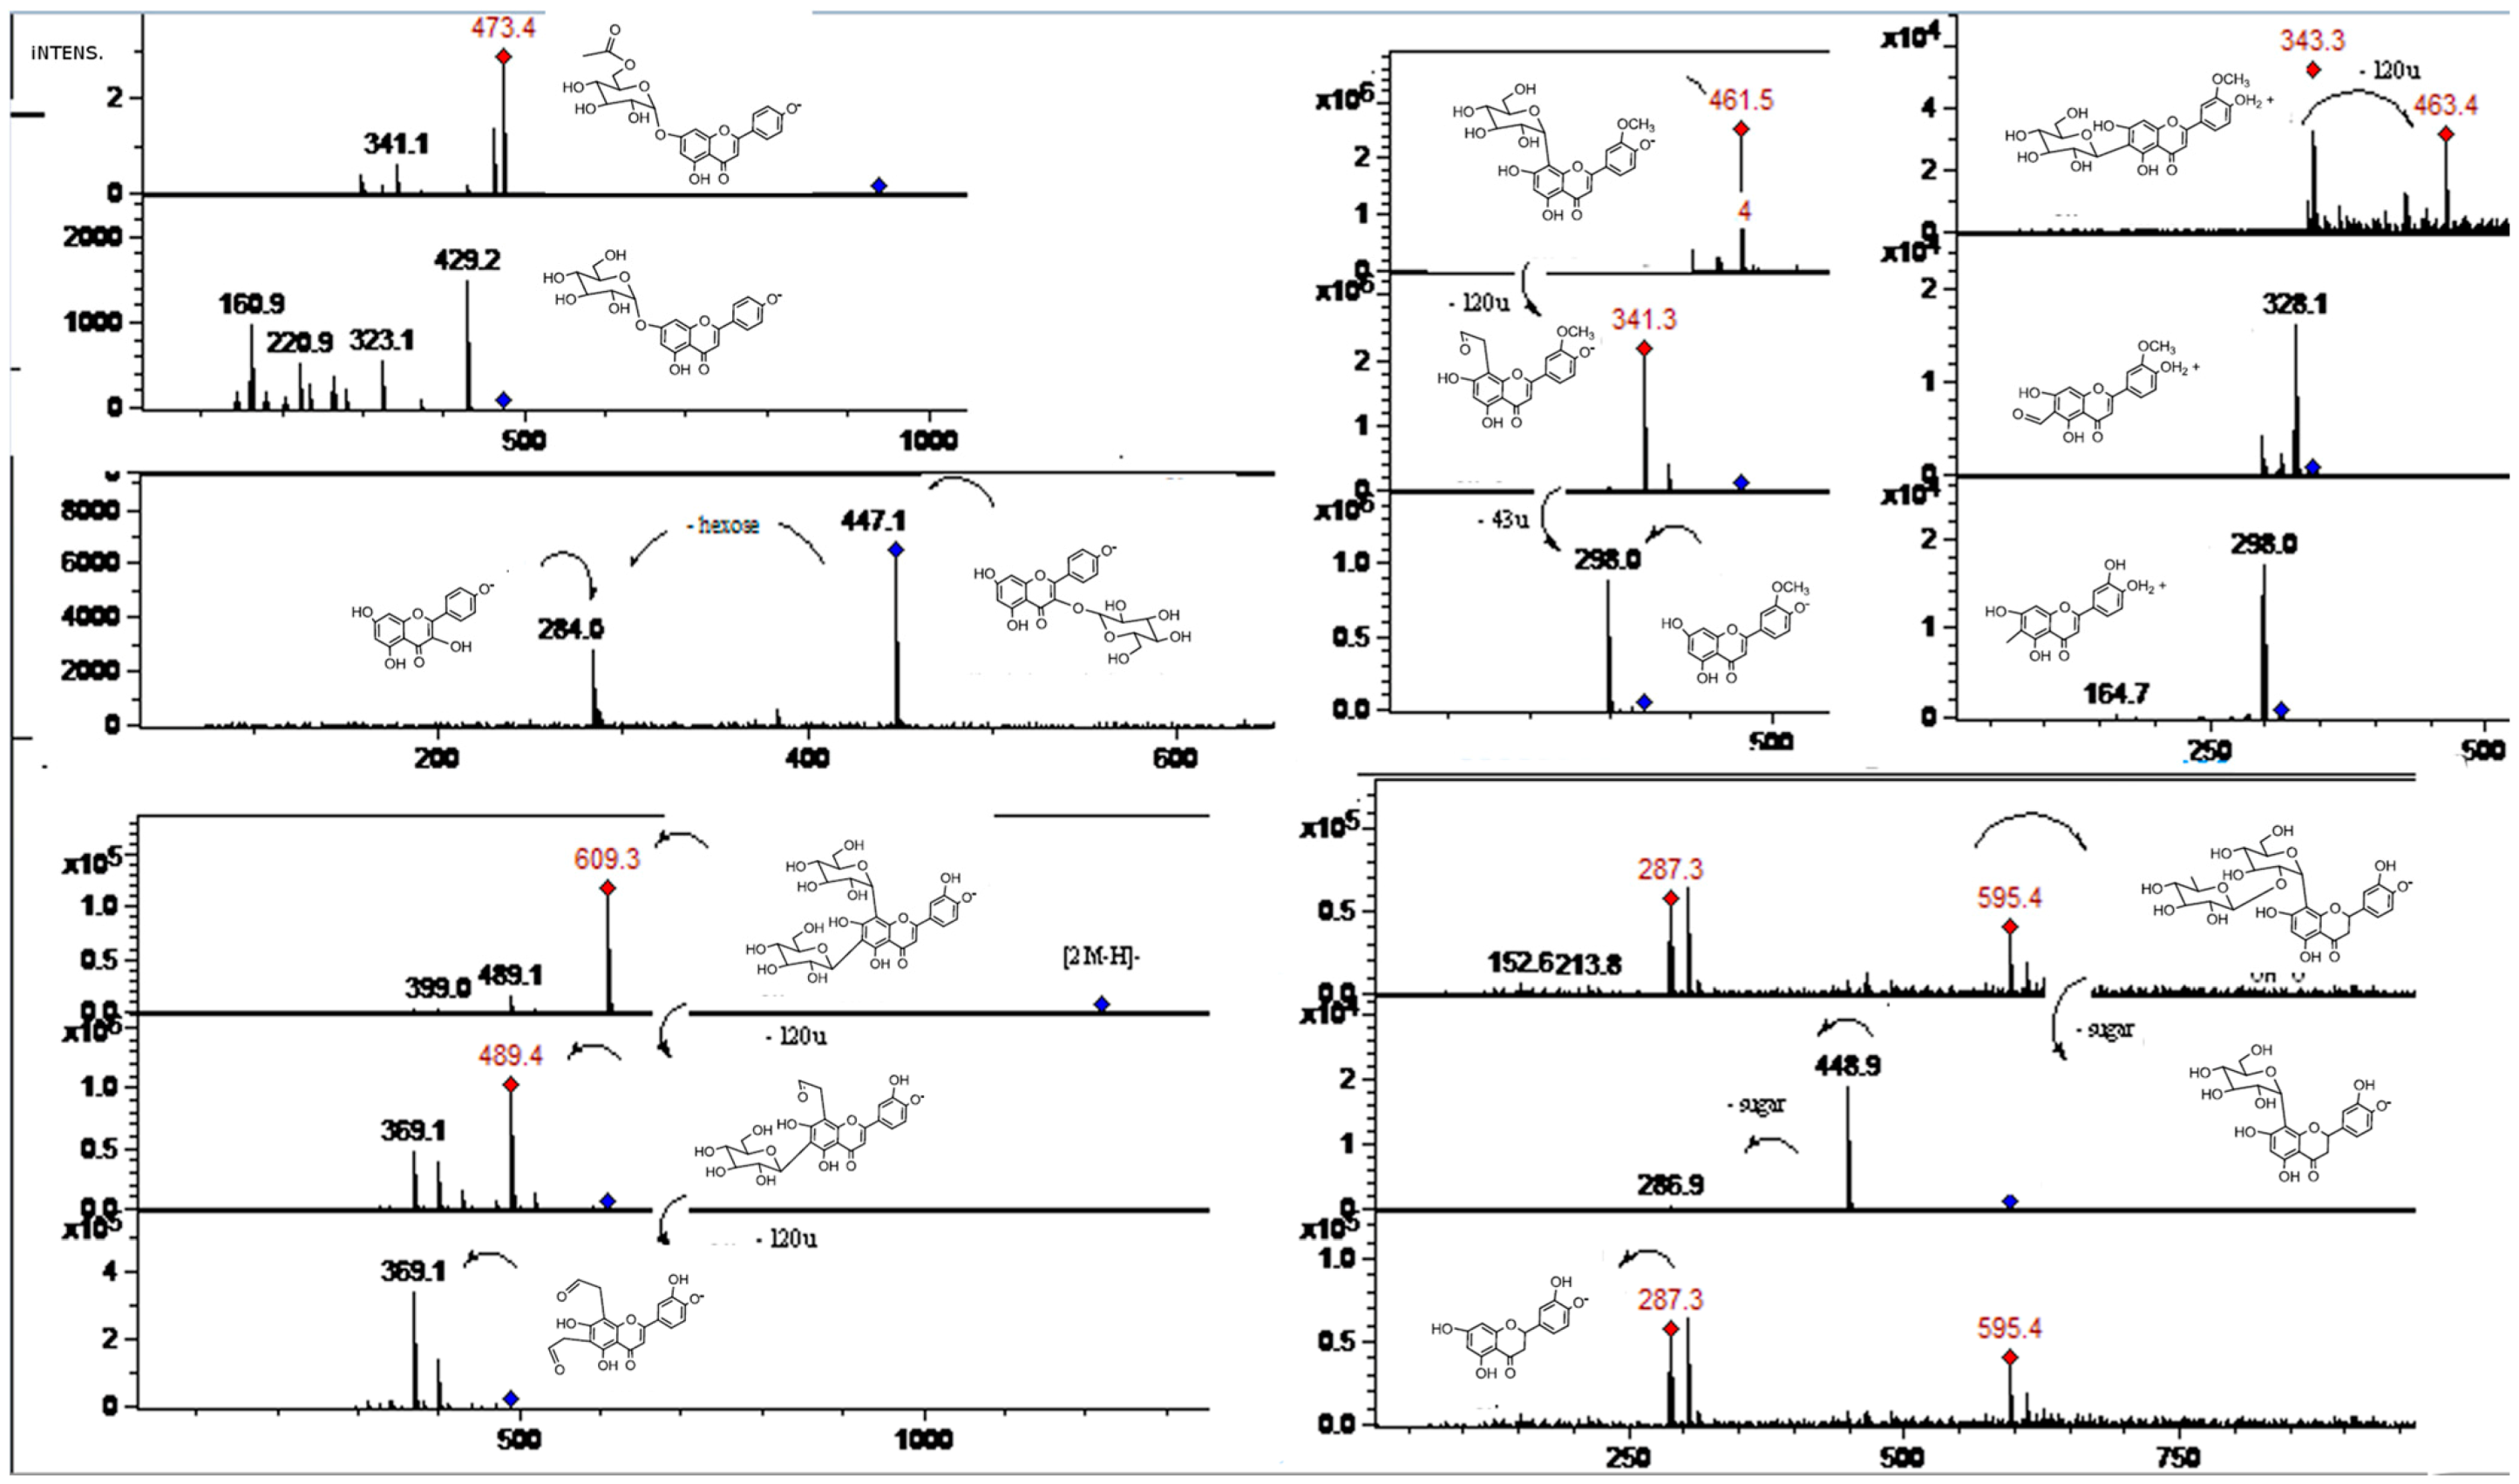
| 2 | 4.2 | 268, 334 | 739 | 431 (M-neohesperidose) | 311 (431–120) | Apigenin 7-O-neohesperidoside-6-C-glucoside | Spu | |
| 3 | 17.5 | 268, 334 | 577/579 | 431 | 269, 225 | Apigenin 7-O-neohesperidoside (Rhoifolin) | Supu | |
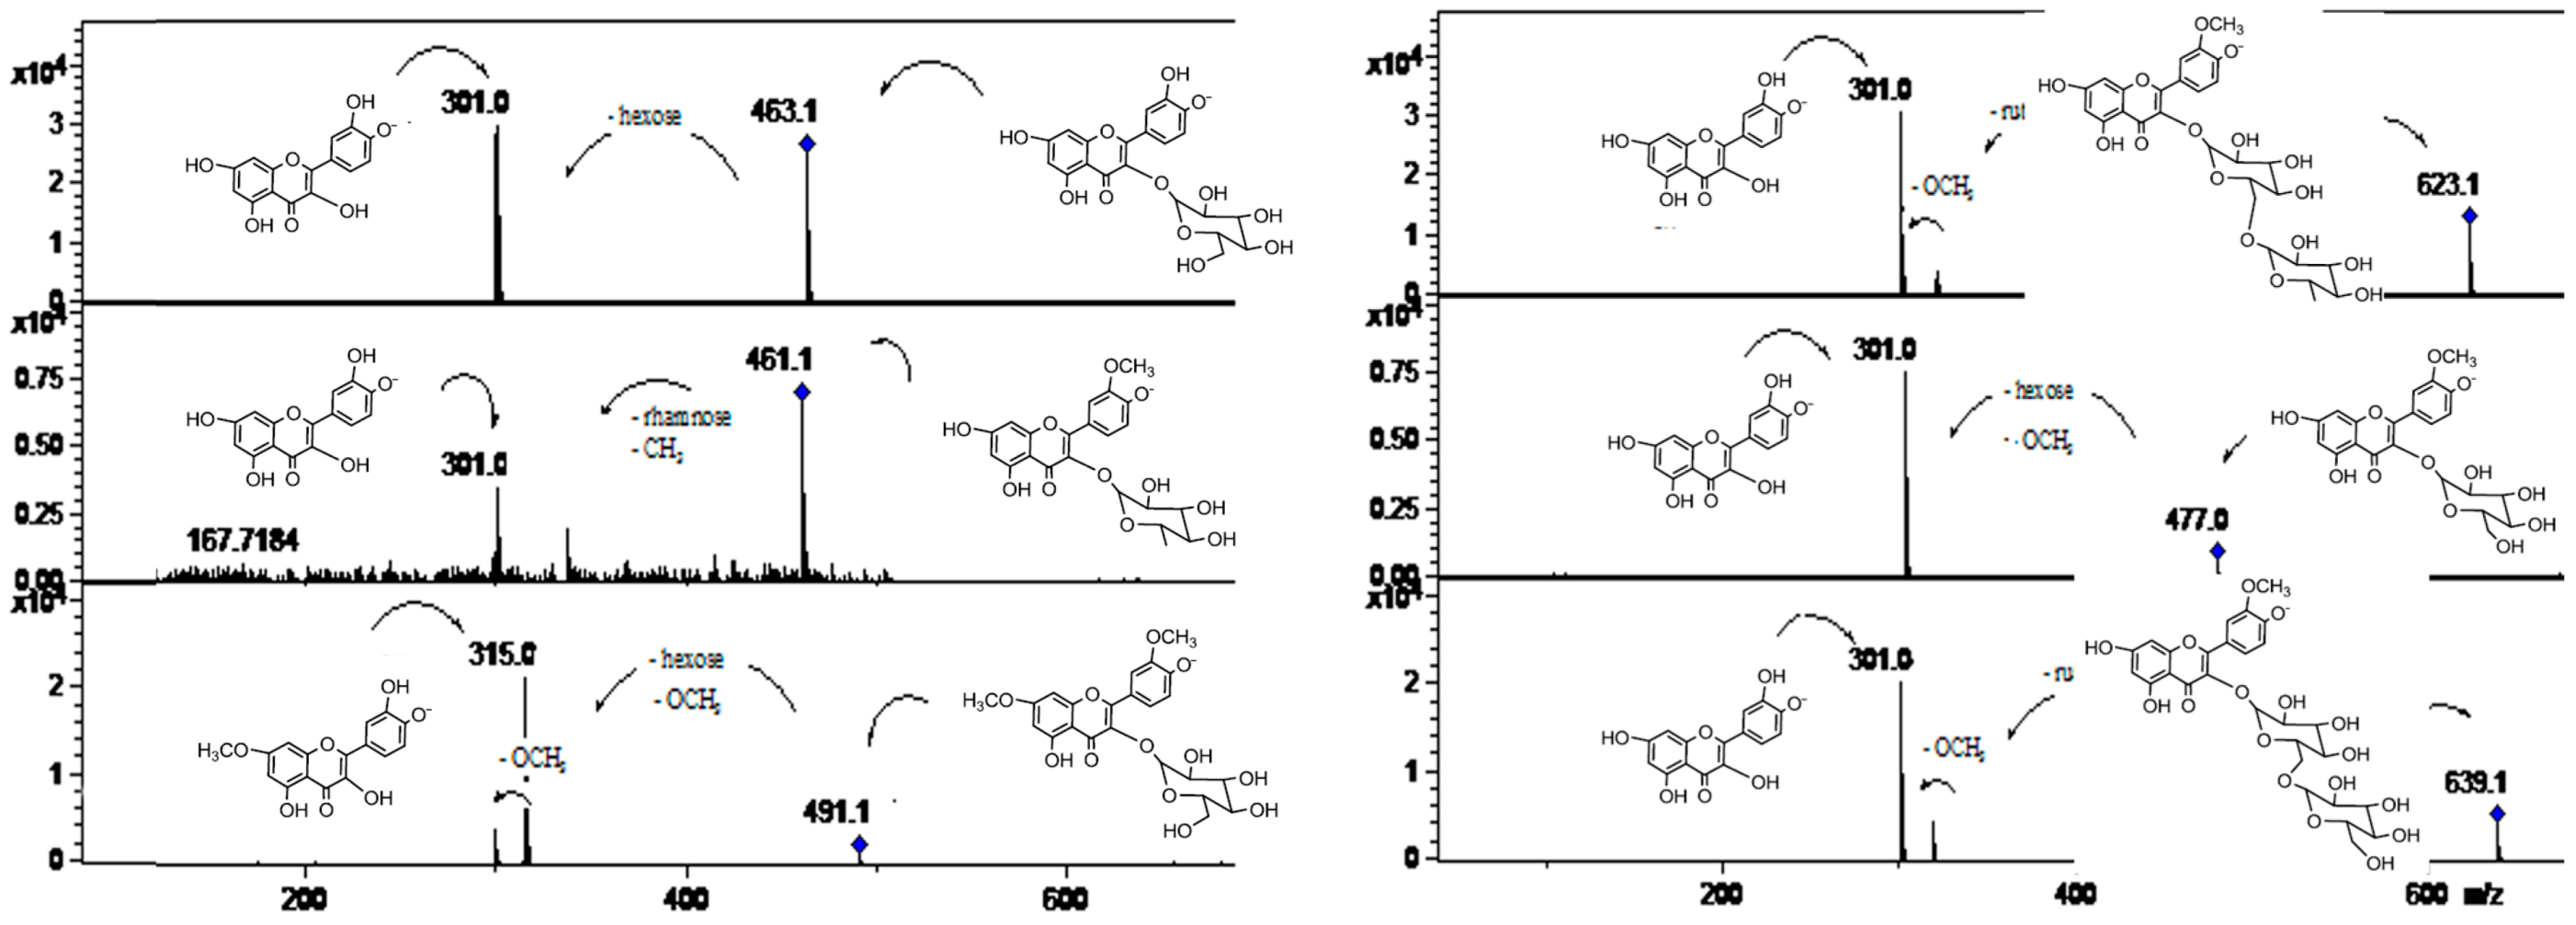
| 4 | 9.0 | 255, 354 | 771/773 | 609 (rutin) | 463, 301, 179, 151 | Quercetin 7-O-glucoside-3-O-rutinoside | Supu | |
| 5 | 10.1 | 250, 268, 342 | 639 | 315 (M-di-glucose) | 301, 179, 151 | Isorhamnetin-3-O-di-glucoside | Supu | |
| 6 | 10.9 | 285, 325 | 757 | 595 | 595, 449, 287 | Eriodictyol-4'-O-neohesperidoside-7-O-glucoside | Spu, spe, ppe | |
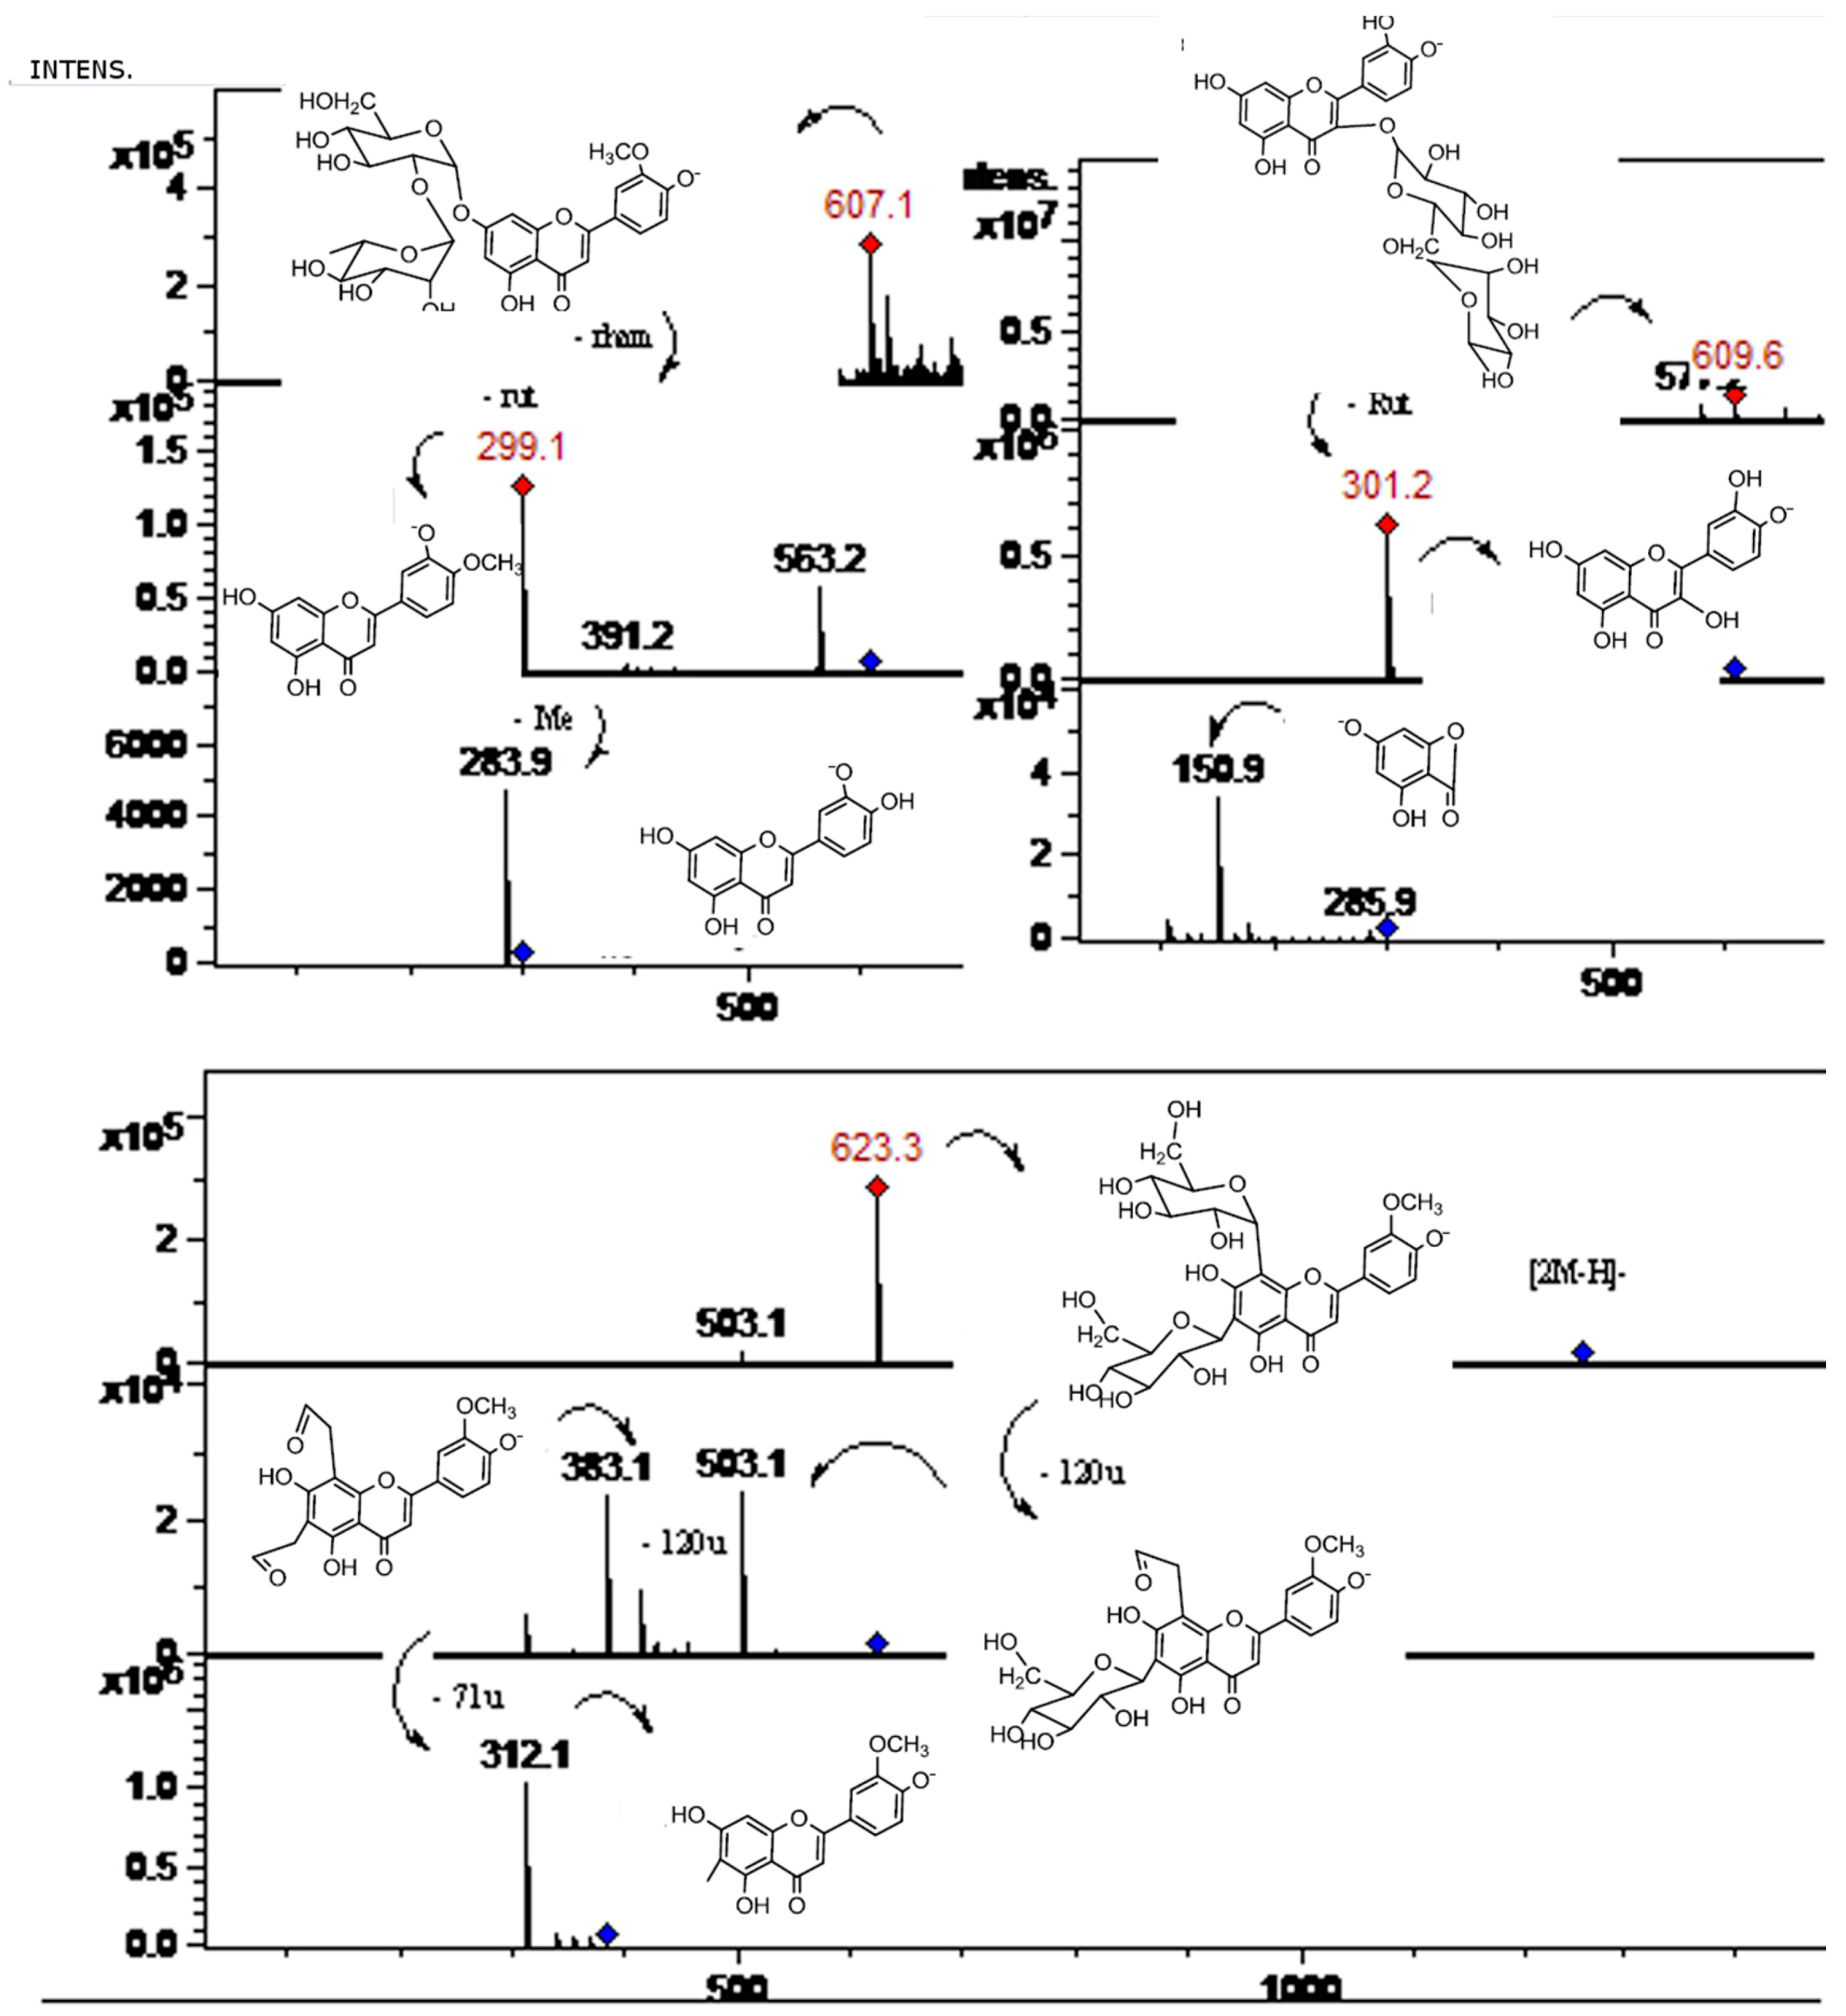
| 7 | 12.0 | 250, 268, 342 | 623/625 | 503(M-120) | 383, 312 | 1247 | Diosmetin 6,8-di-C-glucoside (Lucenin-2,4'-methyl ether) | Ppe |
| 8 | 12.2 | 250, 268, 342 | 607/609 | 563 | 299 (Diosmetin), 284 | Diosmetin 7-O-neohesperidoside (Neodiosmin) | Ppe | |
| 9 | 14.1 | 250, 268, 342 | 607/609 | 563 | 299 (Diosmetin), 284 | Diosmetin 7-O-neohesperidoside | Ppe | |
| 10 | 16.3 | 623/625 | 503(M-120) | 383, 312 | 1247 | Chrysoeriol 6,8-di-C-glucoside (Stellarin-2) | Gpe | |
| 11 | 16.2 | 357/359 | 194 | 151 | 3-(2-hydroxy-4-methoxyphenyl)-propanoic acid hexose | Ppu, gpe, gpu, spe, ppe | ||
| 12 | 18.5 | 268, 334 | 577/579 | 431 | 269, 225, 201 | Apigenin 7-O-rutinoside (Isorhoifolin) | Ppe, ppu, gpe, gpu, spe | |
| 13 | 31.5 | 285, 325 | 595 | 449 (M-rhamnose) | 287 (M-neohesperidose) | Eriodictyol-7-O-neohesperidoside | Spu, spe, gpu, ppu | |
| 14 | 19.4 | 254, 267 | 593/595 | 285/287 (Luteolin) | 241, 175 | 1187/1189 | Luteolin 7-O-rutinoside | Ppe, gpe |
| 15 | 19.1 | 285, 325 | 595/597 | 287/289 (eriodictyol) | 151, 135, 107 | 1189/1191 | Eriocitrin (Eriodictyol-7-O-rutinose) | Ppe, ppu, gpe, gpu, spe |
| 16 | 23.5 | 250, 268, 342 | 607/609 | 563 | 299 (Diosmetin), 284 | Diosmetin-7-O-rutinoside (Diosmin) | Gpe, gpu, spe, spu | |
| 17 | 21.0 | 250, 268, 342 | 461/463 | 341/343(M-120) | 298 | Diosmetin 8-C-glucoside (Orientin 4'-methyl ether) | Spe, ppu | |
| 18 | 22.0 | 255, 268, 345 | 461/463 | 341/343 (M-120) | 298 | Chrysoeriol 8-C-glucoside (Scoparin) | Spe, spu | |
| 19 | 22.3 | 254, 354 | 609/611 | 301 (M-rutinose) | 179, 151 | Rutin | Ppu, gpe, spe | |
| 20 | 23.0 | 268, 334 | 593/595 | 512 | 473 (M-120), 353 (M-240), 297 | Apigenin 6,8-di-C-glucoside (Vicenin-2) | Ppe, gpe, spe | |
| 21 | 20.9 | 262, 362 | 593/595 | 285/287 (Kaempferol) | 1187/1189 | Kaempferol-3-O-Rutinose | spe | |
| 22 | 23.9 | 285, 332 | 609/700 | 301/303 (Hesperetin) | 286, 177, 151 | Hesperidin (hesperetin 7-O-rutinoside) | Ppe, ppu, gpe, gpu, spe, spu | |
| 23 | 24.1 | 250, 268, 342 | 623/625 | 315 (M-rutinose) | 301, 179, 151 | Isorhamnetin-3-O-rutinoside | Ppe, ppu, gpe, gpu, spe | |
| 24 | 24.7 | 250, 342 | 477 | 315 (M-glucose) | 300, 179, 151 | Isorhamnetin-3-O-glucoside | Ppe | |
| 25 | 25.0 | 254, 267 | 609/611 | 489 (M-120) | 369 (M-240) | Luteolin 6,8-di-C-glucoside (Lucenin-2) | Ppe, ppu, spe, spu | |
| 26 | 26.0 | 250, 268, 342 | 461 | 301 (M-rhamnose) | 301 (M-rhamnose) | Isorhamnetin-3-O-rhamnoside | Ppu, spe | |
| 27 | 27.1 | 254, 267 | 447 | 327 (M-120) | 299 | Luteolin 8-C-Glucoside (orientin) | Ppe, spu | |
| 28 | 285, 362 | 577/579 | 271 | 177, 151, 119, 107 | Naringin (naringenin 7-O-neohesperidoside) | ppe, spe, gpu, ppu, gpe | ||
| 29 | 29.7 | 250, 268, 342 | 491 | 315, 301 | 301 | 7-O-Methyl-Isorhamnetin-3-O-glucoside | Spu, spe, gpu, ppu | |
| 30 | 31.1 | 255, 268, 345 | 607/609 | 563 | 299 (Chrysoeryol), 284 | Chrysoeriol 7-O-neohesperidoside | Spu, spe, gpu, ppu | |
| 31 | 20.0 | 250, 268, 342 | 461/463 | 341 (M-120)/343 | 298 | Diosmetin-6-C-glucoside | Gpu, spe, gpe | |
| 32 | 33.8 | 254, 354 | 463 | 301 (M-glucose) | 268, 179, 151 | Quercetin 3-O-glucoside (Isoquercitrin) | Spe, ppu | |
| 33 | 27.2 | 268, 334 | 473/475 | 429 | 323, 161, 221 | Apigenin 7-O-6''Acetyl-glucoside | Ppu, gpe, gpu, spe | |
| 34 | 38.9 | 268, 334 | 431/433 | 311 (M-120) | 283 | Apigenin-8-C-glucoside (vitexin) | Spe | |
| 35 | 40.1 | 268, 334 | 431/433 | 311 (M-120), 283 | 283 | Apigenin-6-C-glucoside (isovitexin) | ppu | |
| 36 | 38.8 | 254, 354 | 301 | 179, 151 | 179, 151 | Quercetin | Ppu, spe | |
| 37 | 250, 268, 342 | 299 | 179, 151 | 179, 151 | Diosmetin | ppu | ||
| 38 | 41.8 | 285, 325 | 287 | 179 | 151, 135, 125, 107 | Eriodictyol | Gpe, ppu, spe | |
| 39 | 42.0 | 268, 334 | 269 | 179 | 225, 201, 151 | Apigenin | gpe, spe, ppe | |
| 40 | 42.0 | 254, 267 | 285/287 | 269 (M-16) | 243, 241, 217 | Luteolin | Ppe, ppu, gpe, spe, spu, spe |


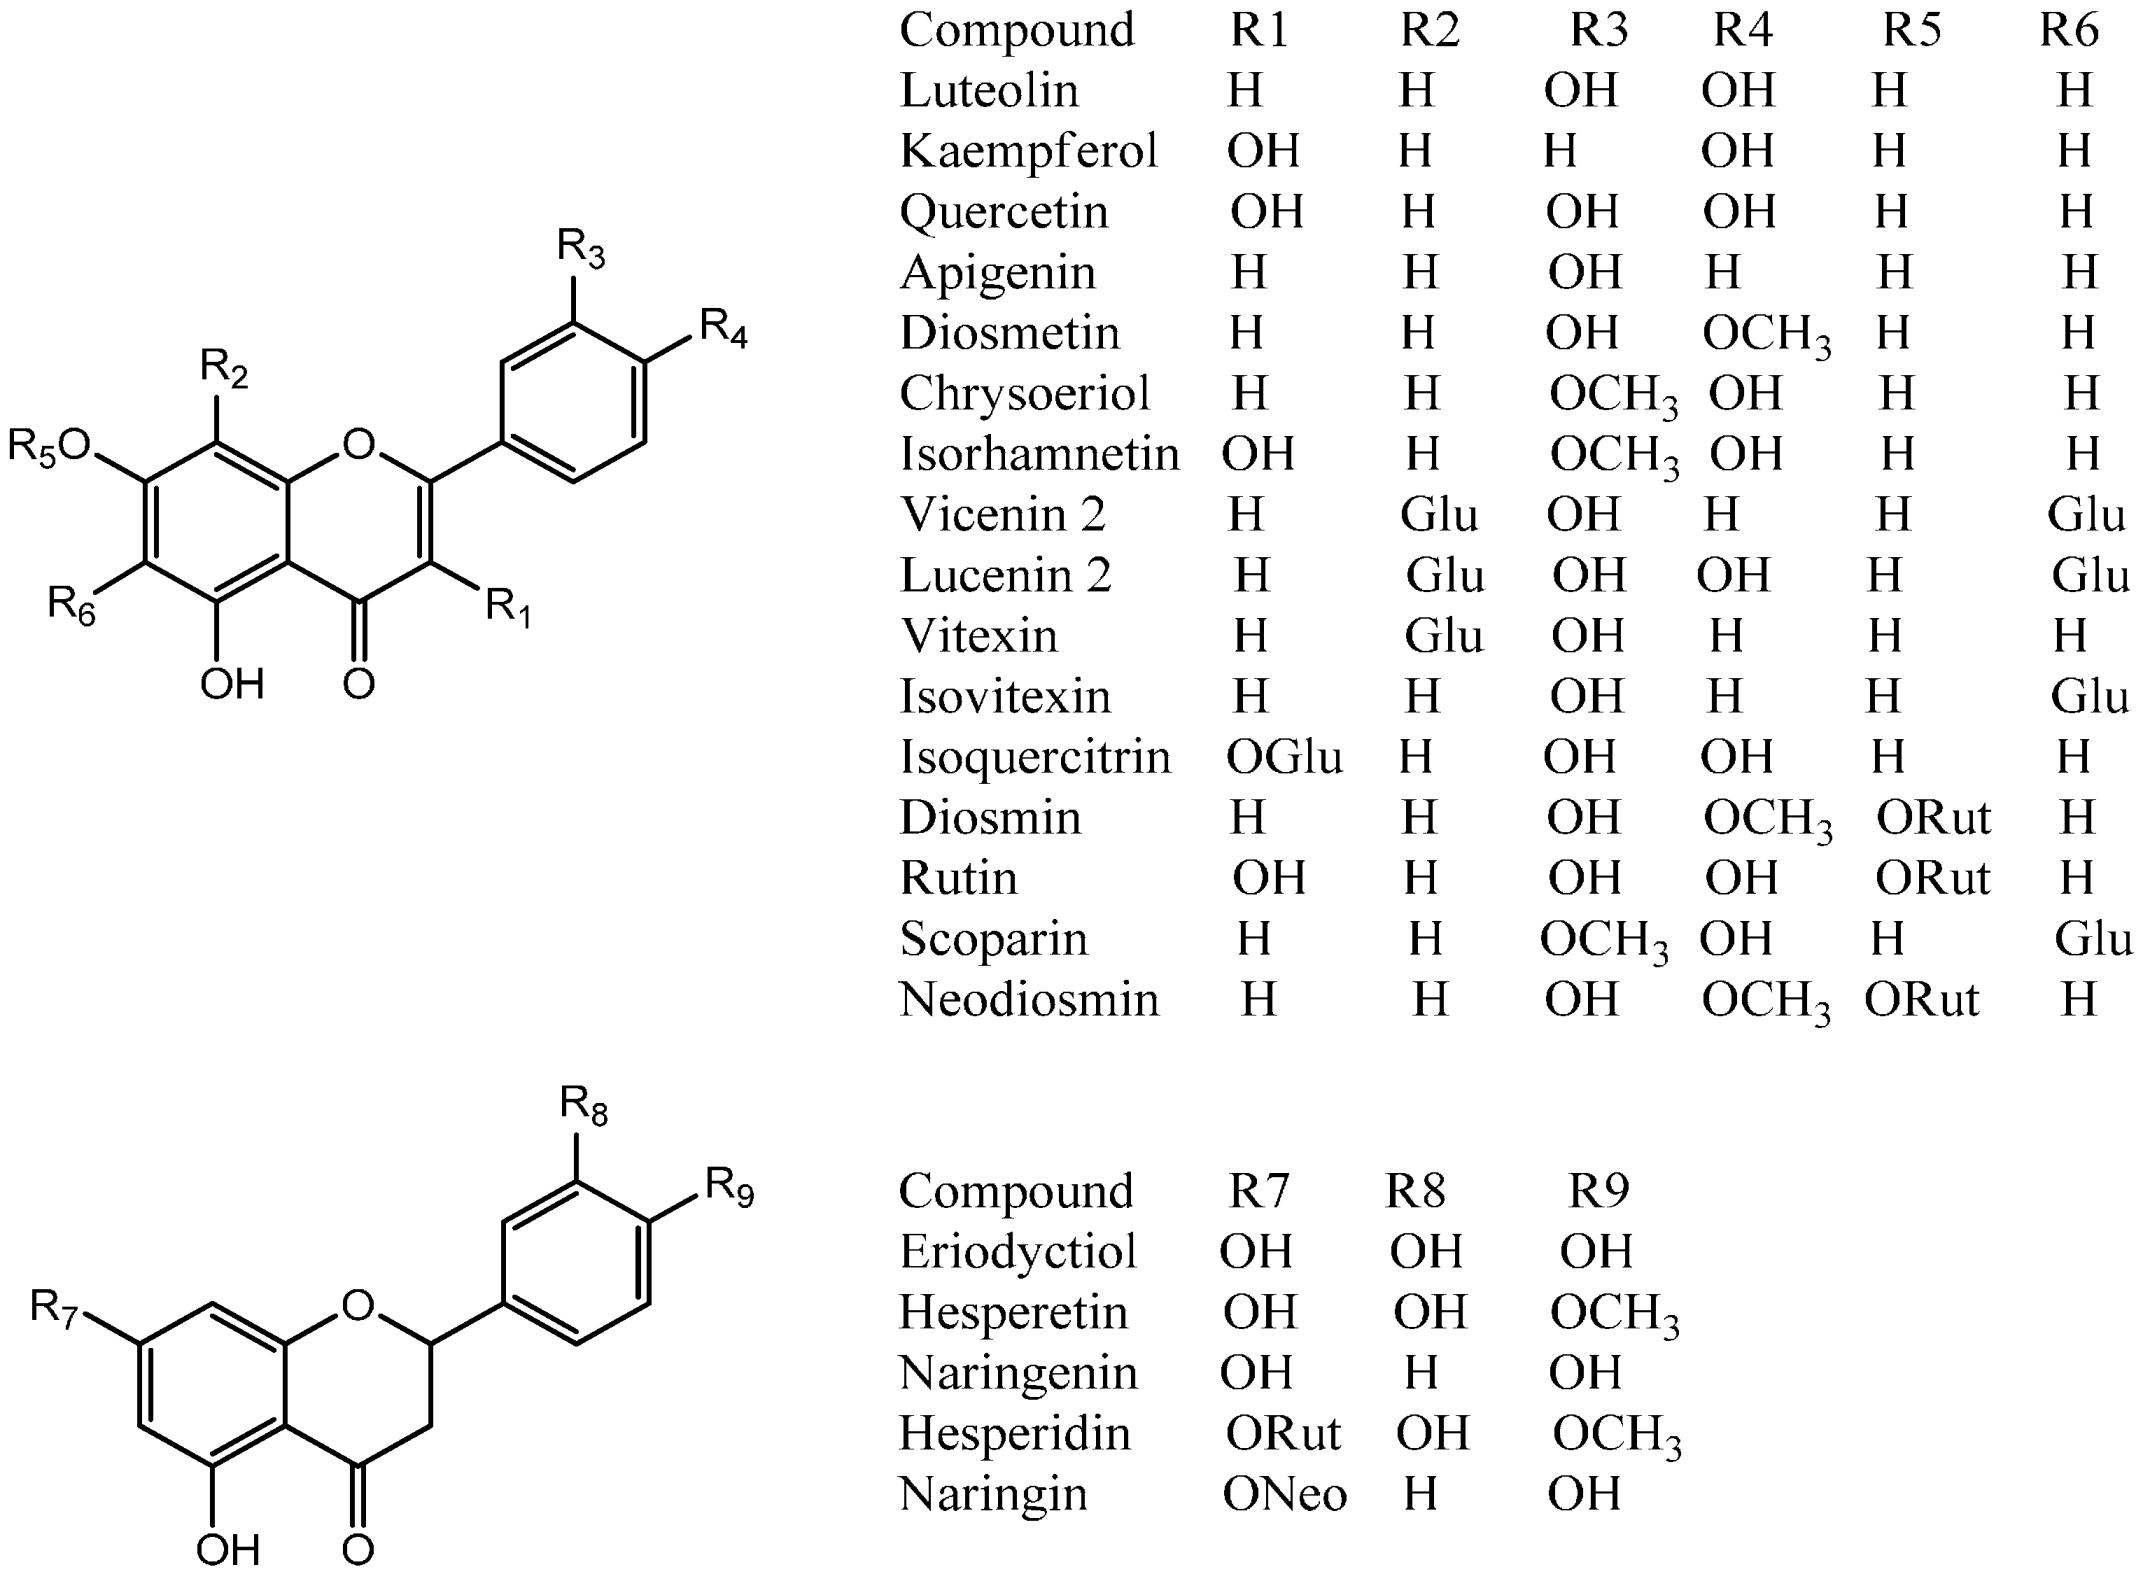
2.2.1. Flavonol O-Glycosides


2.2.2. Flavanone Glycoconjugates
2.2.3. Flavones C and O Glycosides
2.2.4. Flavonoid Aglycones
2.2.5. Other Compounds
3. Experimental Section
3.1. Chemicals and Plant Material
3.2. Sample Preparation
3.3. HPLC Analysis
3.4. Mass Spectrometric Conditions
3.5. Antioxidant Assessment
3.5.1. Free Radical Scavenging Activity
3.5.2. Ferric Reducing Antioxidant Power
3.5.3. Superoxide Anion Scavenging Activity
3.6. Polyphenol, Flavonoid and Vitamin C Contents
3.7. Statistical Analysis
4. Conclusions
Supplementary Materials
Supplementary Files
Supplementary File 1Acknowledgments
Author Contributions
Conflicts of Interest
References
- Labuschagne, C.F.; Brenkman, A.B. Current methods in quantifying ROS and oxidative damage in Caenorhabditis elegans and other model organism of aging. Ageing Res. Rev. 2013, 12, 918–930. [Google Scholar] [CrossRef] [PubMed]
- Amaro-Ortiz, A.; Yan, B.; D’Orazio, J.A. Ultraviolet radiation, aging and the skin: Prevention of damage by topical cAMP manipulation. Molecules 2014, 19, 6202–6219. [Google Scholar] [CrossRef] [PubMed]
- Pennington, J.A.T.; Fisher, R.A. Food component profiles for fruit and vegetable subgroups. J. Food Comp. Anal. 2010, 23, 411–418. [Google Scholar] [CrossRef]
- Giampieri, F.; Alvarez-Suarez, J.M.; Mazzoni, L.; Forbes-Hernandez, T.Y.; Gasparrini, M.; Gonzàlez-Paramàs, A.M.; Santos-Buelga, C.; Quiles, J.L.; Bompadre, S.; Mezzetti, B.; et al. Polyphenol-rich strawberry extract protects human dermal fibroblasts against hydrogen peroxide oxidative damage and Improves mitochondrial functionality. Molecules 2014, 19, 7798–7816. [Google Scholar] [CrossRef] [PubMed]
- Giampieri, F.; Alvarez-Suarez, J.M.; Battino, M. Strawberry and Human Health: Effects beyond Antioxidant Activity. J. Agric. Food Chem. 2014, 62, 3867–3876. [Google Scholar] [CrossRef]
- Mulero, J.; Bernabe, J.; Cerda, B.; García-Viguera, C.; Moreno, D.A.; Albaladejo, M.D.; Avilés, F.; Parra, S.; Abellán, J.; Zafrilla, P. Variations on cardiovascular risk factors in metabolic syndrome after consume of a citrus-based juice. Clin. Nutr. 2012, 31, 372–377. [Google Scholar] [CrossRef] [PubMed]
- Buachan, P.; Chularojmontri, L.; Wattanapitayakul, S.K. Fruits on Human Endothelial Cells: Enhancing Cell Migration and Delaying Cellular Aging. Selected Activities of Citrus Maxima Merr. Nutrients 2014, 6, 1618–1634. [Google Scholar] [CrossRef] [PubMed]
- Benavente-Garcia, O.; Castillo, J. Update on uses and properties of citrus flavonoids: New findings in anticancer, cardiovascular, and anti-inflammatory activity. J. Agric. Food Chem. 2008, 56, 6185–6205. [Google Scholar] [CrossRef] [PubMed]
- Mokbel, M.S.; Hashinaga, F. Evaluation of the antioxidant activity of extracts from buntan (Citrus grandis Osbeck) fruit tissues. Food Chem. 2006, 94, 529–534. [Google Scholar]
- Dahmoune, F.; Boulekbache, L.; Moussi, K.; Aoun, O.; Spigno, G.; Madani, K. Valorization of Citrus limon residues for the recovery of antioxidants: Evaluation and optimization of microwave and ultrasound application to solvent extraction. Ind. Crops Prod. 2013, 50, 77–87. [Google Scholar] [CrossRef]
- Bocco, A.; Cuvelier, M.-E.; Richard, H.; Berset, C. Antioxidant Activity and Phenolic Composition of Citrus Peel and Seed Extracts. J. Agric. Food Chem. 1998, 46, 2123–2129. [Google Scholar] [CrossRef]
- Liu, E.-H.; Zhao, P.; Duan, L.; Zheng, G.-D.; Guo, L.; Yang, H.; Li, P. Simultaneous determination of six bioactive flavonoids in Citri Reticulatae Pericarpium by rapid resolution liquid chromatographycoupled with triple quadrupole electrospray tandem mass spectrometry. Food Chem. 2013, 141, 3977–3983. [Google Scholar] [CrossRef]
- Abad-García, B.; Garmón-Lobato, S.; Berrueta, L.A.; Gallo, B.; Vicente, F. On line characterization of 58 phenolic compounds in Citrus fruit juices from Spanish cultivars by high-performance liquid chromatography with photodiode-array detection coupled to electrospray ionization triple quadrupole mass spectrometry. Talanta 2012, 99, 213–224. [Google Scholar] [PubMed]
- Di Donna, L.; Taverna, D.; Mazzotti, F.; Benabdelkamel, H.; Attya, M.; Napoli, A.; Sindona, G. Comprehensive assay of flavanones in citrus juices and beverages by UHPLC-ESI-MS/MS and derivatization chemistry. Food Chem. 2013, 141, 2328–2333. [Google Scholar] [CrossRef]
- He, D.X.; Shan, Y.; Wu, Y.H.; Liu, G.Z.; Chen, B.; Yao, S.Z. Simultaneous determination of flavanones, hydroxycinnamic acids and alkaloids in citrus fruits by HPLC-DAD-ESI/MS. Food Chem. 2011, 127, 880–885. [Google Scholar] [CrossRef] [PubMed]
- Patil, J.R.; Jayaprakasha, G.K.; Murthy, K.N.C.; Chetti, M.B.; Patil, B.S. Characterization of Citrus aurantifolia bioactive compounds and their inhibition of human pancreatic cancer cells through apoptosis. Microchem. J. 2010, 94, 108–117. [Google Scholar] [CrossRef]
- Steinmann, D.; Ganzera, M. Recent advances on HPLC/MS in medicinal plant analysis. J. Pharm. Biomed. Anal. 2011, 55, 744–757. [Google Scholar] [CrossRef] [PubMed]
- Wright, P. Metabolite identification by mass spectrometry: Forty years of evolution. Xenobiotica 2011, 41, 670–686. [Google Scholar] [CrossRef] [PubMed]
- Mattoli, L.; Cangi, F.; Ghiara, C.; Burico, M.; Maidecchi, A.; Bianchi, E.; Ragazzi, E.; Bellotto, L.; Seraglia, R.; Traldi, P. A metabolite fingerprinting for the characterization of commercial botanical dietary supplements. Metabolomics 2011, 7, 437–445. [Google Scholar] [CrossRef]
- Aliferis, K.A.; Chrysayi-Tokousbalides, M. Metabolomics in pesticide research and development: Review and future perspectives. Metabolomics 2011, 7, 35–53. [Google Scholar] [CrossRef]
- Kang, H.J.; Yang, H.J.; Kim, M.J.; Han, E.S.; Kim, H.J.; Kwon, D.Y. Metabolomic analysis of meju during fermentation by ultra performance liquid chromatography-quadrupole-time of flight mass spectrometry (UPLC-Q-TOF MS). Food Chem. 2011, 127, 1056–1064. [Google Scholar] [CrossRef] [PubMed]
- Gattuso, G.; Barreca, D.; Gargiulli, C.; Leuzzi, U.; Caristi, C. Flavonoid Composition of Citrus Juices. Molecules 2007, 1641–1673. [Google Scholar]
- García-Salas, P.; Gómez-Caravaca, A.M.; Arráez-Román, D.; Segura-Carretero, A.; Guerra-Hernández, E.; García-Villanova, B.; Fernández-Gutiérrez, A. Influence of technological processes on phenolic compounds, organic acids, furanic derivatives, and antioxidant activity of whole-lemon powder. Food Chem. 2013, 141, 869–878. [Google Scholar] [CrossRef] [PubMed]
- Brito, A.; Areche, C.; Sepúlveda, B.; Kennelly, E.J.; Simirgiotis, M.J. Anthocyanin characterization, total phenolic quantification and antioxidant features of some Chilean edible berry extracts. Molecules 2014, 19, 10936–10955. [Google Scholar] [CrossRef] [PubMed]
- Ramirez, J.E.; Zambrano, R.; Sepúlveda, B.; Simirgiotis, M.J. Antioxidant Properties and Hyphenated HPLC-PDA-MS Profiling of Chilean Pica Mango Fruits (Mangifera indica L. Cv. piqueño). Molecules 2014, 19, 438–458. [Google Scholar] [CrossRef]
- Abeysinghe, D.C.; Li, X.; Sun, C.D.; Zhang, W.S.; Zhou, C.H.; Chen, K. Bioactive compounds and antioxidant capacities in diferent edible tissues of citrus fruit of four species. Food Chem. 2007, 104, 1338–1344. [Google Scholar] [CrossRef]
- Huang, Y.-S.; Ho, S.-C. Polymethoxy flavones are responsible for the anti-inflammatory activity of citrus fruit peel. Food Chem. 2010, 119, 868–873. [Google Scholar] [CrossRef]
- Niki, E. Antioxidant capacity: Which capacity and how to assess it? J. Berry Res. 2011, 4, 169–176. [Google Scholar]
- Prior, R.L.; Wu, X.; Schaich, K. Standardized Methods for the Determination of Antioxidant Capacity and Phenolics in Foods and Dietary Supplements. J. Agric. Food Chem. 2005, 53, 4290–4302. [Google Scholar] [CrossRef] [PubMed]
- Kevers, C.; Pincemail, J.; Defraigne, J.O.; Dommes, J. Antioxidant capacity of small dark fruits: Influence of cultivars and harvest time. J. Berry Res. 2014, 4, 97–105. [Google Scholar]
- De Moraes Barros, H.R.; Pinto de Castro Ferreira, T.A.; Genovese, M.I. Antioxidant capacity and mineral content of pulp and peel from commercial cultivars of citrus from Brazil. Food Chem. 2012, 134, 1892–1898. [Google Scholar] [CrossRef] [PubMed] [Green Version]
- Xua, G.; Liu, D.; Chen, J.; Ye, X.; Ma, Y.; Shi, J. Juice components and antioxidant capacity of citrus varieties cultivated in China. Food Chem. 2008, 106, 545–551. [Google Scholar] [CrossRef]
- Akhatou, I.; Fernández-Recamales, Á. Nutritional and Nutraceutical Quality of Strawberries in Relation to Harvest Time and Crop Conditions. J. Agric. Food Chem. 2014, 62, 5749–5760. [Google Scholar] [CrossRef] [PubMed]
- Simirgiotis, M.J. Antioxidant Capacity and HPLC-DAD-MS Profiling of Chilean Peumo (Cryptocarya alba) Fruits and Comparison with German Peumo (Crataegus monogyna) from Southern Chile. Molecules 2013, 18, 2061–2080. [Google Scholar] [CrossRef] [PubMed]
- Mabry, T.J.; Markham, K.R.; Thomas, M.B. The Systematic Identification of Flavonoids, Part II; Springer-Verlag: Berlin, Germany, 1970. [Google Scholar]
- Sun, J.; Liang, F.; Bin, Y.; Li, P.; Duan, C. Screening non-colored phenolics in red wines using liquid chromatography/ultraviolet and mass spectrometry/mass spectrometry libraries. Molecules 2007, 12, 679–693. [Google Scholar] [CrossRef] [PubMed]
- Simirgiotis, M.J.; Theoduloz, C.; Caligari, P.D.S.; Schmeda-Hirschmann, G. Comparison of phenolic composition and antioxidant properties of two native Chilean and one domestic strawberry genotypes. Food Chem. 2009, 113, 377–385. [Google Scholar] [CrossRef]
- Fabre, N.; Rustan, I.; de Hoffmann, E.; Quetin-Leclercq, J. Determination of flavone, flavonol, and flavanone aglycones by negativeion liquid chromatography electrospray ion trap mass spectrometry. J. Am. Soc. Mass Spectrom. 2001, 12, 707–715. [Google Scholar] [CrossRef] [PubMed]
- Abu-Reidah, I.M.; Arráez-Román, D.; Segura-Carretero, A.; Fernández-Gutiérrez, A. Profiling of phenolic and other polar constituents from hydro-methanolic extract of watermelon (Citrullus lanatus) by means of accurate-mass spectrometry (HPLC–ESI–QTOF–MS). Food Res. Int. 2013, 51, 354–362. [Google Scholar] [CrossRef]
- Simirgiotis, M.J.; Schmeda-Hirschmann, G.; Borquez, J.; Kennelly, E.J. The Passiflora tripartita (Banana Passion) fruit: A source of bioactive flavonoid C-glycosides Isolated by HSCCC and characterized by HPLC-DAD-ESI/MS/MS. Molecules 2013, 18, 1672–1692. [Google Scholar] [CrossRef] [PubMed] [Green Version]
- Lin, L.-Z.; Harnly, J.M. Identification of the phenolic components of chrysanthemum flower (Chrysanthemum morifolium Ramat). Food Chem. 2010, 120, 319–326. [Google Scholar] [CrossRef]
- Engels, C.; Gräter, D.; Esquivel, P.; Jiménez, V.M.; Gänzle, M.G.; Schieber, A. Characterization of phenolic compounds in jocote (Spondias purpurea L.) peels by ultra high-performance liquid chromatography/electrospray ionization mass spectrometry. Food Res. Int. 2012, 46, 557–562. [Google Scholar]
- Yu, E.A.; Kim, G.-S.; Jeong, S.W.; Park, S.; Lee, S.J.; Kim, J.H.; Lee, W.S.; Bark, K.-M.; Jin, J.S.; Shin, S.C. Flavonoid profile and biological activity of Korean citrus varieties (II): Pyunkyul (Citrus tangerina Hort. ex Tanaka) and overall contribution of its flavonoids to antioxidant effect. J. Funct. Foods 2014, 6, 637–642. [Google Scholar] [CrossRef]
- Han, L.; Liu, X.; Yang, N.; Li, J.; Cai, B.; Cheng, S. Simultaneous chromatographic fingerprinting and quantitative analysis of flavonoids in Pollen Typhae by high-performance capillary electrophoresis. Acta Pharm. Sin. B 2012, 2, 602–609. [Google Scholar] [CrossRef]
- Carazzone, C.; Mascherpa, D.; Gazzani, G.; Papetti, A. Identification of phenolic constituents in red chicory salads (Cichorium intybus) by high-performance liquid chromatography with diode array detection and electrospray ionisation tandem mass spectrometry. Food Chem. 2013, 138, 1062–1071. [Google Scholar] [CrossRef] [PubMed]
- Ferreres, F.; Grosso, C.; Gil-Izquierdo, A.; Valentão, P.; Andrade, P.B. Phenolic compounds from Jacaranda caroba (Vell.) A. DC.: Approaches to neurodegenerative disorders. Food Chem. Toxicol. 2013, 57, 91–98. [Google Scholar] [CrossRef] [PubMed]
- Simirgiotis, M.J.; Ramirez, J.E.; Schmeda Hirschmann, G.; Kennelly, E.J. Bioactive coumarins and HPLC-PDA-ESI-ToF-MS metabolic profiling of edible queule fruits (Gomortega keule), an endangered endemic Chilean species. Food Res. Int. 2013, 54, 532–543. [Google Scholar] [CrossRef]
- Perestrelo, R.; Lu, Y.; Santos, S.A.O.; Silvestre, A.J.D.; Neto, C.P.; Câmara, J.S.; Rocha, S.M. Phenolic profile of Sercial and Tinta Negra Vitis vinifera L. grape skins by HPLC-DAD-ESI-MSn: Novel phenolic compounds in Vitis vinifera L. grape. Food Chem. 2012, 135, 94–104. [Google Scholar] [CrossRef]
- Nagy, T.O.; Solar, S.; Sontag, G.; Koenig, J. Identification of phenolic components in dried spices and influence of irradiation. Food Chem. 2011, 128, 530–534. [Google Scholar] [CrossRef] [PubMed]
- Vallverdú-Queralt, A.; Jáuregui, O.; Medina-Remon, A.; Andrés-Lacueva, C.; Lamuela-Raventós, R.M. Improved characterization of tomato polyphenols using liquid chromatography/electrospray ionization linear ion trap quadrupole Orbitrap mass spectrometry and liquid chromatography/electrospray ionization tandem mass spectrometry. Rap. Commun. Mass Spectrom. 2010, 24, 2986–2992. [Google Scholar] [CrossRef]
- Simirgiotis, M.J.; Silva, M.; Becerra, J.; Schmeda-Hirschmann, G. Direct characterisation of phenolic antioxidants in infusions from four Mapuche medicinal plants by liquid chromatography with diode array detection (HPLC-DAD) and electrospray ionisation tandem mass spectrometry (HPLC-ESI–MS). Food Chem. 2012, 131, 318–327. [Google Scholar] [CrossRef]
- Surco-Laos, F.; Dueñas, M.; González-Manzano, S.; Cabello, J.; Santos-Buelga, C.; González-Paramás, A.M. Influence of catechins and their methylated metabolites on lifespan and resistance to oxidative and thermal stress of Caenorhabditis elegans and epicatechin uptake. Food Res. Int. 2012, 46, 514–521. [Google Scholar] [CrossRef]
- Vallverdú-Queralt, A.; Jáuregui, O.; di Lecce, G.; Andrés-Lacueva, C.; Lamuela-Raventós, R.M. Screening of the polyphenol content of tomato-based products through accurate-mass spectrometry (HPLC-ESI-QTOF). Food Chem. 2011, 129, 877–883. [Google Scholar] [CrossRef] [PubMed]
- McNab, H.; Ferreira, E.S.B.; Hulme, A.N.; Quye, A. Negative ion ESI-MS analysis of natural yellow dye flavonoids—An isotopic labelling study. Int. J. Mass Spectrom. 2009, 284, 57–65. [Google Scholar] [CrossRef]
- Simirgiotis, M.J.; Schmeda-Hirschmann, G. Determination of phenolic composition and antioxidant activity in fruits, rhizomes and leaves of the white strawberry (Fragaria chiloensis spp. chiloensis form chiloensis) using HPLC-DAD-ESI-MS and free radical quenching techniques. J. Food Comp. Anal. 2010, 23, 545–553. [Google Scholar] [CrossRef]
- Benzie, I.F.F.; Strain, J.J. The ferric reducing ability of plasma (FRAP) as a measure of “Antioxidant Power”: The FRAP assay. Anal. Biochem. 1996, 239, 70–76. [Google Scholar] [PubMed]
- Simirgiotis, M.J.; Adachi, S.; To, S.; Yang, H.; Reynertson, K.A.; Basile, M.J.; Gil, R.R.; Weinstein, I.B.; Kennelly, E.J. Cytotoxic chalcones and antioxidants from the fruits of Syzygium samarangense (Wax Jambu). Food Chem. 2008, 107, 813–819. [Google Scholar] [CrossRef] [PubMed]
- Sample Availability: Samples of the fruits and extracts are available from the authors.
© 2014 by the authors. Licensee MDPI, Basel, Switzerland. This article is an open access article distributed under the terms and conditions of the Creative Commons Attribution license ( http://creativecommons.org/licenses/by/4.0/).
Share and Cite
Brito, A.; Ramirez, J.E.; Areche, C.; Sepúlveda, B.; Simirgiotis, M.J. HPLC-UV-MS Profiles of Phenolic Compounds and Antioxidant Activity of Fruits from Three Citrus Species Consumed in Northern Chile. Molecules 2014, 19, 17400-17421. https://doi.org/10.3390/molecules191117400
Brito A, Ramirez JE, Areche C, Sepúlveda B, Simirgiotis MJ. HPLC-UV-MS Profiles of Phenolic Compounds and Antioxidant Activity of Fruits from Three Citrus Species Consumed in Northern Chile. Molecules. 2014; 19(11):17400-17421. https://doi.org/10.3390/molecules191117400
Chicago/Turabian StyleBrito, Anghel, Javier E. Ramirez, Carlos Areche, Beatriz Sepúlveda, and Mario J. Simirgiotis. 2014. "HPLC-UV-MS Profiles of Phenolic Compounds and Antioxidant Activity of Fruits from Three Citrus Species Consumed in Northern Chile" Molecules 19, no. 11: 17400-17421. https://doi.org/10.3390/molecules191117400