3D-QSAR/CoMFA-Based Structure-Affinity/Selectivity Relationships of Aminoalkylindoles in the Cannabinoid CB1 and CB2 Receptors

 ,
,
Abstract
:
1. Introduction

2. Results and Discussion
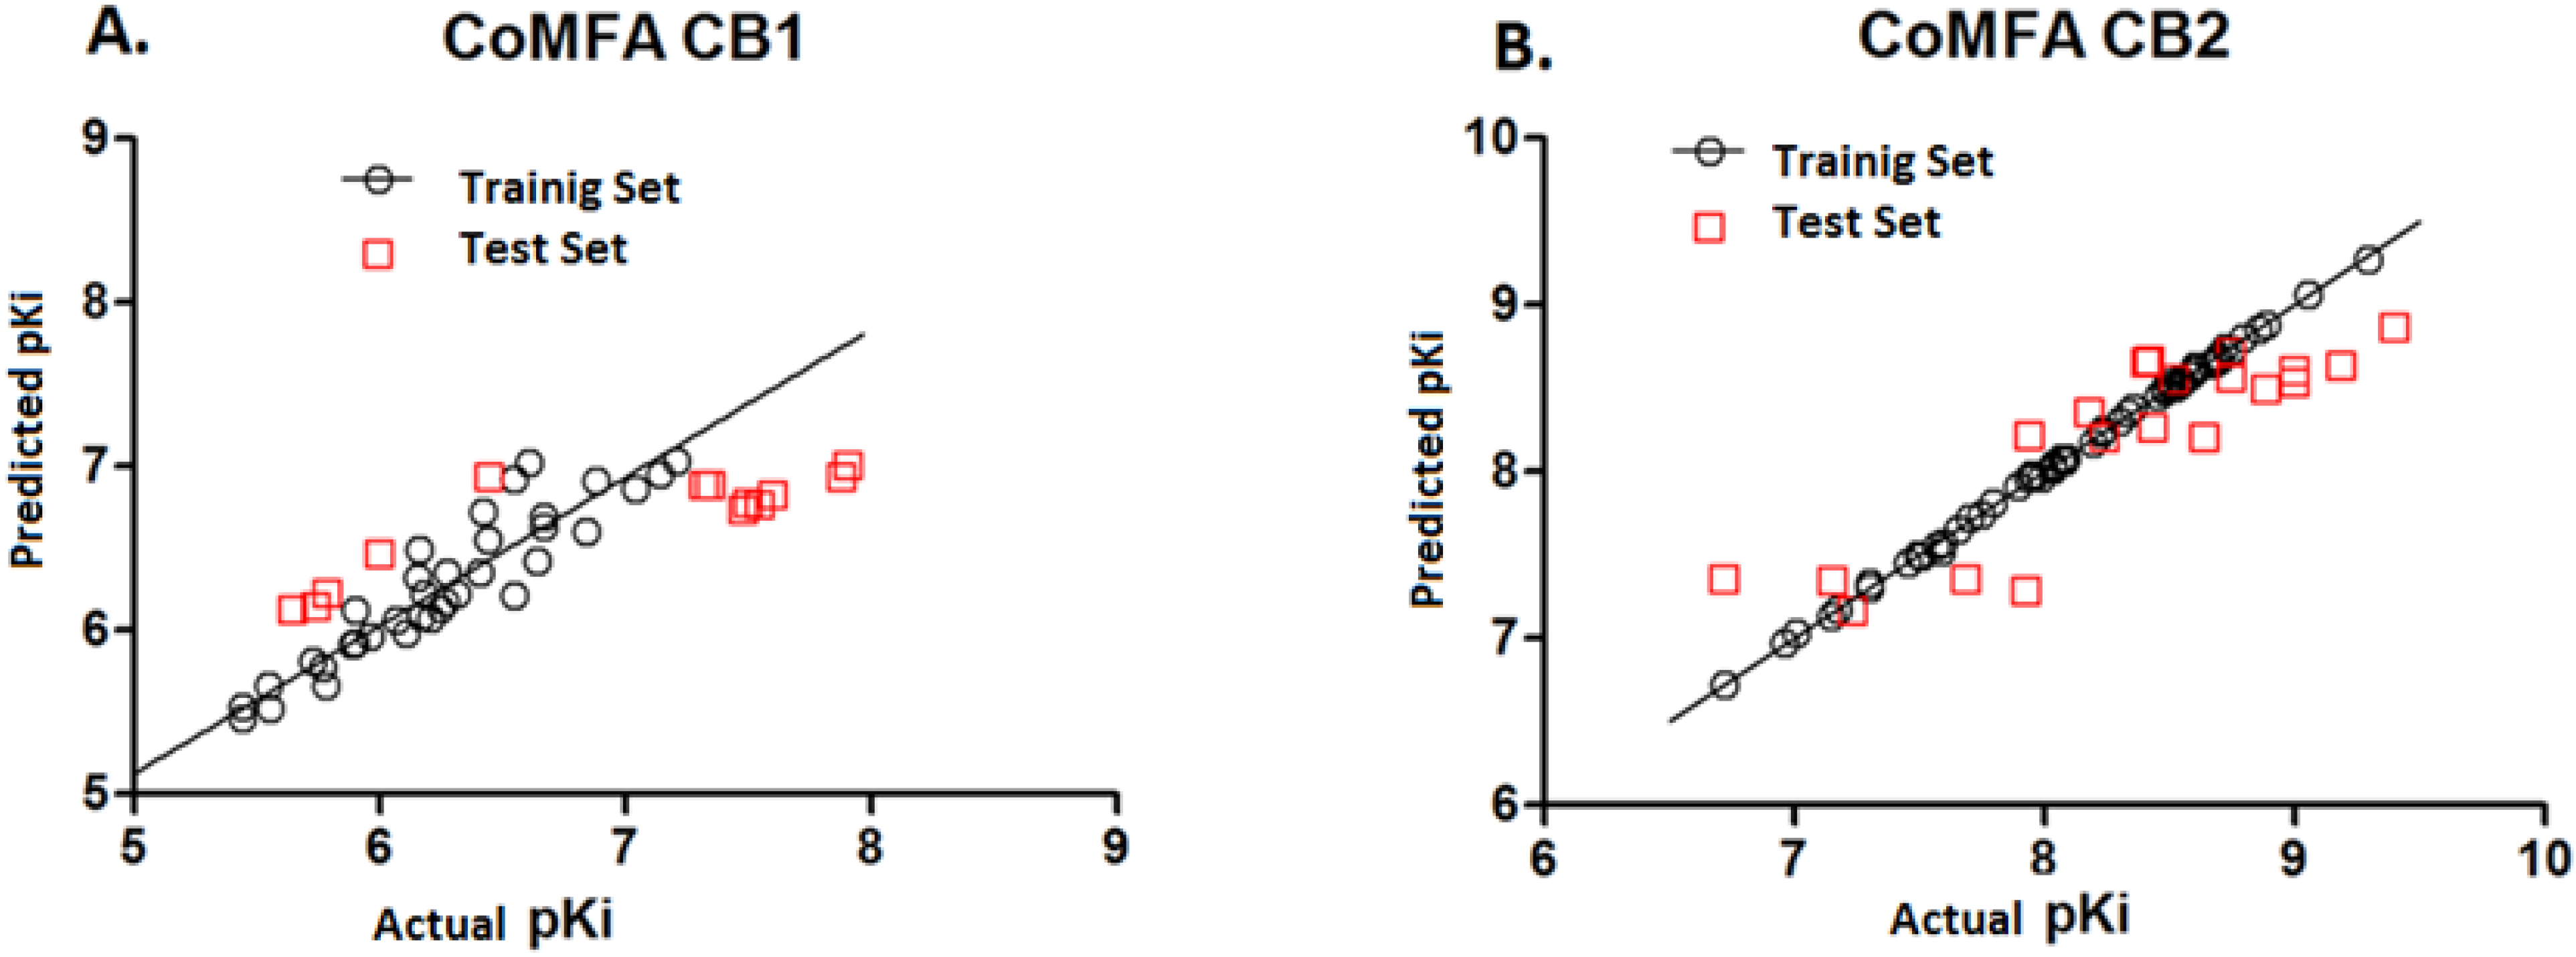
2.1. Cannabinoid CB1 and CB2 CoMFA Models

| CoMFA CB1 | %Contribution | ||||||||
|---|---|---|---|---|---|---|---|---|---|
| N | q2 | r2 | SEE | F | PRESS | SD | r2pred | Steric | Electrostatic |
| 2 | 0.722 | 0.845 | 0.197 | 100 | 5.46 | 15.22 | 0.641 | 71.4 | 28.6 |
| CoMFA CB2 | |||||||||
| 10 | 0.643 | 0.999 | 0.021 | 4376 | 2.56 | 10.16 | 0.748 | 71.2 | 28.8 |
| CoMFA CB1 | ||||
|---|---|---|---|---|
| Molecule | Ki CB1 | Actual pKi | Predicted pKi | Residual |
| (nM) | (M) | (M) | ||
| Training Set | ||||
| 1 | 1660 | 5.78 | 5.664 | 0.12 |
| 2 | 488 | 6.312 | 6.223 | 0.09 |
| 3 | 698 | 6.156 | 6.325 | −0.17 |
| 4 | 530 | 6.276 | 6.352 | −0.08 |
| 5 | 3617 | 5.442 | 5.462 | −0.02 |
| 6 | 2791 | 5.554 | 5.526 | 0.03 |
| 7 | 3621 | 5.441 | 5.531 | −0.09 |
| 8 | 1258.9 | 5.9 | 5.918 | −0.02 |
| 9 | 389 | 6.41 | 6.353 | 0.06 |
| 10 | 245.5 | 6.61 | 7.022 | −0.41 |
| 11 | 1096.5 | 5.96 | 5.958 | 0.00 |
| 12 | 281.8 | 6.55 | 6.216 | 0.33 |
| 13 | 2818.4 | 5.55 | 5.665 | −0.12 |
| 14 | 776.2 | 6.11 | 5.978 | 0.13 |
| 15 | 851.1 | 6.07 | 6.065 | 0.01 |
| 16 | 1288.2 | 5.89 | 5.911 | −0.02 |
| 17 | 1698.2 | 5.77 | 5.775 | −0.01 |
| 18 | 1862.1 | 5.73 | 5.808 | −0.08 |
| 19 | 229.1 | 6.64 | 6.417 | 0.22 |
| 20 | 363.1 | 6.44 | 6.551 | −0.11 |
| 21 | 616.6 | 6.21 | 6.07 | 0.14 |
| 22 | 131.8 | 6.88 | 6.907 | −0.03 |
| 23 | 61.7 | 7.21 | 7.036 | 0.17 |
| 24 | 72.4 | 7.14 | 6.948 | 0.19 |
| 25 | 537 | 6.27 | 6.176 | 0.09 |
| 26 | 562.3 | 6.25 | 6.13 | 0.12 |
| 27 | 91.2 | 7.04 | 6.859 | 0.18 |
| 28 | 213.8 | 6.67 | 6.695 | −0.03 |
| 29 | 281.8 | 6.55 | 6.921 | −0.37 |
| 30 | 144.5 | 6.84 | 6.605 | 0.24 |
| 31 | 676.1 | 6.17 | 6.083 | 0.09 |
| 32 | 660.7 | 6.18 | 6.222 | −0.04 |
| 33 | 380.2 | 6.42 | 6.723 | −0.30 |
| 34 | 213.8 | 6.67 | 6.635 | 0.04 |
| 35 | 691.8 | 6.16 | 6.487 | −0.33 |
| 36 | 1258.9 | 5.9 | 6.12 | −0.22 |
| Test Set | ||||
| 37 | 1828.1 | 5.738 | 6.141 | −0.4 |
| 38 | 12.3 | 7.91 | 6.999 | 0.91 |
| 39 | 13.2 | 7.88 | 6.93 | 0.95 |
| 40 | 44.7 | 7.35 | 6.886 | 0.46 |
| 41 | 33.1 | 7.48 | 6.73 | 0.75 |
| 42 | 28.2 | 7.55 | 6.762 | 0.79 |
| 43 | 1000 | 6 | 6.462 | −0.46 |
| 44 | 31.6 | 7.5 | 6.773 | 0.73 |
| 45 | 25.1 | 7.6 | 6.825 | 0.77 |
| 46 | 1621.8 | 5.79 | 6.218 | −0.43 |
| 47 | 354.8 | 6.45 | 6.927 | −0.48 |
| 48 | 47.9 | 7.32 | 6.883 | 0.44 |
| 49 | 2238.7 | 5.65 | 6.124 | −0.47 |
| Training Set | ||||
| 1 | 110 | 6.959 | 6.974 | −0.02 |
| 2 | 98 | 7.009 | 7.028 | −0.02 |
| 3 | 67 | 7.174 | 7.169 | 0.01 |
| 4 | 50 | 7.301 | 7.33 | −0.03 |
| 5 | 10.3 | 7.987 | 7.964 | 0.02 |
| 7 | 6.4 | 8.196 | 8.174 | 0.02 |
| 10 | 3.2 | 8.495 | 8.536 | −0.04 |
| 11 | 3.3 | 8.481 | 8.478 | 0.00 |
| 12 | 4.6 | 8.337 | 8.348 | −0.01 |
| 15 | 4.4 | 8.357 | 8.385 | −0.03 |
| 17 | 26 | 7.585 | 7.522 | 0.06 |
| 20 | 11 | 7.959 | 7.972 | −0.01 |
| 21 | 16 | 7.796 | 7.811 | −0.02 |
| 23 | 2.6 | 8.585 | 8.579 | 0.01 |
| 24 | 2.1 | 8.678 | 8.647 | 0.03 |
| 25 | 5.9 | 8.229 | 8.234 | −0.01 |
| 27 | 2.8 | 8.553 | 8.545 | 0.01 |
| 28 | 3.3 | 8.481 | 8.5 | −0.02 |
| 30 | 1.8 | 8.745 | 8.73 | 0.02 |
| 34 | 8.2 | 8.086 | 8.079 | 0.01 |
| 35 | 2.8 | 8.553 | 8.542 | 0.01 |
| 37 | 17.8 | 7.75 | 7.743 | 0.01 |
| 41 | 0.9 | 9.056 | 9.06 | 0.00 |
| 43 | 2.9 | 8.538 | 8.521 | 0.02 |
| 45 | 1.4 | 8.854 | 8.847 | 0.01 |
| 49 | 31 | 7.509 | 7.489 | 0.02 |
| 50 | 50 | 7.301 | 7.299 | 0.00 |
| 51 | 189 | 6.724 | 6.719 | 0.01 |
| 52 | 12.7 | 7.896 | 7.907 | −0.01 |
| 53 | 25.4 | 7.595 | 7.567 | 0.03 |
| 54 | 11.2 | 7.951 | 7.98 | -0.03 |
| 55 | 22.2 | 7.654 | 7.651 | 0.00 |
| 56 | 11.6 | 7.936 | 7.964 | −0.03 |
| 57 | 2.5 | 8.606 | 8.608 | 0.00 |
| 58 | 2 | 8.693 | 8.691 | 0.00 |
| 59 | 70.8 | 7.15 | 7.134 | 0.02 |
| 60 | 5 | 8.301 | 8.299 | 0.00 |
| 61 | 1.6 | 8.796 | 8.806 | −0.01 |
| 62 | 3 | 8.523 | 8.498 | 0.03 |
| 63 | 2.5 | 8.602 | 8.635 | −0.03 |
| 64 | 3.5 | 8.456 | 8.452 | 0.00 |
| 65 | 8.5 | 8.071 | 8.082 | −0.01 |
| 66 | 0.5 | 9.292 | 9.273 | 0.02 |
| 67 | 9.3 | 8.032 | 8.028 | 0.00 |
| 68 | 3.1 | 8.509 | 8.504 | 0.01 |
| 69 | 9.3 | 8.032 | 8.039 | −0.01 |
| 70 | 27 | 7.569 | 7.556 | 0.01 |
| 71 | 32 | 7.495 | 7.502 | −0.01 |
| 72 | 1.9 | 8.721 | 8.743 | −0.02 |
| 73 | 5.8 | 8.237 | 8.254 | −0.02 |
| 74 | 9.2 | 8.036 | 8.01 | 0.03 |
| 75 | 2 | 8.699 | 8.671 | 0.03 |
| 76 | 2.1 | 8.678 | 8.661 | 0.02 |
| 77 | 2.2 | 8.658 | 8.644 | 0.01 |
| 78 | 3.1 | 8.509 | 8.532 | −0.02 |
| 79 | 2.9 | 8.538 | 8.554 | −0.02 |
| 80 | 20 | 7.699 | 7.721 | −0.02 |
| 81 | 8.3 | 8.081 | 8.066 | 0.02 |
| 82 | 1.3 | 8.886 | 8.884 | 0.00 |
| 83 | 35 | 7.456 | 7.455 | 0.00 |
| Test Set | ||||
| 6 | 5.7 | 8.242 | 8.202 | 0.04 |
| 8 | 3 | 8.523 | 8.553 | −0.03 |
| 9 | 3.9 | 8.409 | 8.651 | −0.24 |
| 18 | 58 | 7.237 | 7.164 | 0.07 |
| 26 | 2.3 | 8.638 | 8.205 | 0.43 |
| 32 | 1.3 | 8.886 | 8.494 | 0.39 |
| 33 | 1 | 9.004 | 8.606 | 0.40 |
| 36 | 11.5 | 7.939 | 8.209 | −0.27 |
| 39 | 0.7 | 9.187 | 8.635 | 0.55 |
| 42 | 1 | 9 | 8.53 | 0.47 |
| 48 | 3.7 | 8.432 | 8.264 | 0.17 |
| 84 | 11.8 | 7.928 | 7.283 | 0.65 |
| 85 | 20.5 | 7.688 | 7.353 | 0.34 |
| 86 | 70 | 7.155 | 7.346 | −0.19 |
| 87 | 6.6 | 8.18 | 8.353 | -0.17 |
| 88 | 190 | 6.721 | 7.35 | −0.63 |
| 89 | 3.8 | 8.42 | 8.662 | −0.24 |
| 90 | 0.4 | 9.398 | 8.863 | 0.53 |
| 91 | 1.8 | 8.745 | 8.715 | 0.03 |
| 92 | 1.8 | 8.745 | 8.557 | 0.19 |

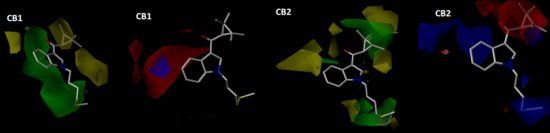
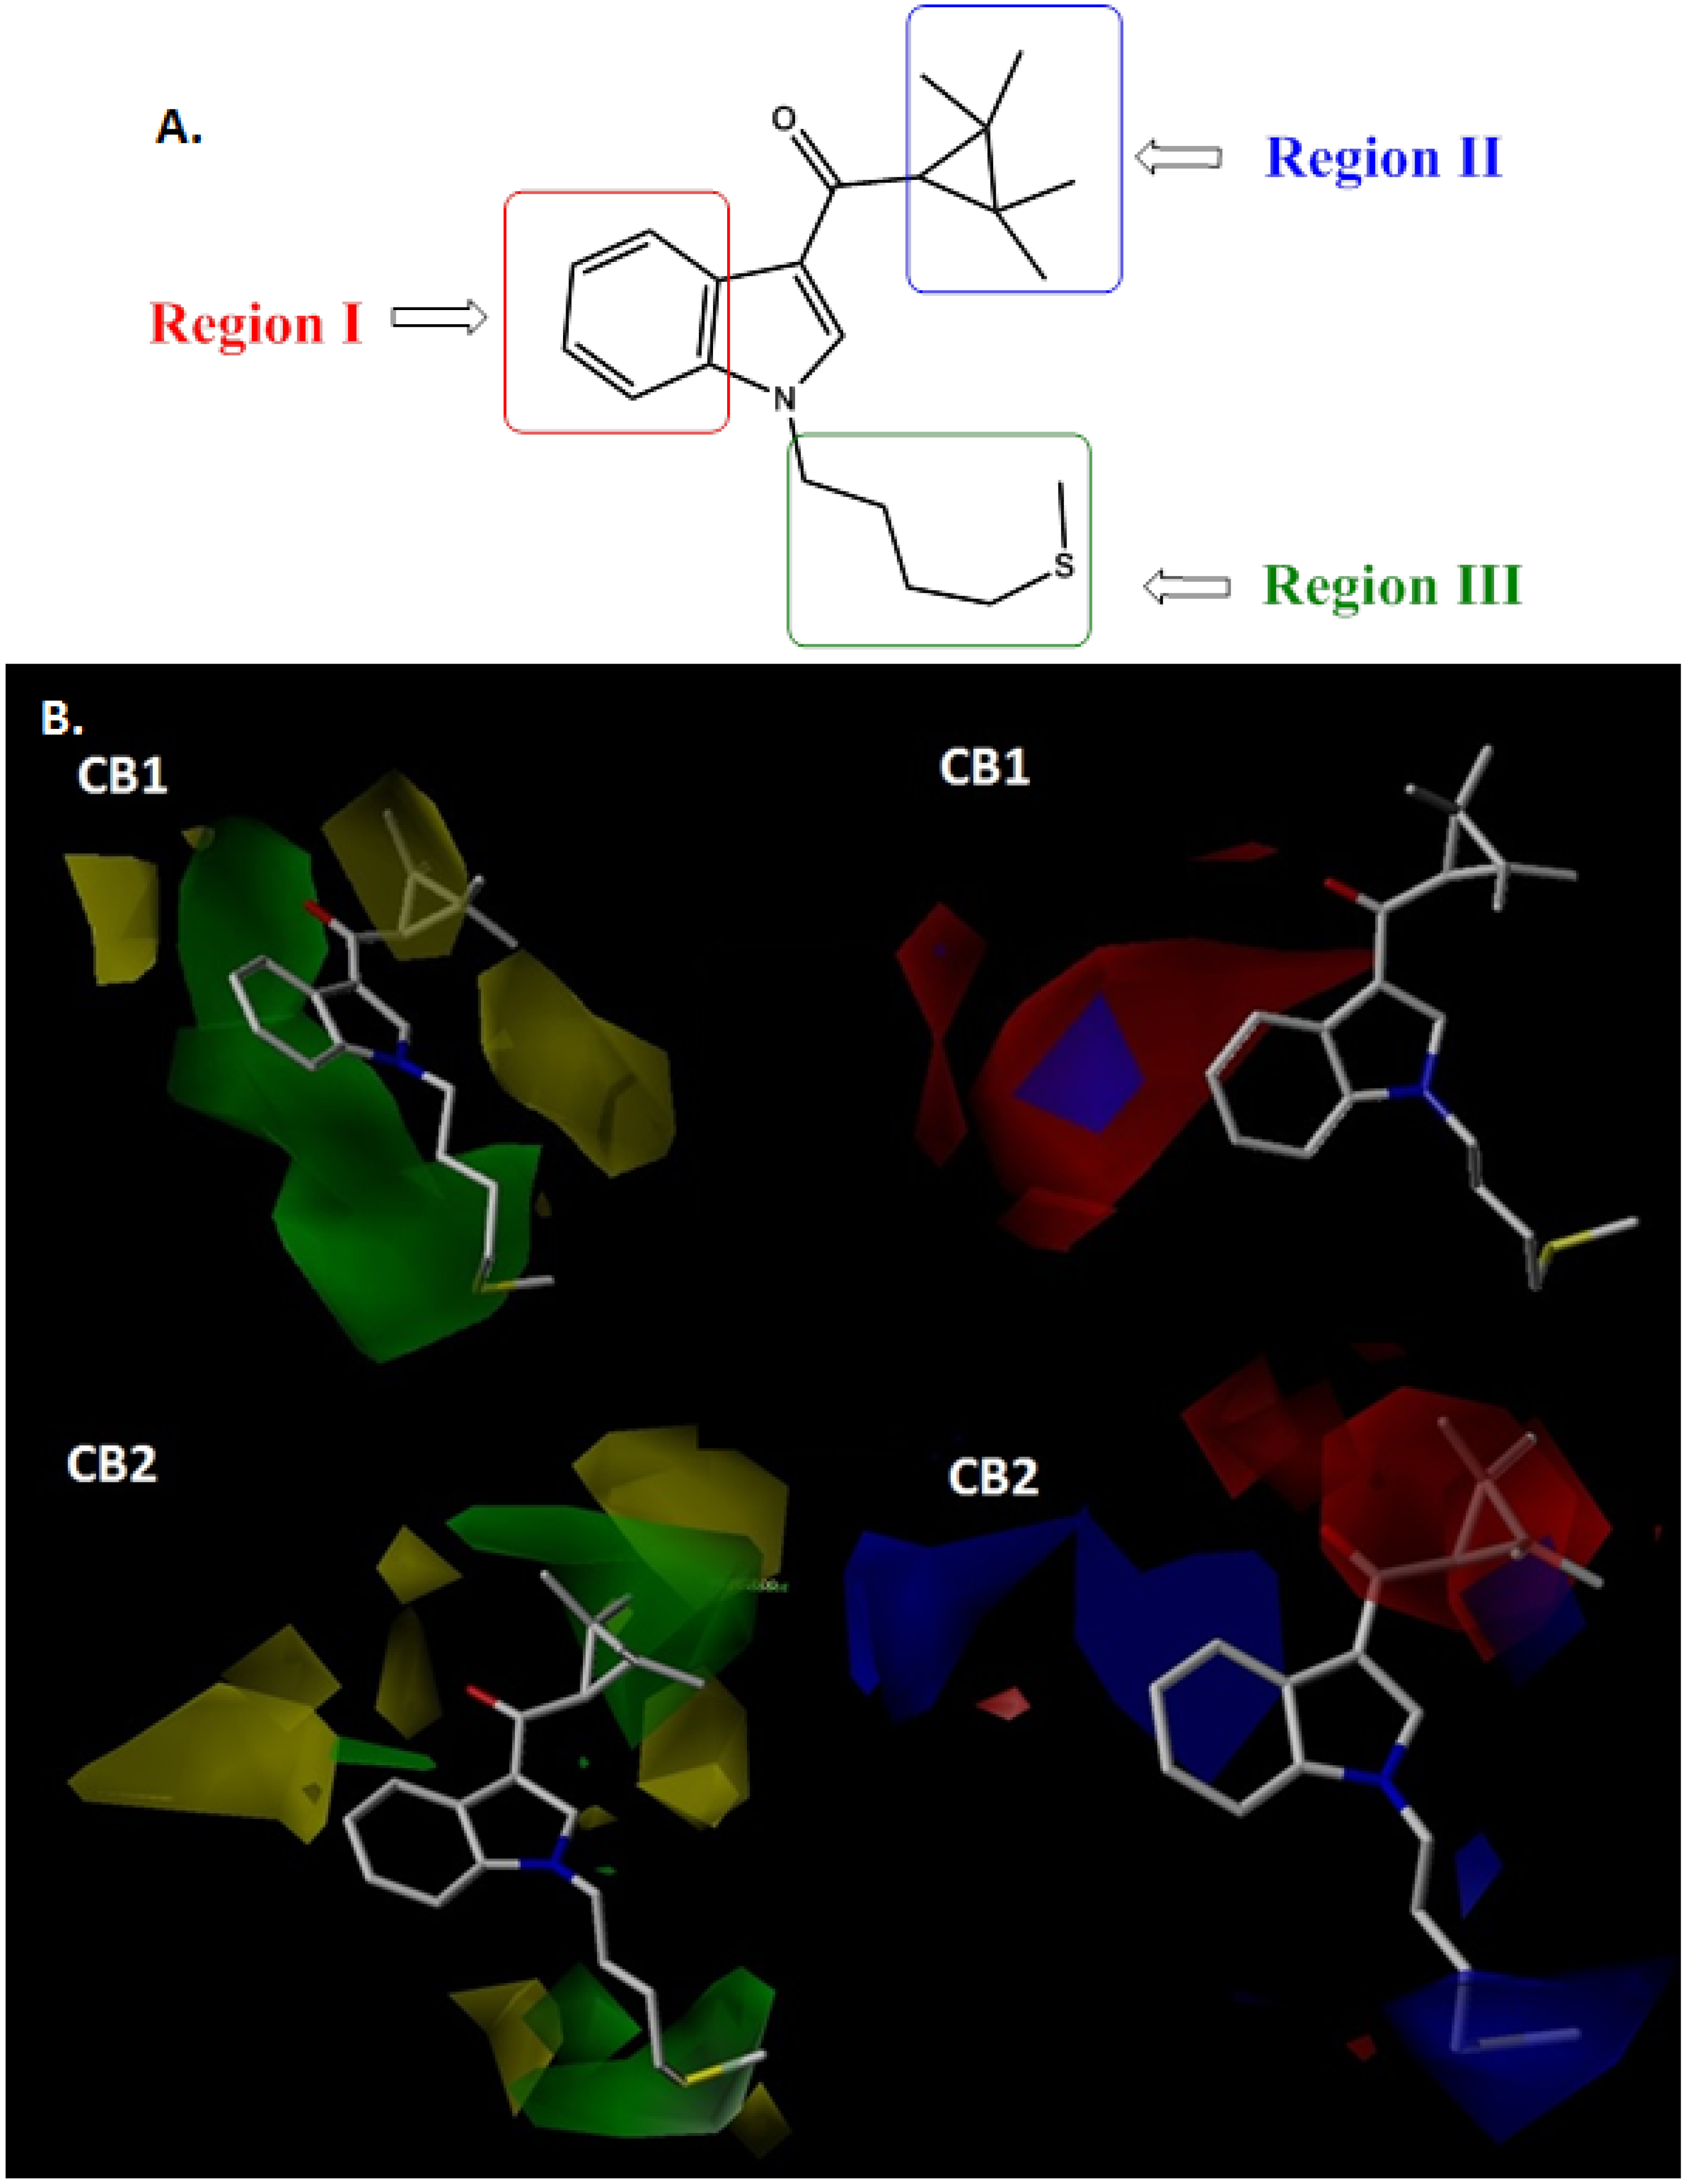
2.2. CoMFA Contour Maps Analysis

3. Experimental
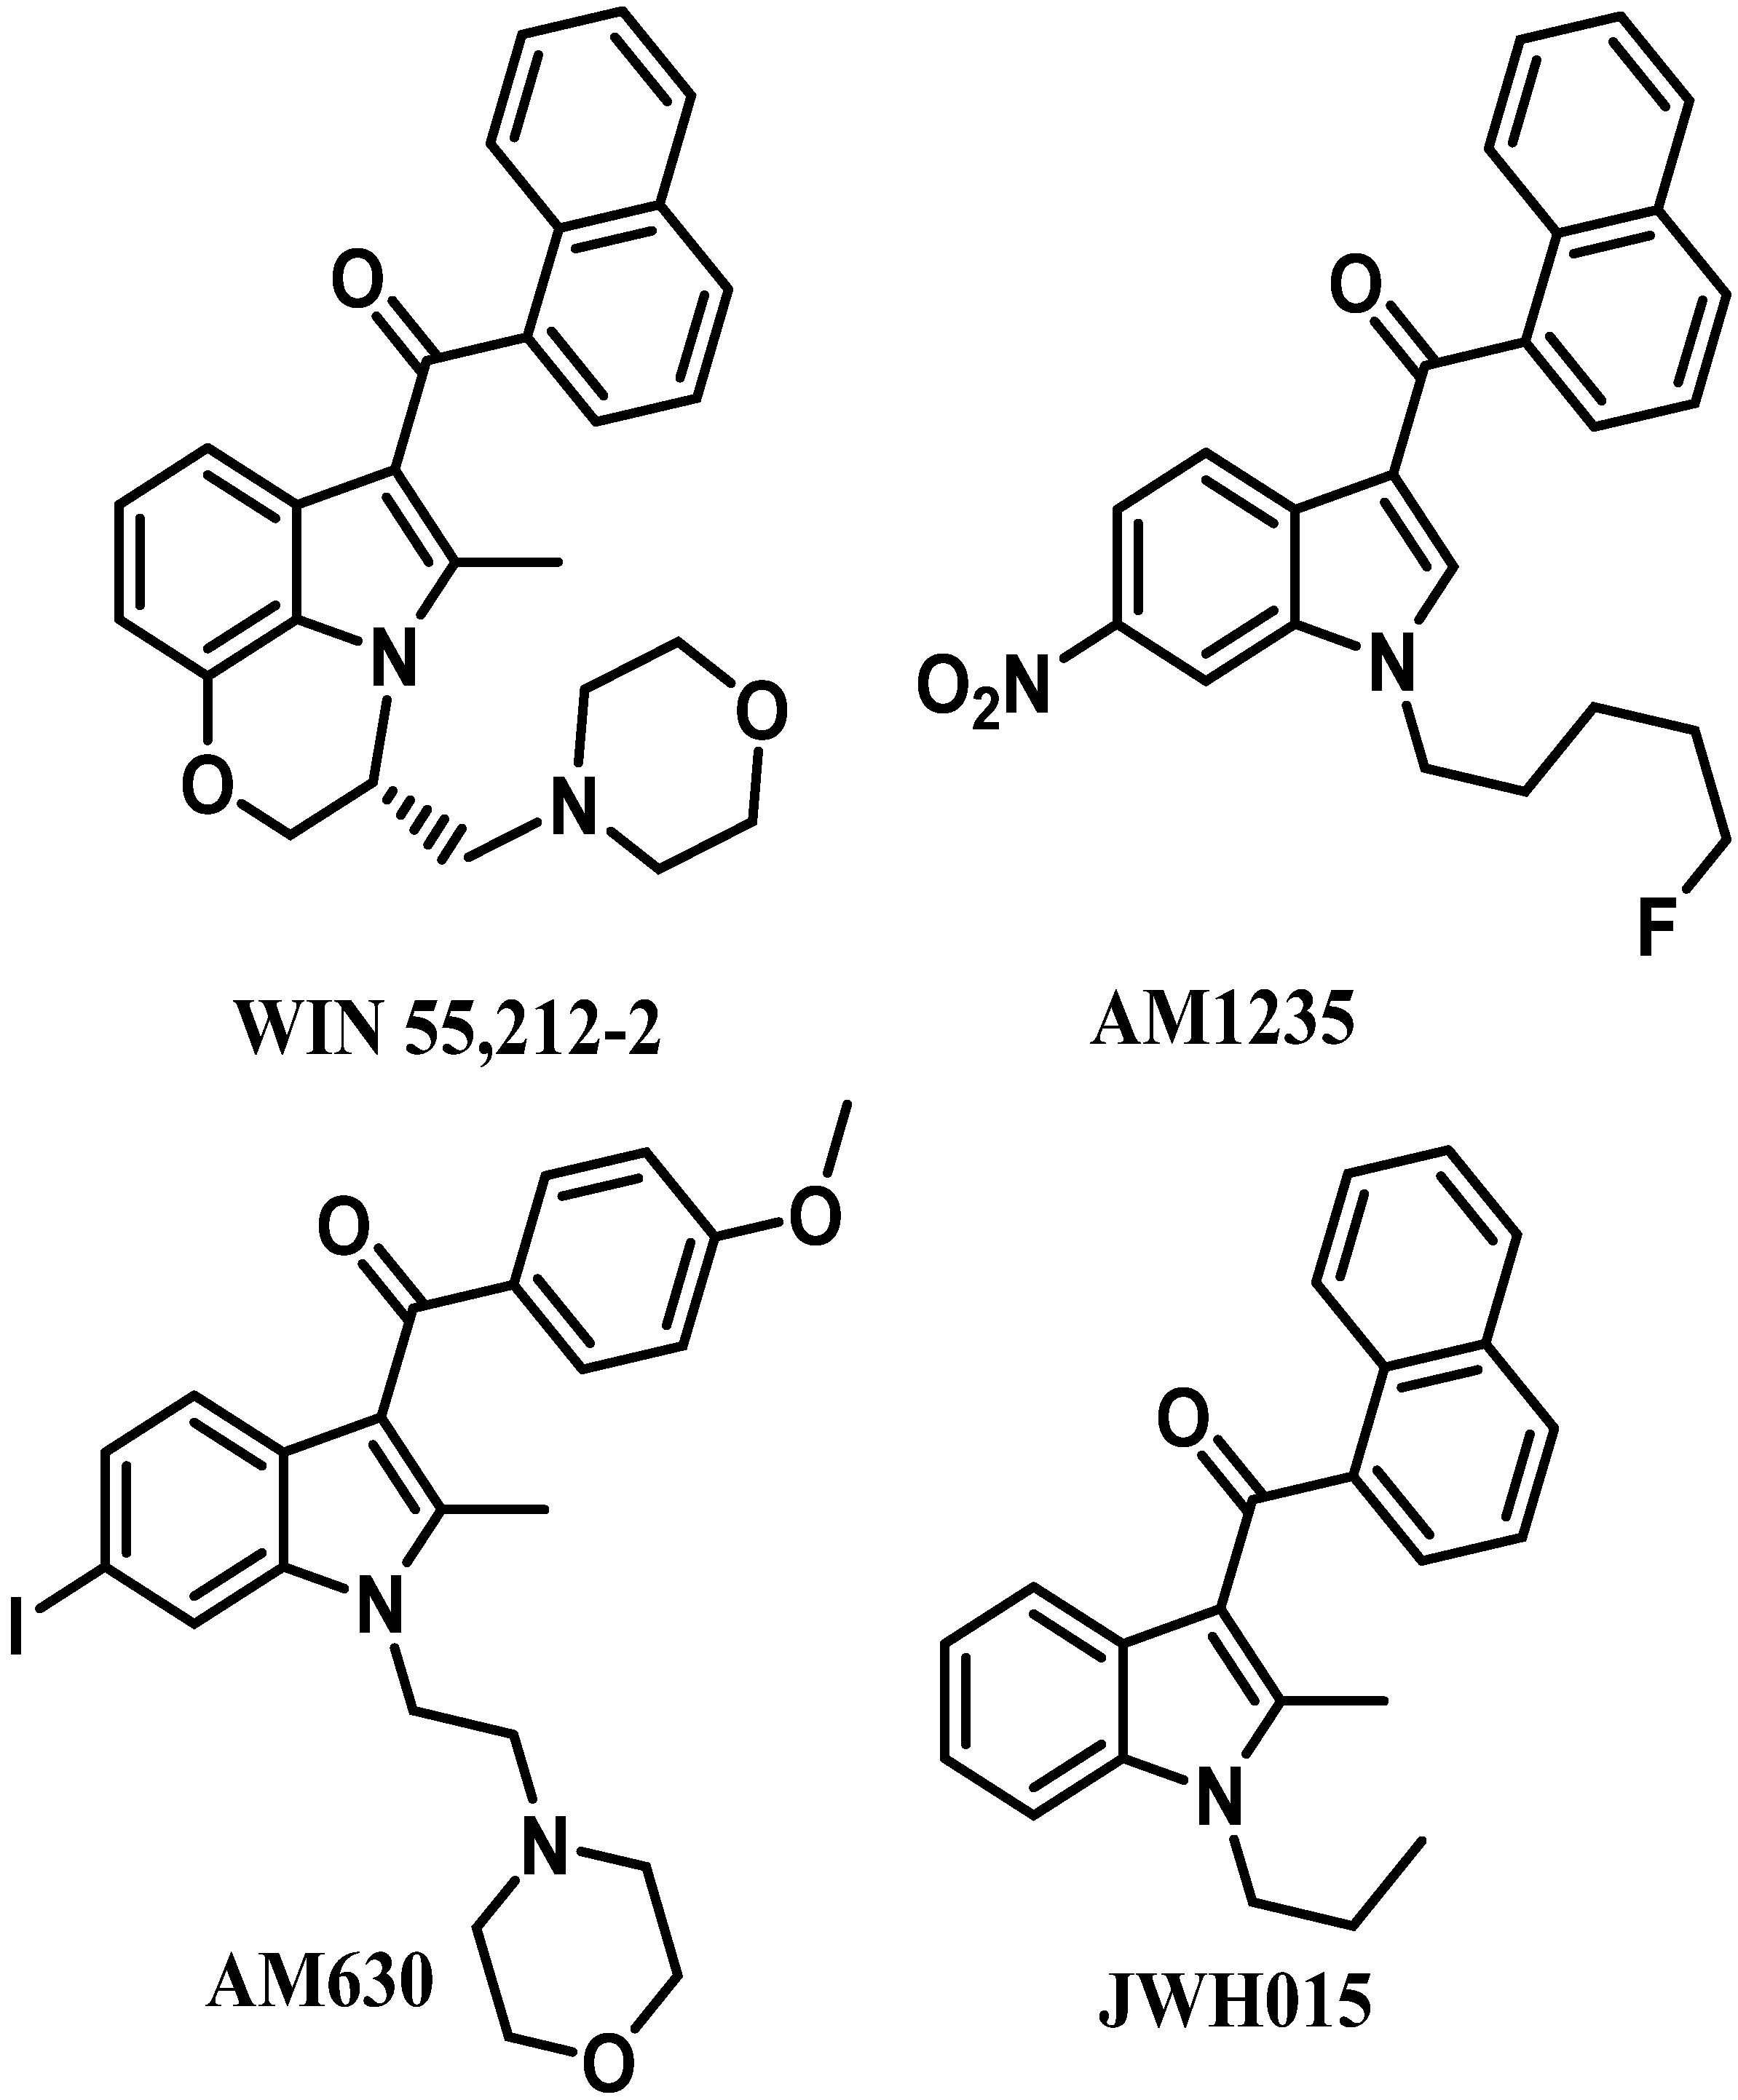
3.1. Data Set

| Comp. | R1 | R2 | R3 | R4 | R5 | R6 | R7 |
|---|---|---|---|---|---|---|---|
| 1 |  | H |  | H |  | H | H |
| 2 | CH3- | H |  | H |  | H | H |
| 3 | CH3CH2- | H | | H |  | H | H |
| 4 |  | H | | H | | H | H |
| 5 | | H |  | H | | H | H |
| 6 |  | H |  | H | | H | H |
| 7 |  | H | | H |  | H | H |
| 8 |  | H |  | H | H | CH3SO2- | H |
| 9 | | H | | OH- | H | H | H |
| 10 | | H | | H | H | H | OH- |
| 11 | | H | | CH3O- | H | H | H |
| 12 | | H | | H | CH3O- | H | H |
| 13 |  | H |  | H |  | CH3O- | H |
| 14 | | H | | H | OH- | CH3O- | H |
| 15 |  | H | | H | H | H | H |
| 16 | | H | | H | H | CH3O- | H |
| 17 |  | H | | H | CH3OCH2- | H | H |
| 18 | | H | | H |  | H | H |
| 19 | | H | | H | H | | H |
| 20 |  | H |  | H | H | H | H |
| 21 | | H |  | H | H | H | H |
| 22 |  | H |  | H | H | H | H |
| 23 | | H |  | H | H | H | H |
| 24 | | H |  | H | H | H | H |
| 25 | | H |  | H | H | H | H |
| 26 |  | H |  | H | H | H | H |
| 27 |  | H | | H | H | H | H |
| 28 |  | H | | H | H | H | H |
| 29 |  | H | | H | H | H | H |
| 30 |  | H | | H | H | H | H |
| 31 |  | H | | H | H | H | H |
| 32 |  | H |  | H | H | H | H |
| 33 |  | H | | H | H | H | H |
| 34 |  | H | | H | H | H | H |
| 35 |  | H | | H | H | H | H |
| 36 |  | H |  | H | H | H | H |
| 37 |  | H |  | H | H | H | H |
| 38 |  | H | | H | H | H | H |
| 39 | | H | | H | H | Br- | H |
| 40 | | H | | H | H | H | CH3O- |
| 41 | | H | | H | H |  | H |
| 42 | | H | | H |  | H | |
| 43 |  | H | | H | H |  | H |
| 44 | | H | | H | H | CN- | H |
| 45 | | H | | H | H | CH3OCO- | H |
| 46 |  | H |  | H | H | H | H |
| 47 |  | H | | H | H | H | H |
| 48 |  | H | | H | H | H | H |
| 49 |  | H | | H | H | H | H |
| 50 |  | H |  | H | | H | H |
| 51 |  | H | | H |  | H | H |
| 52 |  | H |  | H |  | H | H |
| 53 |  | H | | H | | H | H |
| 54 | | H |  | H | | H | H |
| 55 |  | H |  | H |  | H | H |
| 56 |  | H |  | H |  | ||
| 57 | | H |  | H | | H | H |
| 58 | | H |  | H | H |  | H |
| 59 | H | H |  | H | | H | H |
| 60 | | H | | F- | F- | F- | F- |
| 61 | | H | | H | F- | H | H |
| 62 | | H | | H | Cl- | H | H |
| 63 | | H | | H | H | Cl- | H |
| 64 | | H | | H | H | CF3- | H |
| 65 | | H | | H | H | OH- | H |
| 66 | | H | | H | H | CH3O- | H |
| 67 | | H | |  | H | H | H |
| 68 | | H | | H | H | H |  |
| 69 | | H | | H | NH2- | H | H |
| 70 |  | CH3- | | H | H | H | H |
| 71 | | H | | NH2- | H | H | H |
| 72 |  | H | | H | H | H | H |
| 73 |  | H | | H | H | H | H |
| 74 | CH3(CH2)2- | H | | H | H | H | H |
| 75 | CH3(CH2)3- | H | | H | H | H | H |
| 76 | OH(CH2)3- | H | | H | H | H | H |
| 77 | OH(CH2)4- | H | | H | H | H | H |
| 78 | CH3O(CH2)2- | H | | H | H | H | H |
| 79 |  | H | | H | H | H | H |
| 80 |  | H | | H | H | H | H |
| 81 |  | H | | H | H | H | H |
| 82 a |  | ||||||
| 83 b | CH3(CH2)2- | CH3- |  | H | H | H | H |
| 84 | CH3(CH2)2- | H | | H | | H | H |
| 85 | CH3(CH2)3- | H |  | H | | H | H |
| 86 | CH3(CH2)4- | H | | H | | H | H |
| 87 | | H | | H | Br- | H | H |
| 88 |  | H |  | H | H | H | H |
| 89 |  | H | | H | H | H | H |
| 90 |  | H | | H | H | H | H |
| 91 |  | H | | H | H | H | H |
| 92 |  | H | | H | H | H | H |
3.2. Generation of CoMFA and Partial Least Squares (PLS) Analysis

| CoMFA CB1 | |||||||||||||||
| SEP | 0.268 | 0.263 | 0.273 | 0.277 | 0.284 | 0.297 | 0.305 | 0.311 | 0.318 | 0.322 | 0.329 | 0.335 | 0.341 | 0.348 | 0.355 |
| q2 | 0.704 | 0.722 | 0.709 | 0.709 | 0.703 | 0.685 | 0.677 | 0.674 | 0.671 | 0.673 | 0.672 | 0.673 | 0.672 | 0.672 | 0.672 |
| N | 1 | 2 | 3 | 4 | 5 | 6 | 7 | 8 | 9 | 10 | 11 | 12 | 13 | 14 | 15 |
| CoMFA CB2 | |||||||||||||||
| SEP | 0.432 | 0.392 | 0.388 | 0.374 | 0.373 | 0.369 | 0.366 | 0.370 | 0.374 | 0.375 | 0.377 | 0.380 | 0.383 | 0.387 | 0.391 |
| q2 | 0.440 | 0.546 | 0.563 | 0.600 | 0.611 | 0.625 | 0.638 | 0.639 | 0.637 | 0.643 | 0.647 | 0.649 | 0.650 | 0.650 | 0.651 |
| N | 1 | 2 | 3 | 4 | 5 | 6 | 7 | 8 | 9 | 10 | 11 | 12 | 13 | 14 | 15 |

4. Conclusions

Acknowledgments
Author Contributions
Conflictts of Interest
References
- Howlett, A.C. The cannabinoid receptors. Prostag. Other Lipid Mediat. 2002, 68–69, 619–631. [Google Scholar] [CrossRef]
- Gaoni, Y.; Mechoulam, R. Isolation, structure and partial synthesis of an active constituent of hashish. J. Am. Chem. Soc. 1964, 86, 1646–1647. [Google Scholar] [CrossRef]
- Adams, I.B.; Martin, B.R. Cannabis: Pharmacology and toxicology in animals and humans. Addiction 1996, 91, 1585–1614. [Google Scholar] [CrossRef]
- Lambert, D.M. Medical use of cannabis through history. J. Pharm. Belg. 2001, 56, 111–118. [Google Scholar]
- Pacher, P.; Mechoulam, R. Is lipid signaling through cannabinoid 2 receptors part of a protective system? Prog. Lipid Res. 2011, 50, 193–211. [Google Scholar] [CrossRef]
- Sheng, W.S.; Hu, S.; Min, X.; Cabral, G.A.; Lokensgard, J.R.; Peterson, P.K. Synthetic cannabinoid win55,212-2 inhibits generation of inflammatory mediators by il-1beta-stimulated human astrocytes. Glia 2005, 49, 211–219. [Google Scholar] [CrossRef]
- Cinar, R.; Szucs, M. Cb1 receptor-independent actions of sr141716 on g-protein signaling: Coapplication with the mu-opioid agonist tyr-d-ala-gly-(nme)phe-gly-ol unmasks novel, pertussis toxin-insensitive opioid signaling in mu-opioid receptor-chinese hamster ovary cells. J. Pharmacol. Exp. Ther. 2009, 330, 567–574. [Google Scholar] [CrossRef]
- Di Marzo, V.; Matias, I. Endocannabinoid control of food intake and energy balance. Nat. Neurosci. 2005, 8, 585–589. [Google Scholar] [CrossRef]
- Herkenham, M.; Lynn, A.B.; de Costa, B.R.; Richfield, E.K. Neuronal localization of cannabinoid receptors in the basal ganglia of the rat. Brain Res. 1991, 547, 267–274. [Google Scholar] [CrossRef]
- Herkenham, M.; Lynn, A.B.; Johnson, M.R.; Melvin, L.S.; de Costa, B.R.; Rice, K.C. Characterization and localization of cannabinoid receptors in rat brain: A quantitative in vitro autoradiographic study. J. Neurosci. 1991, 11, 563–583. [Google Scholar]
- Herkenham, M.; Lynn, A.B.; Little, M.D.; Johnson, M.R.; Melvin, L.S.; de Costa, B.R.; Rice, K.C. Cannabinoid receptor localization in brain. Proc. Natl. Acad. Sci. USA 1990, 87, 1932–1936. [Google Scholar] [CrossRef]
- Mackie, K. Cannabinoid receptors: Where they are and what they do. J. Neuroendocrinol. 2008, 20 (Suppl. 1), 10–14. [Google Scholar] [CrossRef]
- Di Marzo, V. Cb(1) receptor antagonism: Biological basis for metabolic effects. Drug Discov. Today 2008, 13, 1026–1041. [Google Scholar] [CrossRef]
- Bouaboula, M.; Rinaldi, M.; Carayon, P.; Carillon, C.; Delpech, B.; Shire, D.; le Fur, G.; Casellas, P. Cannabinoid-receptor expression in human leukocytes. Eur. J. Biochem. 1993, 214, 173–180. [Google Scholar] [CrossRef]
- Galiegue, S.; Mary, S.; Marchand, J.; Dussossoy, D.; Carriere, D.; Carayon, P.; Bouaboula, M.; Shire, D.; le Fur, G.; Casellas, P. Expression of central and peripheral cannabinoid receptors in human immune tissues and leukocyte subpopulations. Eur. J. Biochem. 1995, 232, 54–61. [Google Scholar] [CrossRef]
- Carrier, E.J.; Kearn, C.S.; Barkmeier, A.J.; Breese, N.M.; Yang, W.; Nithipatikom, K.; Pfister, S.L.; Campbell, W.B.; Hillard, C.J. Cultured rat microglial cells synthesize the endocannabinoid 2-arachidonylglycerol, which increases proliferation via a cb2 receptor-dependent mechanism. Mol. Pharmacol. 2004, 65, 999–1007. [Google Scholar] [CrossRef]
- Di Marzo, V.; Bifulco, M.; de Petrocellis, L. The endocannabinoid system and its therapeutic exploitation. Nat. Rev. Drug Discov. 2004, 3, 771–784. [Google Scholar] [CrossRef]
- Nunez, E.; Benito, C.; Pazos, M.R.; Barbachano, A.; Fajardo, O.; Gonzalez, S.; Tolon, R.M.; Romero, J. Cannabinoid cb2 receptors are expressed by perivascular microglial cells in the human brain: An immunohistochemical study. Synapse 2004, 53, 208–213. [Google Scholar] [CrossRef]
- Walter, L.; Franklin, A.; Witting, A.; Wade, C.; Xie, Y.; Kunos, G.; Mackie, K.; Stella, N. Nonpsychotropic cannabinoid receptors regulate microglial cell migration. J. Neurosci. 2003, 23, 1398–1405. [Google Scholar]
- Berdyshev, E.V. Cannabinoid receptors and the regulation of immune response. Chem. Phys. Lipids 2000, 108, 169–190. [Google Scholar] [CrossRef]
- Molina-Holgado, E.; Guaza, C.; Borrell, J.; Molina-Holgado, F. Effects of cannabinoids on the immune system and central nervous system: Therapeutic implications. BioDrugs 1999, 12, 317–326. [Google Scholar] [CrossRef]
- Mackie, K. Cannabinoid receptors as therapeutic targets. Annu. Rev. Pharmacol. Toxicol. 2006, 46, 101–122. [Google Scholar] [CrossRef]
- Frost, J.M.; Dart, M.J.; Tietje, K.R.; Garrison, T.R.; Grayson, G.K.; Daza, A.V.; El-Kouhen, O.F.; Miller, L.N.; Li, L.; Yao, B.B.; et al. Indol-3-yl-tetramethylcyclopropyl ketones: Effects of indole ring substitution on cb2 cannabinoid receptor activity. J. Med. Chem. 2008, 51, 1904–1912. [Google Scholar] [CrossRef]
- Frost, J.M.; Dart, M.J.; Tietje, K.R.; Garrison, T.R.; Grayson, G.K.; Daza, A.V.; El-Kouhen, O.F.; Yao, B.B.; Hsieh, G.C.; Pai, M.; et al. Indol-3-ylcycloalkyl ketones: Effects of n1 substituted indole side chain variations on cb(2) cannabinoid receptor activity. J. Med. Chem. 2010, 53, 295–315. [Google Scholar] [CrossRef]
- Pasquini, S.; Mugnaini, C.; Ligresti, A.; Tafi, A.; Brogi, S.; Falciani, C.; Pedani, V.; Pesco, N.; Guida, F.; Luongo, L.; et al. Design, synthesis, and pharmacological characterization of indol-3-ylacetamides, indol-3-yloxoacetamides, and indol-3-ylcarboxamides: Potent and selective cb2 cannabinoid receptor inverse agonists. J. Med. Chem. 2012, 55, 5391–5402. [Google Scholar] [CrossRef]
- Cramer, R.D.; Patterson, D.E.; Bunce, J.D. Comparative molecular field analysis (comfa). 1. Effect of shape on binding of steroids to carrier proteins. J. Am. Chem. Soc. 1988, 110, 5959–5967. [Google Scholar] [CrossRef]
- Chen, J.Z.; Han, X.W.; Liu, Q.; Makriyannis, A.; Wang, J.; Xie, X.Q. 3D-QSAR studies of arylpyrazole antagonists of cannabinoid receptor subtypes CB1 and CB2. A combined NMR and CoMFA approach. J. Med. Chem. 2006, 49, 625–636. [Google Scholar] [CrossRef]
- Cichero, E.; Cesarini, S.; Mosti, L.; Fossa, P. CoMFA and CoMSIA analyses on 1,2,3,4-tetrahydropyrrolo[3,4-b]indole and benzimidazole derivatives as selective CB2 receptor agonists. J. Mol. Model. 2010, 16, 1481–1498. [Google Scholar] [CrossRef]
- Durdagi, S.; Kapou, A.; Kourouli, T.; Andreou, T.; Nikas, S.P.; Nahmias, V.R.; Papahatjis, D.P.; Papadopoulos, M.G.; Mavromoustakos, T. The application of 3D-QSAR studies for novel cannabinoid ligands substituted at the C1' position of the alkyl side chain on the structural requirements for binding to cannabinoid receptors CB1 and CB2. J. Med. Chem. 2007, 50, 2875–2885. [Google Scholar] [CrossRef]
- Durdagi, S.; Papadopoulos, M.G.; Mavromoustakos, T. An effort to discover the preferred conformation of the potent amg3 cannabinoid analog when reaching the active sites of the cannabinoid receptors. Eur. J. Med. Chem. 2012, 47, 44–51. [Google Scholar] [CrossRef]
- Durdagi, S.; Papadopoulos, M.G.; Zoumpoulakis, P.G.; Koukoulitsa, C.; Mavromoustakos, T. A computational study on cannabinoid receptors and potent bioactive cannabinoid ligands: Homology modeling, docking, de novo drug design and molecular dynamics analysis. Mol. Diver. 2010, 14, 257–276. [Google Scholar] [CrossRef]
- Alvarez-Figueroa, M.J.; Pessoa-Mahana, C.D.; Palavecino-Gonzalez, M.E.; Mella-Raipan, J.; Espinosa-Bustos, C.; Lagos-Munoz, M.E. Evaluation of the membrane permeability (pampa and skin) of benzimidazoles with potential cannabinoid activity and their relation with the biopharmaceutics classification system (bcs). AAPS PharmSciTech 2011, 12, 573–578. [Google Scholar] [CrossRef]
- Araya, K.A.; David Pessoa Mahana, C.; Gonzalez, L.G. Role of cannabinoid CB1 receptors and Gi/o protein activation in the modulation of synaptosomal Na+,K+-ATPase activity by WIN55,212-2 and delta(9)-THC. Eur. J. Pharm. 2007, 572, 32–39. [Google Scholar] [CrossRef]
- Mella-Raipan, J.A.; Lagos, C.F.; Recabarren-Gajardo, G.; Espinosa-Bustos, C.; Romero-Parra, J.; Pessoa-Mahana, H.; Iturriaga-Vasquez, P.; Pessoa-Mahana, C.D. Design, synthesis, binding and docking-based 3d-qsar studies of 2-pyridylbenzimidazoles—a new family of high affinity cb1 cannabinoid ligands. Molecules 2013, 18, 3972–4001. [Google Scholar] [CrossRef]
- Golbraikh, A.; Tropsha, A. Beware of q2! J. Mol. Graph. Model. 2002, 20, 269–276. [Google Scholar] [CrossRef]
- Vinter, J.G.; Davis, A.; Saunders, M.R. Strategic approaches to drug design. I. An integrated software framework for molecular modelling. J. Comput.-Aided Mol. Des. 1987, 1, 31–51. [Google Scholar] [CrossRef]
- Gasteiger, J.; Marsilili, M. Iterative partial equalization of orbital electronegativity—a rapid access to atomic charges. Tetrahedron 1980, 36, 3219–3228. [Google Scholar] [CrossRef]
- Clark, M.; Cramer, R.; Opdenbosch, N. Validation of the general purpose tripos 5.2 force field. J. Comp. Chem. 1989, 10, 982–1012. [Google Scholar] [CrossRef]
- Oprea, T.I.; Waller, C.L.; Marshall, G.R. Three-dimensional quantitative structure-activity relationship of human immunodeficiency virus (i) protease inhibitors. 2. Predictive power using limited exploration of alternate binding modes. J. Med. Chem. 1994, 37, 2206–2215. [Google Scholar] [CrossRef]
- Waller, C.L.; Oprea, T.I.; Giolitti, A.; Marshall, G.R. Three-dimensional qsar of human immunodeficiency virus (i) protease inhibitors. 1. A comfa study employing experimentally-determined alignment rules. J. Med. Chem. 993, 36, 4152–4160. [Google Scholar]
- Sample Availability: Not Available.
© 2014 by the authors. Licensee MDPI, Basel, Switzerland. This article is an open access article distributed under the terms and conditions of the Creative Commons Attribution license ( http://creativecommons.org/licenses/by/3.0/).
Share and Cite
Mella-Raipán, J.; Hernández-Pino, S.; Morales-Verdejo, C.; Pessoa-Mahana, D. 3D-QSAR/CoMFA-Based Structure-Affinity/Selectivity Relationships of Aminoalkylindoles in the Cannabinoid CB1 and CB2 Receptors. Molecules 2014, 19, 2842-2861. https://doi.org/10.3390/molecules19032842
Mella-Raipán J, Hernández-Pino S, Morales-Verdejo C, Pessoa-Mahana D. 3D-QSAR/CoMFA-Based Structure-Affinity/Selectivity Relationships of Aminoalkylindoles in the Cannabinoid CB1 and CB2 Receptors. Molecules. 2014; 19(3):2842-2861. https://doi.org/10.3390/molecules19032842
Chicago/Turabian StyleMella-Raipán, Jaime, Santiago Hernández-Pino, César Morales-Verdejo, and David Pessoa-Mahana. 2014. "3D-QSAR/CoMFA-Based Structure-Affinity/Selectivity Relationships of Aminoalkylindoles in the Cannabinoid CB1 and CB2 Receptors" Molecules 19, no. 3: 2842-2861. https://doi.org/10.3390/molecules19032842