Assessment of Circulating microRNAs in Plasma of Lung Cancer Patients

 ,
,
Abstract
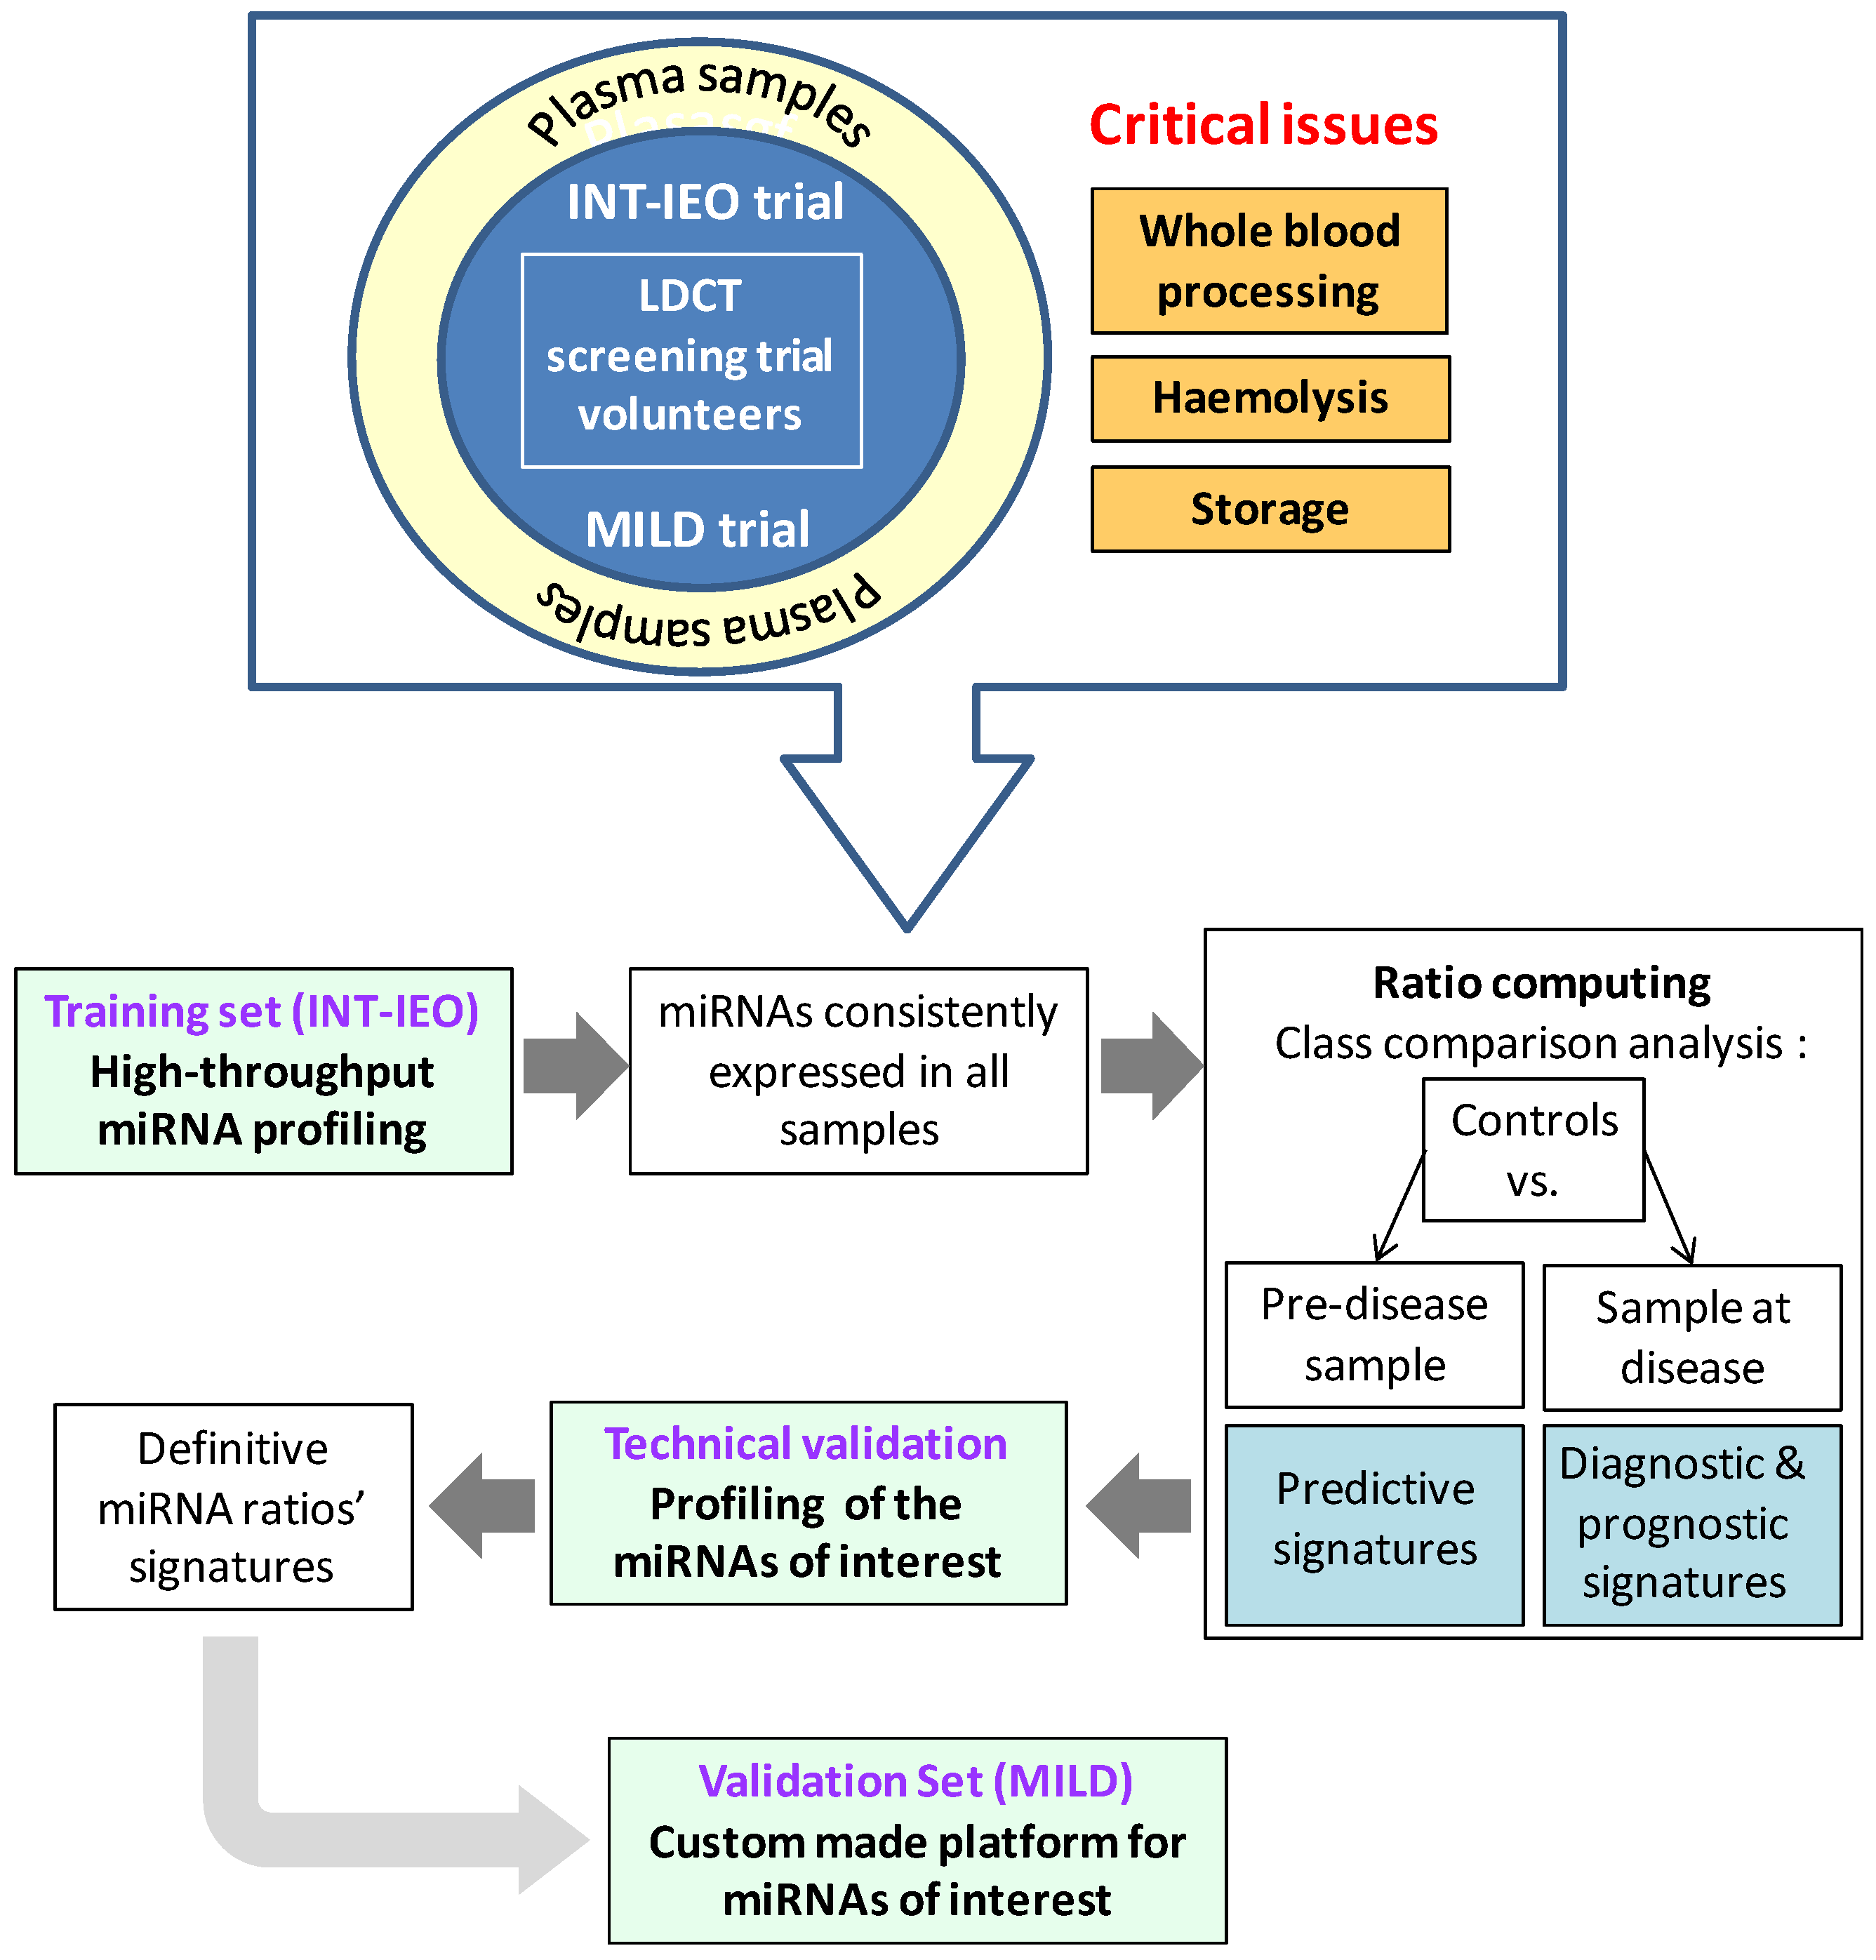
:1. Introduction

2. Results and Discussion
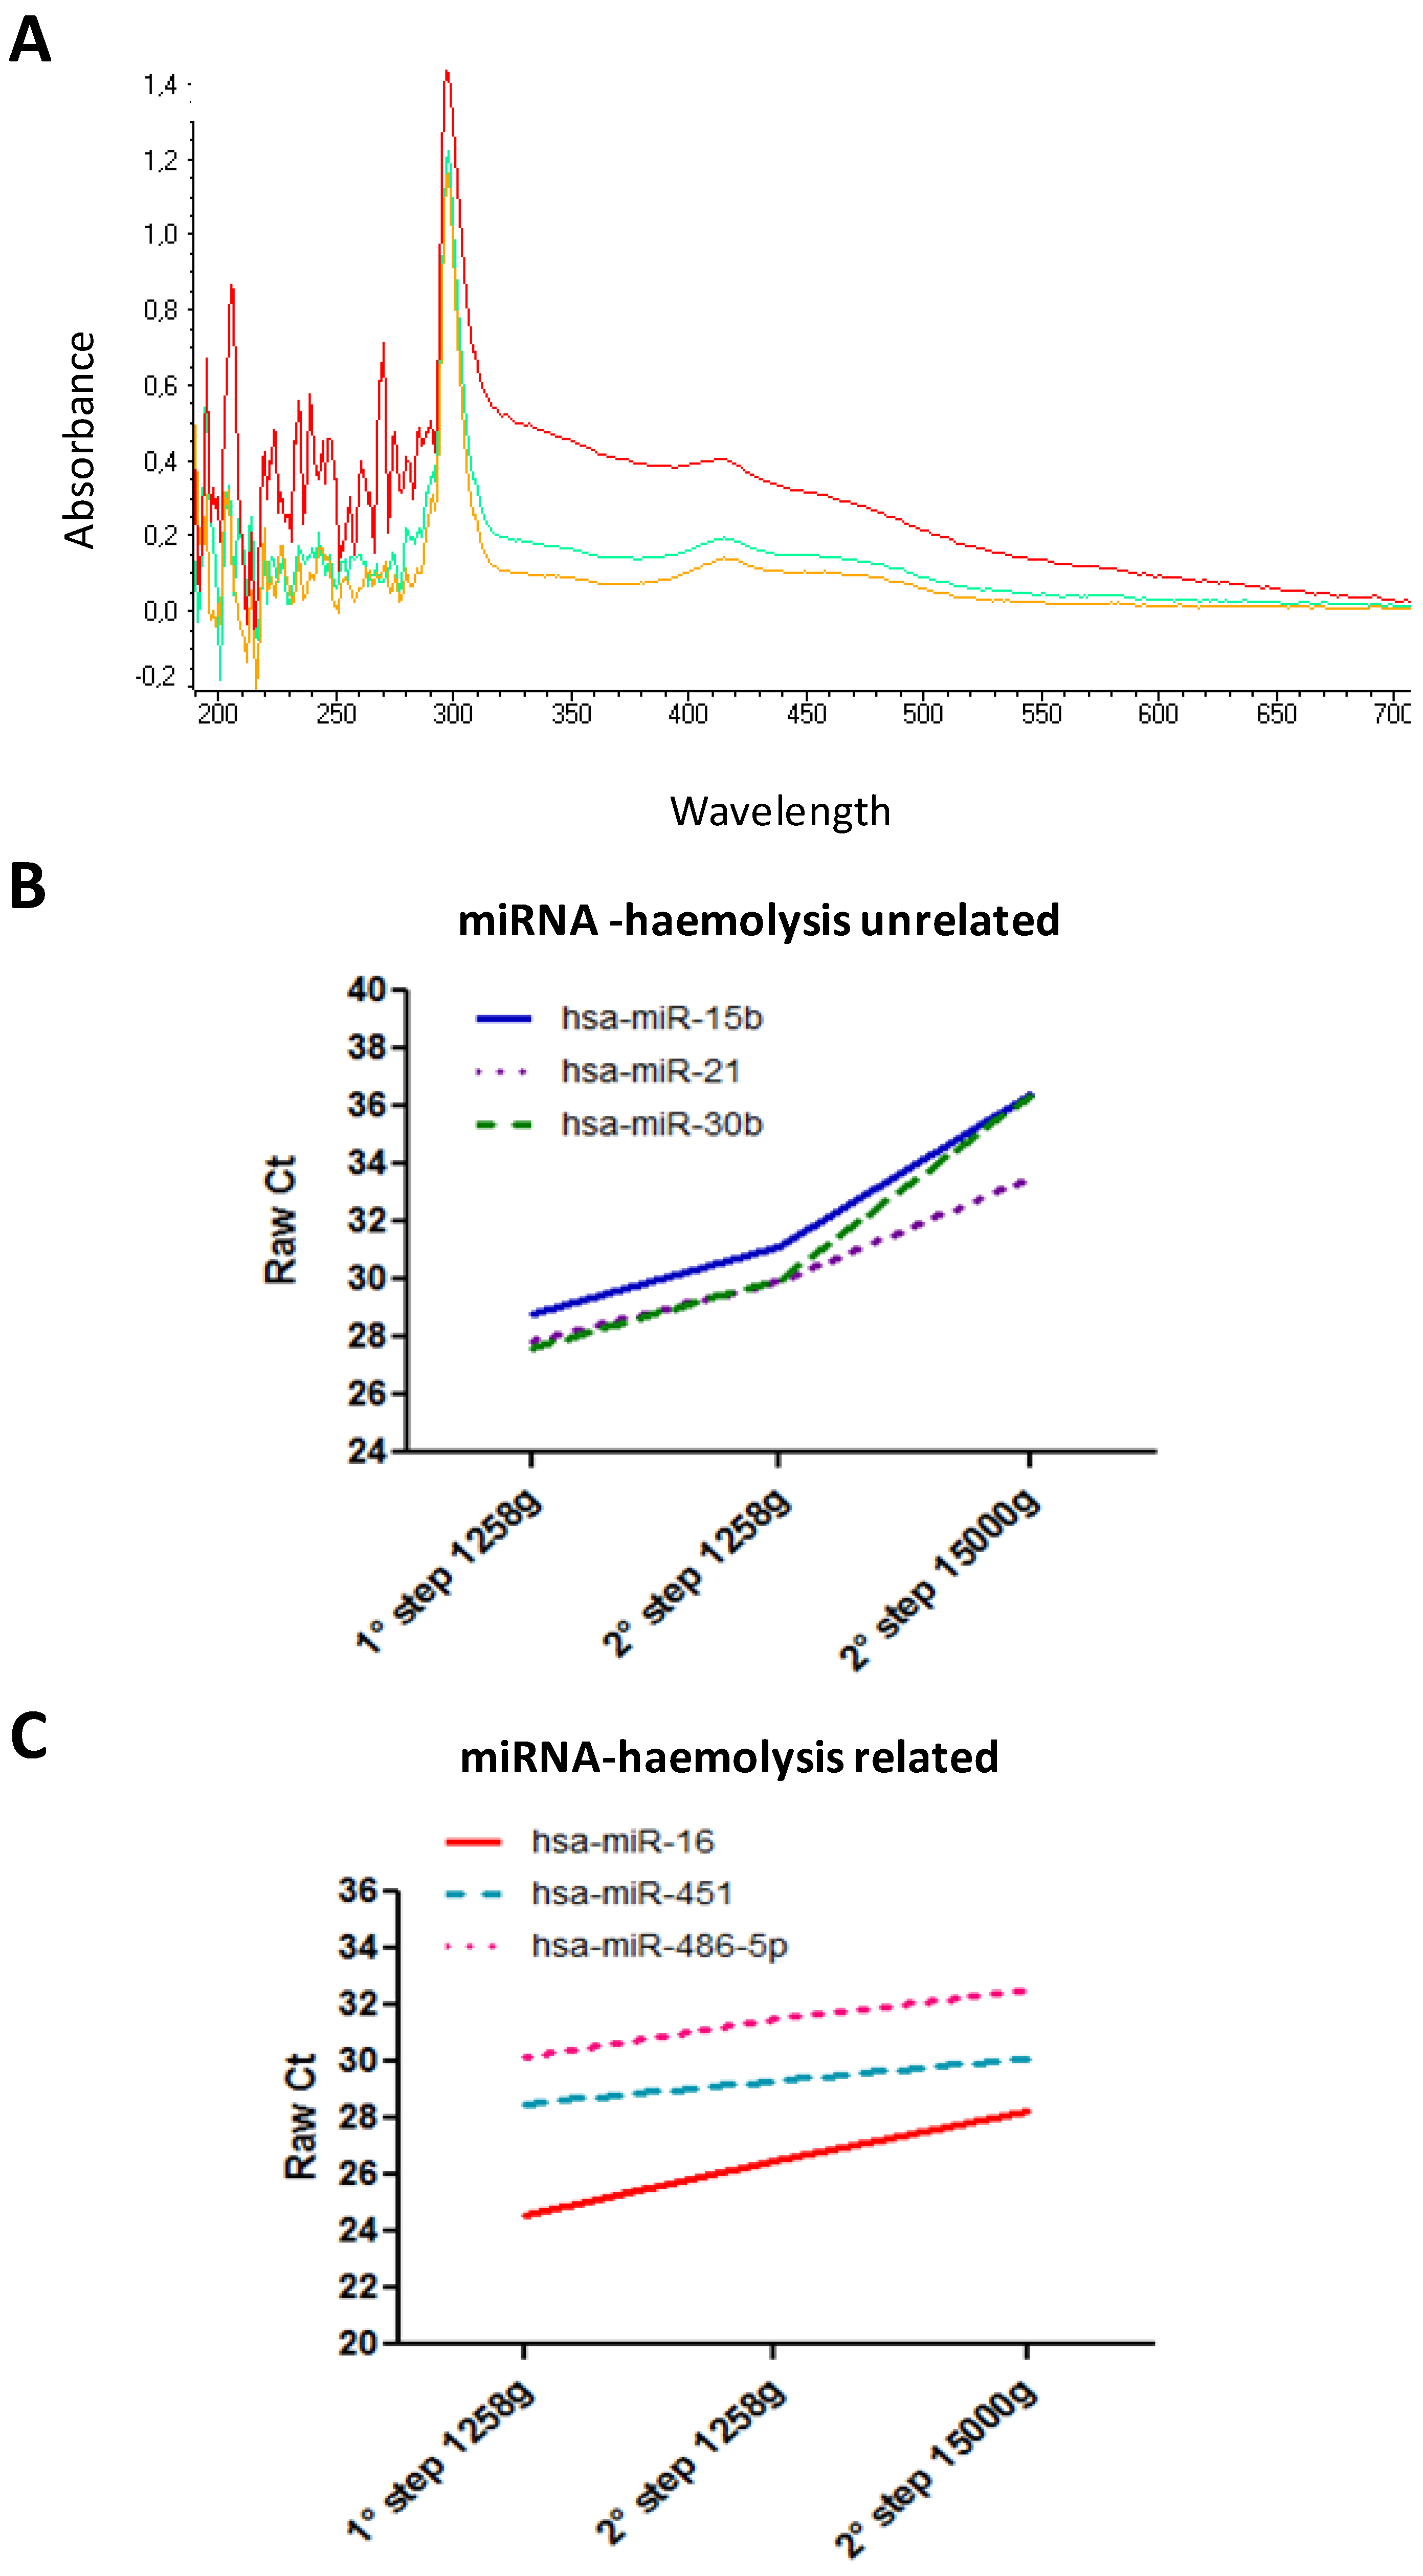
2.1. Whole Blood Sample Processing
2.2. MiRNAs Profiling

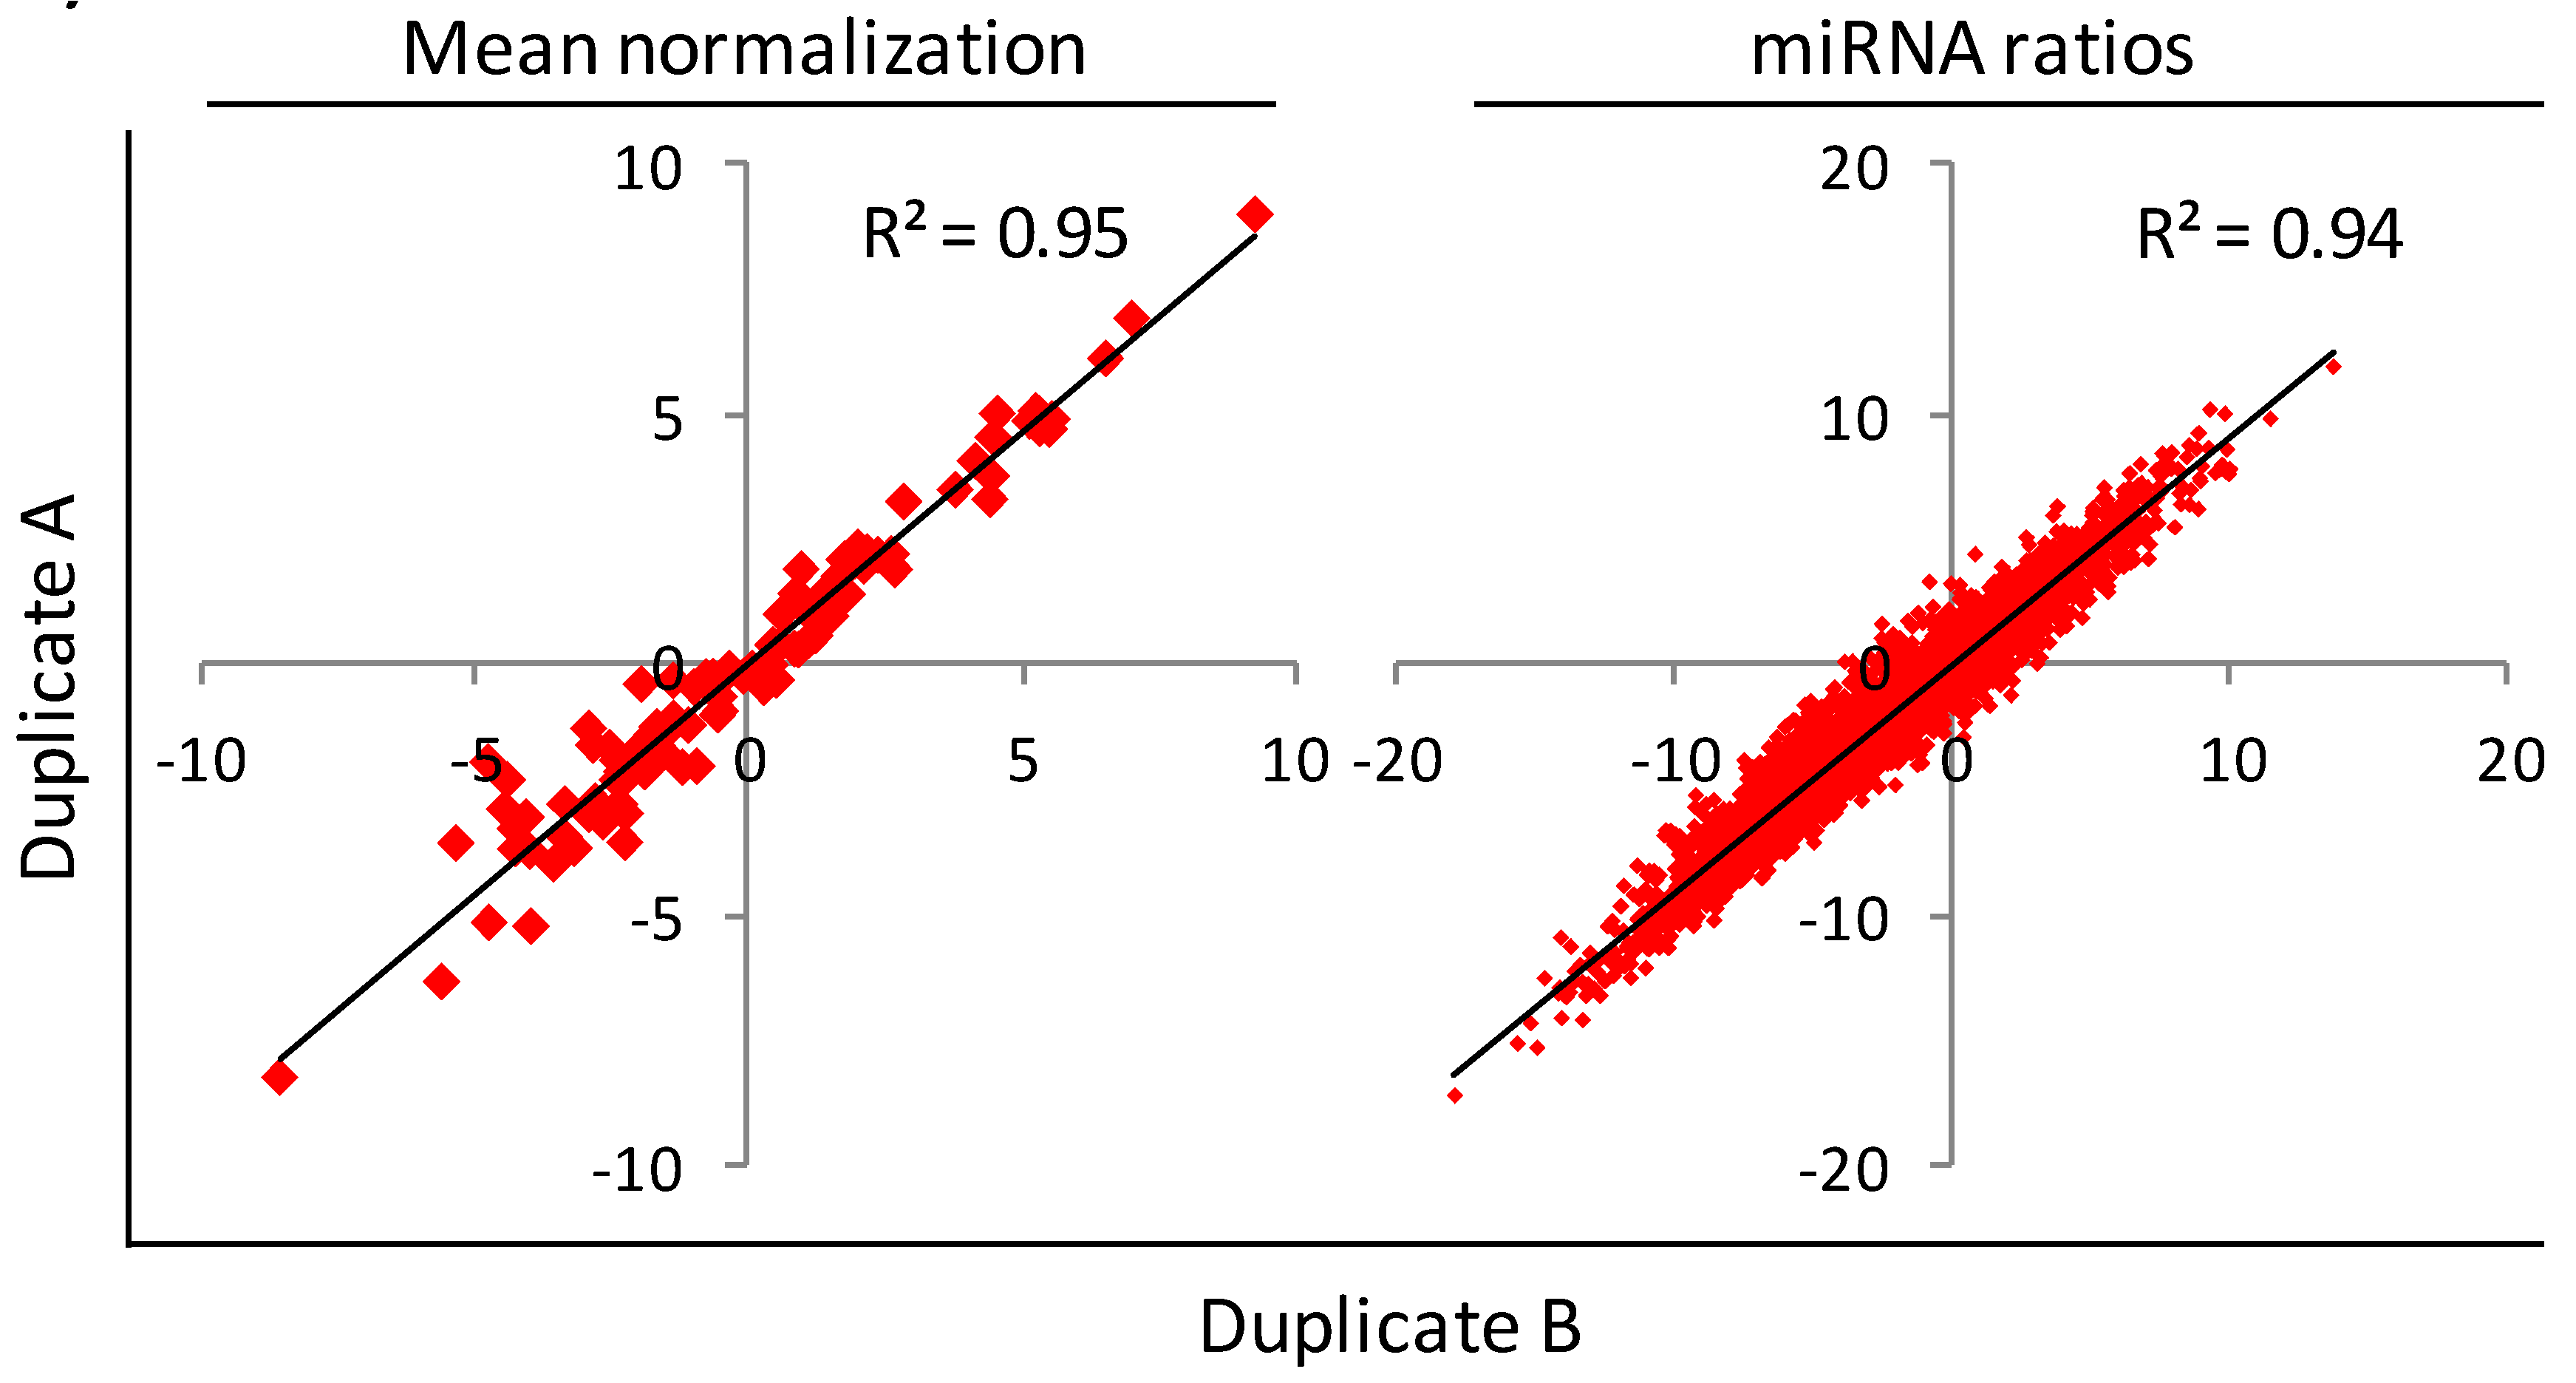
2.3. MiRNAs Ratios Computing


| Mean Normalization | miRNA Ratios Tool | |||
|---|---|---|---|---|
| miRNA | p-value * | Mean patients/mean controls (log2) | No. ratios with p-value < 0.01 † | Direction in patients vs. controls |
| mir-660 | 3.5E-05 | −1.8 | 56 † | All down |
| mir-142-3p | 3.0E-04 | −0.9 | 34 | All down |
| mir-197 | 4.9E-03 | 0.9 | 35 | All up |
| mir-24 | 0.4 | 0.16 | 13 | 4 Up & 9 Down |
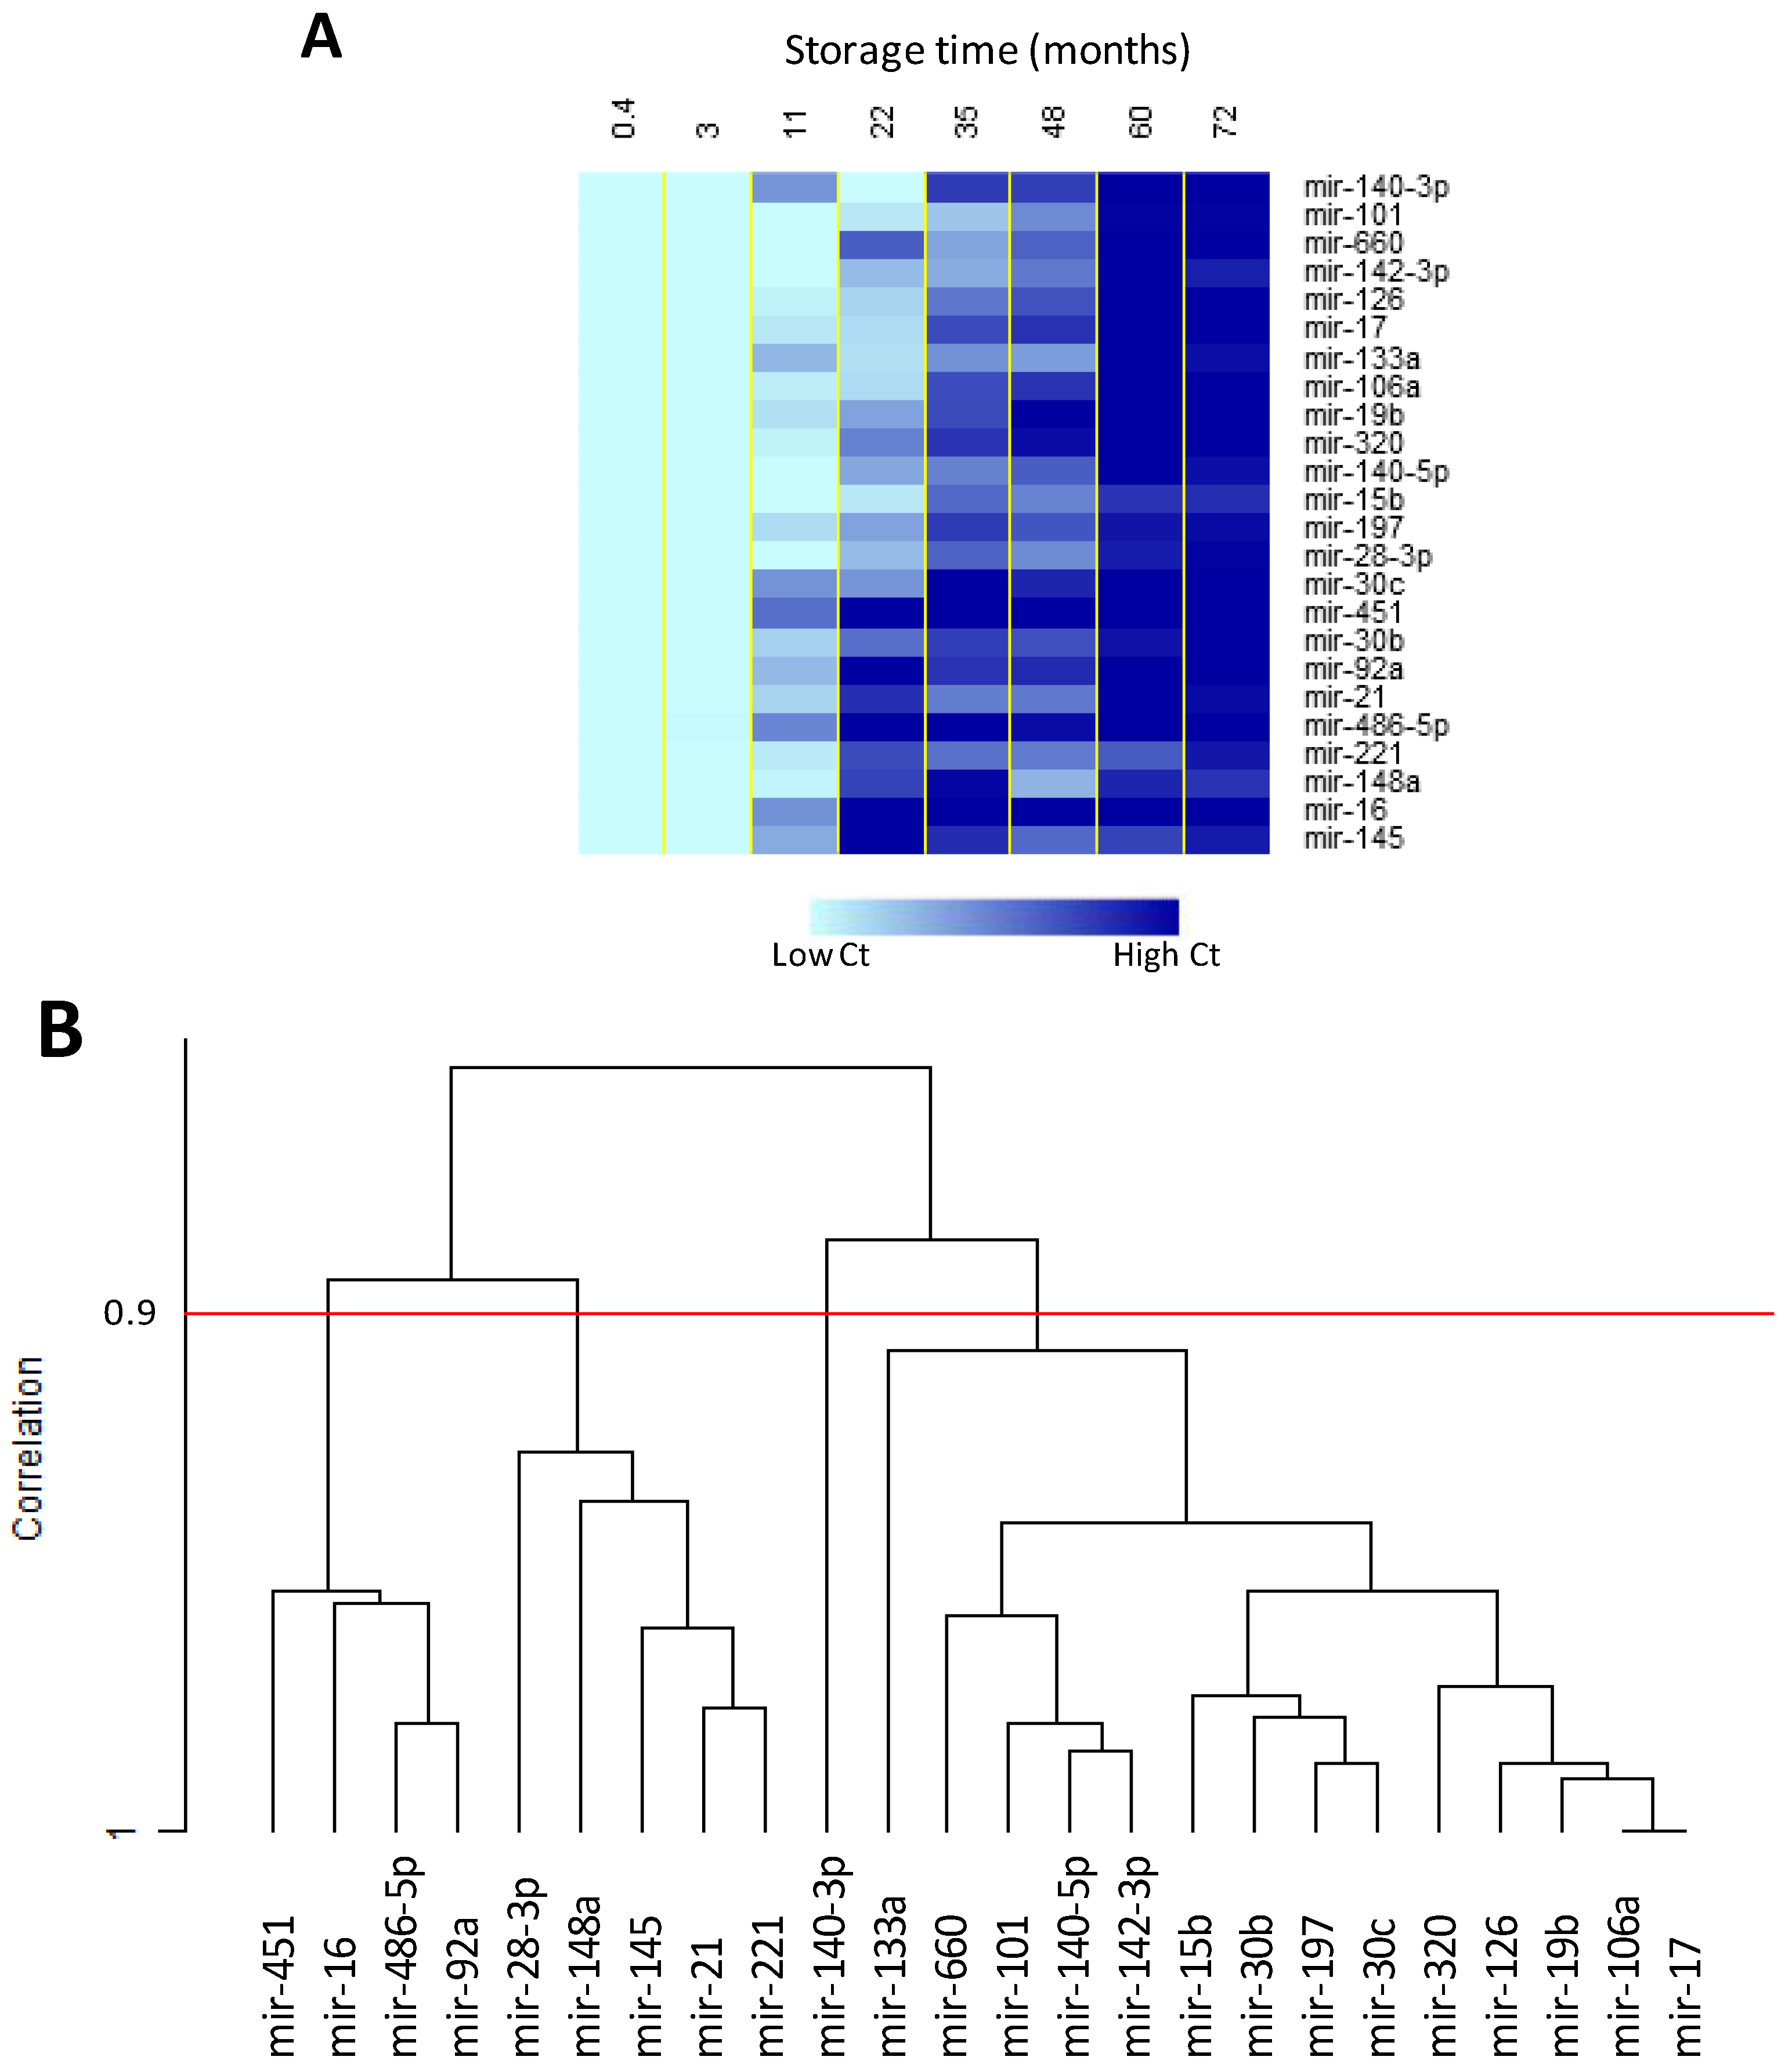
2.4. Effect of Storage Time on Plasma miRNAs

2.5. Evaluation of Haemolysis in Plasma Samples
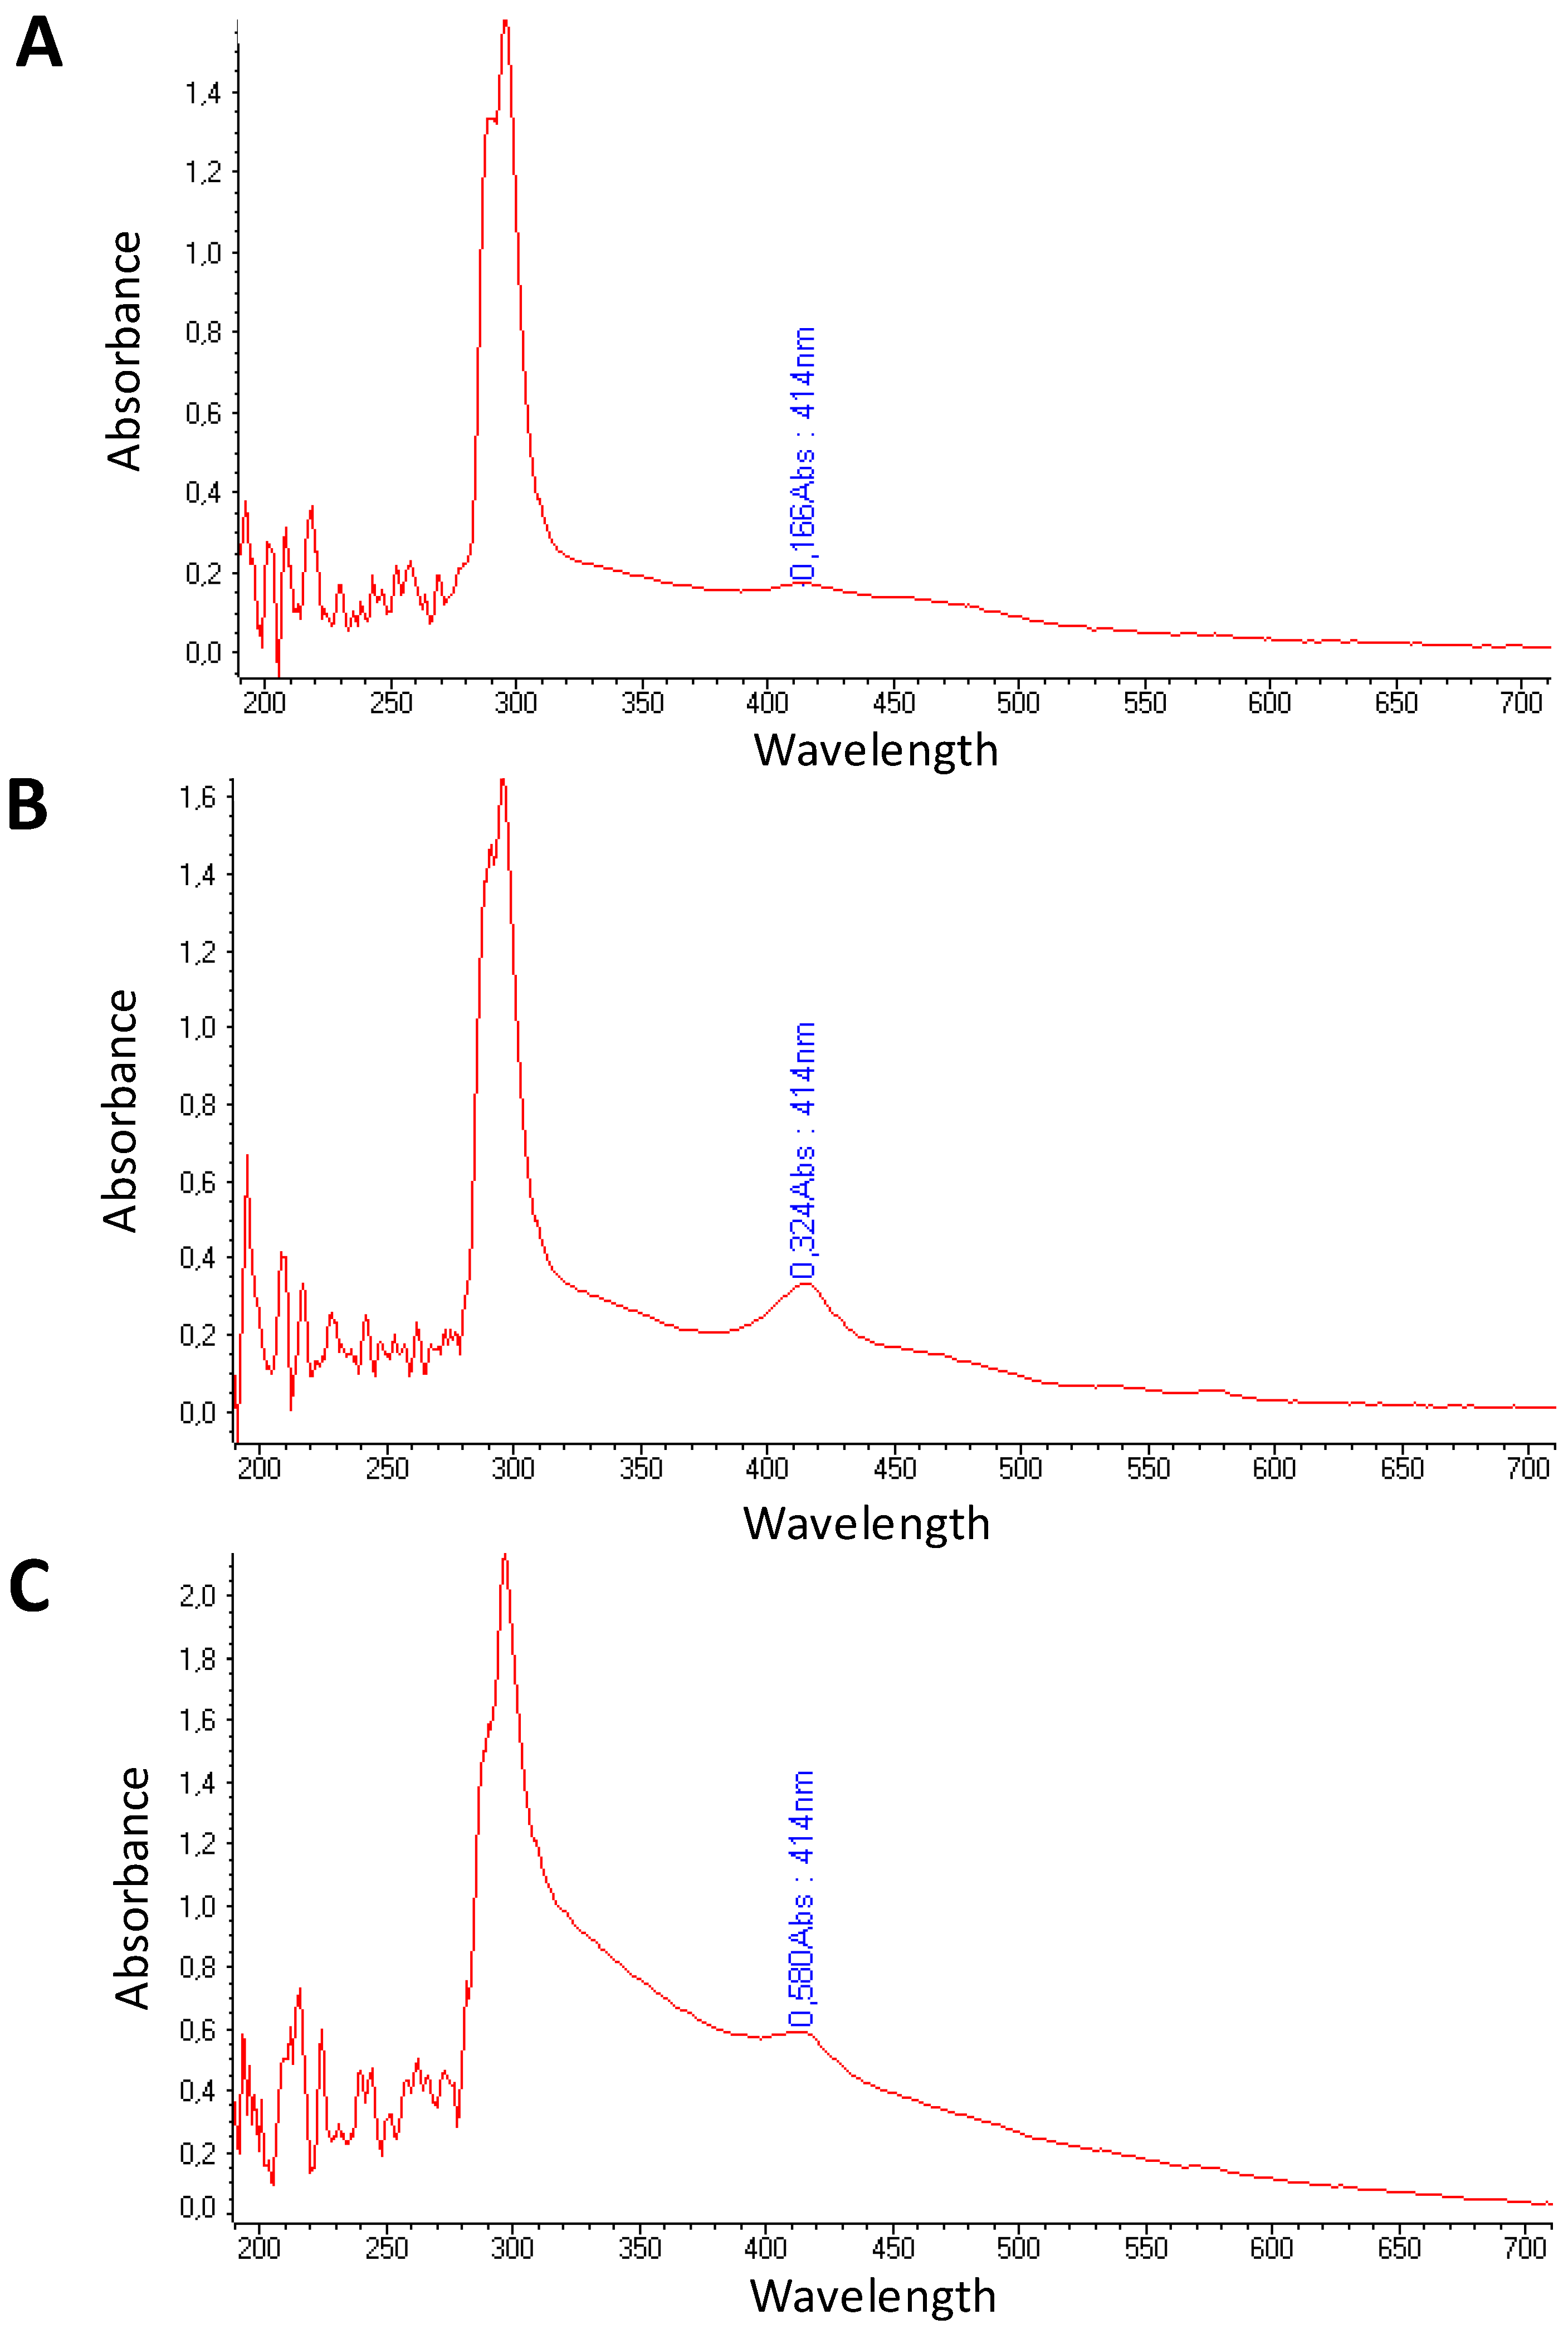
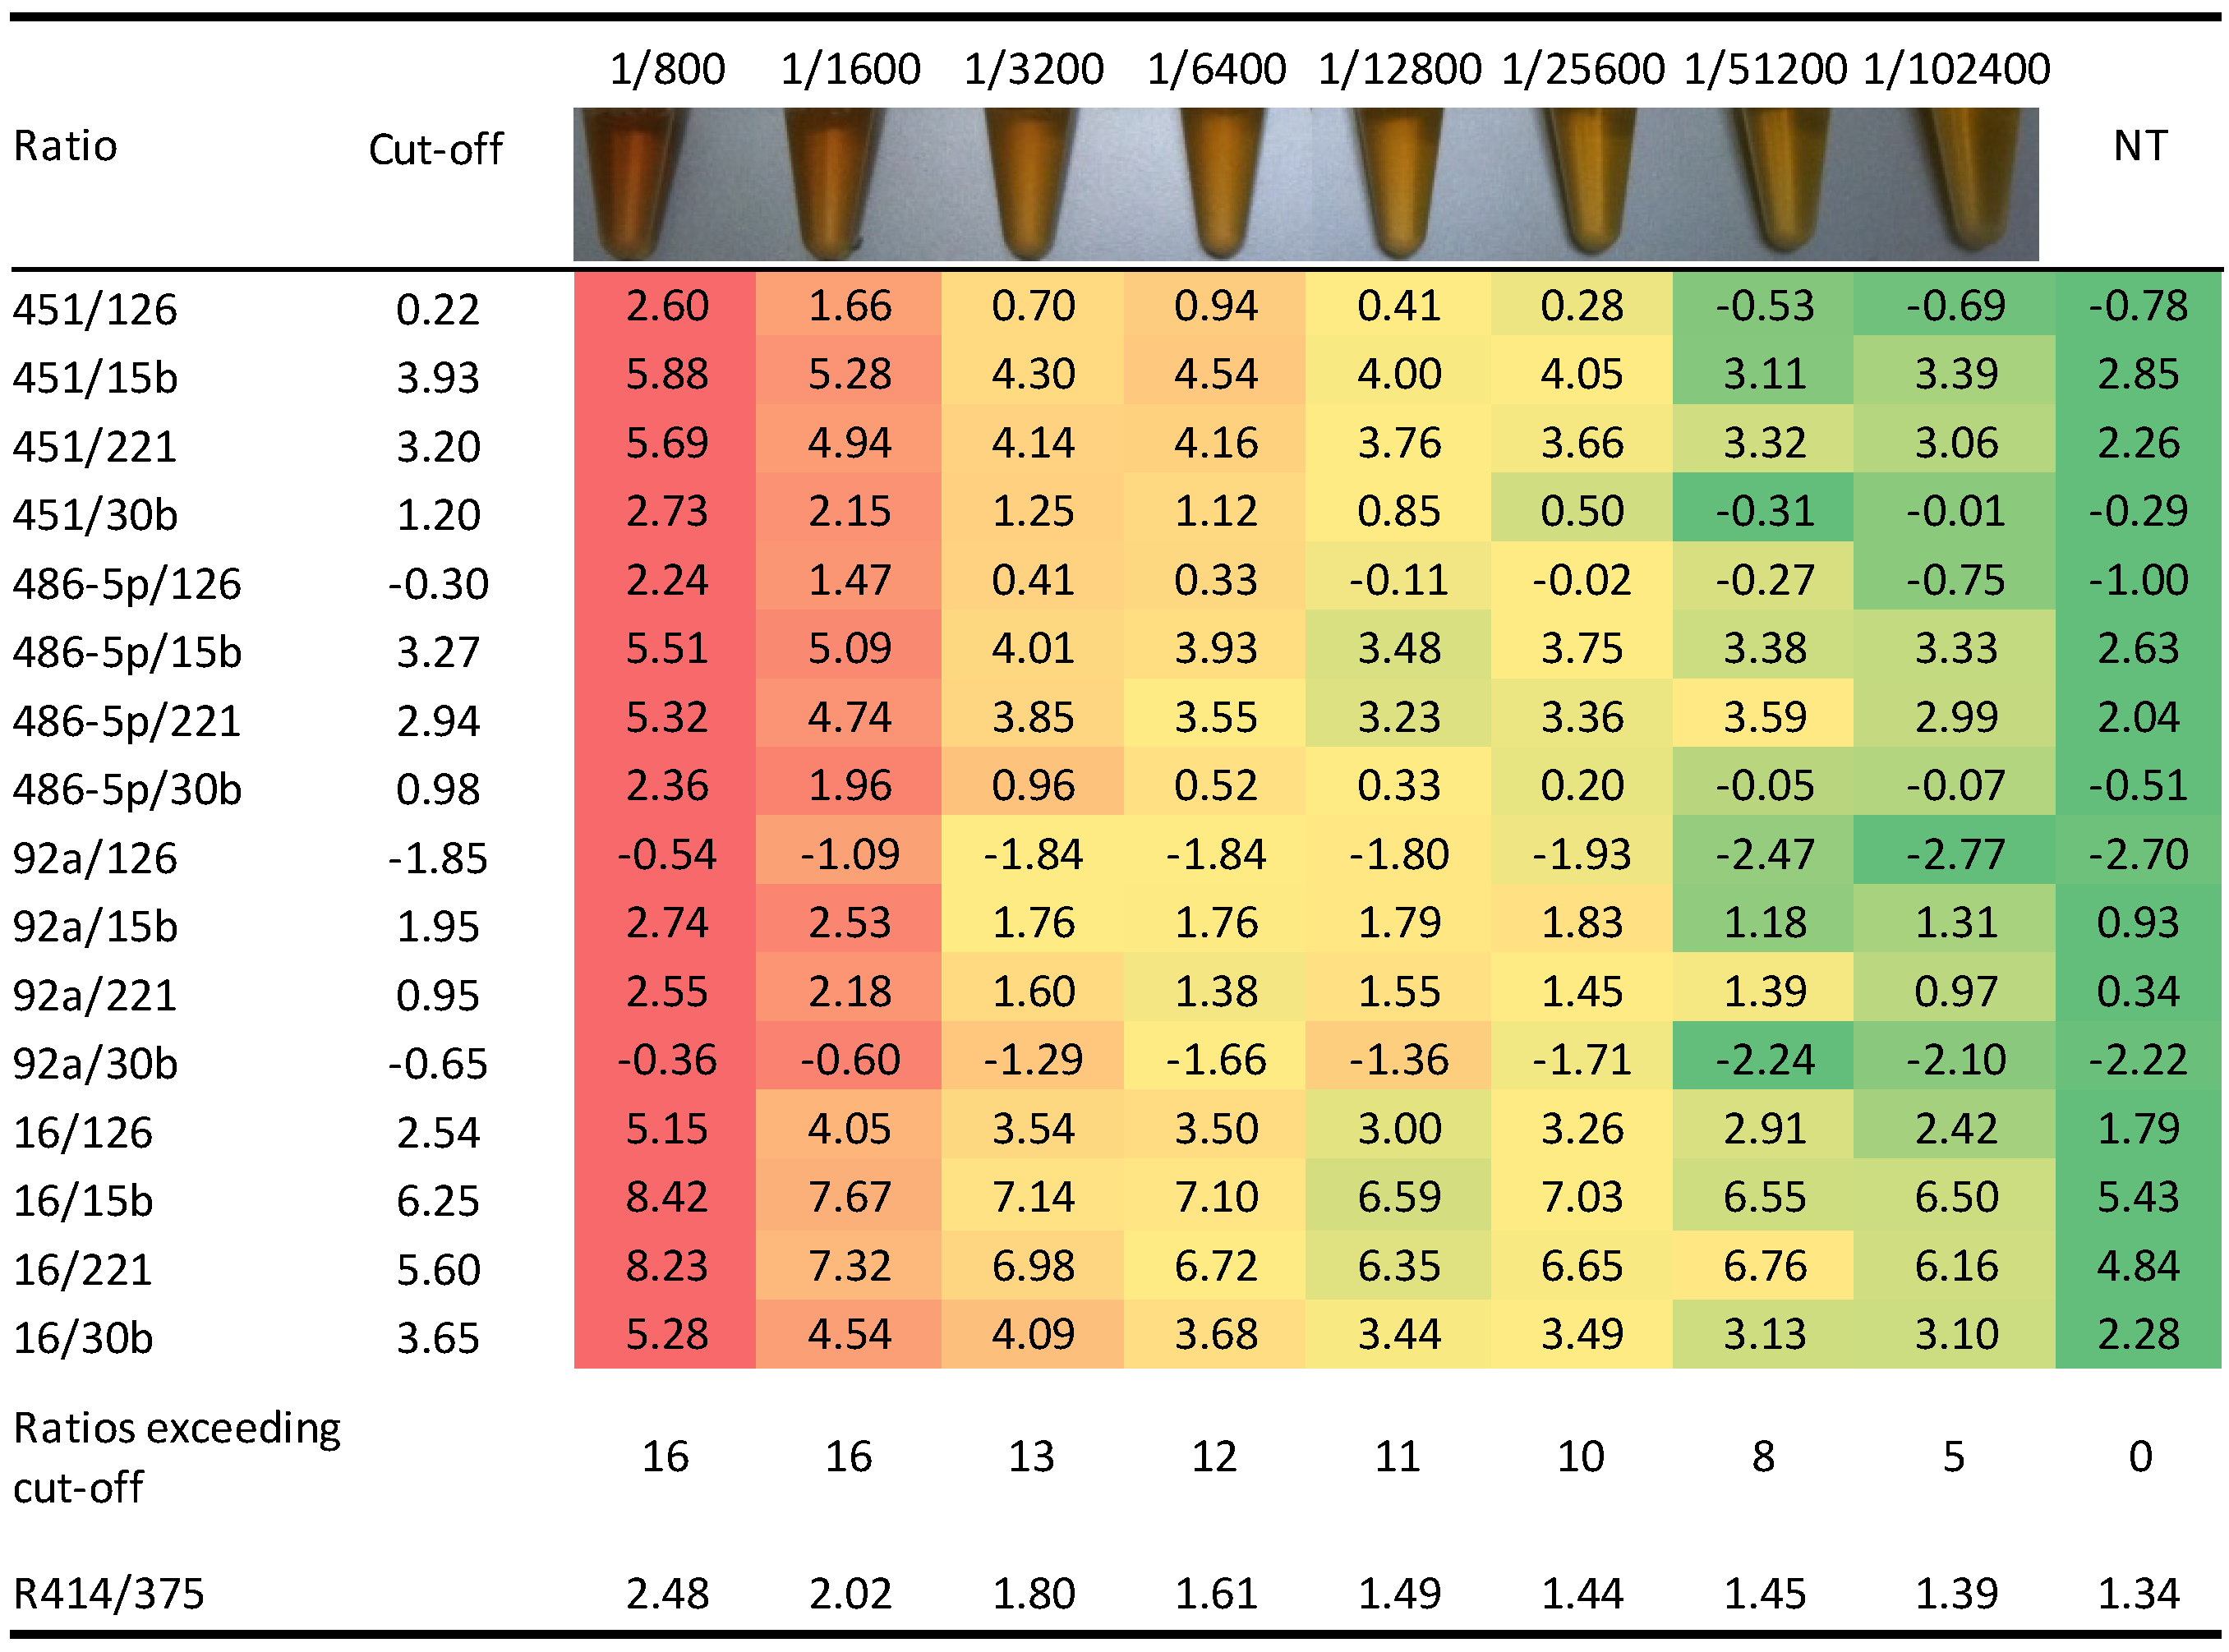
2.5.1. Pre-Analytical Quality Control

2.5.2. Haemolysis-Related miRNA Signature
| 24 Haemolysed Plasma Samples * | 30 Not Haemolysed Plasma Samples * | |||||
|---|---|---|---|---|---|---|
| Ct average | s.d. | Ct average | s.d. | p-value | ΔCt | |
| miR-101 | 28.8 | 1.8 | 31.0 | 1.4 | 0.000 | 2.2 |
| miR-106a | 19.9 | 1.6 | 21.4 | 1.3 | 0.014 | 1.5 |
| miR-126 | 21.7 | 1.5 | 21.9 | 1.4 | 0.484 | 0.3 |
| miR-133a | 30.8 | 2.4 | 30.8 | 1.6 | 0.964 | 0.0 |
| miR-140-3p | 28.9 | 1.9 | 32.1 | 1.6 | 0.000 | 3.1 |
| miR-140-5p | 25.8 | 1.6 | 26.4 | 1.2 | 0.177 | 0.5 |
| miR-142-3p | 22.3 | 1.8 | 22.1 | 1.5 | 0.643 | −0.2 |
| miR-145 | 26.6 | 1.8 | 27.1 | 1.5 | 0.258 | 0.5 |
| miR-148a | 28.6 | 1.5 | 29.8 | 1.6 | 0.012 | 1.1 |
| miR-15b | 25.0 | 1.6 | 25.9 | 1.4 | 0.034 | 0.9 |
| miR-16 | 18.3 | 2.2 | 21.6 | 1.2 | 0.000 | 3.3 |
| miR-17 | 20.0 | 1.6 | 21.5 | 1.3 | 0.010 | 1.5 |
| miR-197 | 26.2 | 1.2 | 27.0 | 1.4 | 0.035 | 0.8 |
| miR-19b | 20.4 | 1.8 | 22.2 | 1.3 | 0.007 | 1.9 |
| miR-21 | 24.9 | 1.9 | 25.5 | 1.2 | 0.172 | 0.6 |
| miR-221 | 24.8 | 1.9 | 24.7 | 1.5 | 0.904 | −0.1 |
| miR-28-3p | 26.8 | 1.4 | 27.1 | 1.4 | 0.352 | 0.4 |
| miR-30b | 22.8 | 1.6 | 23.1 | 1.5 | 0.461 | 0.3 |
| miR-30c | 24.3 | 1.6 | 25.1 | 1.5 | 0.104 | 0.7 |
| miR-320 | 22.6 | 1.4 | 23.8 | 1.3 | 0.018 | 1.2 |
| miR-451 | 20.0 | 2.5 | 23.9 | 1.4 | 0.000 | 3.9 |
| miR-486-5p | 20.6 | 2.2 | 24.0 | 1.3 | 0.000 | 3.3 |
| miR-660 | 27.8 | 2.1 | 29.6 | 1.3 | 0.009 | 1.8 |
| miR-92a | 22.8 | 1.5 | 24.7 | 1.2 | 0.000 | 2.0 |

3. Experimental
3.1. Study Population and Plasma Sample Collection
3.2. Evaluation of Haemolysis by Spectrophotometry
3.3. RNA Extraction and miRNA Profiling
3.4. Data Extrapolation and Ratios Generation
3.5. Storage Time Evaluation
4. Conclusions
Acknowledgments
Author Contributions
Conflictts of Interest
References
- Siegel, R.; Naishadham, D.; Jemal, A. Cancer statistics, 2013. CA Cancer J. Clin. 2013, 63, 11–30. [Google Scholar] [CrossRef]
- Pastorino, U.; Bellomi, M.; Landoni, C.; de Fiori, E.; Arnaldi, P.; Picchio, M.; Pelosi, G.; Boyle, P.; Fazio, F. Early lung-cancer detection with spiral CT and positron emission tomography in heavy smokers: 2-Year results. Lancet 2003, 362, 593–597. [Google Scholar] [CrossRef]
- Pastorino, U. Lung cancer screening. Br. J. Cancer 2010, 102, 1681–1686. [Google Scholar] [CrossRef]
- Kramer, B.S.; Berg, C.D.; Aberle, D.R.; Prorok, P.C. Lung cancer screening with low-dose helical CT: Results from the National Lung Screening Trial (NLST). J Med. Screen. 2011, 18, 109–111. [Google Scholar] [CrossRef]
- Patz, E.F., Jr.; Pinsky, P.; Gatsonis, C.; Sicks, J.D.; Kramer, B.S.; Tammemagi, M.C.; Chiles, C.; Black, W.C.; Aberle, D.R. Overdiagnosis in low-dose computed tomography screening for lung cancer. JAMA Intern. Med. 2014, 174, 269–274. [Google Scholar] [CrossRef]
- Infante, M.; Cavuto, S.; Lutman, F.R.; Brambilla, G.; Chiesa, G.; Ceresoli, G.; Passera, E.; Angeli, E.; Chiarenza, M.; Aranzulla, G.; et al. A randomized study of lung cancer screening with spiral computed tomography: Three-year results from the DANTE trial. Am. J. Respir. Crit Care Med. 2009, 180, 445–453. [Google Scholar] [CrossRef]
- Saghir, Z.; Dirksen, A.; Ashraf, H.; Bach, K.S.; Brodersen, J.; Clementsen, P.F.; Dossing, M.; Hansen, H.; Kofoed, K.F.; Larsen, K.R.; et al. CT screening for lung cancer brings forward early disease. The randomised Danish Lung Cancer Screening Trial: Status after five annual screening rounds with low-dose CT. Thorax 2012, 67, 296–301. [Google Scholar] [CrossRef]
- Pastorino, U.; Rossi, M.; Rosato, V.; Marchiano, A.; Sverzellati, N.; Morosi, C.; Fabbri, A.; Galeone, C.; Negri, E.; Sozzi, G.; et al. Annual or biennial CT screening versus observation in heavy smokers: 5-year results of the MILD trial. Eur. J. Cancer Prev. 2012, 21, 308–315. [Google Scholar] [CrossRef]
- Bartel, D.P. MicroRNAs: Genomics, biogenesis, mechanism, and function. Cell 2004, 116, 281–297. [Google Scholar] [CrossRef]
- Denli, A.M.; Tops, B.B.; Plasterk, R.H.; Ketting, R.F.; Hannon, G.J. Processing of primary microRNAs by the Microprocessor complex. Nature 2004, 432, 231–235. [Google Scholar] [CrossRef]
- Lagos-Quintana, M.; Rauhut, R.; Lendeckel, W.; Tuschl, T. Identification of novel genes coding for small expressed RNAs. Science 2001, 294, 853–858. [Google Scholar] [CrossRef]
- Lee, R.C.; Ambros, V. An extensive class of small RNAs in Caenorhabditis elegans. Science 2001, 294, 862–864. [Google Scholar] [CrossRef]
- Lau, N.C.; Lim, L.P.; Weinstein, E.G.; Bartel, D.P. An abundant class of tiny RNAs with probable regulatory roles in Caenorhabditis elegans. Science 2001, 294, 858–862. [Google Scholar] [CrossRef]
- Croce, C.M. Causes and consequences of microRNA dysregulation in cancer. Nat. Rev. Genet. 2009, 10, 704–714. [Google Scholar] [CrossRef]
- Fabbri, M.; Croce, C.M. Role of microRNAs in lymphoid biology and disease. Curr. Opin. Hematol. 2011, 18, 266–272. [Google Scholar] [CrossRef]
- Shen, J.; Todd, N.W.; Zhang, H.; Yu, L.; Lingxiao, X.; Mei, Y.; Guarnera, M.; Liao, J.; Chou, A.; Lu, C.L.; et al. Plasma microRNAs as potential biomarkers for non-small-cell lung cancer. Lab Invest. 2010. [Google Scholar] [CrossRef]
- Hu, Z.; Chen, X.; Zhao, Y.; Tian, T.; Jin, G.; Shu, Y.; Chen, Y.; Xu, L.; Zen, K.; Zhang, C.; et al. Serum microRNA signatures identified in a genome-wide serum microRNA expression profiling predict survival of non-small-cell lung cancer. J. Clin. Oncol. 2010, 28, 1721–1726. [Google Scholar] [CrossRef]
- Xie, Y.; Todd, N.W.; Liu, Z.; Zhan, M.; Fang, H.; Peng, H.; Alattar, M.; Deepak, J.; Stass, S.A.; Jiang, F. Altered miRNA expression in sputum for diagnosis of non-small cell lung cancer. Lung Cancer 2009. [Google Scholar] [CrossRef]
- Park, N.J.; Zhou, H.; Elashoff, D.; Henson, B.S.; Kastratovic, D.A.; Abemayor, E.; Wong, D.T. Salivary microRNA: Discovery, characterization, and clinical utility for oral cancer detection. Clin. Cancer Res. 2009, 15, 5473–5477. [Google Scholar] [CrossRef]
- Hanke, M.; Hoefig, K.; Merz, H.; Feller, A.C.; Kausch, I.; Jocham, D.; Warnecke, J.M.; Sczakiel, G. A robust methodology to study urine microRNA as tumor marker: microRNA-126 and microRNA-182 are related to urinary bladder cancer. Urol. Oncol. 2010, 28, 655–661. [Google Scholar] [CrossRef]
- Kosaka, N.; Izumi, H.; Sekine, K.; Ochiya, T. microRNA as a new immune-regulatory agent in breast milk. Silence 2010, 1, 1–8. [Google Scholar] [CrossRef]
- Valadi, H.; Ekstrom, K.; Bossios, A.; Sjostrand, M.; Lee, J.J.; Lotvall, J.O. Exosome-mediated transfer of mRNAs and microRNAs is a novel mechanism of genetic exchange between cells. Nat. Cell Biol. 2007, 9, 654–659. [Google Scholar] [CrossRef]
- Camussi, G.; Deregibus, M.C.; Bruno, S.; Cantaluppi, V.; Biancone, L. Exosomes/microvesicles as a mechanism of cell-to-cell communication. Kidney Int. 2010, 78, 838–848. [Google Scholar] [CrossRef]
- Arroyo, J.D.; Chevillet, J.R.; Kroh, E.M.; Ruf, I.K.; Pritchard, C.C.; Gibson, D.F.; Mitchell, P.S.; Bennett, C.F.; Pogosova-Agadjanyan, E.L.; Stirewalt, D.L.; et al. Argonaute2 complexes carry a population of circulating microRNAs independent of vesicles in human plasma. Proc. Natl. Acad. Sci. USA 2011, 108, 5003–5008. [Google Scholar] [CrossRef]
- Sozzi, G.; Pastorino, U.; Croce, C.M. MicroRNAs and lung cancer: From markers to targets. Cell Cycle 2011, 10, 2045–2046. [Google Scholar] [CrossRef]
- Kosaka, N.; Iguchi, H.; Ochiya, T. Circulating microRNA in body fluid: A new potential biomarker for cancer diagnosis and prognosis. Cancer Sci. 2010, 101, 2087–2092. [Google Scholar] [CrossRef]
- Silva, J.; Garcia, V.; Zaballos, A.; Provencio, M.; Lombardia, L.; Almonacid, L.; Garcia, J.M.; Dominguez, G.; Pena, C.; Diaz, R.; et al. Vesicle-related microRNAs in plasma of nonsmall cell lung cancer patients and correlation with survival. Eur. Respir. J. 2011, 37, 617–623. [Google Scholar] [CrossRef]
- Zheng, D.; Haddadin, S.; Wang, Y.; Gu, L.Q.; Perry, M.C.; Freter, C.E.; Wang, M.X. Plasma microRNAs as novel biomarkers for early detection of lung cancer. Int. J. Clin. Exp. Pathol. 2011, 4, 575–586. [Google Scholar]
- Raymond, C.K.; Roberts, B.S.; Garrett-Engele, P.; Lim, L.P.; Johnson, J.M. Simple, quantitative primer-extension PCR assay for direct monitoring of microRNAs and short-interfering RNAs. RNA 2005, 11, 1737–1744. [Google Scholar] [CrossRef]
- Lao, K.; Xu, N.L.; Yeung, V.; Chen, C.; Livak, K.J.; Straus, N.A. Multiplexing RT-PCR for the detection of multiple miRNA species in small samples. Biochem. Biophys. Res. Commun. 2006, 343, 85–89. [Google Scholar] [CrossRef]
- Ji, X.; Takahashi, R.; Hiura, Y.; Hirokawa, G.; Fukushima, Y.; Iwai, N. Plasma miR-208 as a biomarker of myocardial injury. Clin. Chem. 2009, 55, 1944–1949. [Google Scholar] [CrossRef]
- Ng, E.K.; Chong, W.W.; Jin, H.; Lam, E.K.; Shin, V.Y.; Yu, J.; Poon, T.C.; Ng, S.S.; Sung, J.J. Differential expression of microRNAs in plasma of colorectal cancer patients: A potential marker for colorectal cancer screening. Gut 2009, 98, 1375–1381. [Google Scholar]
- Gee, H.E.; Buffa, F.M.; Camps, C.; Ramachandran, A.; Leek, R.; Taylor, M.; Patil, M.; Sheldon, H.; Betts, G.; Homer, J.; et al. The small-nucleolar RNAs commonly used for microRNA normalisation correlate with tumour pathology and prognosis. Br. J. Cancer 2011, 104, 1168–1177. [Google Scholar] [CrossRef]
- Song, J.; Bai, Z.; Han, W.; Zhang, J.; Meng, H.; Bi, J.; Ma, X.; Han, S.; Zhang, Z. Identification of suitable reference genes for qPCR analysis of serum microRNA in gastric cancer patients. Dig. Dis. Sci. 2012, 57, 897–904. [Google Scholar] [CrossRef]
- Benz, F.; Roderburg, C.; Vargas, C.D.; Vucur, M.; Gautheron, J.; Koch, A.; Zimmermann, H.; Janssen, J.; Nieuwenhuijsen, L.; Luedde, M.; et al. U6 is unsuitable for normalization of serum miRNA levels in patients with sepsis or liver fibrosis. Exp. Mol. Med. 2013, 45, e42. [Google Scholar] [CrossRef]
- Liu, J.; Gao, J.; Du, Y.; Li, Z.; Ren, Y.; Gu, J.; Wang, X.; Gong, Y.; Wang, W.; Kong, X. Combination of plasma microRNAs with serum CA19–9 for early detection of pancreatic cancer. Int. J. Cancer 2012, 131, 683–691. [Google Scholar] [CrossRef]
- Zuo, Z.; Calin, G.A.; de Paula, H.M.; Medeiros, L.J.; Fernandez, M.H.; Shimizu, M.; Garcia-Manero, G.; Bueso-Ramos, C.E. Circulating microRNAs let-7a and miR-16 predict progression-free survival and overall survival in patients with myelodysplastic syndrome. Blood 2011, 118, 413–415. [Google Scholar] [CrossRef]
- Liu, X.; Luo, H.N.; Tian, W.D.; Lu, J.; Li, G.; Wang, L.; Zhang, B.; Liang, B.J.; Peng, X.H.; Lin, S.X.; et al. Diagnostic and prognostic value of plasma microRNA deregulation in nasopharyngeal carcinoma. Cancer Biol. Ther. 2013, 14, 1133–1142. [Google Scholar] [CrossRef]
- Boeri, M.; Verri, C.; Conte, D.; Roz, L.; Modena, P.; Facchinetti, F.; Calabro, E.; Croce, C.M.; Pastorino, U.; Sozzi, G. MicroRNA signatures in tissues and plasma predict development and prognosis of computed tomography detected lung cancer. Proc. Natl. Acad. Sci. USA 2011, 108, 3713–3718. [Google Scholar] [CrossRef]
- Pritchard, C.C.; Kroh, E.; Wood, B.; Arroyo, J.D.; Dougherty, K.J.; Miyaji, M.M.; Tait, J.F.; Tewari, M. Blood cell origin of circulating microRNAs: A cautionary note for cancer biomarker studies. Cancer Prev. Res (Phila). 2012, 5, 492–497. [Google Scholar] [CrossRef]
- Kirschner, M.B.; Kao, S.C.; Edelman, J.J.; Armstrong, N.J.; Vallely, M.P.; van, Z.N.; Reid, G. Haemolysis during sample preparation alters microRNA content of plasma. PLoS One 2011, 6, e24145. [Google Scholar]
- Kennedy, J.B.; Maehara, K.T.; Baker, A.M. Cell and platelet stability in disodium and tripotassium edta. Am. J. Med. Technol. 1981, 47, 89–93. [Google Scholar]
- Mitchell, P.S.; Parkin, R.K.; Kroh, E.M.; Fritz, B.R.; Wyman, S.K.; Pogosova-Agadjanyan, E.L.; Peterson, A.; Noteboom, J.; O'Briant, K.C.; Allen, A.; et al. Circulating microRNAs as stable blood-based markers for cancer detection. Proc. Natl Acad. Sci. USA 2008, 105, 10513–10518. [Google Scholar] [CrossRef]
- Mestdagh, P.; van Vlierberghe, P.; de Weer, A.; Muth, D.; Westermann, F.; Speleman, F.; Vandesompele, J. A novel and universal method for microRNA RT-qPCR data normalization. Genome Biol. 2009, 10, R64. [Google Scholar] [CrossRef] [Green Version]
- Sozzi, G.; Boeri, M.; Rossi, M.; Verri, C.; Suatoni, P.; Bravi, F.; Roz, L.; Conte, D.; Grassi, M.; Sverzellati, N.; et al. Clinical Utility of a Plasma-Based miRNA Signature Classifier Within Computed Tomography Lung Cancer Screening: A Correlative MILD Trial Study. J. Clin. Oncol. 2014. [Google Scholar] [CrossRef]
- Duttagupta, R.; Jiang, R.; Gollub, J.; Getts, R.C.; Jones, K.W. Impact of cellular miRNAs on circulating miRNA biomarker signatures. PLoS One 2011, 6, e20769. [Google Scholar]
- Kirschner, M.B.; Edelman, J.J.; Kao, S.C.; Vallely, M.P.; van, Z.N.; Reid, G. The Impact of Hemolysis on Cell-Free microRNA Biomarkers. Front Genet. 2013, 4, 94. [Google Scholar]
- Icke, G.C.; Davis, R.E.; Nicol, D.J. A rapid method for the quantitation of haemoglobin A2. Pathology 1979, 11, 169–173. [Google Scholar] [CrossRef]
- Sample Availability: Not available.
© 2014 by the authors. Licensee MDPI, Basel, Switzerland. This article is an open access article distributed under the terms and conditions of the Creative Commons Attribution license ( http://creativecommons.org/licenses/by/3.0/).
Share and Cite
Fortunato, O.; Boeri, M.; Verri, C.; Conte, D.; Mensah, M.; Suatoni, P.; Pastorino, U.; Sozzi, G. Assessment of Circulating microRNAs in Plasma of Lung Cancer Patients. Molecules 2014, 19, 3038-3054. https://doi.org/10.3390/molecules19033038
Fortunato O, Boeri M, Verri C, Conte D, Mensah M, Suatoni P, Pastorino U, Sozzi G. Assessment of Circulating microRNAs in Plasma of Lung Cancer Patients. Molecules. 2014; 19(3):3038-3054. https://doi.org/10.3390/molecules19033038
Chicago/Turabian StyleFortunato, Orazio, Mattia Boeri, Carla Verri, Davide Conte, Mavis Mensah, Paola Suatoni, Ugo Pastorino, and Gabriella Sozzi. 2014. "Assessment of Circulating microRNAs in Plasma of Lung Cancer Patients" Molecules 19, no. 3: 3038-3054. https://doi.org/10.3390/molecules19033038