Combination of 2D/3D Ligand-Based Similarity Search in Rapid Virtual Screening from Multimillion Compound Repositories. Selection and Biological Evaluation of Potential PDE4 and PDE5 Inhibitors

 ,
,
Abstract
:
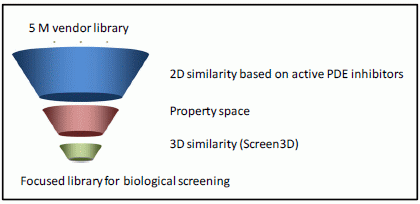
1. Introduction
2. Results and Discussion
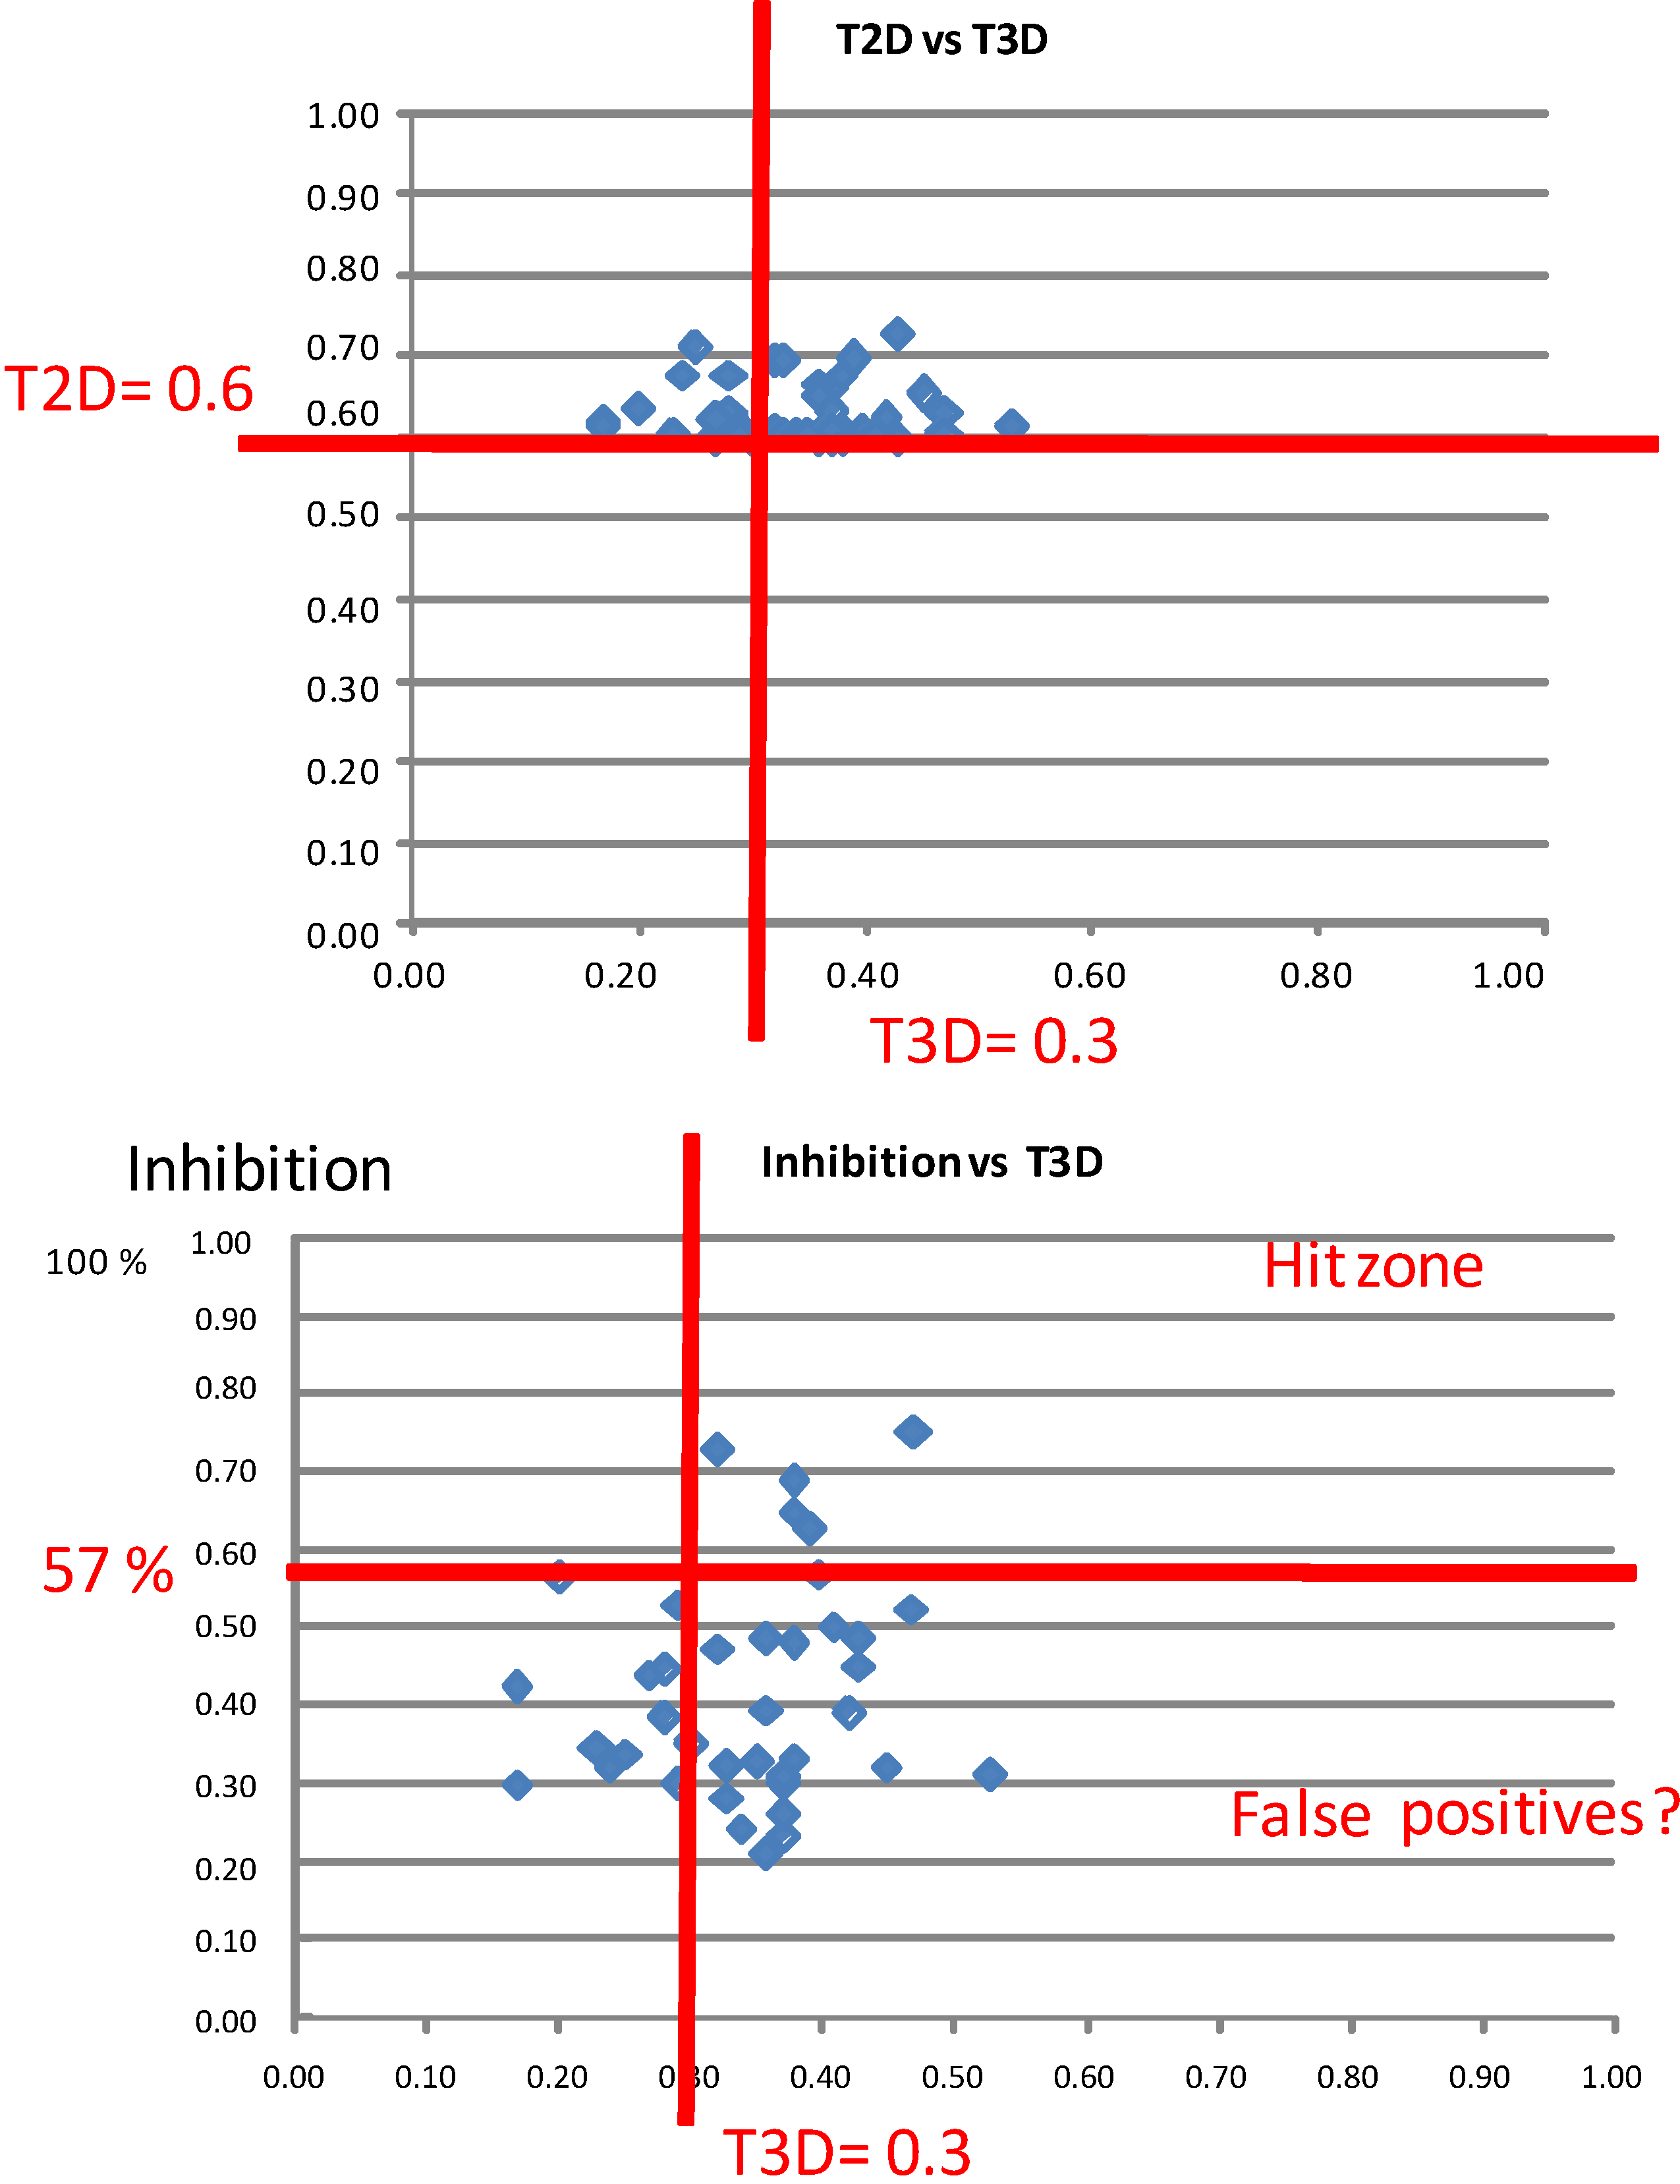
2.1. Case Study 1: 2D/3D Analysis of Available Data from PDE5 Screening

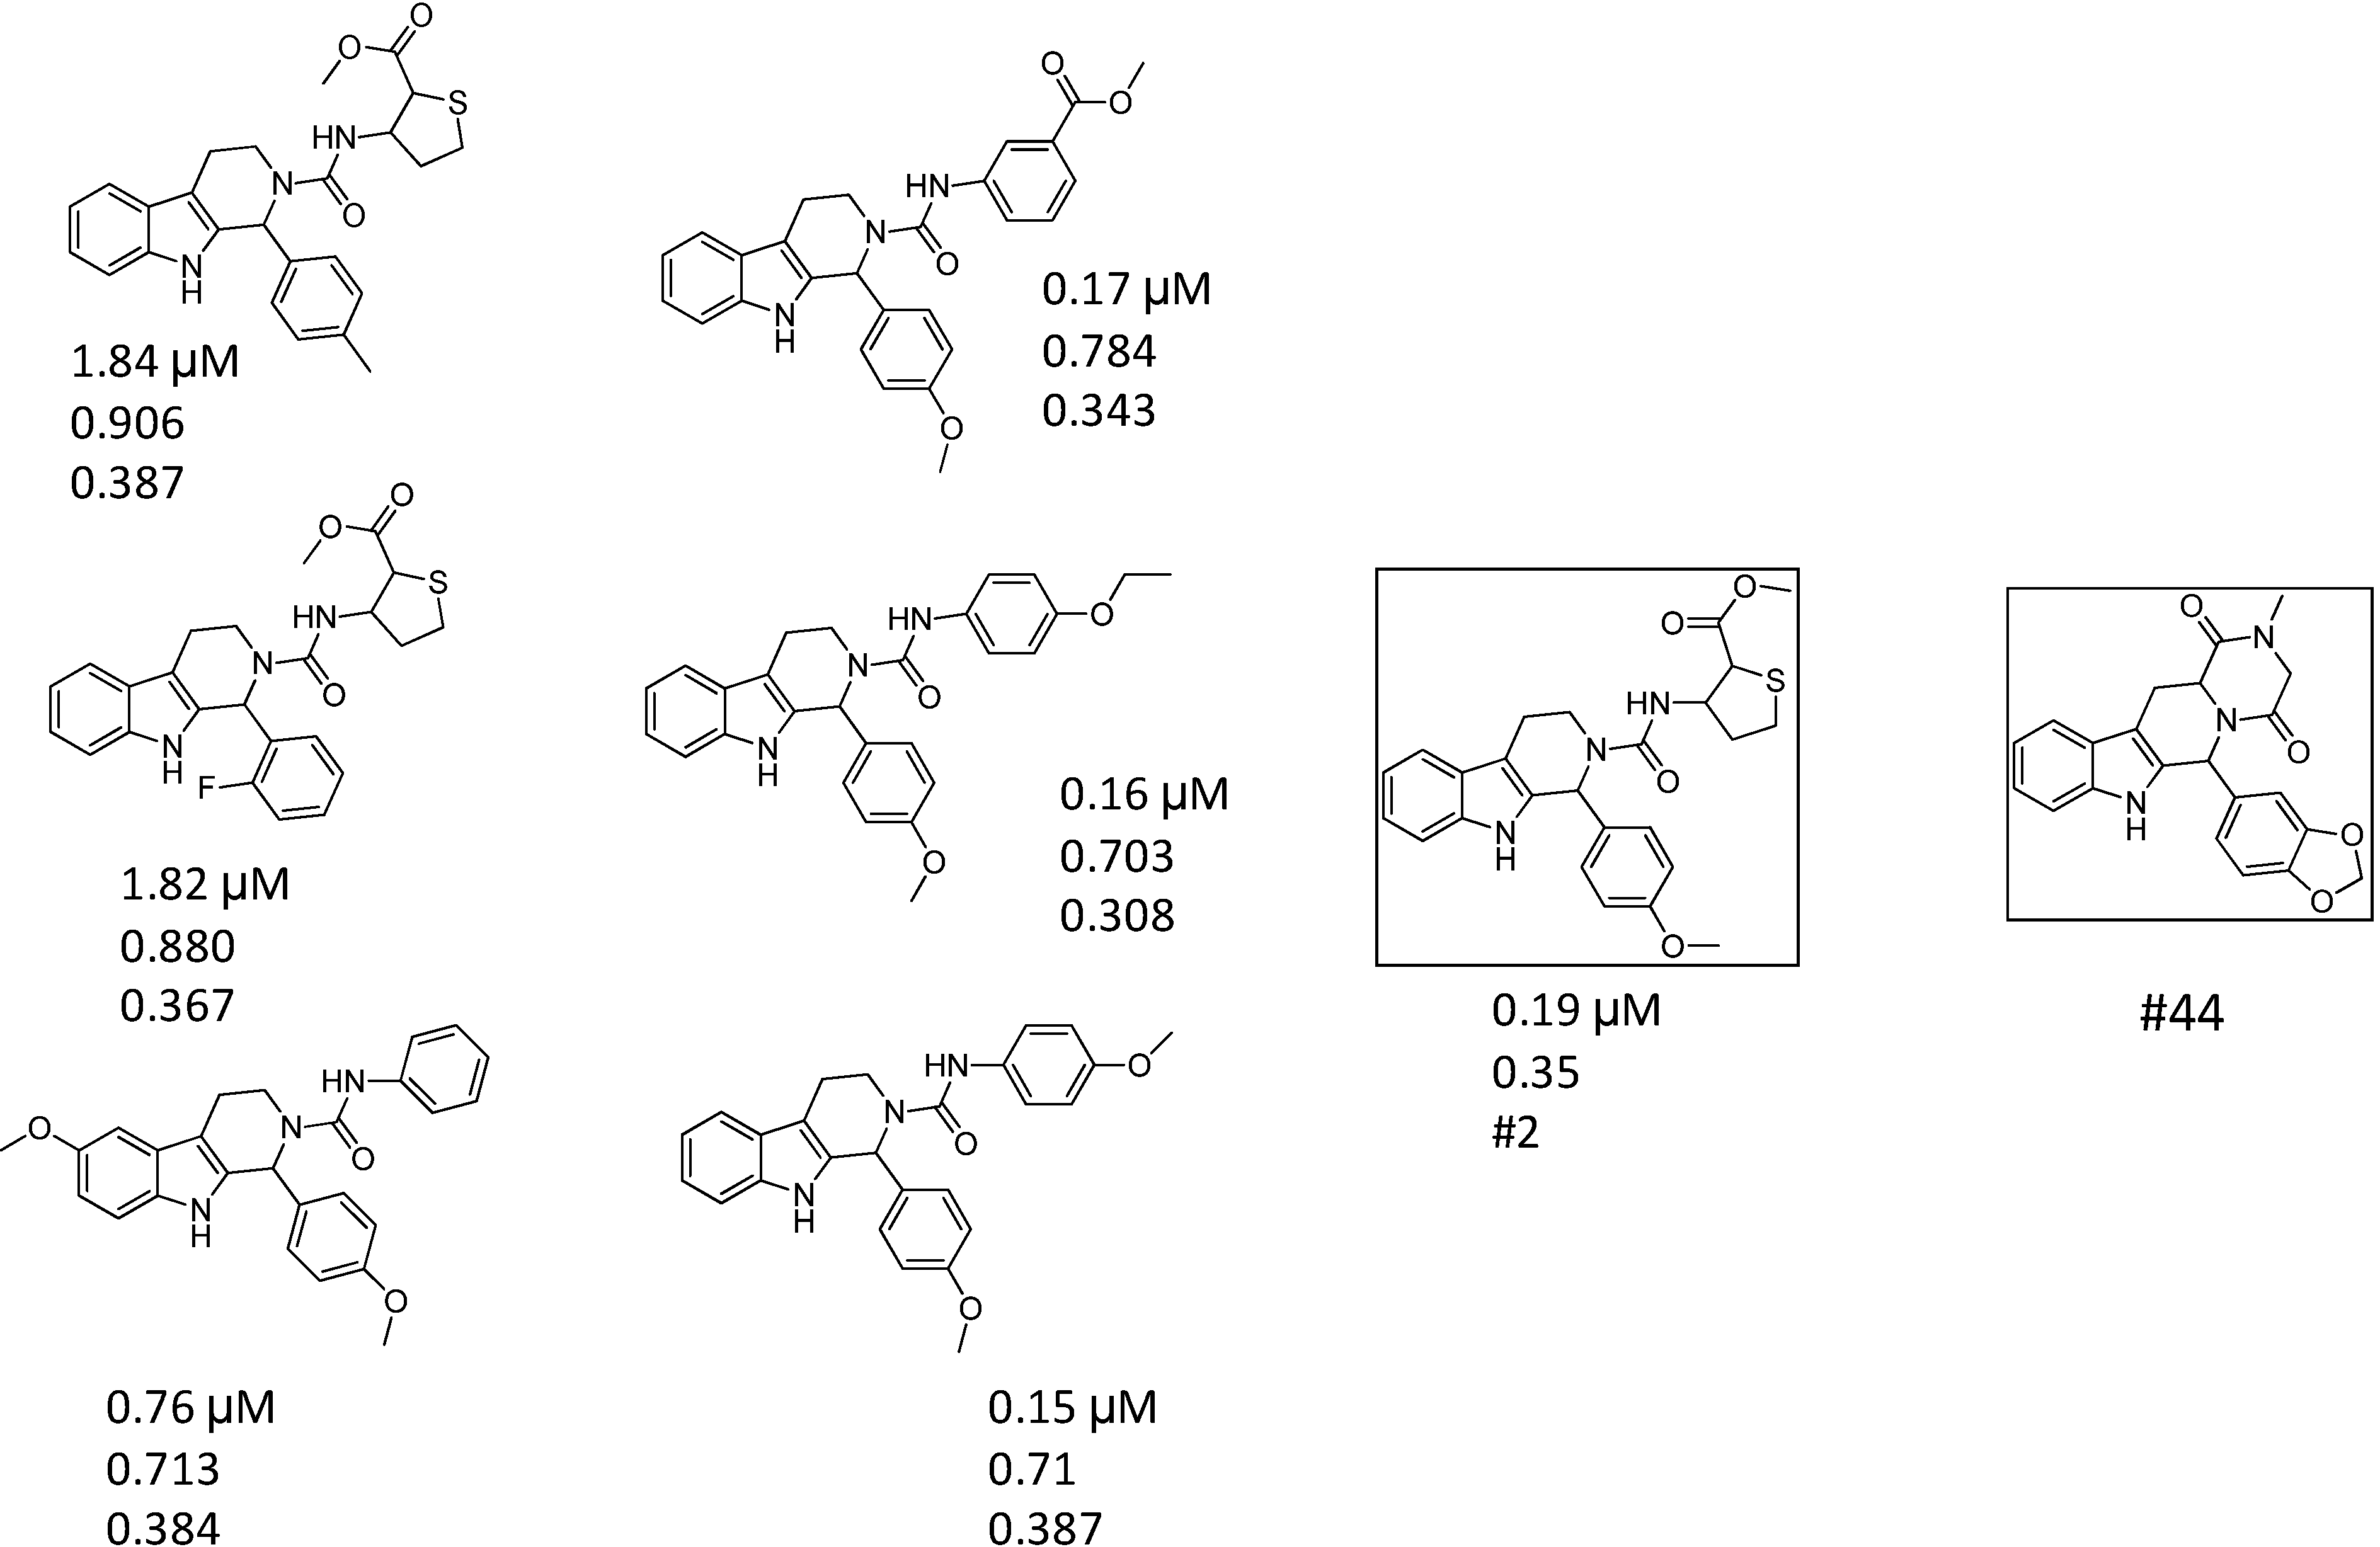
| ID | Hits | IC50 (µM) | T2D | T3D | Seeds | Seed ID |
|---|---|---|---|---|---|---|
| 1 |  | 3.65 | 0.63 | 0.47 |  | 13 |
| 2 |  | 1.99 | 0.61 | 0.38 |  | 18 |
| 3 |  | 7.24 | 0.61 | 0.31 | | 18 |
| 4 |  | 0.19 | 0.69 | 0.35 |  | 44 |
| 5 |  | 6.74 | 0.67 | 0.38 | | 44 |


2.2. Case Study 2: Application of Combined 2D/3D Similarity Selection in Generating of a PDE4 Focused Library

| ID | Structure | Inhibition | IC50 µM | T2D | Seed_ ID | Seed |
|---|---|---|---|---|---|---|
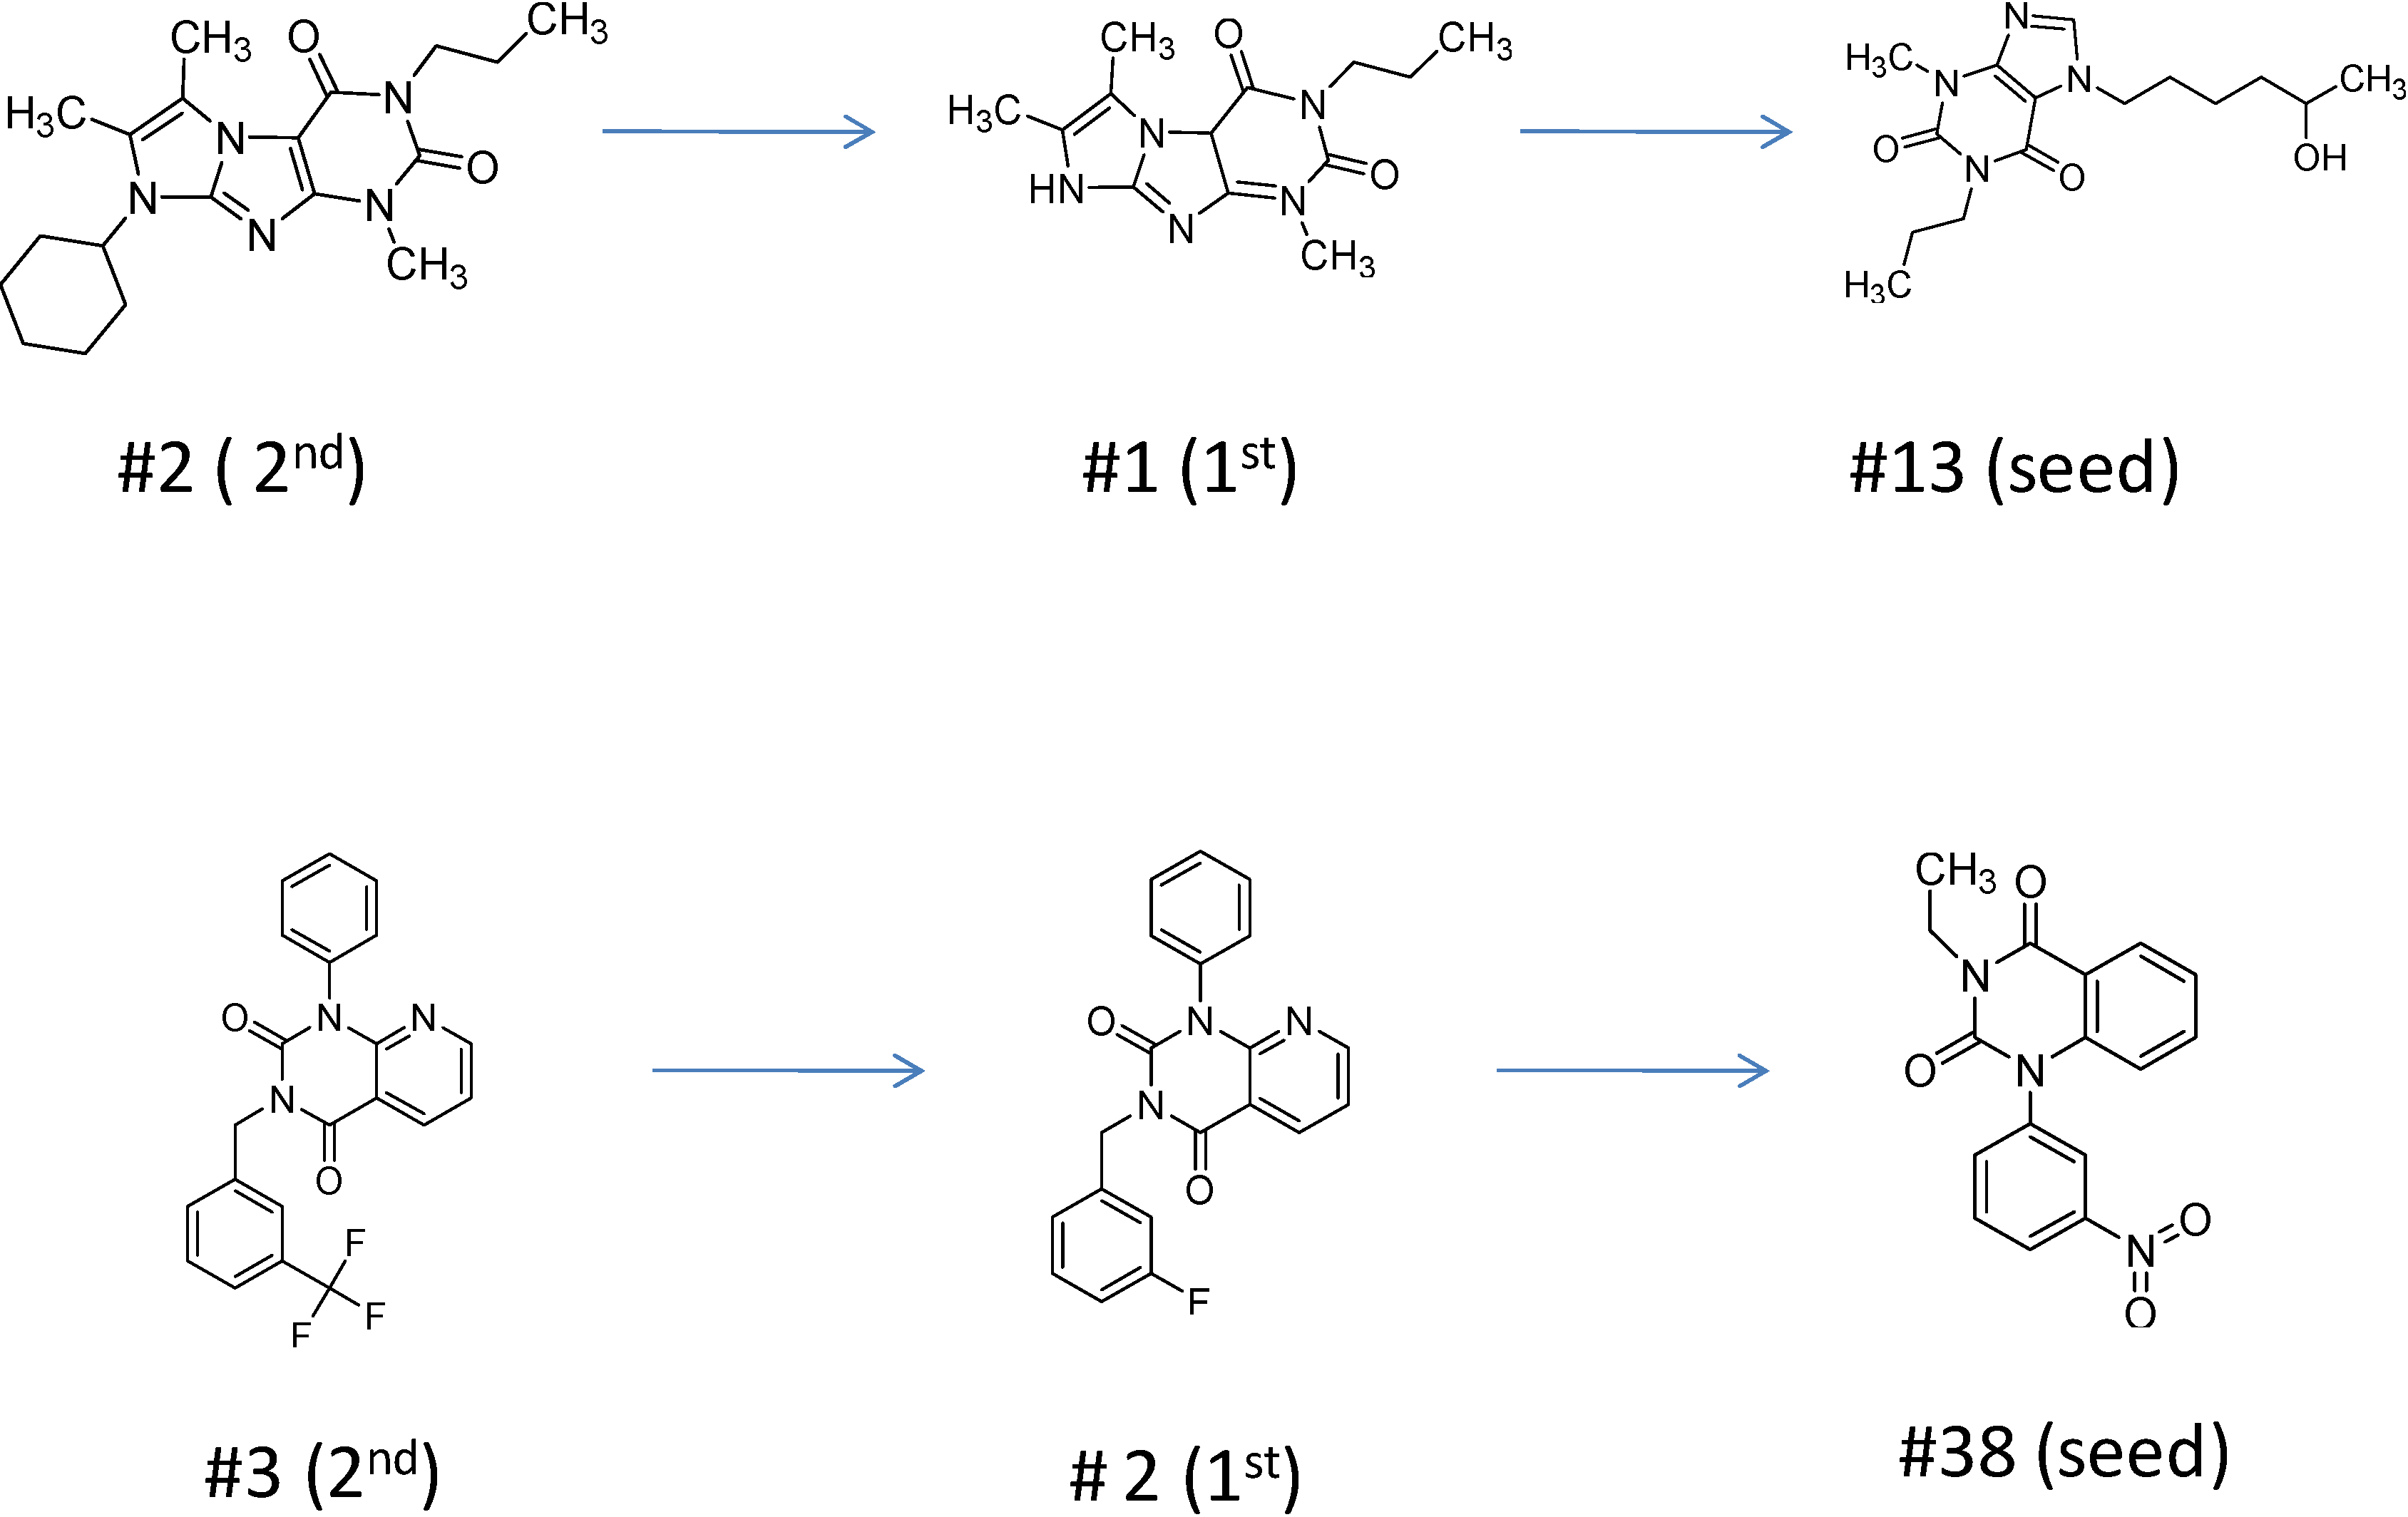
| 2 |  | 0.92 | 0.053 | 0.66 | 38 |  |
| 3 |  | 0.65 | 1.05 | 0.71 | 13 |  |
| 5 |  | 0.71 | 1.97 | 0.7 | 42 |  |
| 4 |  | 0.7 | 6.05 | 0.75 | 29 |  |
| 1 |  | 0.47 | 11.05 | 0.72 | 13 | |
| 6 |  | 0.56 | 13.79 | 0.66 | 14 |  |
| 7 |  | 0.6 | 16.05 | 0.77 | 24 |  |

- (1)
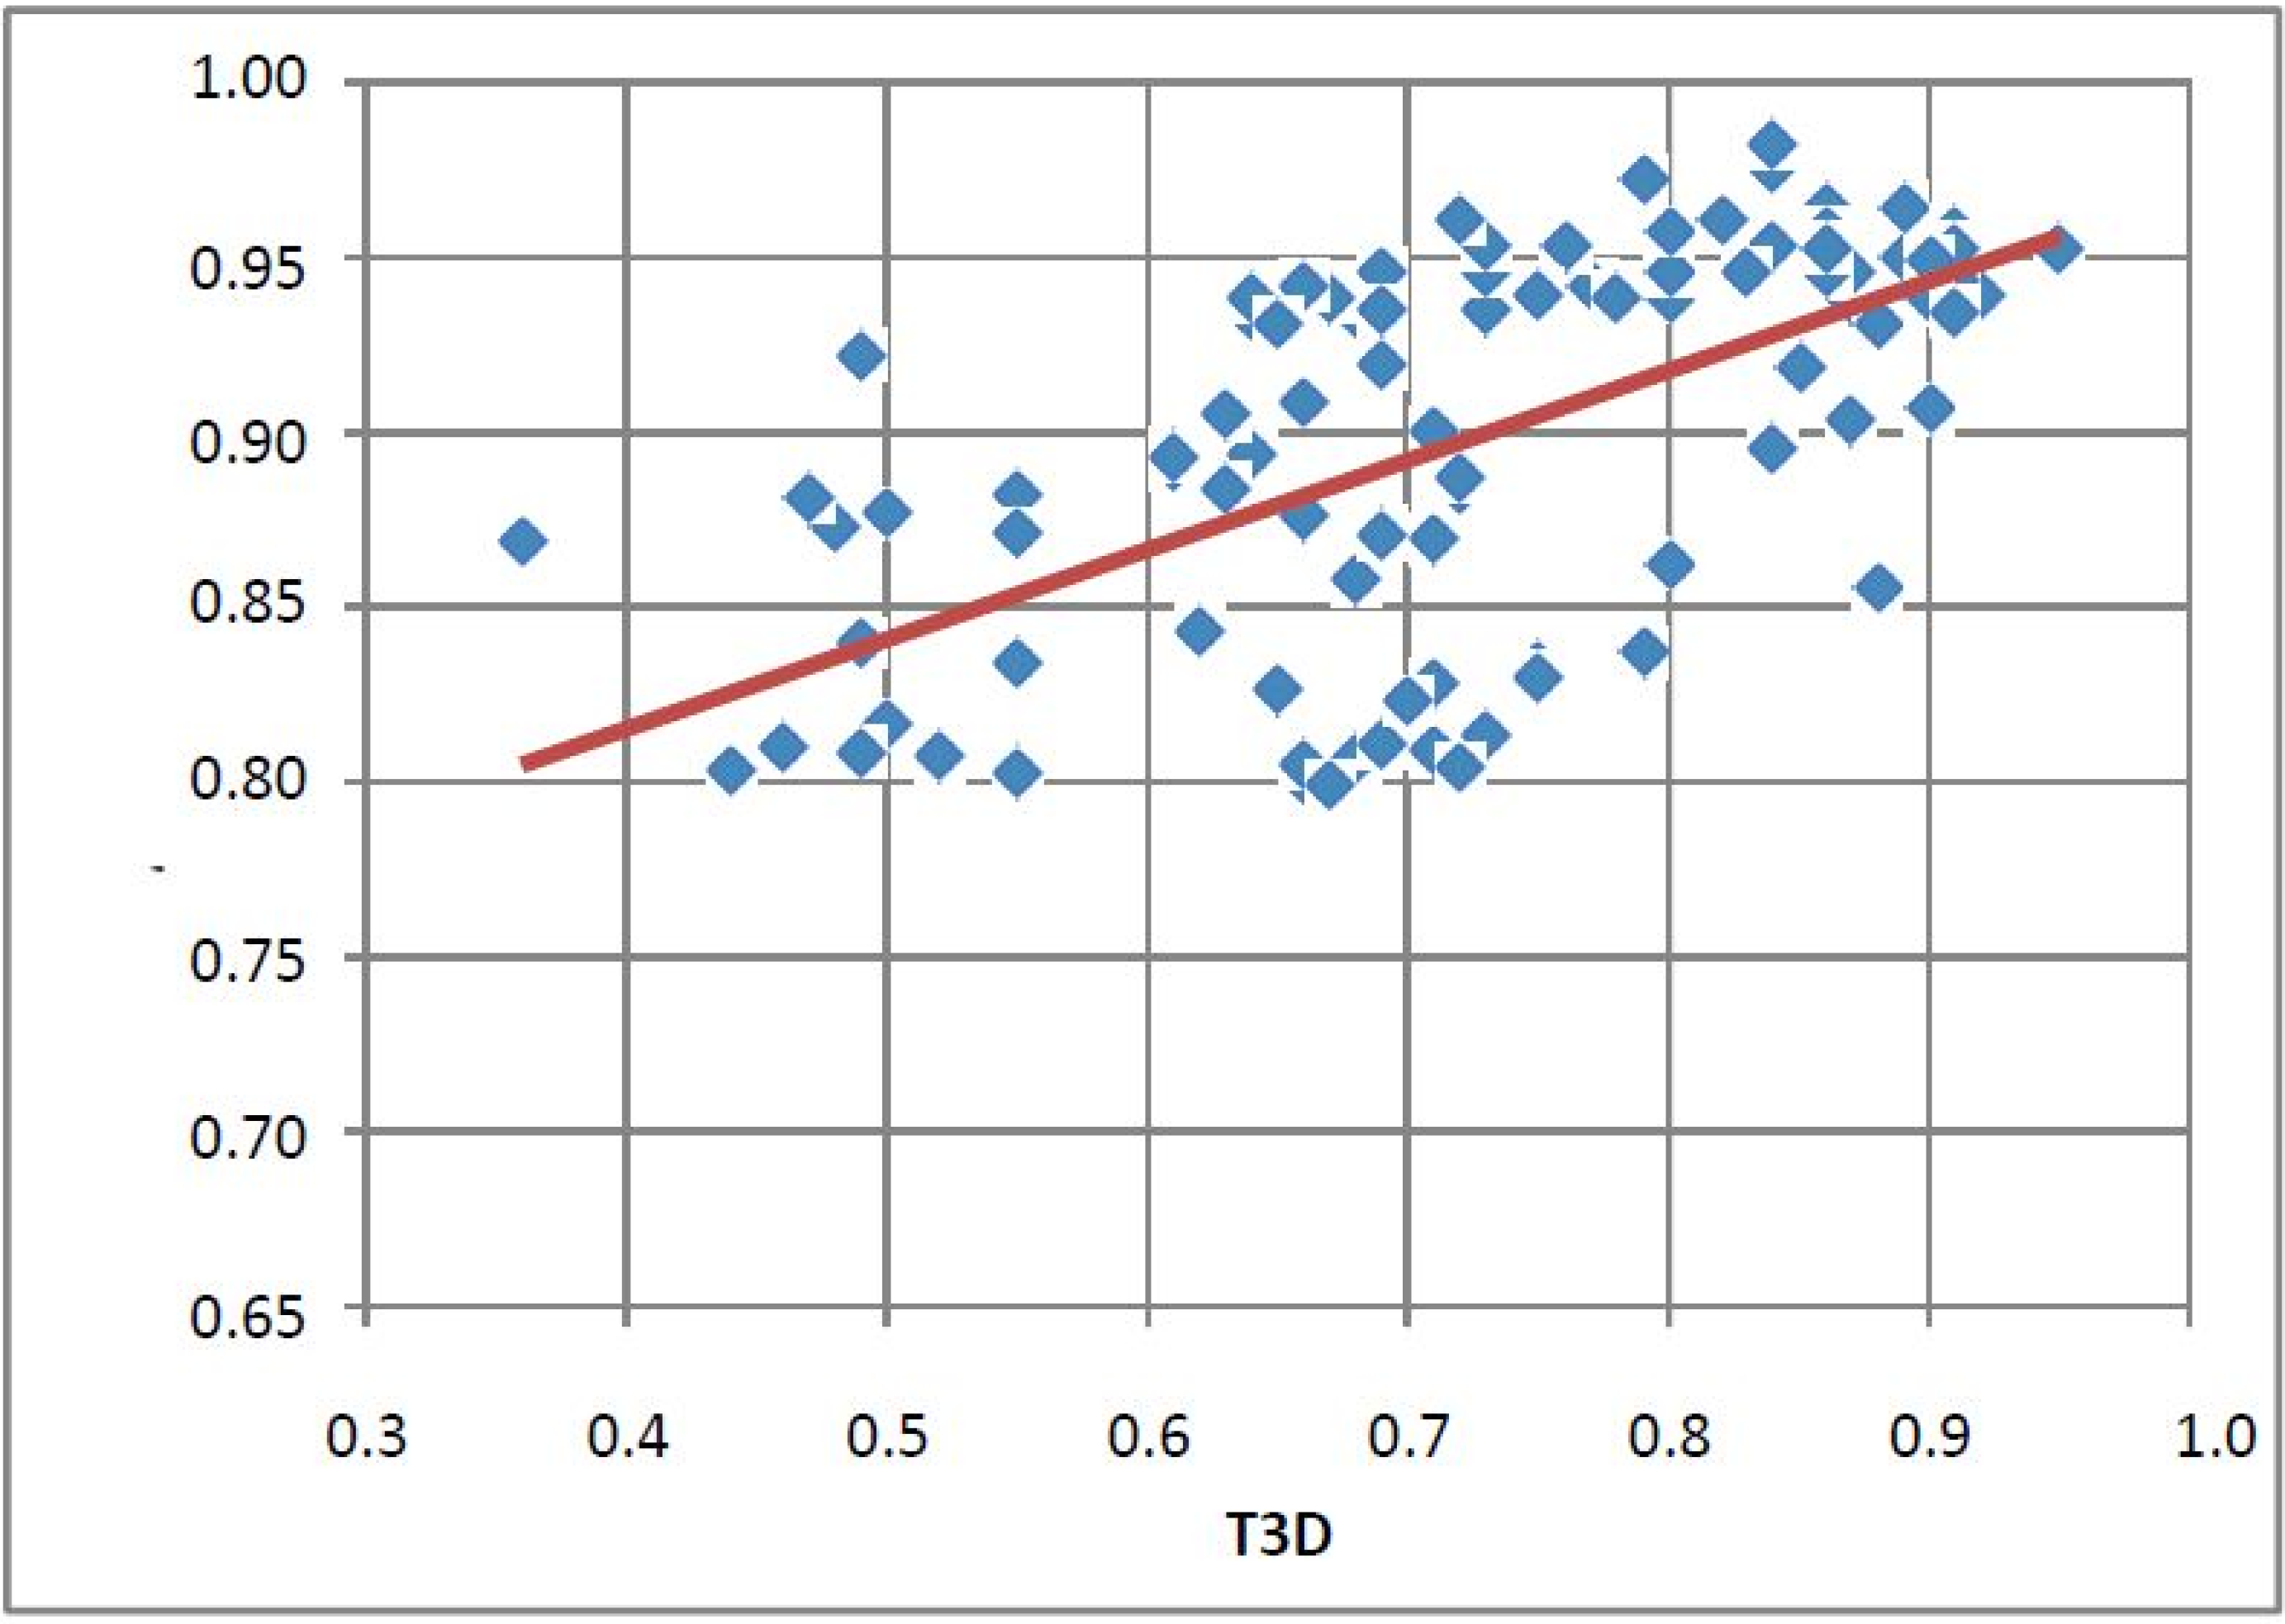
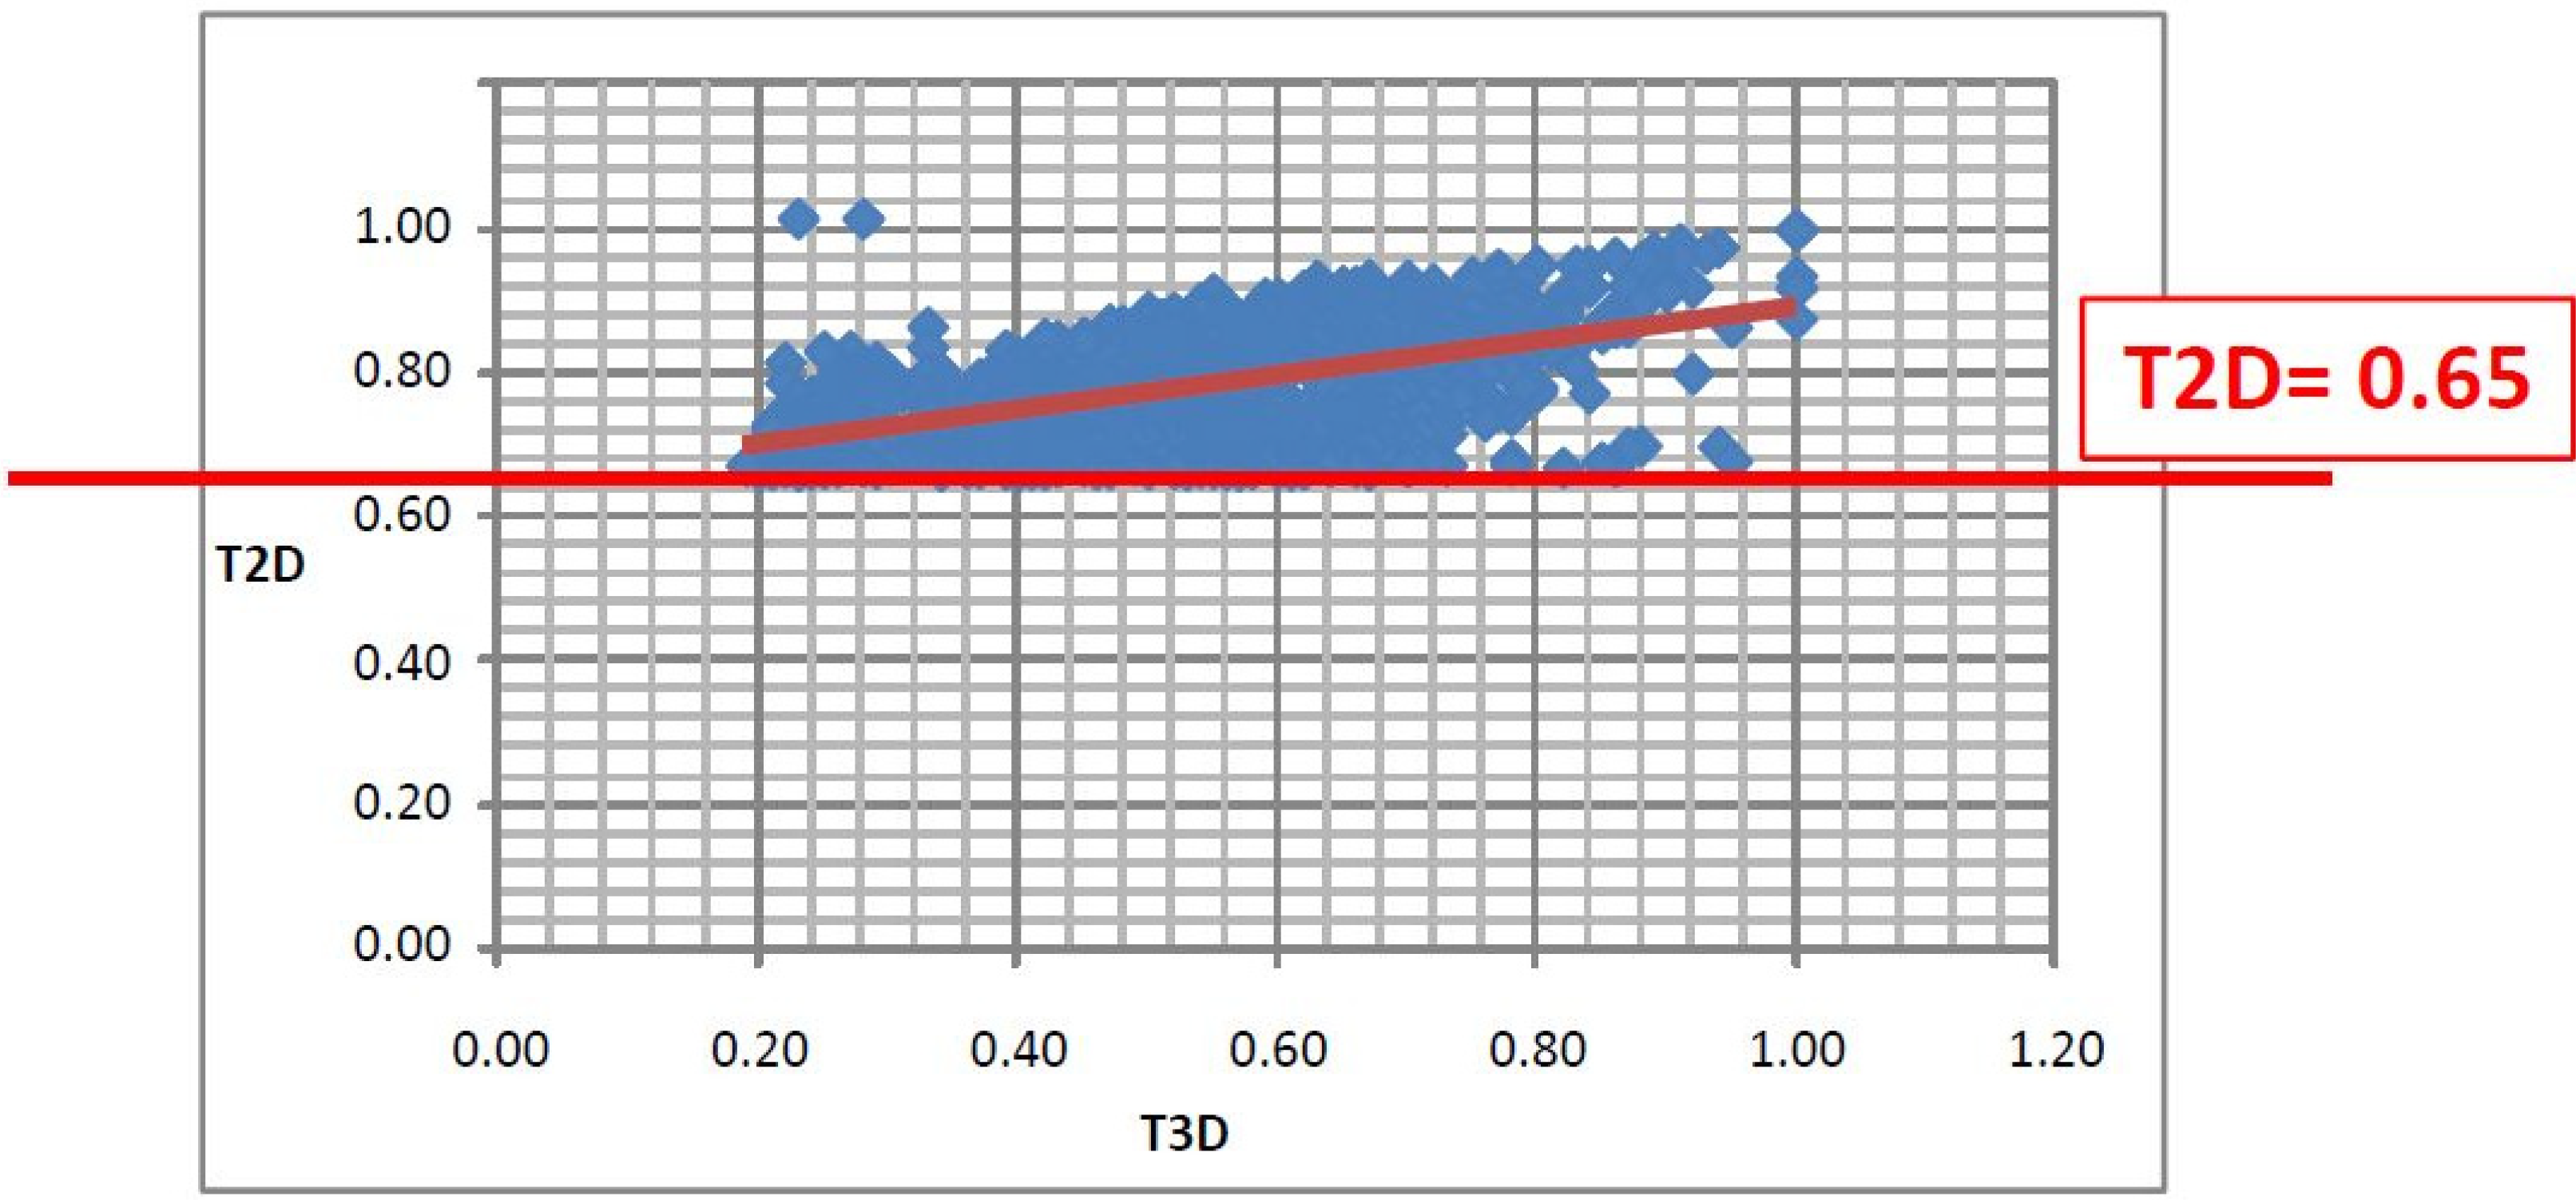
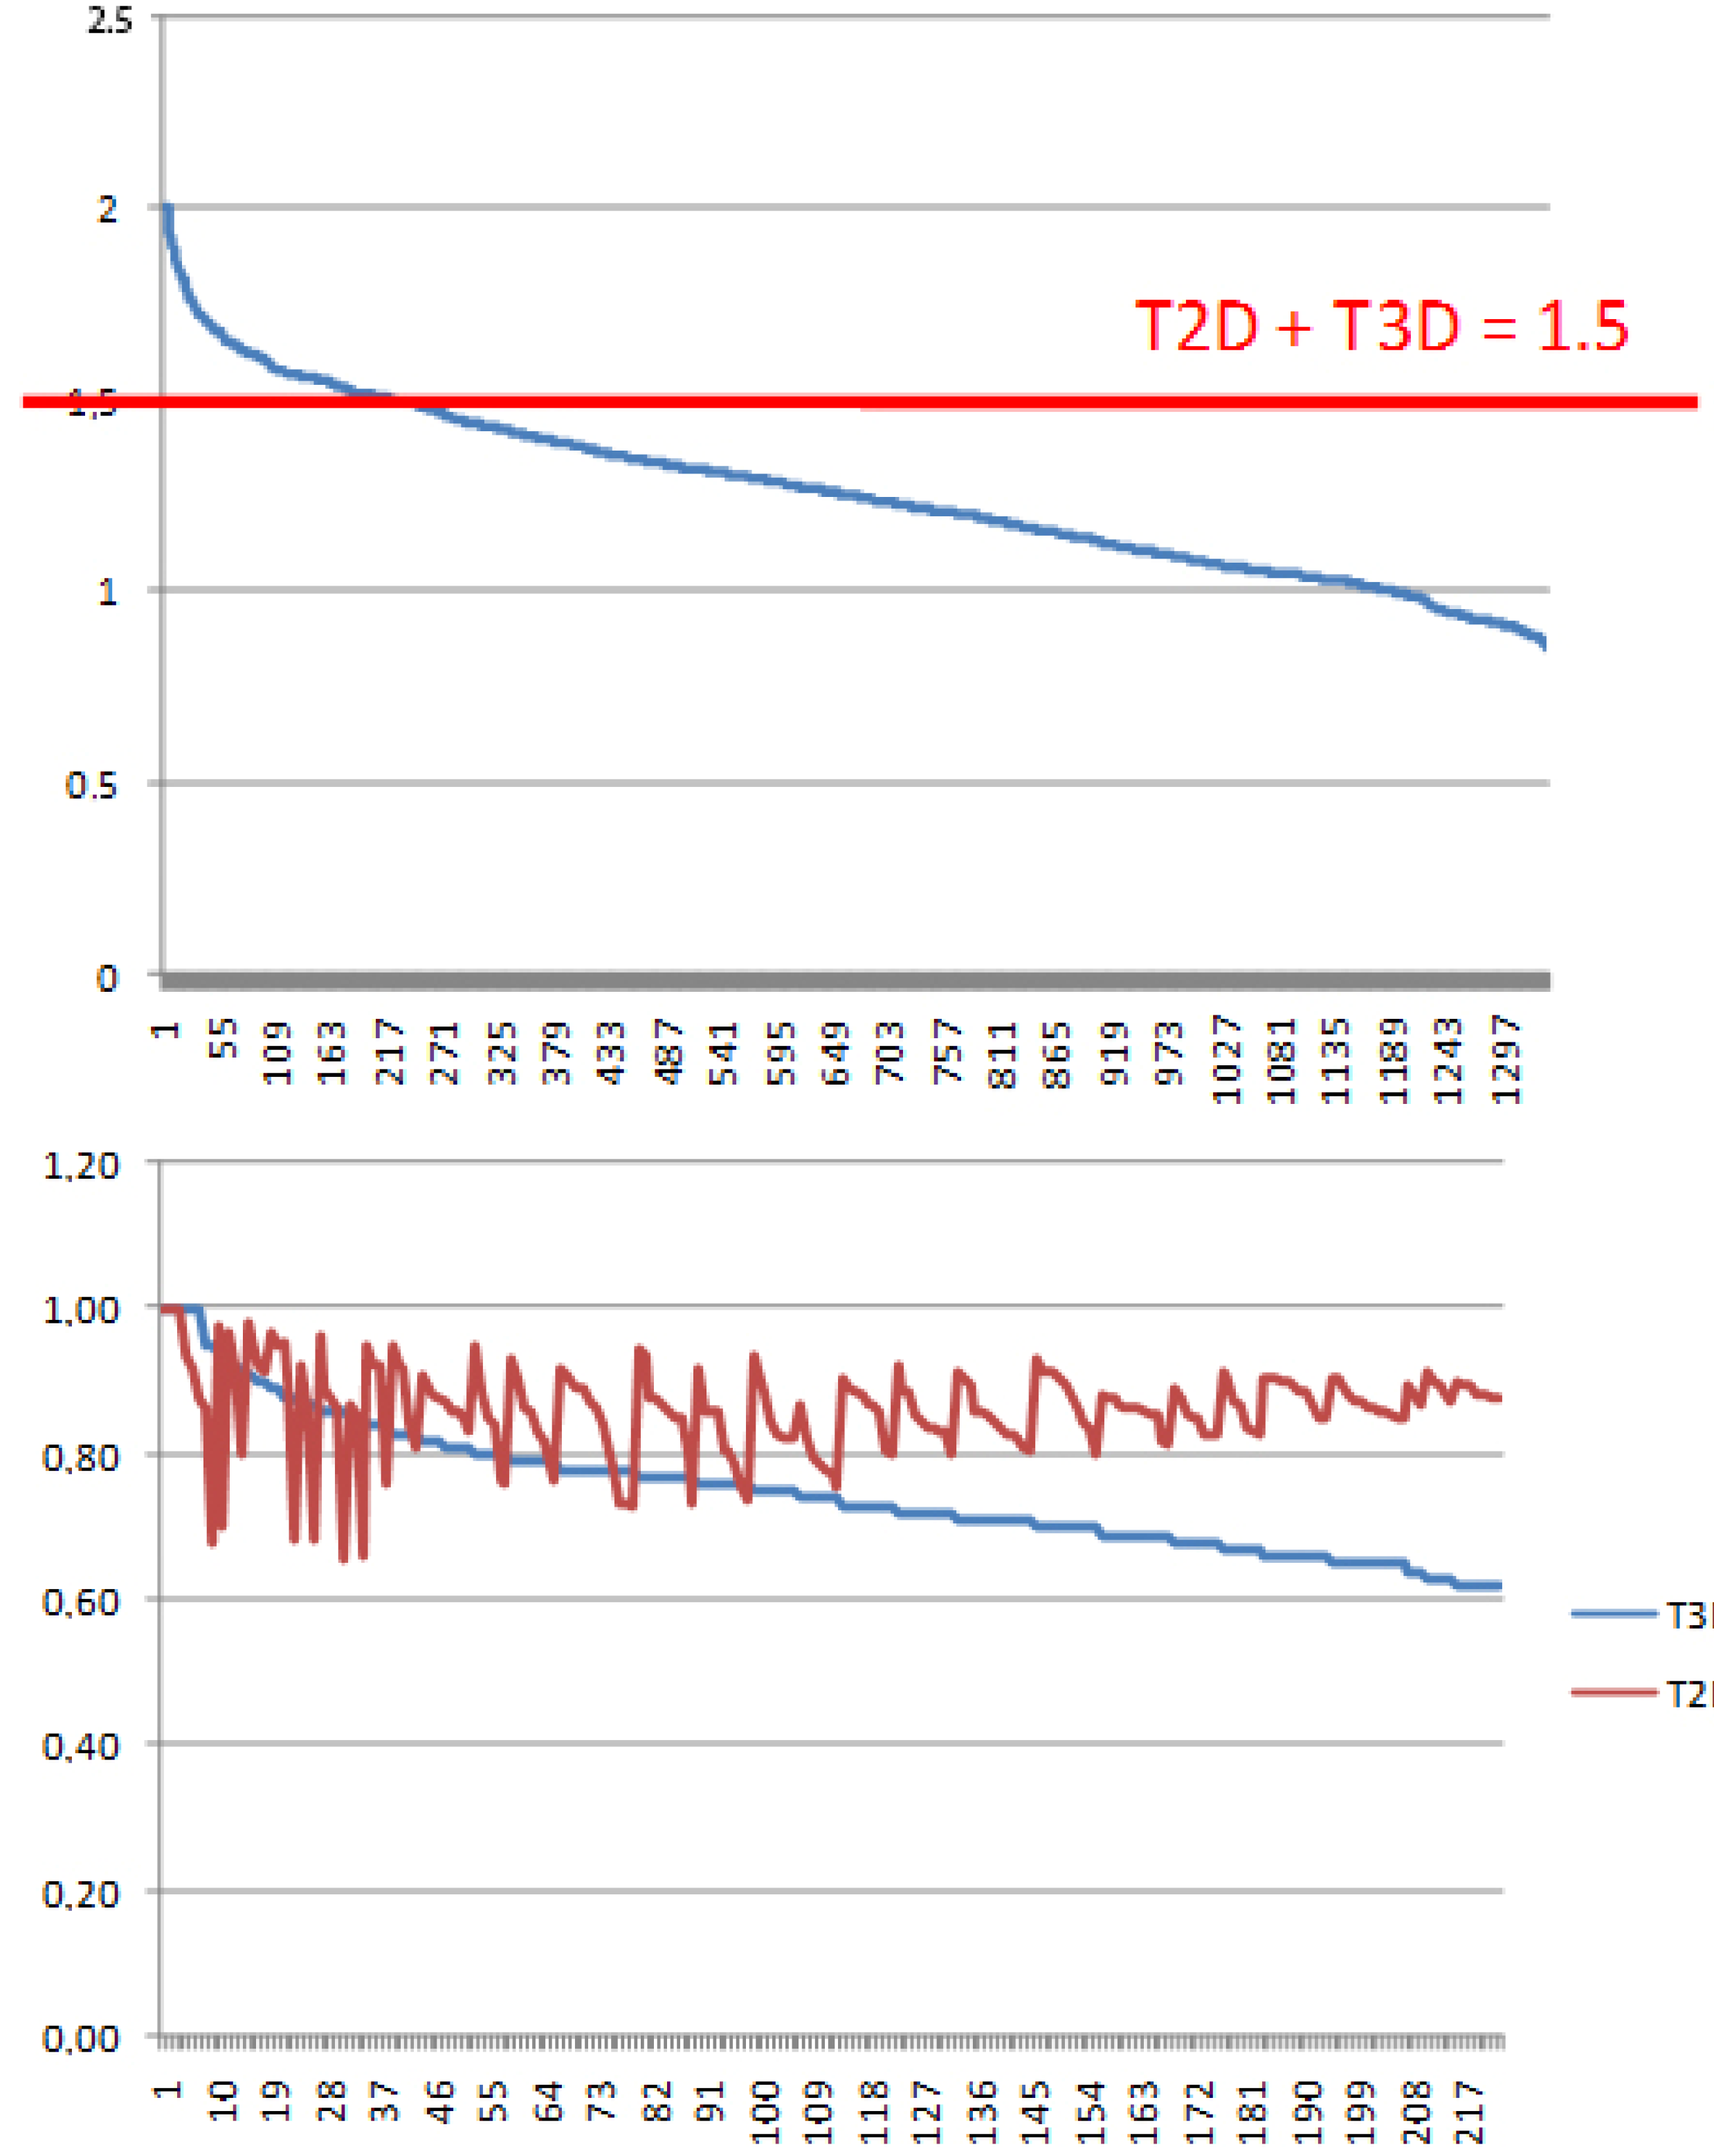
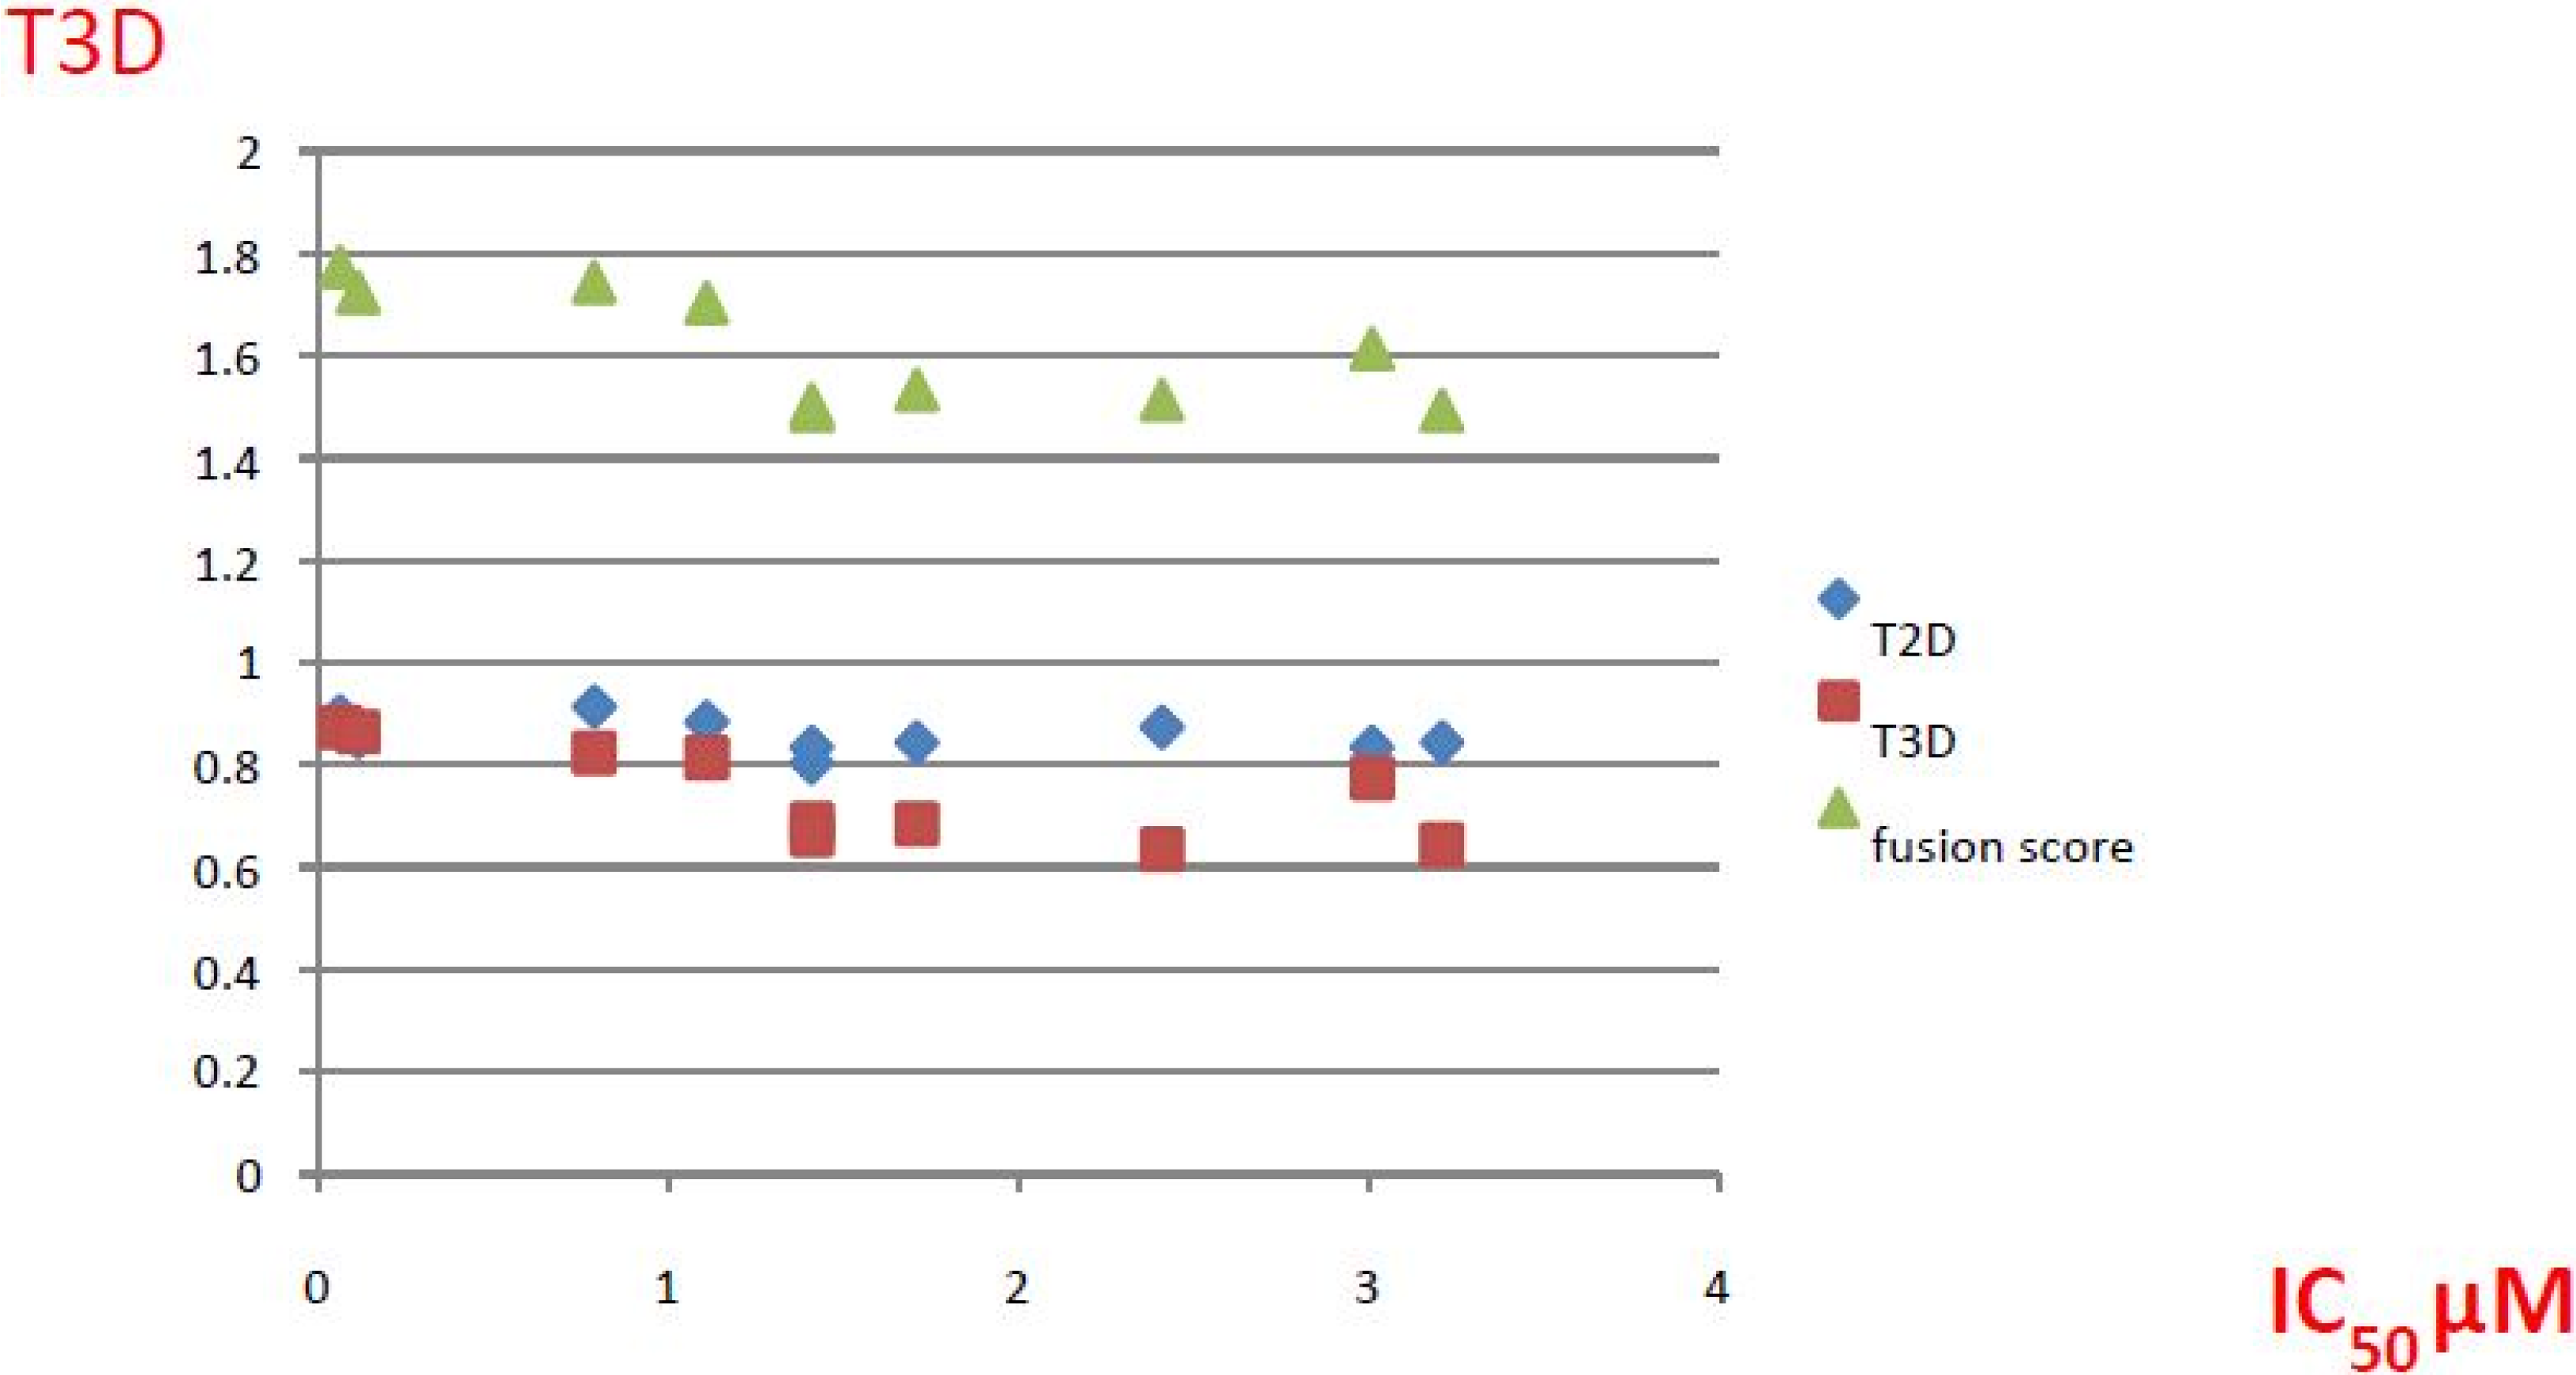
- Since T2D was ≥ 0.65 (cut-off value) at such relatively lower 2D similarity level only those compounds would be in the selection where the T3D similarity is high (>0.85). (Note: In the PDE5 study we found that the fusion score was between 1.22 and 1.7 in the 2nd round screening. Since in that case the T2D cut-off value was 0.8 low T3D values were also acceptable).
- (2)
- Inversely, in the case of higher T2D values (max. 0.96) compounds could be selected even in the case of lower T3D values (min. 0.54).
- (3)
- Our preference to equal weight of T2D and T3D scores can be explained by the objective of the hit validation, which requires relatively close (2D) analogues.
| ID | Structure | Analogues in the 1341 Set | Lowest T3D | Analogues in the 233 Set | Lowest T3D | Percentage in the 233 Set |
|---|---|---|---|---|---|---|
| 2 | | 155 | 0.24 | 30 | 0.69 | 19.35 |
| 3 | | 476 | 0.19 | 16 | 0.63 | 3.36 |
| 5 | | 27 | 0.33 | 9 | 1.00 | 33.33 |
| 4 | | 13 | 0.28 | 6 | 0.72 | 46.15 |
| 1 | | 273 | 0.30 | 116 | 0.62 | 42.49 |
| 6 | | 117 | 0.29 | 12 | 0.70 | 10.26 |
| 7 | | 280 | 0.28 | 44 | 0.64 | 15.71 |

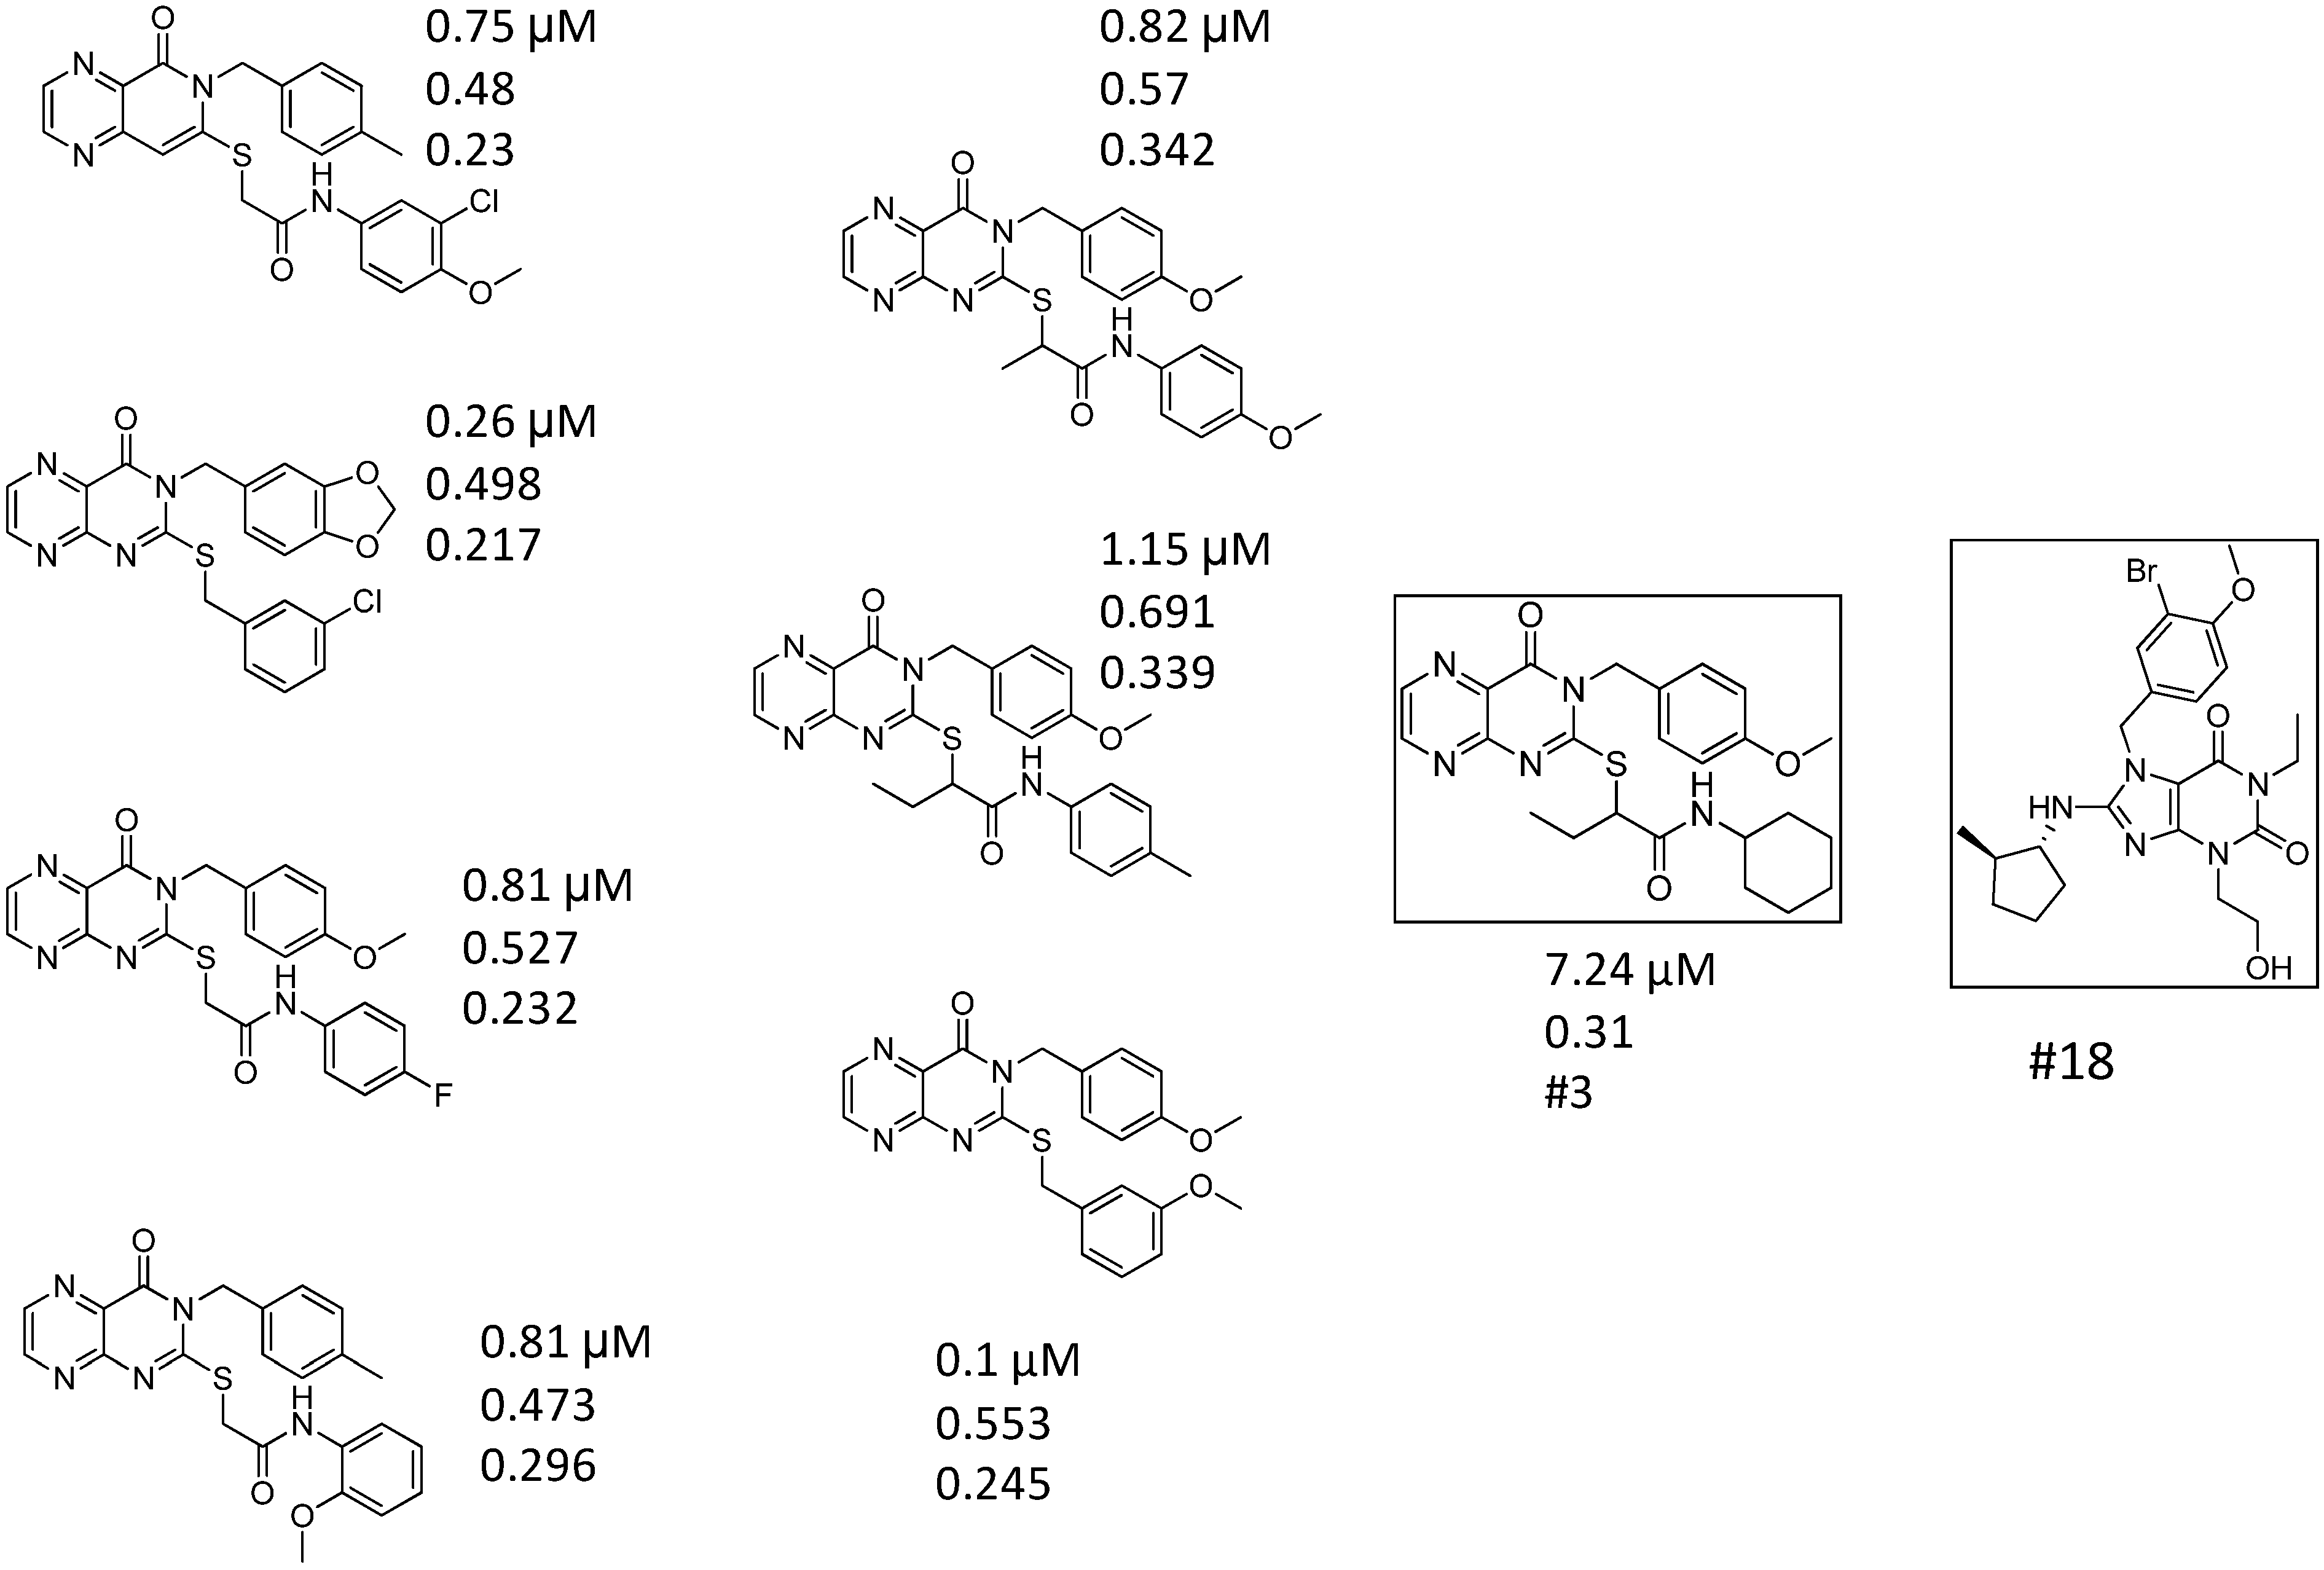
| ID | Structure | Inhibition at 10 µM (%) | IC50 (µM) | T2D | T3D | Fusion Score | T2D/T3D | First Round Hit_ID | First Round Hits | Chemo Type | ||||||||||||
|---|---|---|---|---|---|---|---|---|---|---|---|---|---|---|---|---|---|---|---|---|---|---|
| 3 |  | 83 | 0.053 | 0.9 | 0.88 | 1.78 | 1.02 | 2 | | A2 | ||||||||||||
| 5 |  | 94 | 0.105 | 0.86 | 0.87 | 1.73 | 0.99 | 2 | | A2 | ||||||||||||
| 4 |  | 90 | 0.779 | 0.92 | 0.83 | 1.75 | 1.1 | 2 | | A2 | ||||||||||||
| 6 |  | 88 | 1.1 | 0.89 | 0.82 | 1.71 | 1.09 | 2 | | A2 | ||||||||||||
| 8 |  | 86 | 1.4 | 0.81 | 0.69 | 1.50 | 1.18 | 2 | | A2 | ||||||||||||
| 7 |  | 89 | 3.0 | 0.84 | 0.78 | 1.62 | 1.08 | 2 | | A2 | ||||||||||||
| 1 |  | 51 | 1.7 | 0.85 | 0.69 | 1.54 | 1.24 | 1 | | B1 | ||||||||||||
| 2 |  | 61 | 1.4 | 0.84 | 0.67 | 1.51 | 1.25 | 1 | | B1 | ||||||||||||
| 9 |  | 62 | 3.2 | 0.85 | 0.65 | 1.5 | 1.31 | 1 | | B1 | ||||||||||||
| 10 |  | 62 | 2.4 | 0.88 | 0.64 | 1.52 | 1.38 | 7 | | A11 | ||||||||||||

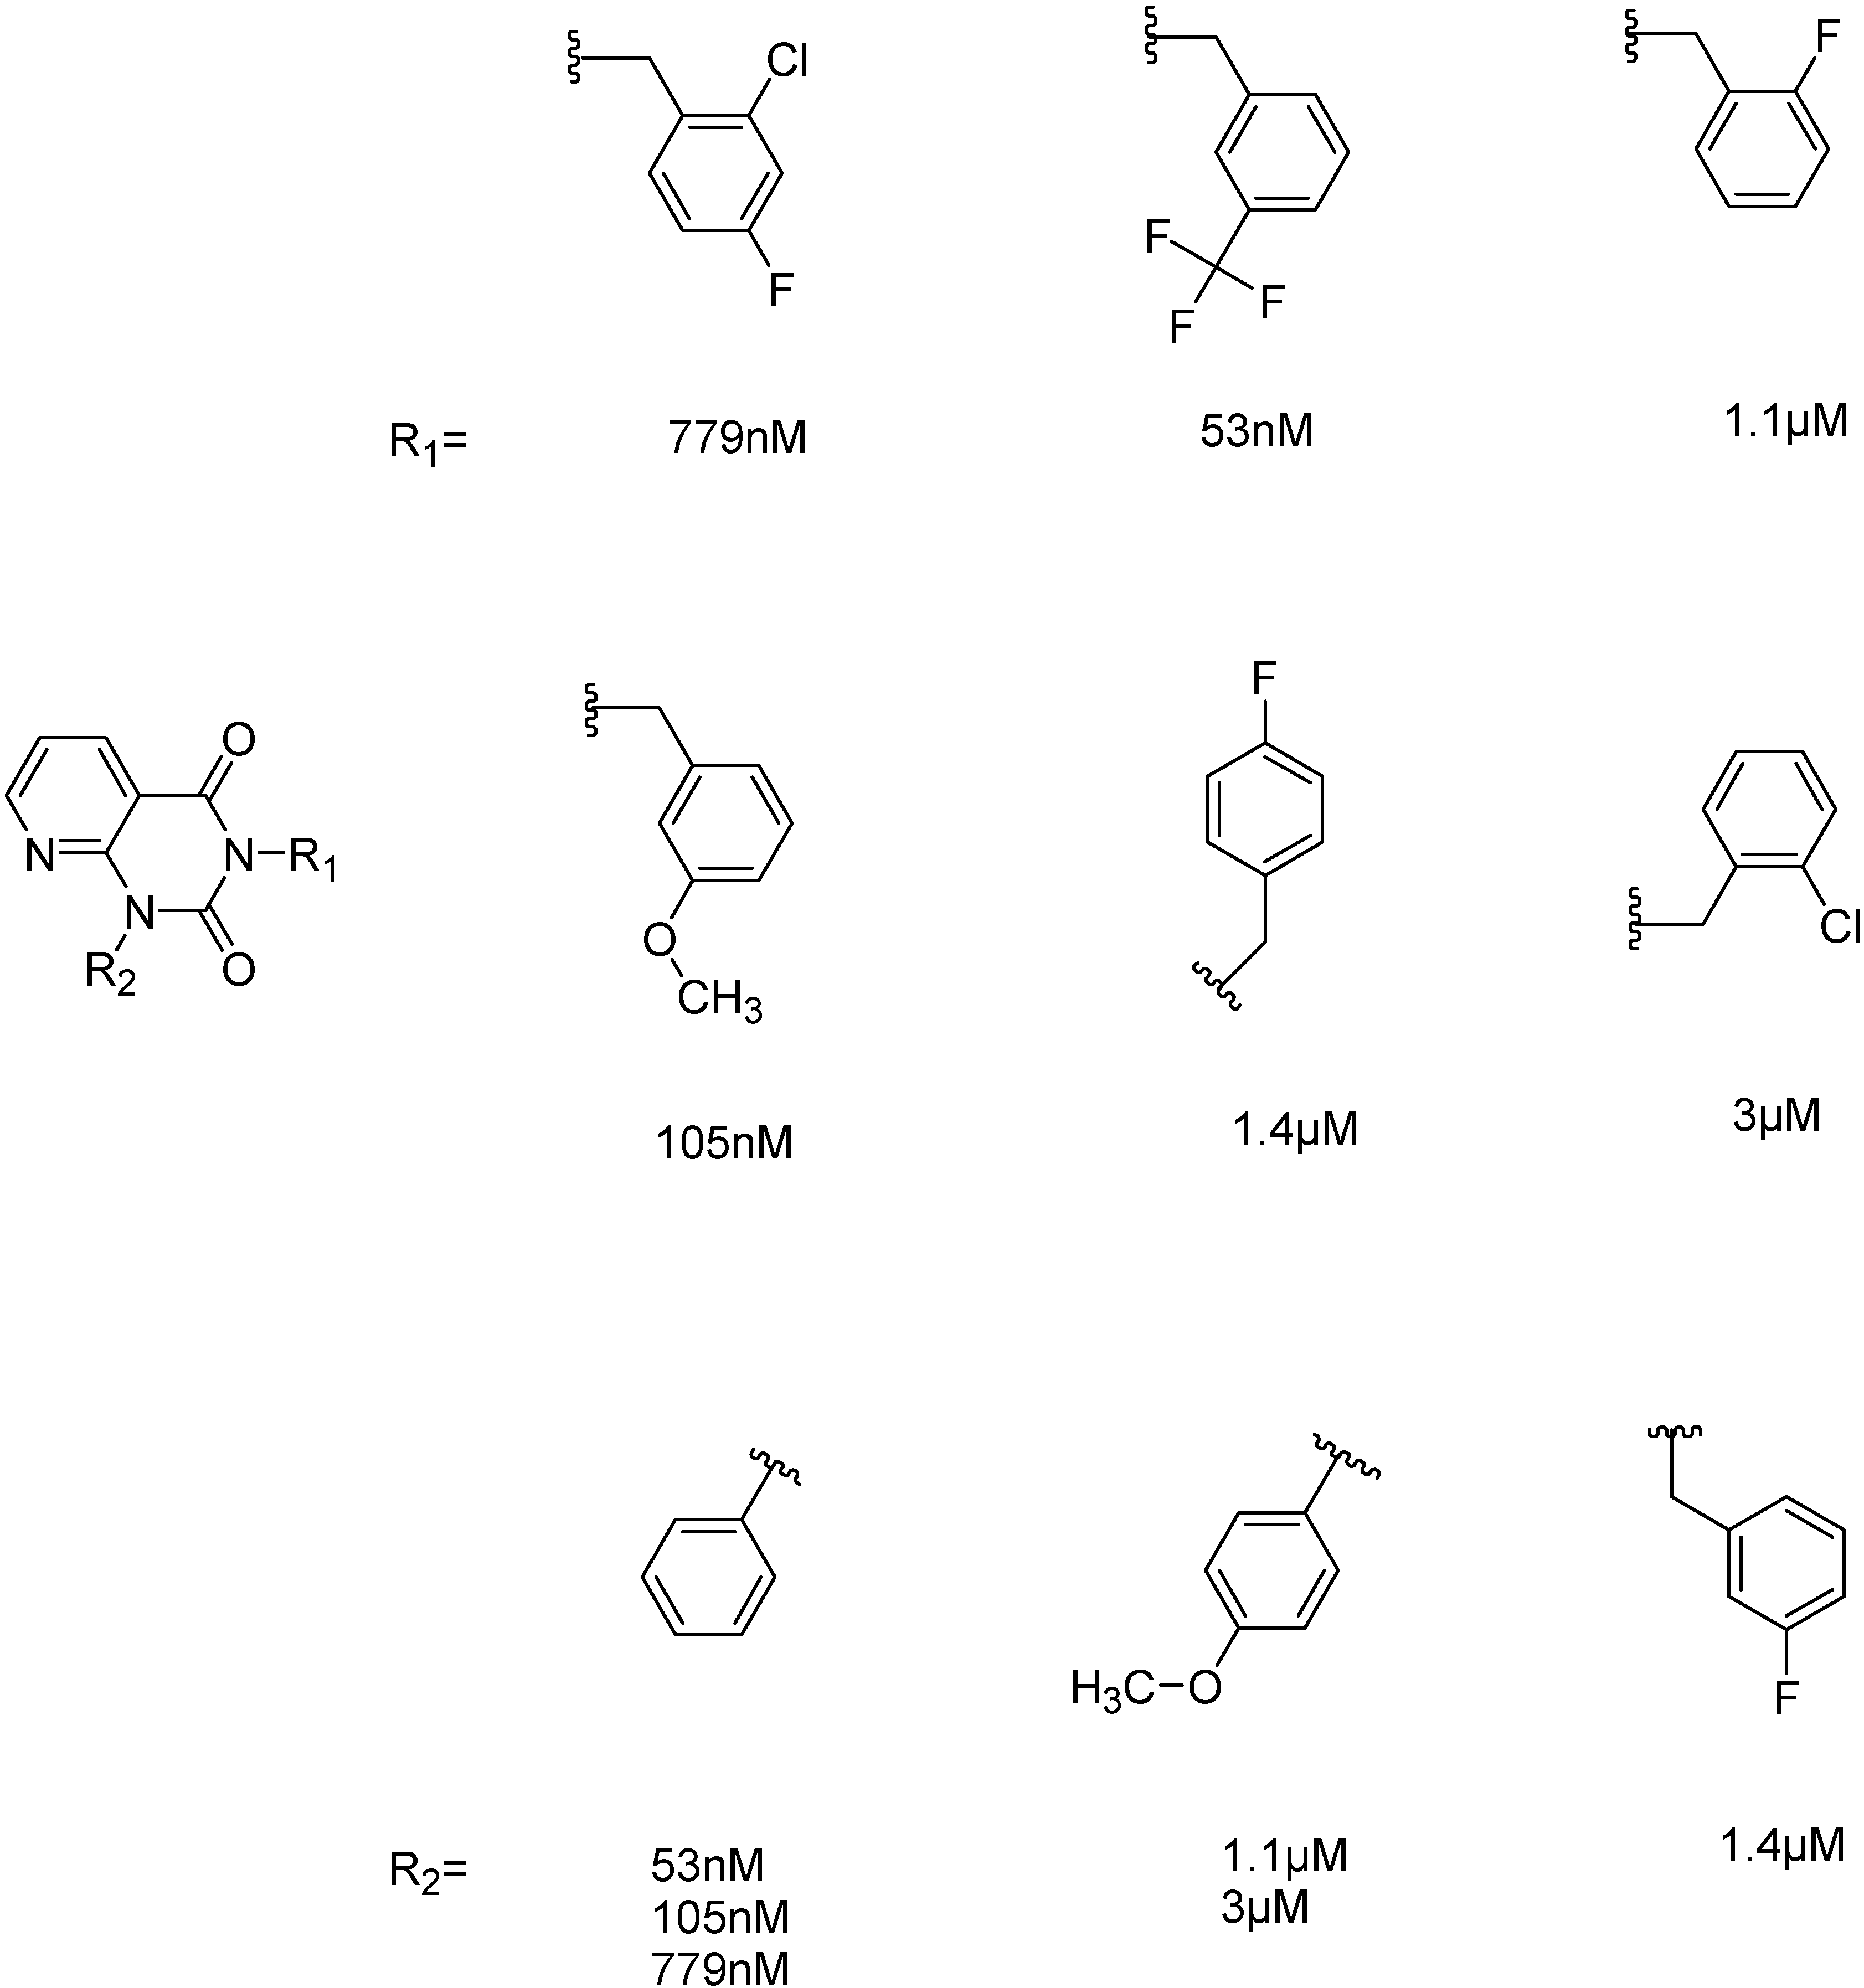
2.2.1. Structural Analysis of the Hits


2.2.2. PDE4B Selectivity
| ID | Structure | PDE4B | PDE4B | PDE4D | PDE5 | PDE2 | PDE3 | PDE7 | PDE8 | PDE9 | PDE10A | PDE11 | ||||||||||||||
|---|---|---|---|---|---|---|---|---|---|---|---|---|---|---|---|---|---|---|---|---|---|---|---|---|---|---|
| inh.% (10 µM) | IC50 (µM) | IC50 (µM) | IC50 (µM) | IC50 (µM) | IC50 (µM) | IC50 (µM) | IC50 (µM) | IC50 (µM) | IC50 (µM) | IC50 (µM) | ||||||||||||||||
| 3 |  | 83 | 0.053 | 35.1 | n.i. | n.i. | n.i. | n.i. | n.i. | n.i. | n.i. | n.i. | ||||||||||||||
| 5 |  | 94 | 0.105 | 1.12 | n.i. | n.i. | n.i. | n.i. | n.i. | n.i. | n.i. | n.i. | ||||||||||||||
| 4 |  | 90 | 0.779 | 7.8 | n.i. | n.i. | n.i. | n.i. | n.i. | n.i. | n.i. | n.i. | ||||||||||||||
| 6 |  | 88 | 1.1 | 10.7 | n.i. | n.i. | n.i. | n.i. | n.i. | n.i. | n.i. | n.i. | ||||||||||||||
| 8 |  | 86 | 1.4 | 7.5 | 5.8 | n.i. | n.i. | n.i. | n.i. | n.i. | n.i. | n.i. | ||||||||||||||
| 7 |  | 89 | 3.0 | 8 | 60 | n.i. | n.i. | n.i. | n.i. | n.i. | n.i. | n.i. | ||||||||||||||
| 2 |  | 61 | 1.4 | 24 | n.i. | n.i. | n.i. | n.i. | n.i. | n.i. | 40.8 | n.i. | ||||||||||||||
| 1 |  | 51 | 1.7 | 41 | 11.7 | n.i. | n.i. | n.i. | n.i. | n.i. | 2.4 | 40 | ||||||||||||||
| 9 |  | 62 | 3.2 | n.i. | 12.5 | n.i. | n.i. | n.i. | n.i. | n.i. | 0.6 | n.i. | ||||||||||||||
| 11 |  | 62 | 4.7 | 350 | n.i. | n.i. | n.i. | n.i. | n.i. | n.i. | 8.5 | n.i. | ||||||||||||||
| 10 |  | 62 | 2.4 | 13.5 | 32.8 | n.i. | n.i. | n.i. | n.i. | n.i. | n.i. | n.i. | ||||||||||||||
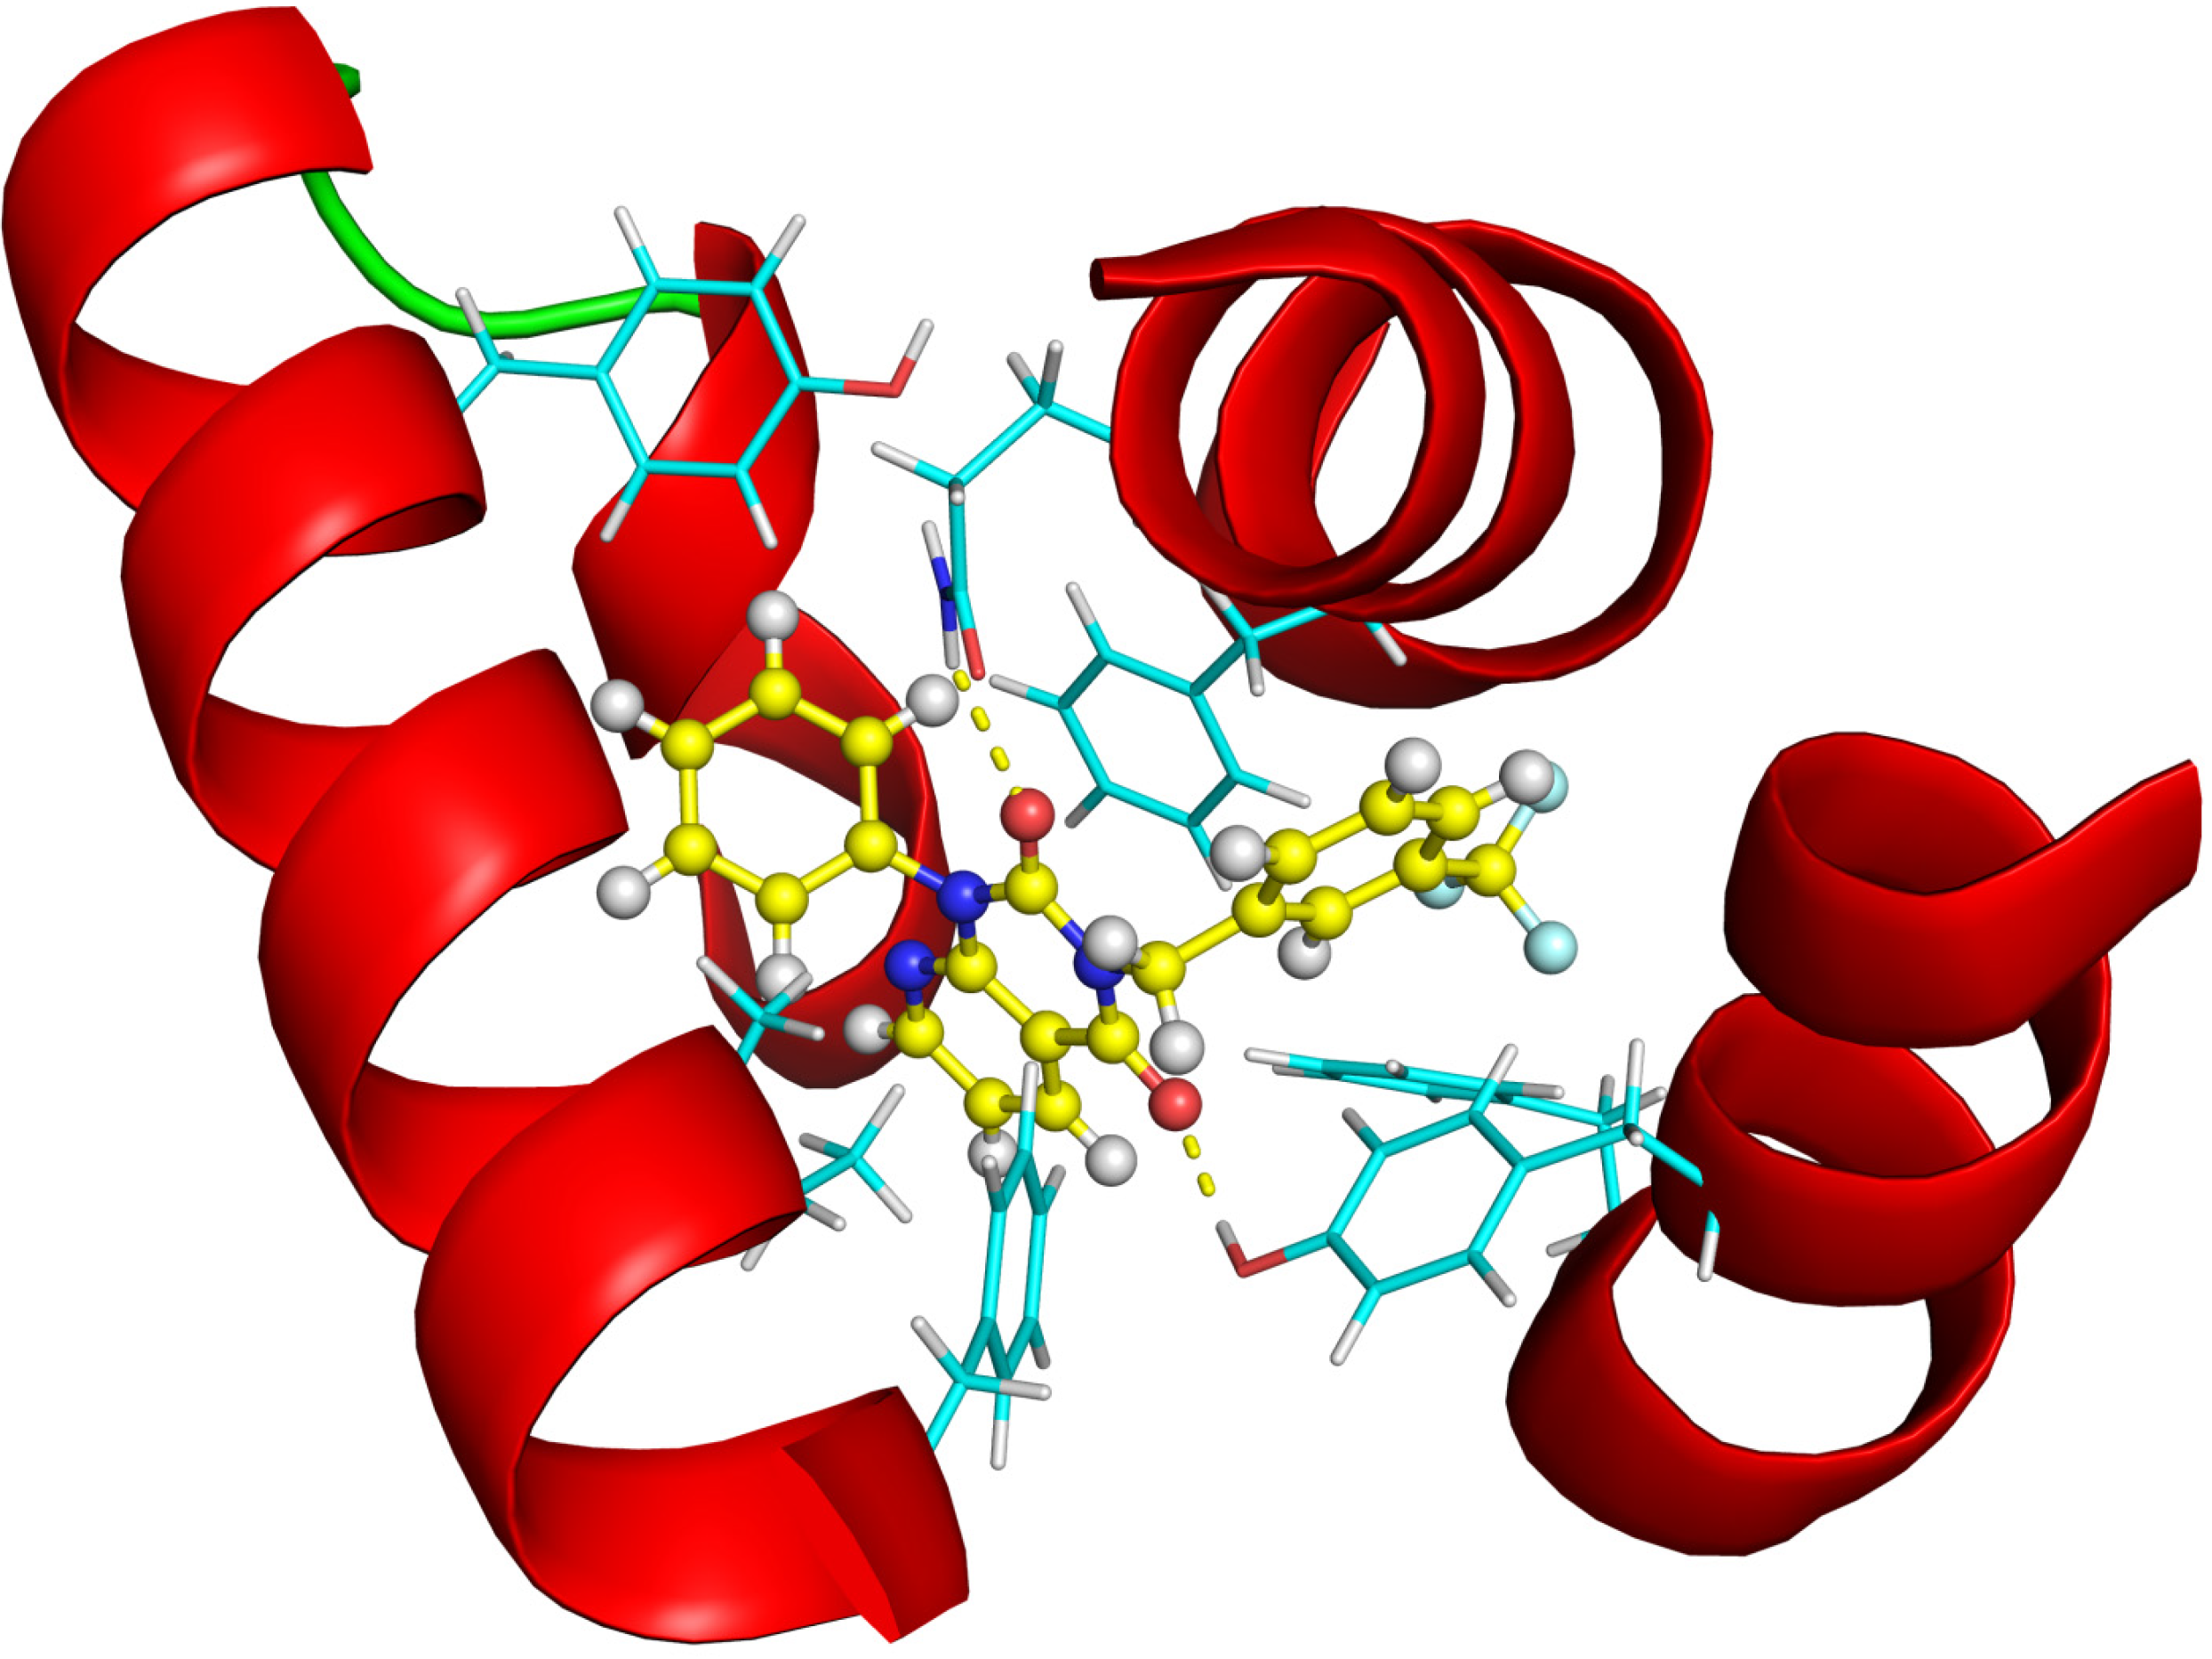
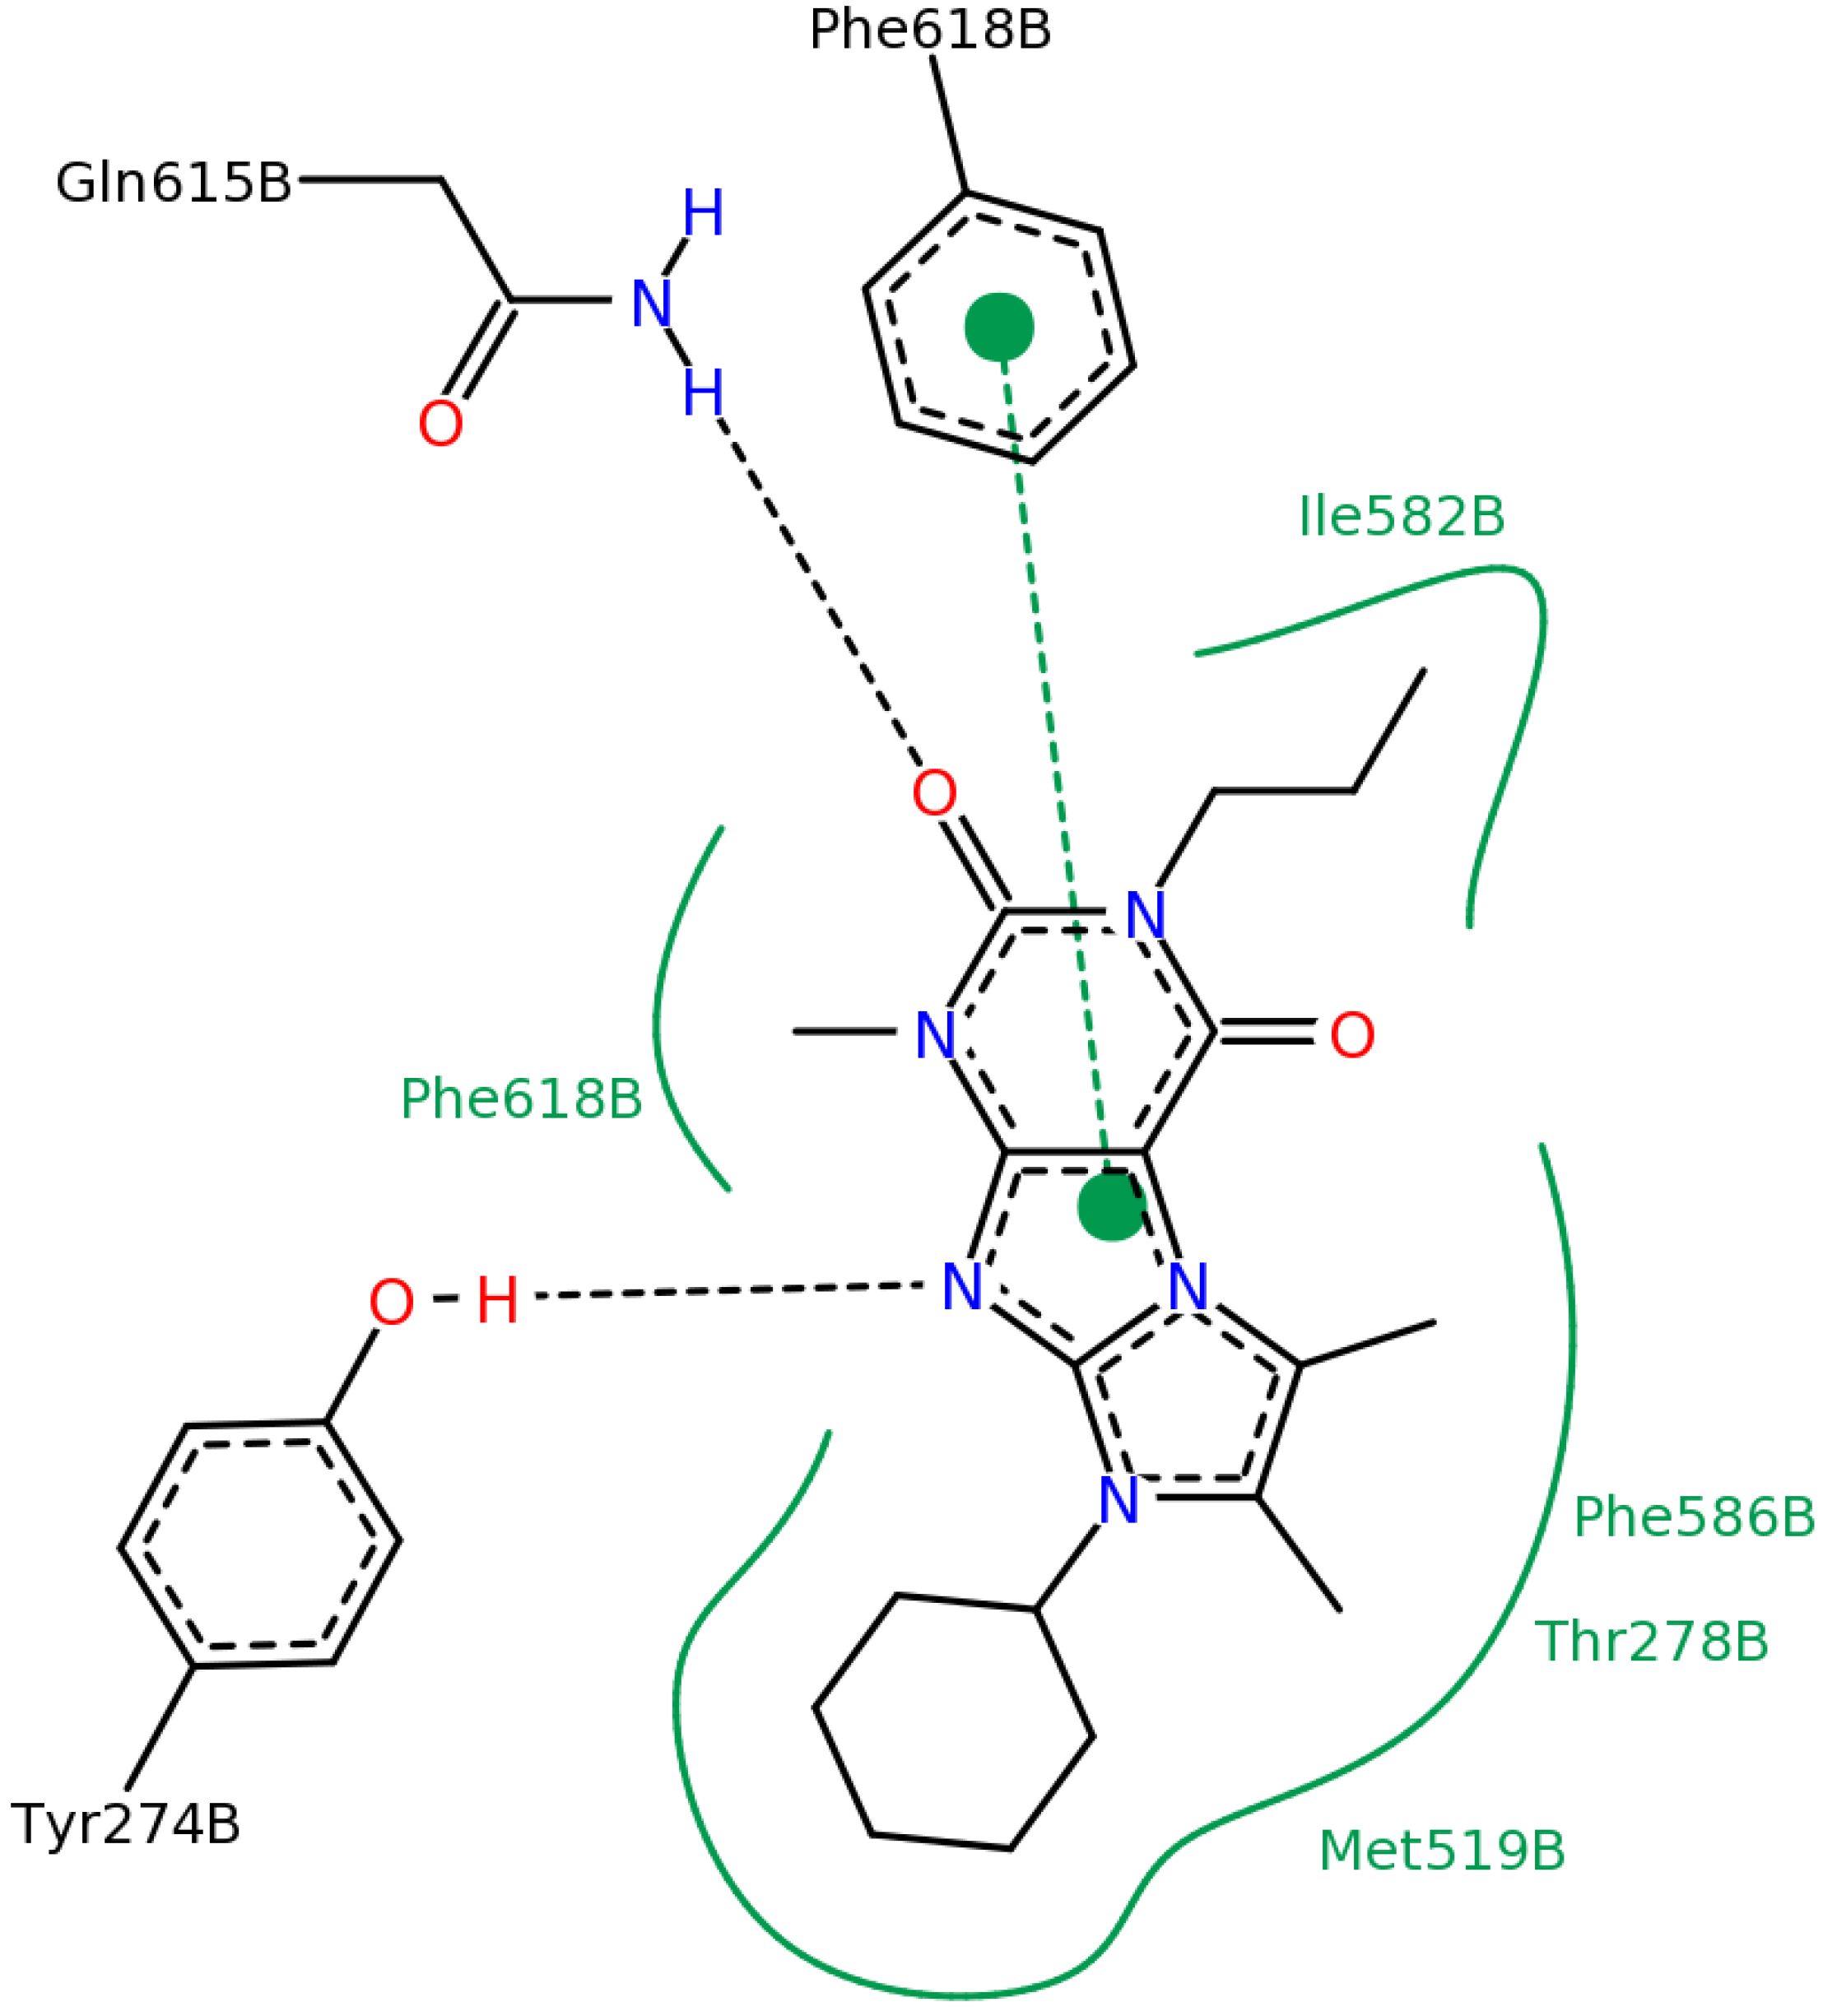
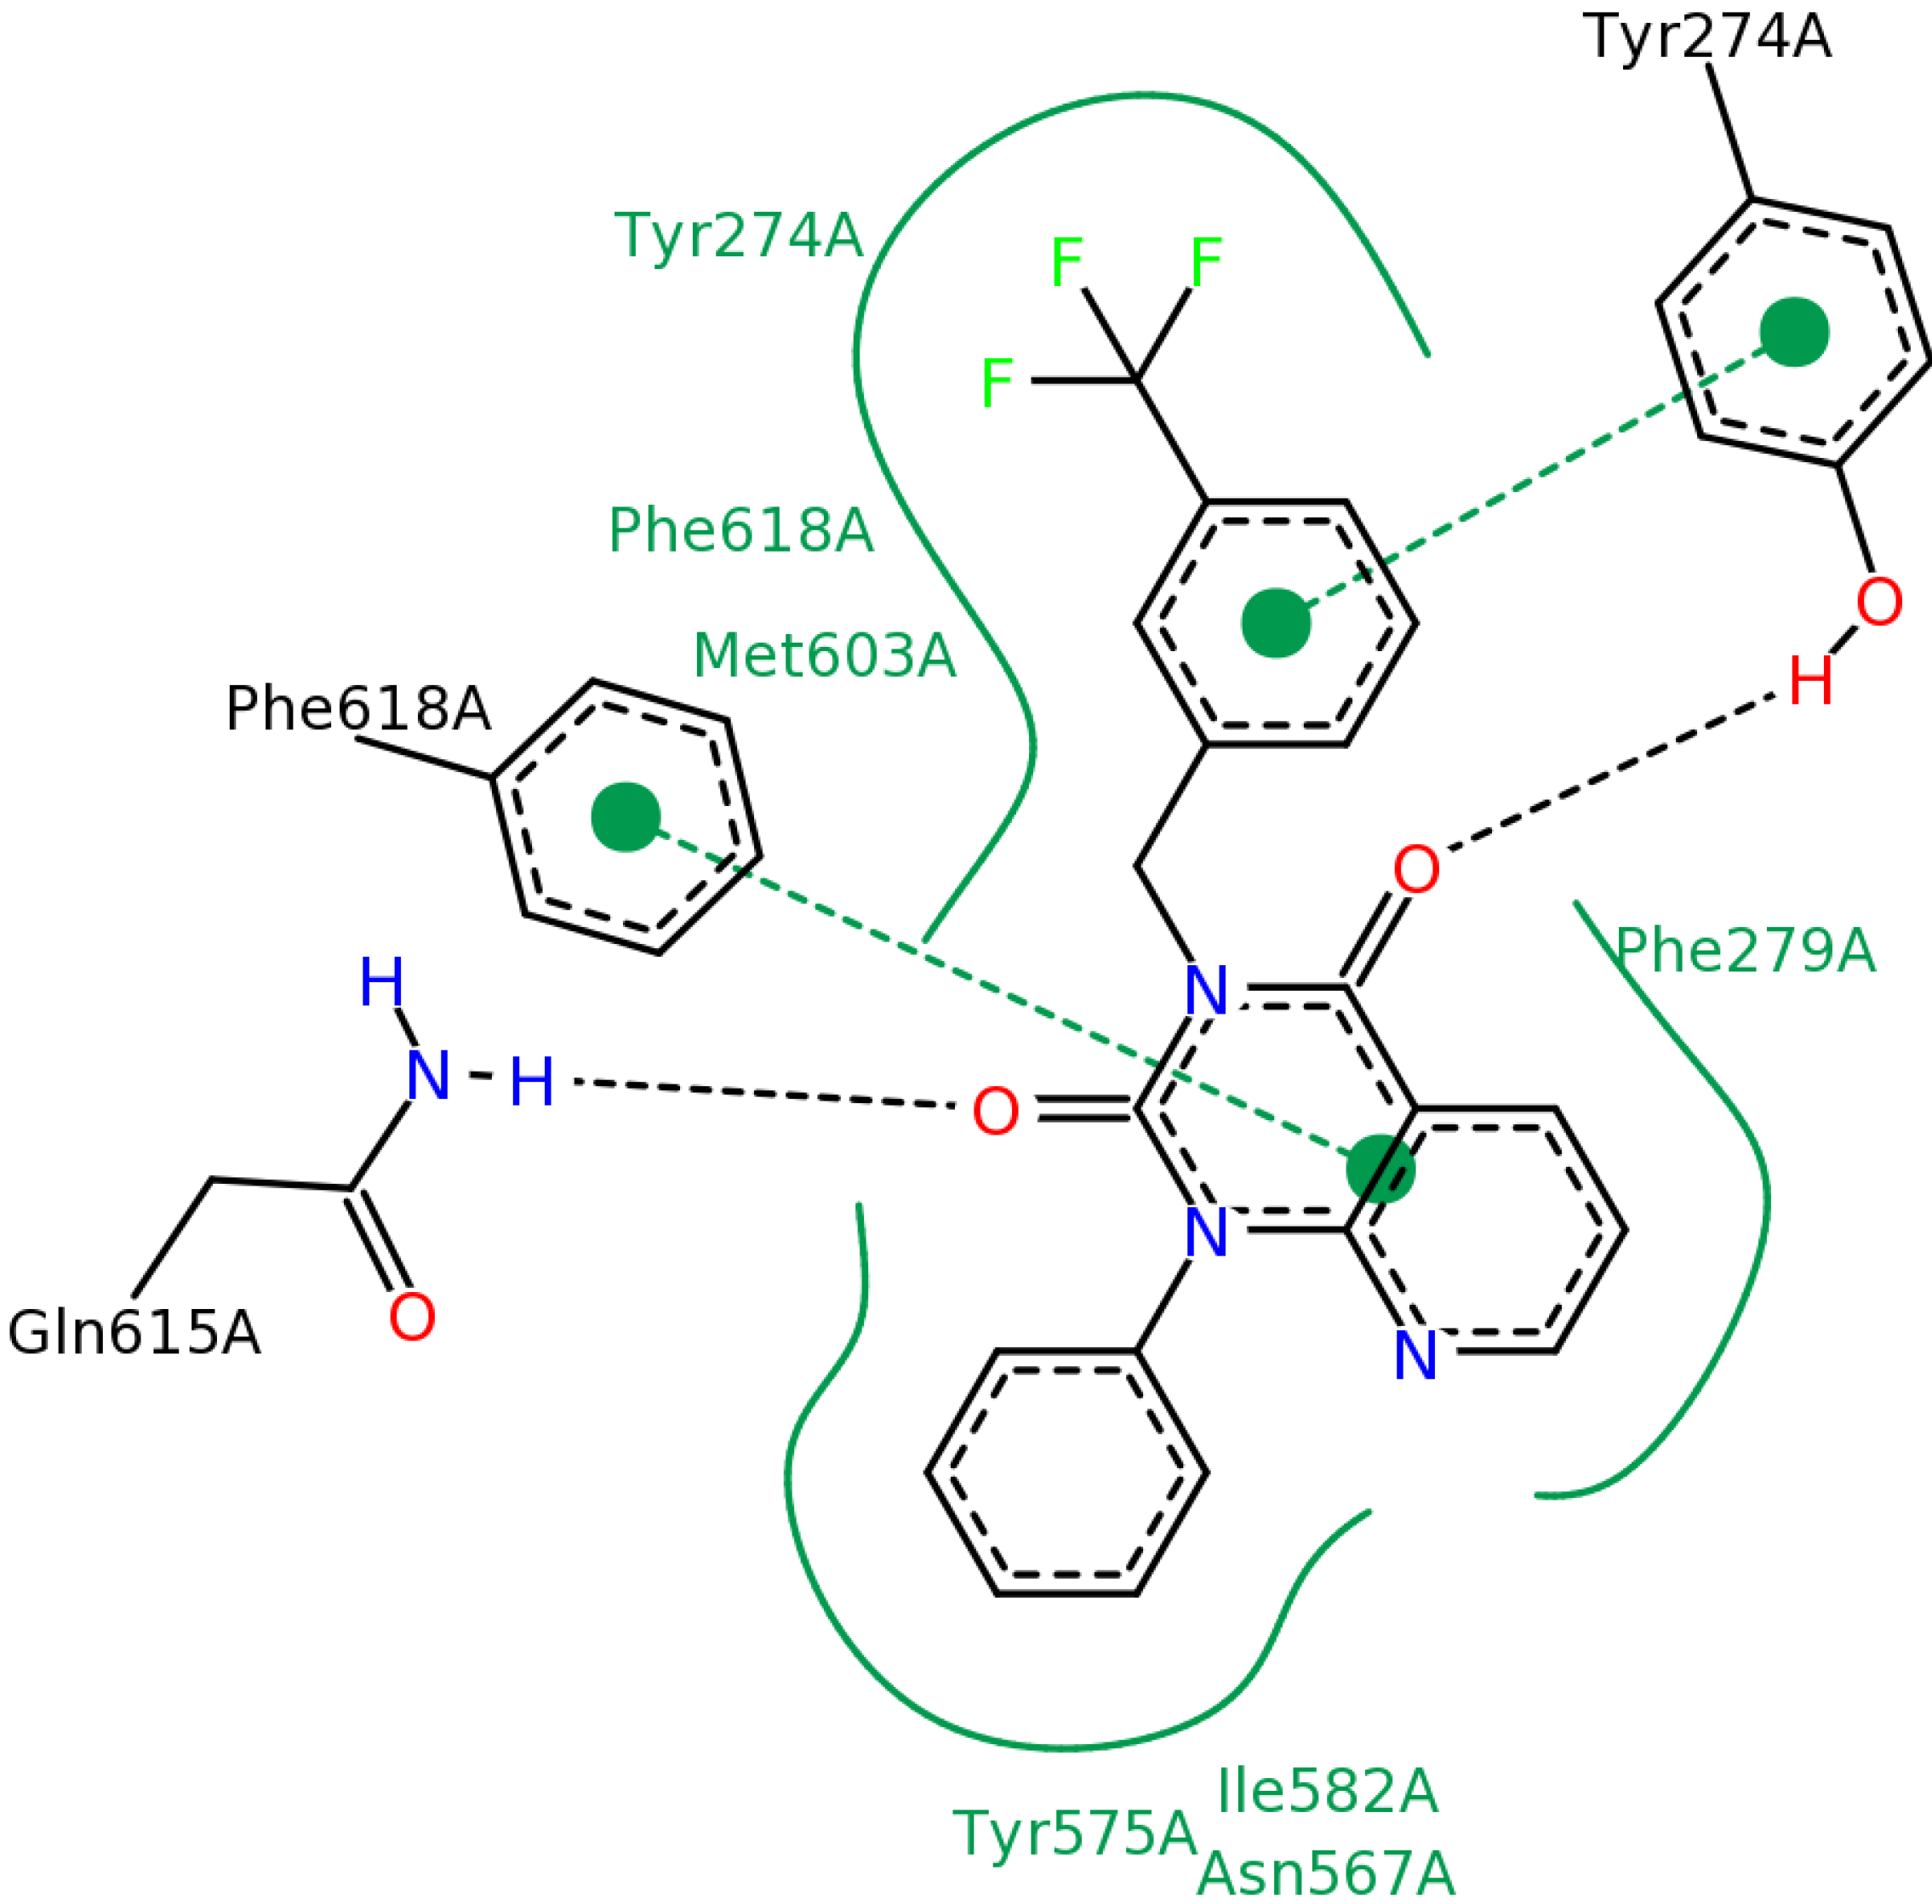
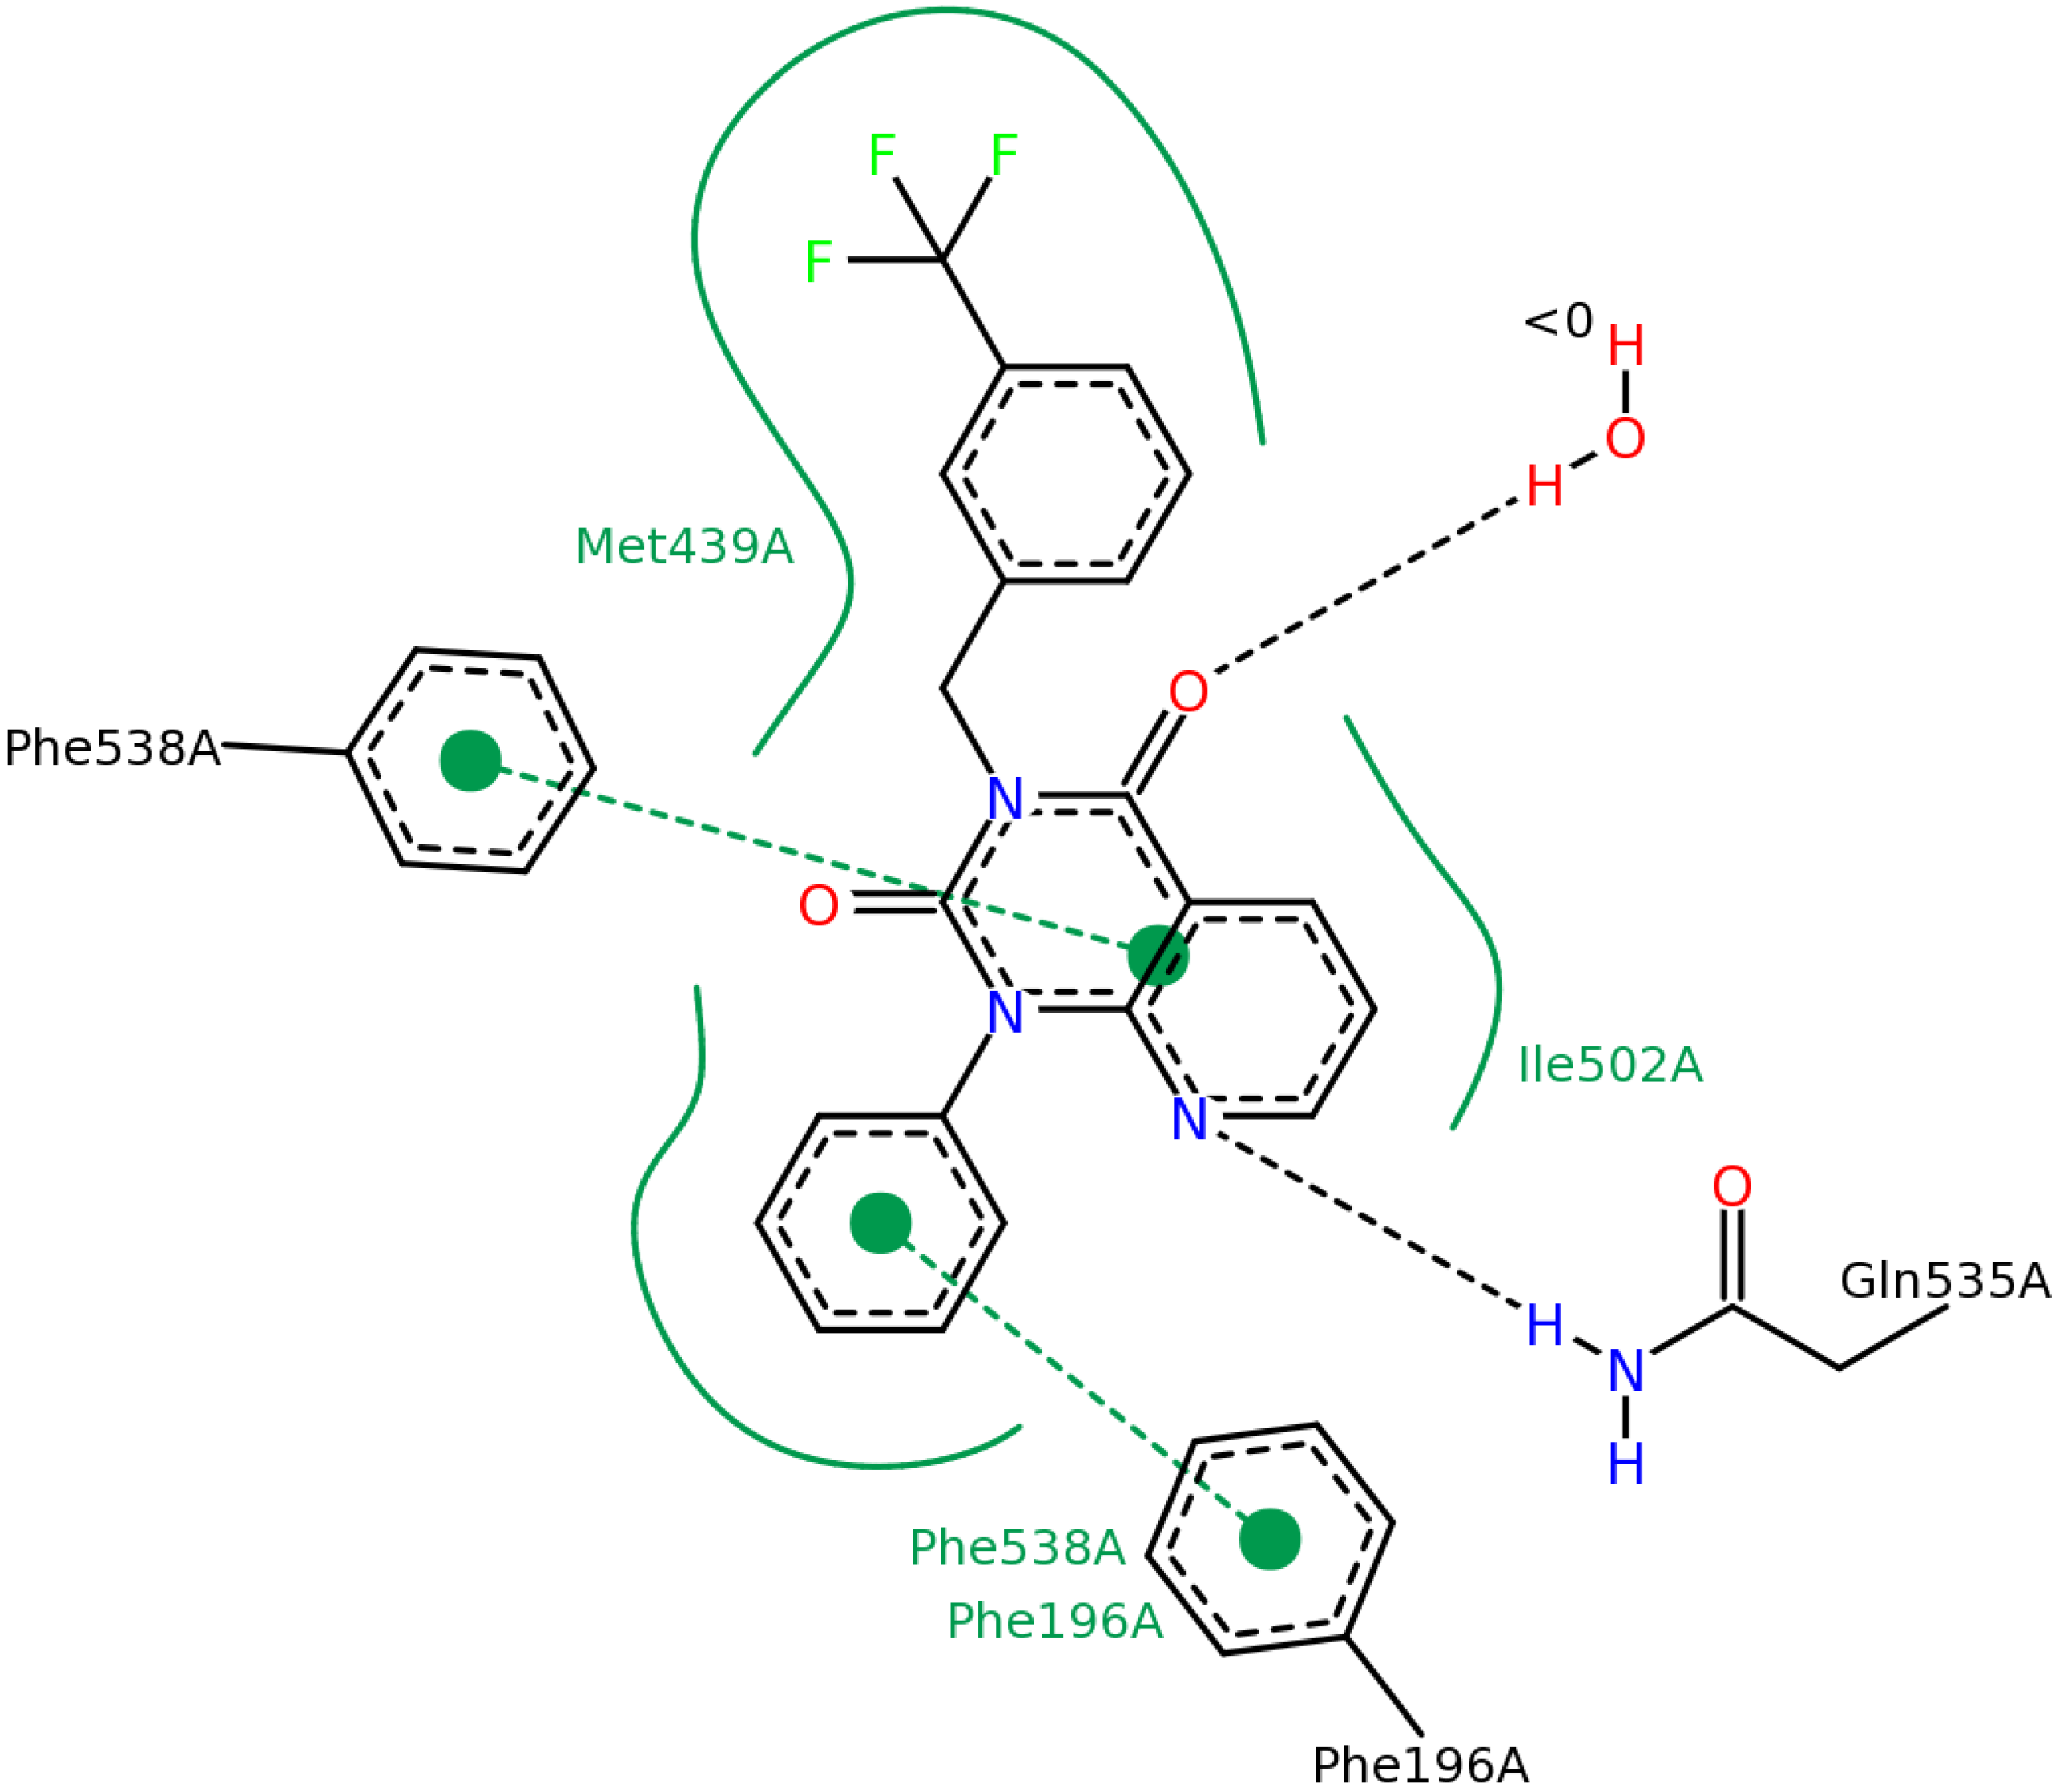
2.2.3. Structural Analysis of the Hit Compounds


| ΔGbind (kcal/mol) | #3 in the 2nd round | #11 in the 2nd round |
|---|---|---|
| PDE4B (3G45) | −113.367 | −86.648 |
| PDE4D (3G4G) | −103.014 | −85.913 |
| PDE5A (2H42) | −68.768 | −67.397 |
| PDE10A (3HR1) | −69.916 | −92.082 |
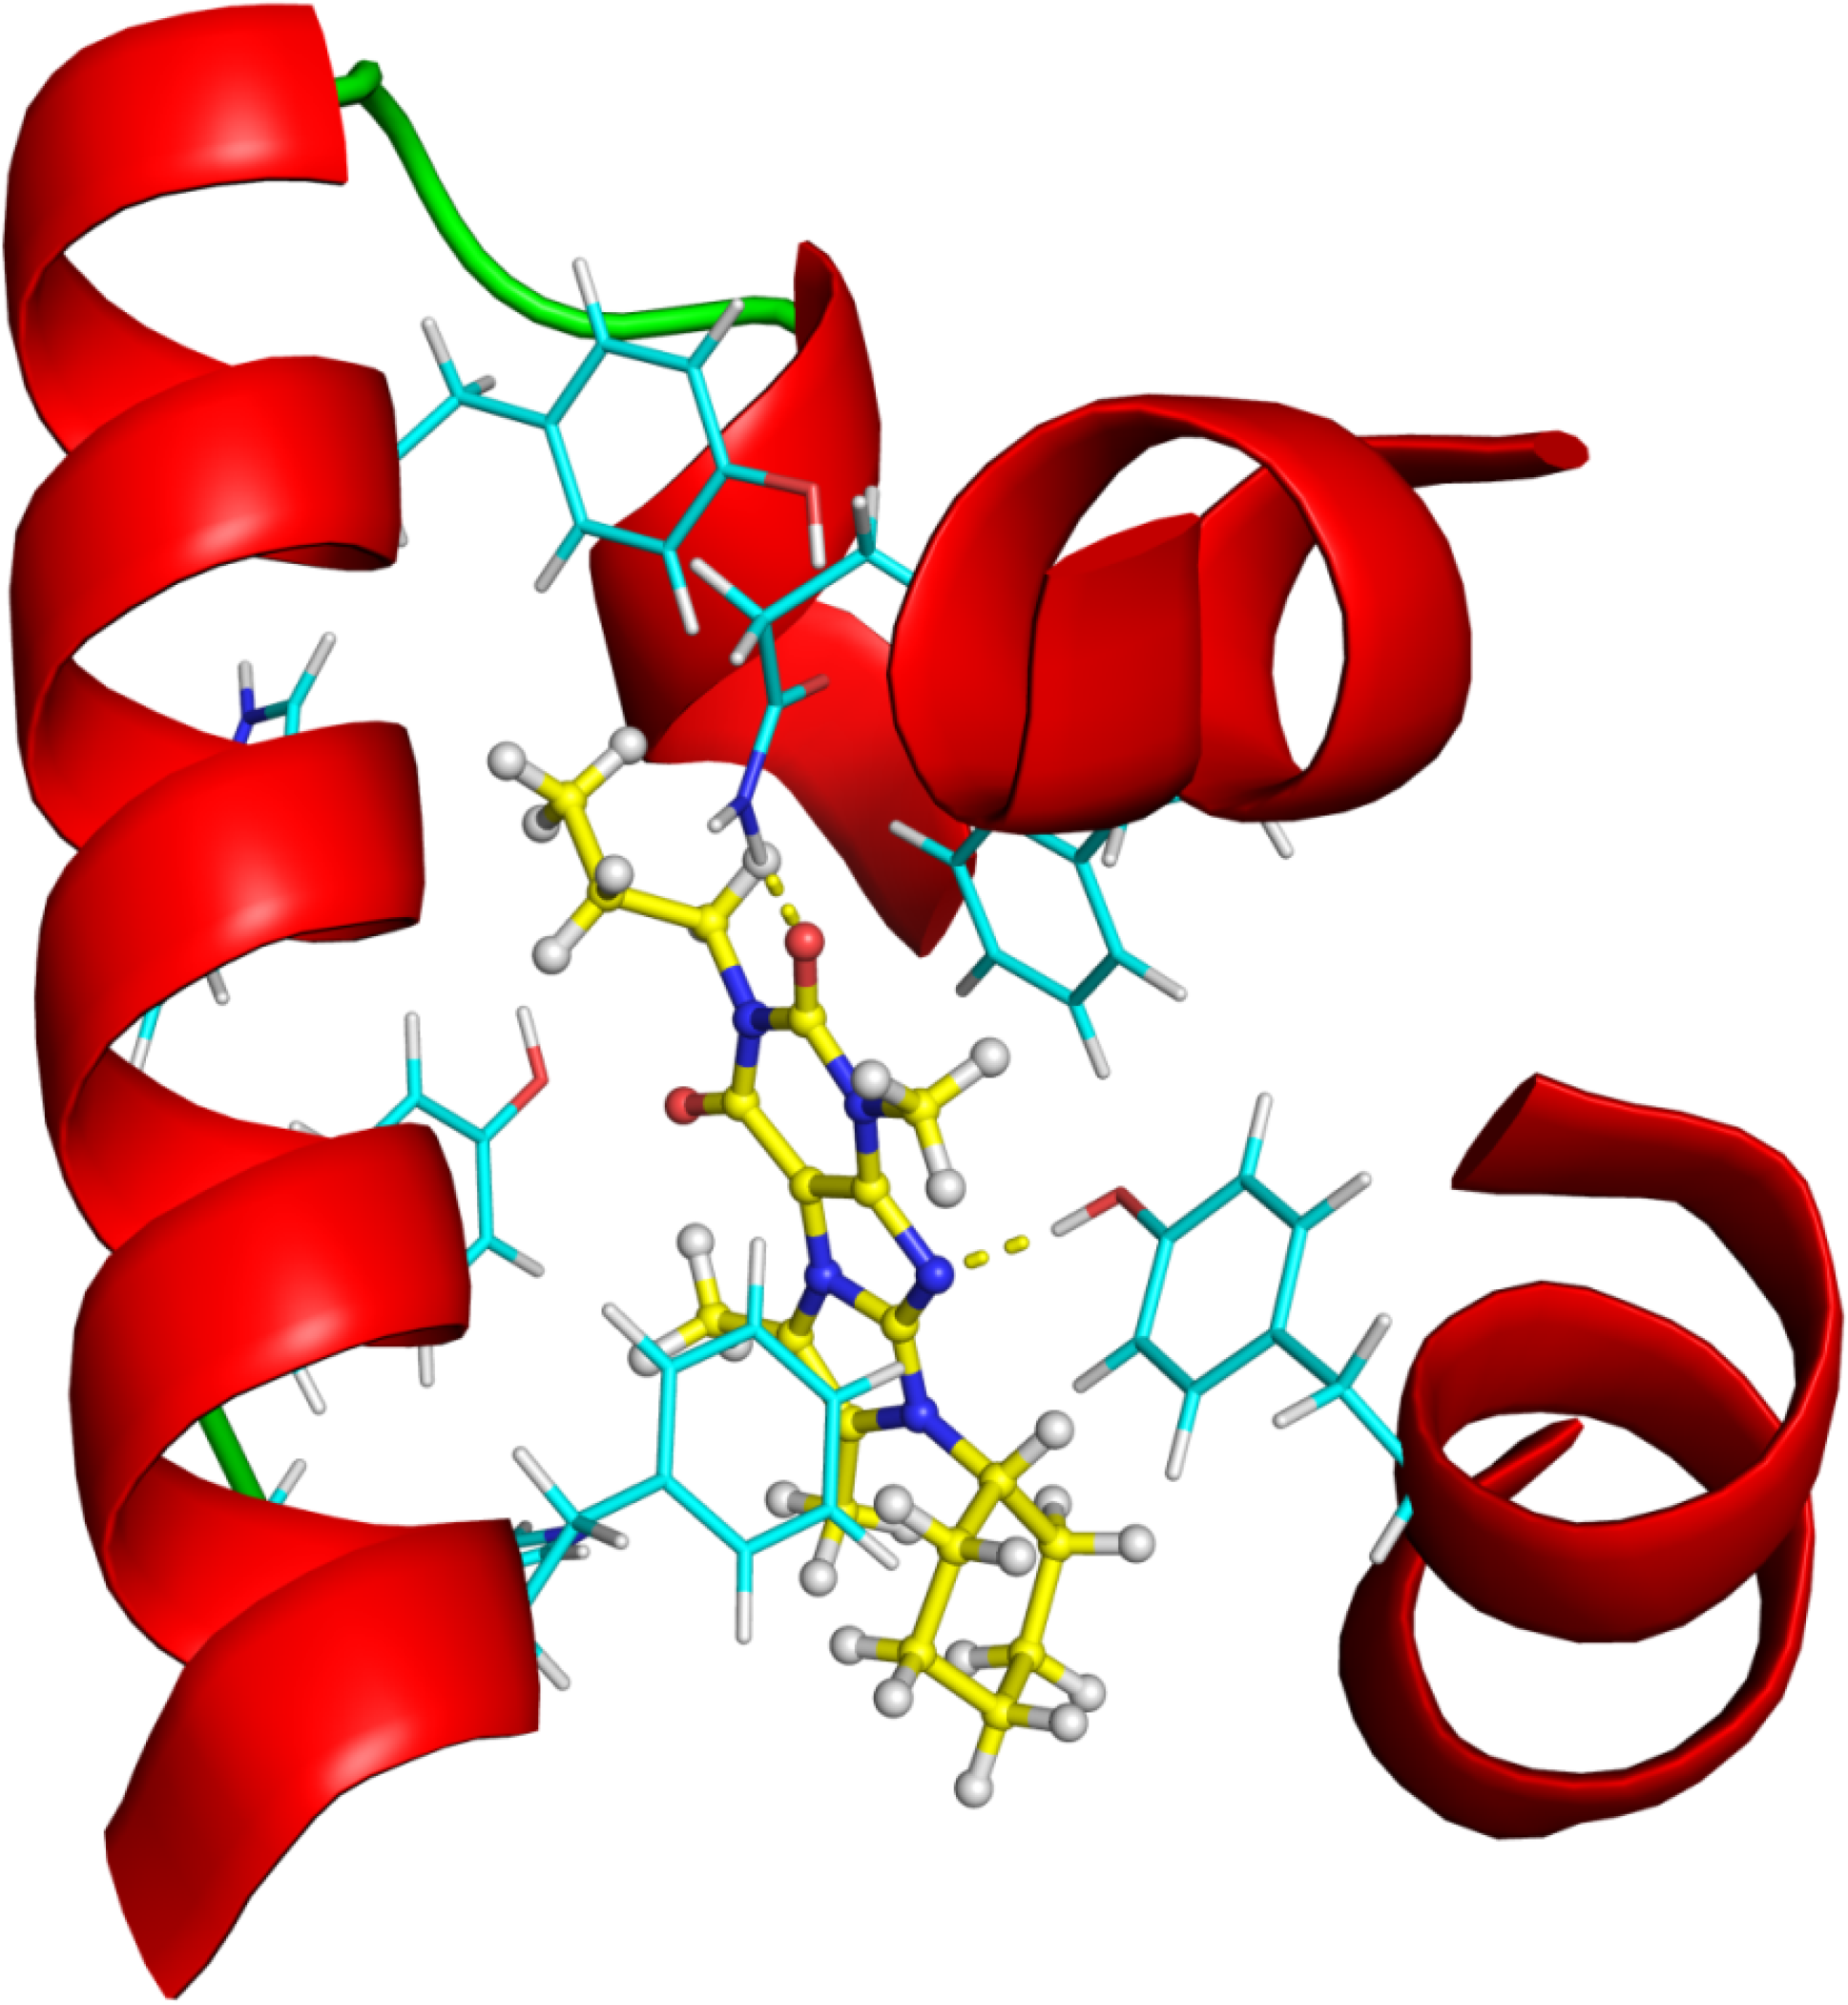
2.2.4. Investigation of Structure- Activity Relationships by 3D Modeling

| ID | Structure | PDE4B | PDE4B | pIC50 | ΔGbind (kcal/mol) |
|---|---|---|---|---|---|
| inh.% (10 µM) | IC50 (µM) | ||||
| 3 | | 83 | 0.053 | 7.2757 | −113.367 |
| 5 | | 94 | 0.105 | 6.9788 | −100.861 |
| 4 | | 90 | 0.779 | 6.1085 | −111.562 |
| 6 | | 88 | 1.1 | 5.9586 | −84.814 |
| 8 | | 86 | 1.4 | 5.8539 | −80.407 |
| 7 |  | 89 | 3 | 5.5229 | −89.880 |
3. Experimental
3.1. Computational Methods
3.1.1. 2D Similarity Search
3.1.2. Calculation of the Physico-chemical Parameters and Property-based Filtering
3.1.3. 3D Ligand-Based Similarity Search for Ranking and Filtering of Focused Libraries
3.1.4. Diversity Selection
3.1.5. 3D Visualization
3.1.6. Ligand Docking
3.2. Assay Development and Biological Screening
3.2.1. PDE5A1
3.2.2. PDE4B2
4. Conclusions
Supplementary Materials
Acknowledgments
Author Contributions
Conflicts of Interest
References
- Irwin, J.J.; Sterling, T.; Mysinger, M.M.; Bolstad, E.S.; Coleman, R.G. ZINC: A free tool to discover chemistry for biology. J. Chem. Inf. Model. 2012, 52, 1757–1768. [Google Scholar] [CrossRef]
- The PubChem Project. Available online: http://pubchem.ncbi.nlm.nih.gov/ (accessed on 10 May 2009).
- CheEMBL-European Bioinformatics Institute. Available online: https://www.ebi.ac.uk/chembl/ (accessed on 22 September 2012).
- Binding DB—The Binding Database. Available online: http://www.bindingdb.org/ (accessed on 16 July 2010).
- Pharmaprojects Citeline. Available online: http://www.citeline.com/products/pharmaprojects/ (accessed on 21 January 2010).
- Thomson Reuters Integrity. Available online: http://thomsonreuters.com/integrity/ (accessed on 16 June 2009).
- Polgár, T.; Keseru, G.M. Integration of virtual and high throughput screening in lead discovery settings. Comb. Chem. High Throughput Screen. 2011, 14, 889–897. [Google Scholar]
- Decornez, H.; Gulyás-Forró, A.; Papp, A.; Szabó, M.; Sármay, G.; Hajdú, I.; Cseh, S.; Dormán, G.; Kitchen, D.B. Design, selection, and evaluation of a general kinase-focused library. ChemMedChem 2009, 4, 1273–1278. [Google Scholar] [CrossRef]
- Stahura, F.L.; Bajorath, J. Virtual screening methods that complement HTS. Comb. Chem. High Throughput Screen. 2004, 7, 259–269. [Google Scholar] [CrossRef]
- Heikamp, K.; Bajorath, J. The future of virtual compound screening. Chem. Biol. Drug Des. 2013, 81, 33–40. [Google Scholar] [CrossRef]
- Ma, X.H.; Zhu, F.; Liu, X.; Shi, Z.; Zhang, J.X.; Yang, S.Y.; Wei, Y.Q.; Chen, Y.Z. Virtual screening methods as tools for drug lead discovery from large chemical libraries. Curr. Med. Chem. 2012, 19, 5562–5571. [Google Scholar] [CrossRef]
- Johnson, M.; Maggiora, G. Concepts and Applications of Molecular Similarity; Wiley-Interscience: New York, NY, USA, 1990. [Google Scholar]
- Willett, P. Similarity-based virtual screening using 2D fingerprints. Drug Discov. Today 2006, 11, 1046–1053. [Google Scholar] [CrossRef]
- Tovar, A.; Eckert, H.; Bajorath, J. Comparison of 2D fingerprint methods for multiple-template similarity searching on compound activity classes of increasing structural diversity. ChemMedChem 2007, 2, 208–217. [Google Scholar] [CrossRef]
- Willett, P.; Winterman, V. A Comparison of Some Measures for the Determination of Inter-Molecular Structural Similarity Measures of Inter-Molecular Structural Similarity. Quant. Struct. Act. Relationsh. 1986, 5, 18–25. [Google Scholar] [CrossRef]
- Cavasotto, C.; Singh, N. Docking and High-Throughput Docking: Successes and the challenge of protein flexibility. Curr. Comp. Aided Drug Des. 2008, 4, 221–234. [Google Scholar] [CrossRef]
- Kokh, D.B.; Wenzel, W. Flexible side chain models improve enrichment rates in in silico screening. J. Med. Chem. 2008, 51, 5919–5931. [Google Scholar] [CrossRef]
- Francis, S.H.; Conti, M.; Houslay, M.D. Phosphodiesterases as Drug Targets. In Handbook of Experimental Pharmacology; Springer: Springer-Verlay Berlin Heiselberg, Germany, 2011; Volume 204. [Google Scholar]
- Tömöri, T.; Hajdú, I.; Barna, L.; Lorincz, Z.; Cseh, S.; Dormán, G. Combining 2D and 3D in silico methods for rapid selection of potential PDE5 inhibitors from multimillion compounds’ repositories: Biological evaluation. Mol. Divers. 2012, 16, 59–72. [Google Scholar] [CrossRef]
- Xue, L.; Stahura, F.L.; Godden, J.W.; Bajorath, J. Fingerprint scaling increases the probability of identifying molecules with similar activity in virtual screening calculations. J. Chem. Inf. Comput. Sci. 2001, 41, 746–753. [Google Scholar] [CrossRef]
- Nam, G.; Yoon, C.M.; Kim, E.; Rhee, C.K.; Kim, J.H.; Shin, J.H.; Kim, S.H. Syntheses and evaluation of pyrido[2,3-dlpyrimidine-2,4-diones as PDE 4 inhibitors. Bioorg. Med. Chem. Lett. 2001, 11, 611–614. [Google Scholar] [CrossRef]
- Drabczyńska, A.; Yuzlenko, O.; Köse, M.; Paskaleva, M.; Schiedel, A.C.; Karolak-Wojciechowska, J.; Handzlik, J.; Karcz, T.; Kuder, K.; Müller, C.E.; et al. Synthesis and biological activity of tricyclic cycloalkylimidazo-, pyrimido- and diazepinopurinediones. Eur. J. Med. Chem. 2011, 46, 3590–3607. [Google Scholar] [CrossRef]
- Srivani, P.; Usharani, D.; Jemmis, E.D.; Sastry, G.N. Subtype selectivity in phosphodiesterase 4 (PDE4): A bottleneck in rational drug design. Curr. Pharm. Des. 2008, 14, 3854–3872. [Google Scholar] [CrossRef]
- Small-Molecule Drug Discovery Suite 2013–3: Glide, version 6.1 ed; Schrödinger, LLC: New York, NY, USA, 2013.
- Burgin, A.B.; Magnusson, O.T.; Singh, J.; Witte, P.; Staker, B.L.; Bjornsson, J.M.; Thorsteinsdottir, M.; Hrafnsdottir, S.; Hagen, T.; Kiselyov, A.S.; et al. Design of phosphodiesterase 4D (PDE4D) allosteric modulators for enhancing cognition with improved safety. Nat. Biotech. 2010, 28, 63–70. [Google Scholar] [CrossRef]
- Berman, H.M.; Westbrook, J.; Feng, Z.; Gilliland, G.; Bhat, T.N.; Weissig, H.; Shindyalov, I.N.; Bourne, P.E. The Protein Data Bank. Nucleic Acids Res. 2000, 28, 235–242. [Google Scholar] [CrossRef]
- RCSB Protein Data Bank. Available online: http://www.rcsb.org (accessed on 27 May 2014).
- The PyMOL Molecular Graphics System, version 1.6.0.0 ed; Schrödinger, LLC: New York, NY, USA, 2012.
- Stierand, K.; Rarey, M. From modeling to medicinal chemistry: Automatic generation of two-dimensional complex diagrams. ChemMedChem 2007, 2, 853–860. [Google Scholar] [CrossRef]
- Wang, H.; Liu, Y.; Huai, Q.; Cai, J.; Zoraghi, R.; Francis, S.H.; Corbin, J.D.; Robinson, H.; Xin, Z.; Lin, G.; et al. Multiple conformations of phosphodiesterase-5: Implications for enzyme function and drug development. J. Biol. Chem. 2006, 281, 21469–21479. [Google Scholar]
- Verhoest, P.R.; Chapin, D.S.; Corman, M.; Fonseca, K.; Harms, J.F.; Hou, X.; Marr, E.S.; Menniti, F.S.; Nelson, F.; O’Connor, R.; et al. Discovery of a novel class of phosphodiesterase 10A inhibitors and identification of clinical candidate 2-[4-(1-methyl-4-pyridin-4-yl-1H-pyrazol-3-yl)-phenoxymethyl]-quinoline (PF-2545920) for the treatment of schizophrenia. J. Med. Chem. 2009, 52, 5188–5196. [Google Scholar] [CrossRef]
- Greenidge, P.A.; Kramer, C.; Mozziconacci, J.C.; Wolf, R.M. MM/GBSA binding energy prediction on the PDBbind data set: Successes, failures, and directions for further improvement. J. Chem. Inf. Model. 2013, 53, 201–209. [Google Scholar]
- Sherman, W.; Day, T.; Jacobson, M.P.; Friesner, R.A.; Farid, R. Novel Procedure for Modeling Ligand/Receptor Induced Fit Effects. J. Med. Chem. 2006, 49, 534–553. [Google Scholar] [CrossRef]
- Jacobitz, S.; McLaughlin, M.M.; Livi, G.P.; Burman, M.; Torphy, T.J. Mapping the functional domains of human recombinant phosphodiesterase 4A: Structural requirements for catalytic activity and rolipram binding. Mol. Pharmacol. 1996, 50, 891–899. [Google Scholar]
- Chemical Hashed Fingerprints. Available online: http://www.chemaxon.com/jchem/doc/user/fingerprint.html (accessed on 12 February 2009).
- Adams, S.; Glen, R. Similarity Metrics and Descriptor Spaces—Which Combinations to Choose? QSAR Comb. Sci. 2006, 25, 1133–1142. [Google Scholar] [CrossRef]
- Vendor databases. Available online: http://www.chembridge.com (accessed on 12 February 2009).
- Vendor databases. Available online: http://www.chemdiv.com (accessed on 12 February 2009).
- Vendor databases. Available online: http://www.asinex.com (accessed on 12 February 2009).
- Vendor databases. Available online: http://www.enaimne.net (accessed on 12 February 2009).
- Vendor databases. Available online: http://www.lifechemicals.com (accessed on 12 February 2009).
- Vendor databases. Available online: http://www.ukrorgsynth.com (accessed on 12 February 2009).
- Vendor databases. Available online: http://www.amriglobal.com (accessed on 12 February 2009).
- Vendor databases. Available online: http://www.specs.net (accessed on 12 February 2009).
- Vendor databases. Available online: http://www.maybridge.com (accessed on 12 February 2009).
- Vendor databases. Available online: http://www.ibscreen.com (accessed on 12 February 2009).
- Raevsky, O.A. Physicochemical descriptors in property-based drug design. Mini Rev. Med. Chem. 2004, 4, 1041–1052. [Google Scholar] [CrossRef]
- Di, L.; Kerns, E.H.; Carter, G.T. Drug-like property concepts in pharmaceutical design. Curr. Pharm. Des. 2009, 15, 2184–2194. [Google Scholar] [CrossRef]
- Lipinski, C.A.; Lombardo, F.; Dominy, B.W.; Feeney, P.J. Experimental and computational approaches to estimate solubility and permeability in drug discovery and development settings. Adv. Drug Deliv. Rev. 2001, 46, 3–26. [Google Scholar] [CrossRef]
- Veber, D.F.; Johnson, S.R.; Cheng, H.; Smith, B.R.; Ward, K.W.; Kopple, K.D. Molecular properties that influence the oral bioavailability of drug candidates. J. Med. Chem. 2002, 45, 2615–2623. [Google Scholar] [CrossRef]
- Morphy, R. The influence of target family and functional activity on the physicochemical properties of pre-clinical compounds. J. Med. Chem. 2006, 49, 2969–2978. [Google Scholar] [CrossRef]
- High-Throughput Shape Similarity Screening: Screen3D. Available online: http://www.chemaxon.com/wp-content/uploads/2013/03/screen3d_2013-02-12.pdf (accessed on 2 February 2013).
- Kalaszi, A.; Szisz, D.; Imre, G.; Polgar, T. Screen3D: A novel fully flexible high-throughput shape-similarity search method. J. Chem. Inf. Model. 2014, 54, 1036–1049. [Google Scholar] [CrossRef]
- Sample Availability: Samples of all compounds are available from the authors.
© 2014 by the authors. licensee MDPI, Basel, Switzerland. This article is an open access article distributed under the terms and conditions of the Creative Commons Attribution license ( http://creativecommons.org/licenses/by/3.0/).
Share and Cite
Dobi, K.; Hajdú, I.; Flachner, B.; Fabó, G.; Szaszkó, M.; Bognár, M.; Magyar, C.; Simon, I.; Szisz, D.; Lőrincz, Z.; et al. Combination of 2D/3D Ligand-Based Similarity Search in Rapid Virtual Screening from Multimillion Compound Repositories. Selection and Biological Evaluation of Potential PDE4 and PDE5 Inhibitors. Molecules 2014, 19, 7008-7039. https://doi.org/10.3390/molecules19067008
Dobi K, Hajdú I, Flachner B, Fabó G, Szaszkó M, Bognár M, Magyar C, Simon I, Szisz D, Lőrincz Z, et al. Combination of 2D/3D Ligand-Based Similarity Search in Rapid Virtual Screening from Multimillion Compound Repositories. Selection and Biological Evaluation of Potential PDE4 and PDE5 Inhibitors. Molecules. 2014; 19(6):7008-7039. https://doi.org/10.3390/molecules19067008
Chicago/Turabian StyleDobi, Krisztina, István Hajdú, Beáta Flachner, Gabriella Fabó, Mária Szaszkó, Melinda Bognár, Csaba Magyar, István Simon, Dániel Szisz, Zsolt Lőrincz, and et al. 2014. "Combination of 2D/3D Ligand-Based Similarity Search in Rapid Virtual Screening from Multimillion Compound Repositories. Selection and Biological Evaluation of Potential PDE4 and PDE5 Inhibitors" Molecules 19, no. 6: 7008-7039. https://doi.org/10.3390/molecules19067008