Article

Study on the Synthesis, Biological Activity and Spectroscopy of Naphthalimide-Diamine Conjugates

1
Institute of Chemical Biology, Henan University, Kaifeng 475004, China
2
Key Laboratory of Natural Medicine and Immuno-Engineering, Henan University, Kaifeng 475004, China
*
Authors to whom correspondence should be addressed.
Molecules 2014, 19(6), 7646-7668; https://doi.org/10.3390/molecules19067646
Submission received: 20 February 2014 / Revised: 23 May 2014 / Accepted: 27 May 2014 / Published: 10 June 2014
(This article belongs to the Section Medicinal Chemistry)

Abstract

:
Eleven novel naphthalimide-diamine conjugates were synthesized and their structures were confirmed by elemental analysis, 1H-NMR, 13C-NMR and MS. Their in vitro antitumor activities were assessed using MTT assays on two cancerous cell lines K562, HCT116, and one normal hepatoma cell line QSG 7701. Compound 7f exhibited potent antitumor activity on HCT116 cells and favorable cell selectivity toward QSG 7701 compared with the positive control, amonafide. Moreover, 7f could block HeG2 cells in the G2/M phase and induce HeG2 cells apoptosis. The interaction of compound 7f with herring sperm DNA was studied by UV/vis absorption and fluorescence spectroscopy under physiological conditions (pH = 7.4). The observed spectral quenching of compound 7f by DNA and the displacement of EB from DNA-EB complex by compound 7f indicated that compound 7f could intercalate into DNA base pairs, which was also corroborated by the effect of KI on compound-DNA interaction. Further caloric fluorescent tests revealed that the quenching mechanism was a static type. Meanwhile, the binding constants, thermodynamic parameters and the effect of NaCl on compound-DNA interaction showed that the type of interaction force was mainly hydrogen bonds and the binding process was driven by hydrogen and van der Waals bonding.

1. Introduction

As a common chemical motif, naphthalimides are among a growing class of compounds with desirable anticancer activity. Numerous mono- or bis-naphthalimide derivatives displayed potent antitumor properties against a variety of murine and human tumor cells [1,2,3,4], and some of them such as mitonafide [5], amonafide [6], azonafide [7], DMP-840 [8,9] and Lu-79553 [10] have been tested in clinic trials for the treatment of solid tumors. However, most clinical trials have failed because of a poor therapeutic index, poor water-solubility or dose-limiting bone marrow toxicity such as in the case of mitonafide [11]. Subsequent efforts to improve therapeutic properties of naphthalimides have been made by modifying the naphthalimide skeleton [12,13,14,15,16,17,18,19,20,21,22,23,24,25].
Previous studies revealed that polyamines are a kind of promising carriers to transport cytotoxic agents into cancer cells [26]. Polyamines are important for tumor cell growth and function, the biosynthetic pathway of native polyamines (putrescine, spermidine and spermine) has been a popular target for therapeutic intervention during the last decades [27].
Our previous work proved that conjugates 13 (Figure 1), composed of 1,8-naphthalimide units covalently attached to a polyamine such as spermidine or homospermidine, possessed remarkable cell selectivity through to human hepatoma Bel-7402 and human normal hepatocyte QSG-7701 trials [28,29]. In addition, naphthalimide-polyamine conjugates have been proved to induce cancer cell apoptosis via different pathways [28,29,30]. These results encouraged us to screen more substituted naphthalimide-polyamine conjugates in order to assess their antitumor activity.
Figure 1. The structures of compounds 1–3.
Molecules 19 07646 g001
DNA as carrier of genetic information is a major target for drug interaction due to its abilities to interfere with transcription (gene expression and protein synthesis) and DNA replication, a major step in cell growth and division. Generally, a variety of small molecules interact reversibly with DNA in three primary ways, including intercalation of planar or approximately planar aromatic ring systems between base-pairs [31], groove binding in which the small molecules bound on nucleic acids are located in the major or minor groove [18,19] and binding along the exterior of DNA helix through interactions which are generally nonspecific and are primarily electrostatic. The 1,8-naphthalimide derivatives are the DNA intercalating agents because they consist of a flat, generally p-π deficient aromatic system of which binds to DNA by insertion between the base pairs of the double helix. However, there are rare reports on the interaction mechanism of naphthalimide-polyamine conjugates and DNA. In this work, naphthalimide-diamine conjugates were synthesized and their antitumor activity assessed in vitro. The interactions between a representative compound 7f and herring sperm DNA were first studied by UV and fluorescence spectroscopy. The binding constants and main sorts of binding force were also investigated. Moreover, mechanism of how the novel conjugate 7f killed HeG2 cells 7f was reported.

2. Results and Discussion
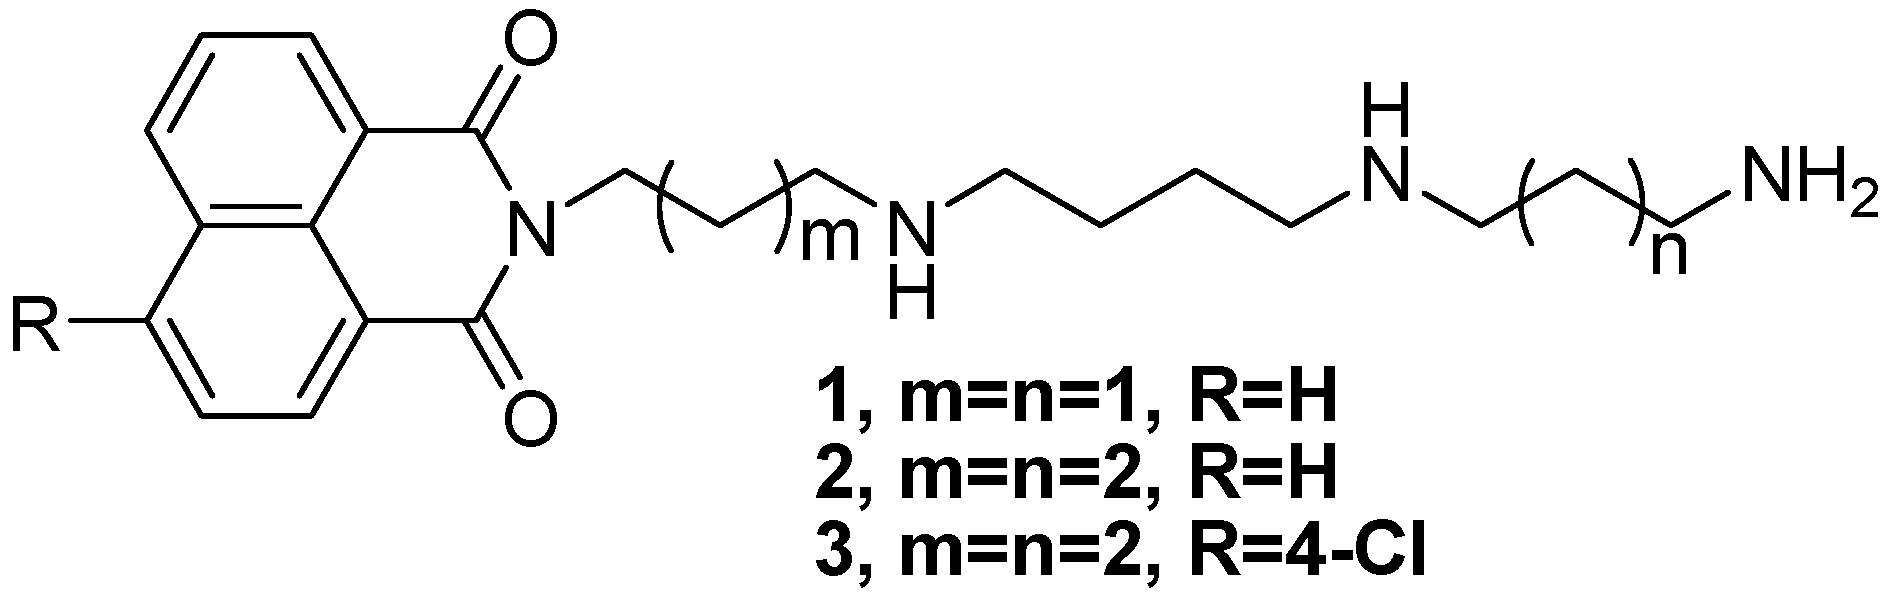
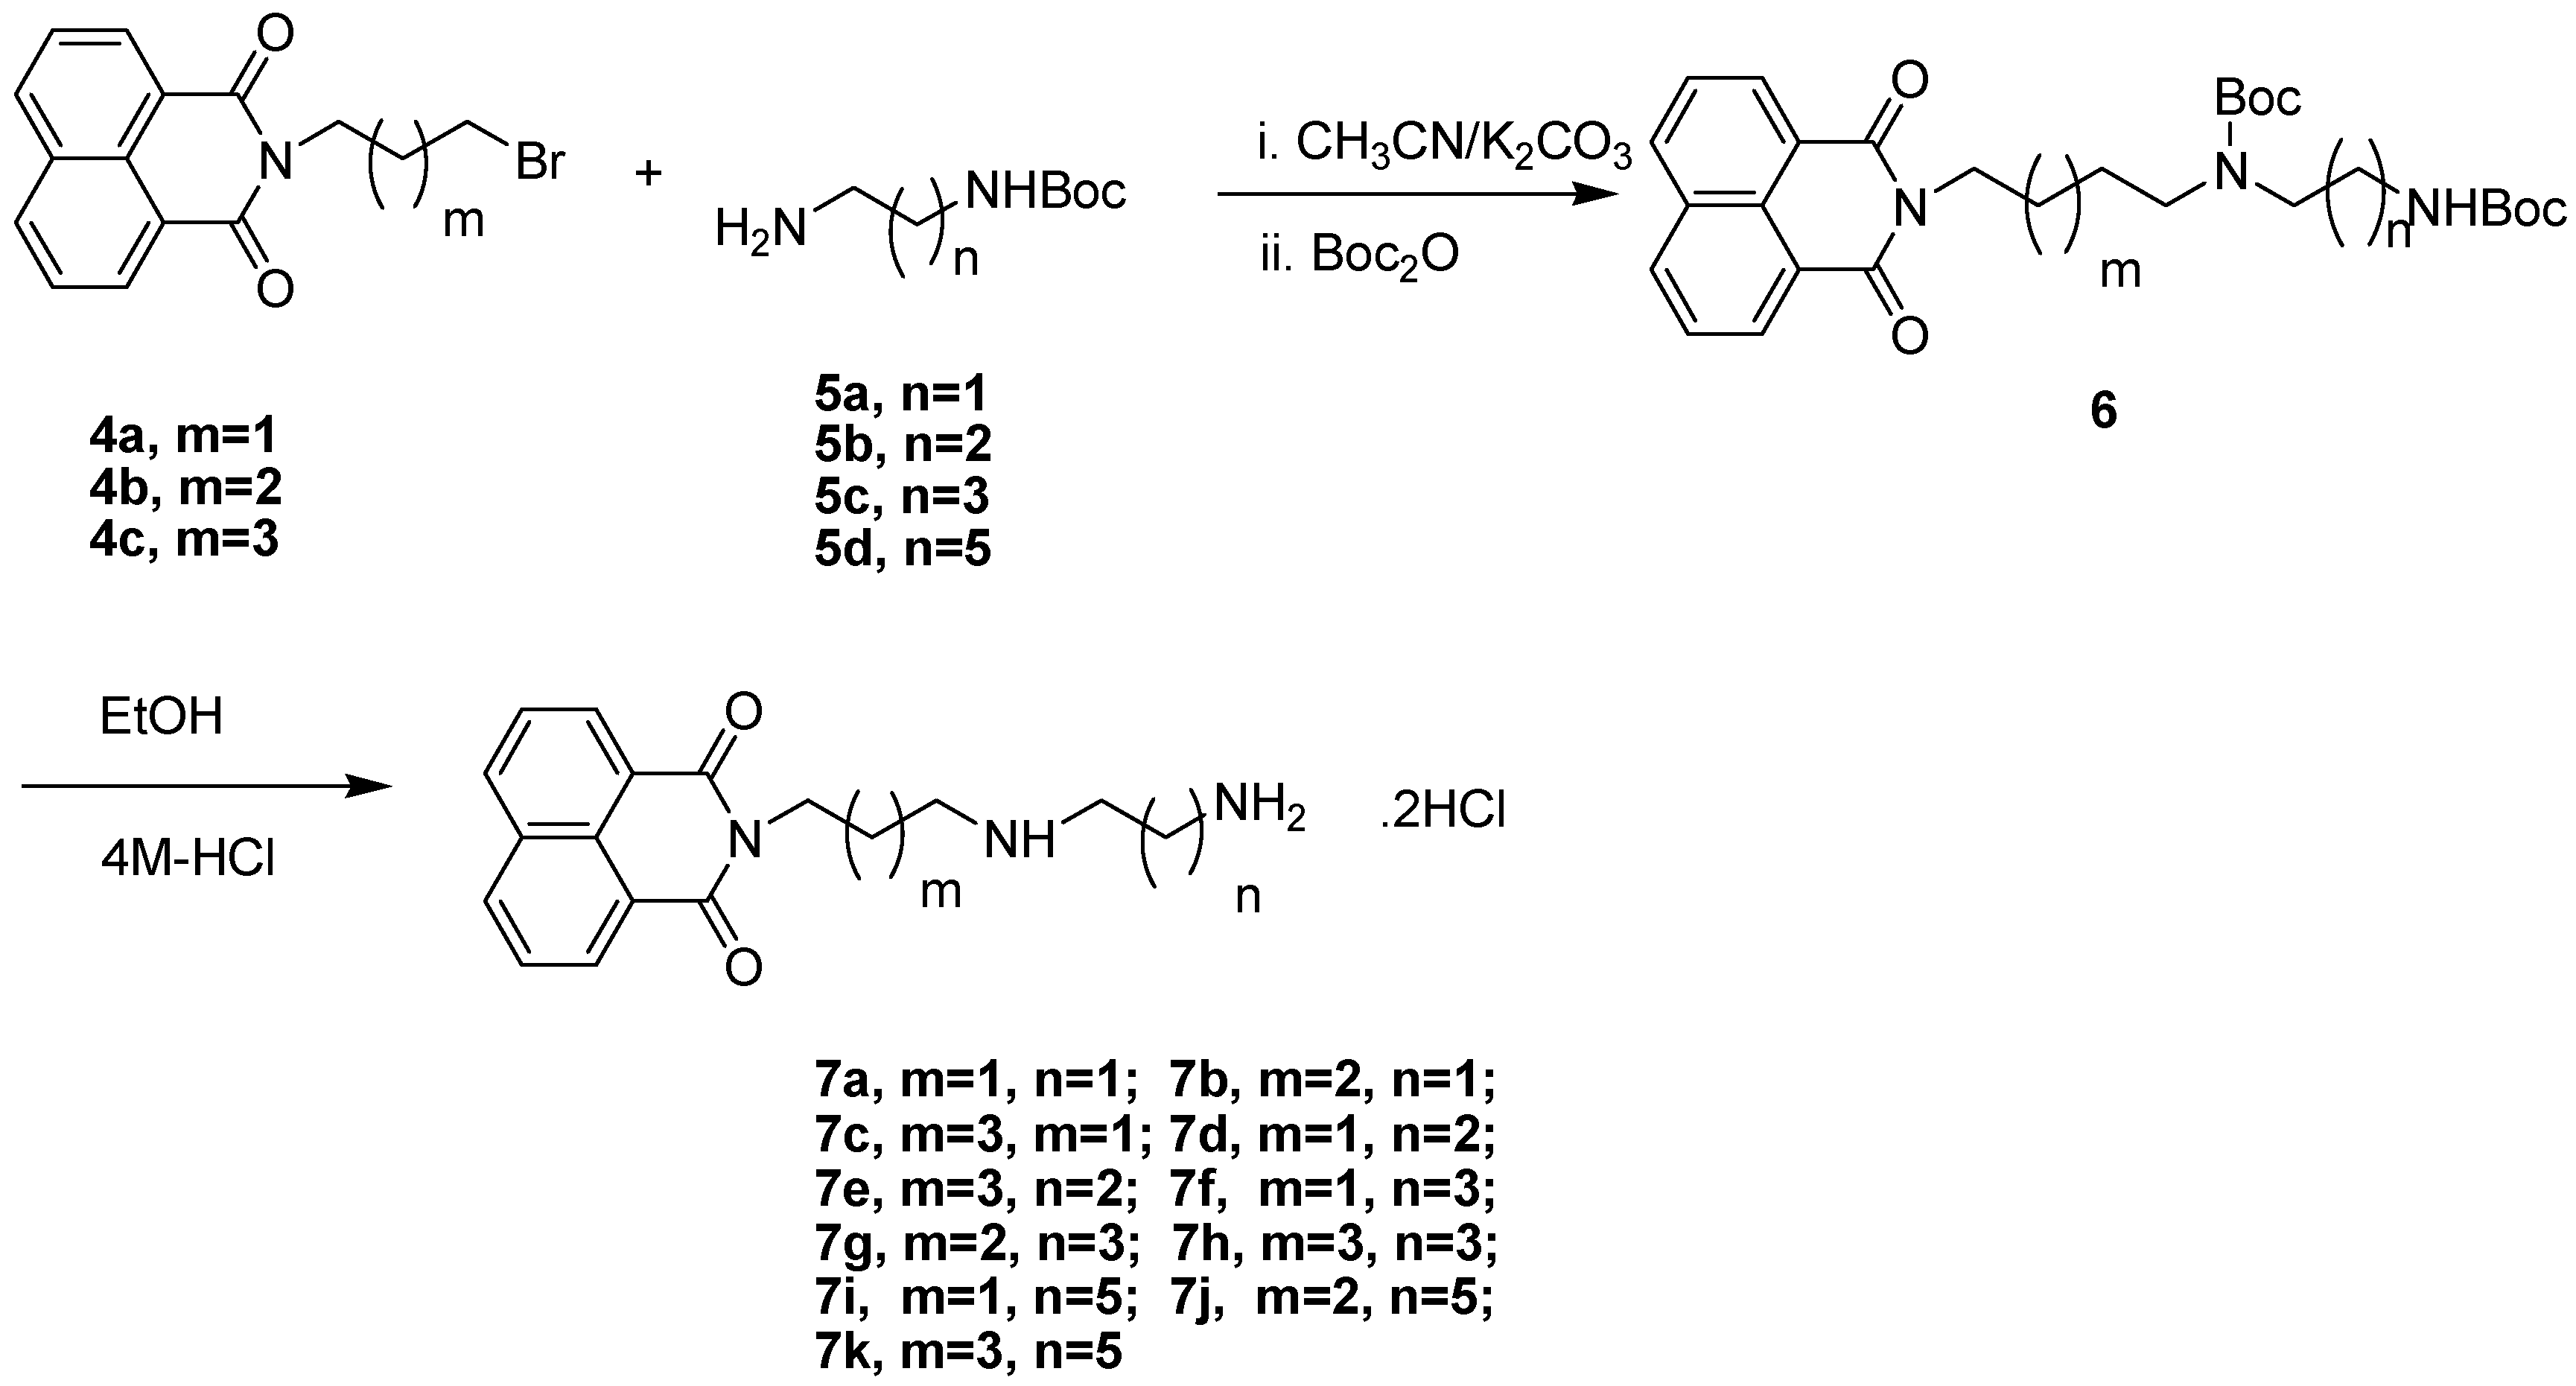
2.1. Chemistry

The synthetic route to the naphthalimide-diamine conjugates 7ak is shown in Scheme 1. N-(3-bromopropyl)-1,8-naphthalimide (4a), N-(4-bromobutyl)-1,8-naphthalimide (4b) and N-(5-bromo- pentyl)-1,8-naphthalimide (4c) were prepared routinely from 1,8-naphthalimide and 1,4-dibromobutane (or 1,3-dibrompropane, 1,5-dibromopentane) in the presence of potassium carbonate and potassium iodide. The Boc-protected diamines 5 were prepared according to a modified procedure reported previously [32]. The N-alkylation reactions of 5 with 4 in the presence of potassium carbonate in dry acetonitrile at 45 °C generated intermediates which were difficult to purify because of their instability [33]. Without separation, N-Boc protection with Boc2O led to the formation of stable intermediates 6. Subsequently the Boc groups were removed with 4M HCl at room temperature to provide target compounds 7 as dihydrochloride salts in yields of 50%–80%. The structures of target compounds 7 were confirmed by 1H-NMR, 13C-NMR, ESI-MS, and elemental analysis.
Scheme 1. Synthesis of naphthalimide-diamine conjugates.
Molecules 19 07646 g015

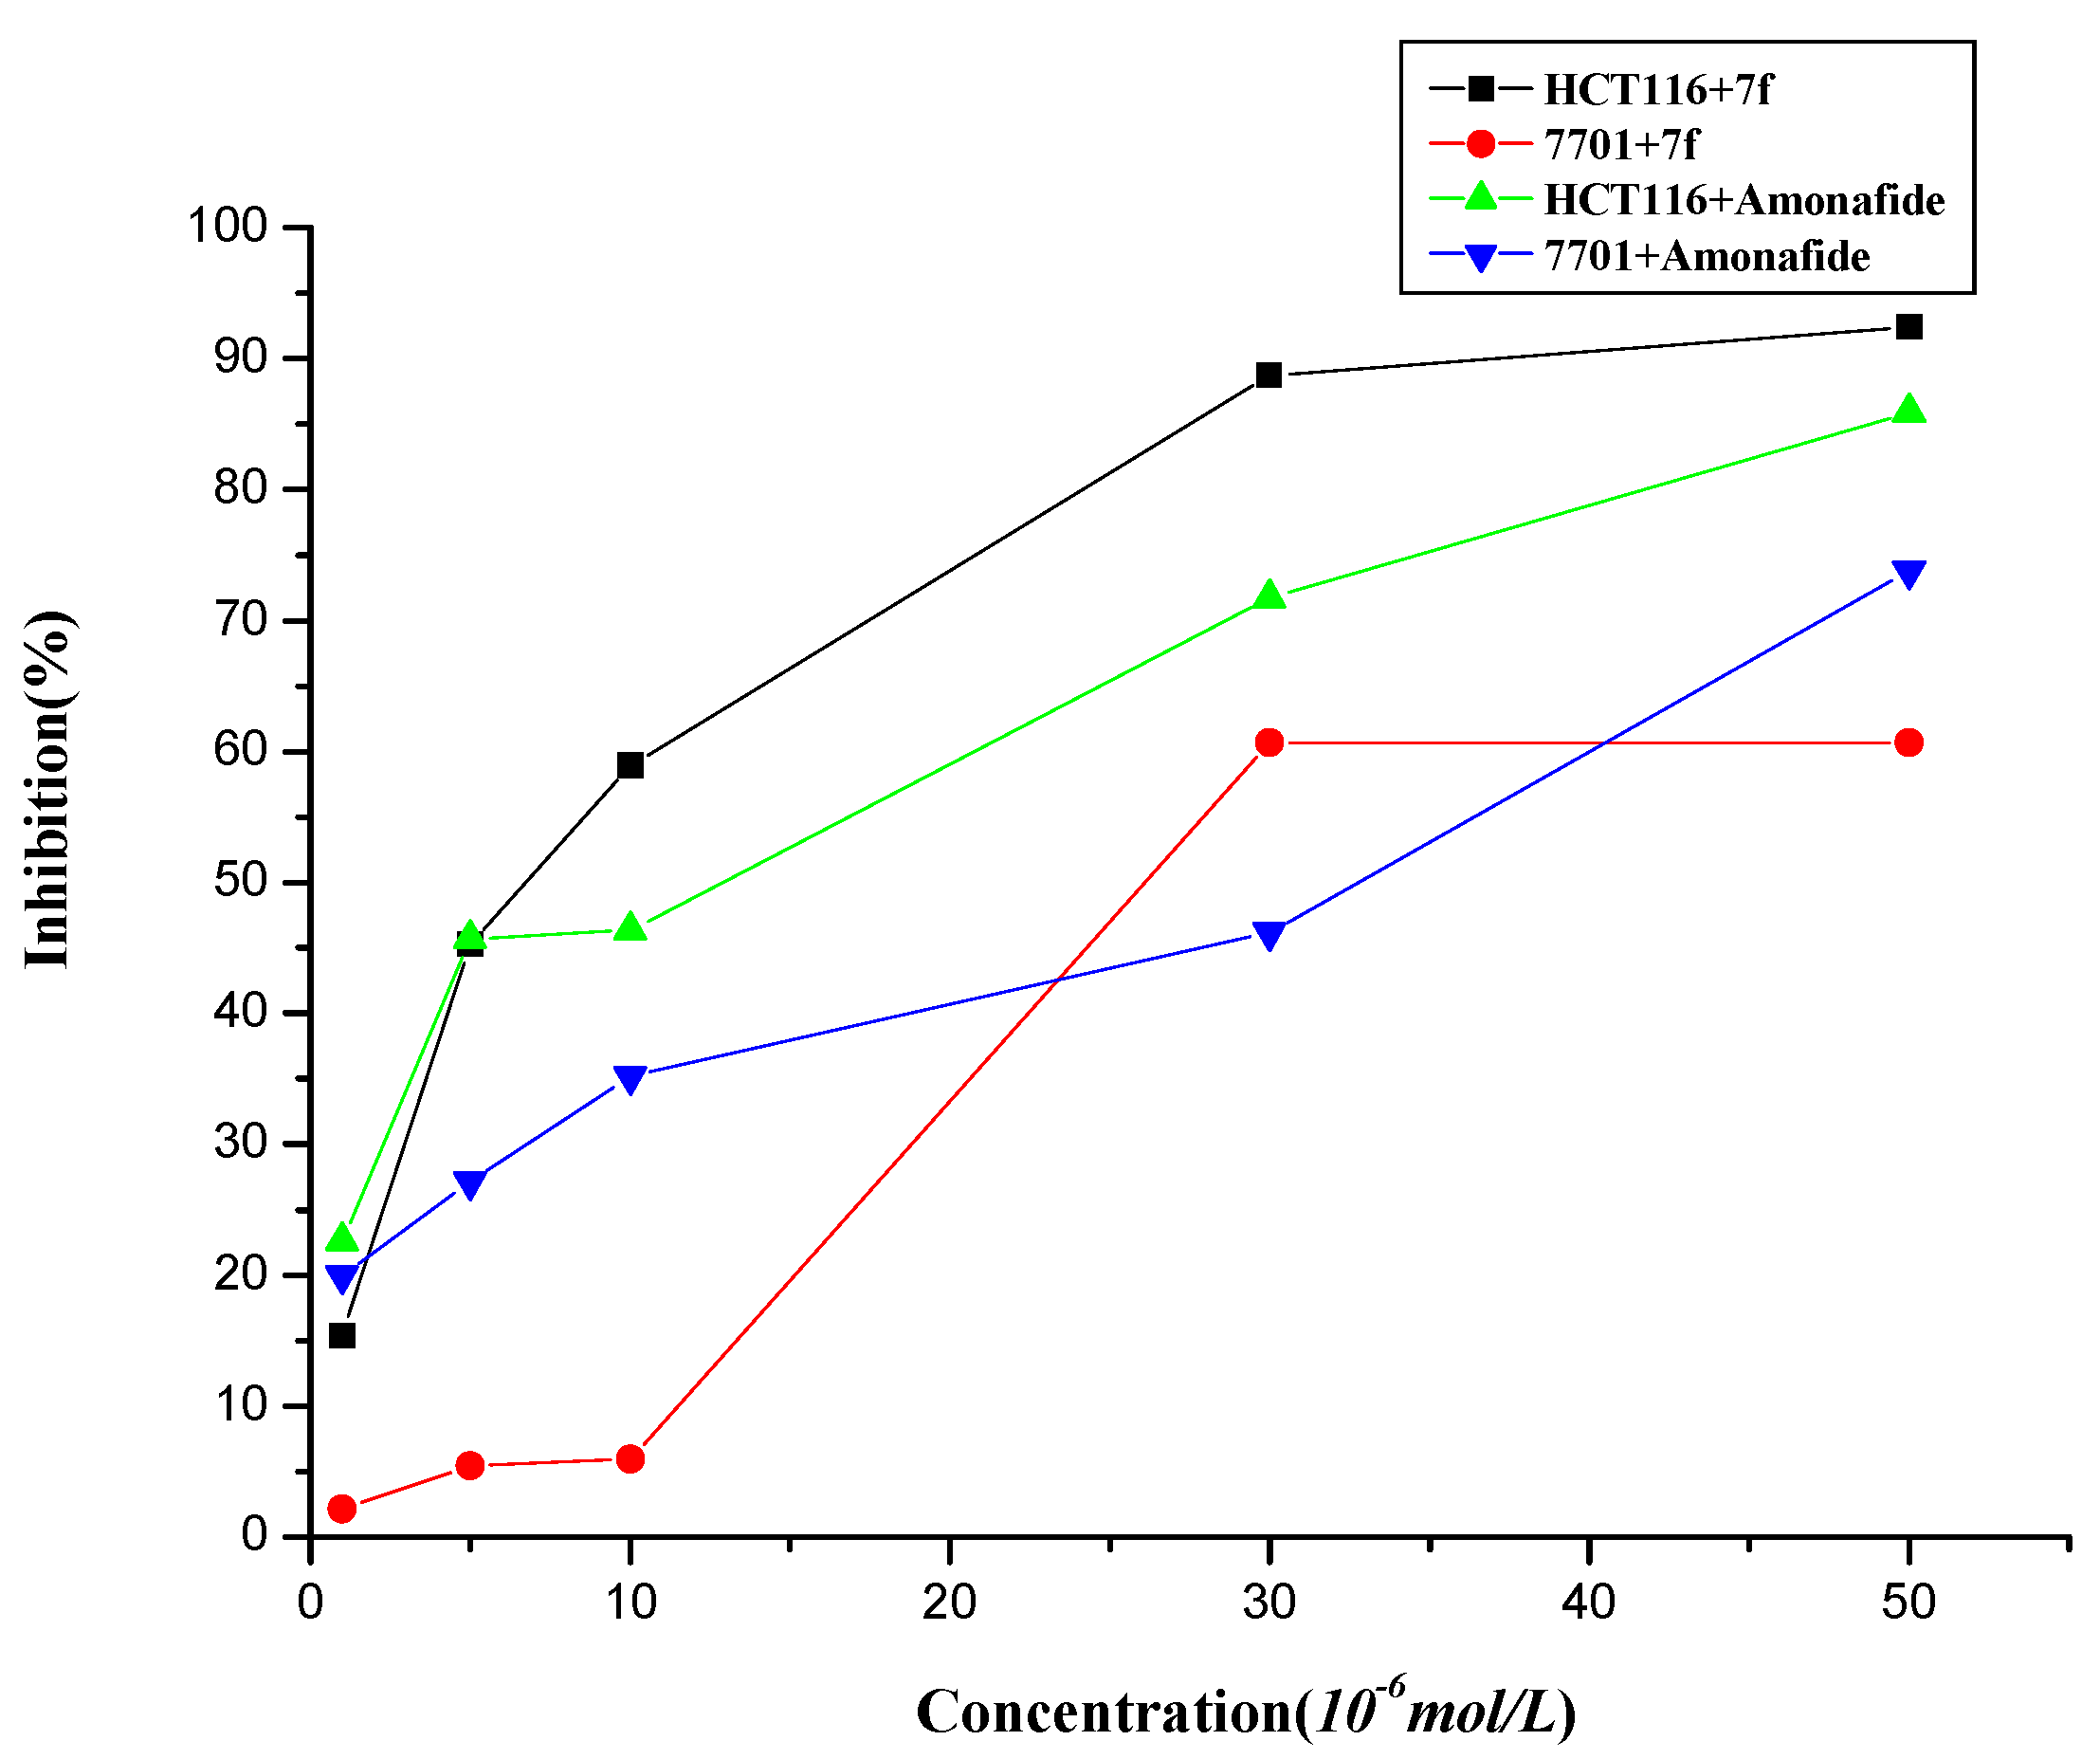
2.2. Cytotoxic Effects

The cytotoxicities of the novel conjugates were assessed in vitro by the MTT assay in the presence of aminoguanidine (an inhibitor of amine oxidase) against three cell lines, human leukemia K562, cancer of colon HCT116 and human normal hepatocyte QSG-7701 [34]. As is shown in Table 1, most of the naphthalimide-diamine conjugates 7ak showed good antitumor activities against K562, HCT116 cells, in which compound 7f seemed to have equipotent antitumor activity against HCT116 and cell selectivity toward QSG-7701 compared to the control, amonafide. At the same time, compounds 7f–h, which have putrescine backbones, exhibited good antitumor activities against K562, HCT116 cells. In addition, compounds 7j–k, which have longer side chains than the others, also exhibited good antitumor activities. Moreover, The compound 7f with a primary terminal amino group in the polyamine motif exhibited better biological properties than the corresponding compounds with a terminal tertiary amino group [35]. However, the dose-responsive curves shown in Figure 2 indicated that compound 7f displayed much better selectivity between HCT116 and QSG-7701 than amonafide, especially at the concentrations around the IC50 values (5–10 μM). Thus, compound 7f was selected for further investigation.
Table 1. .In vitro activity of compound naphthalimide-diamine conjugates (7ak).
Compd.IC50(µM)
K562HCT1167701
7a48.76 ± 3.9319.33 ± 4.39>50
7b25.60 ± 3.7413.93 ± 2.6833.89 ± 4.32
7c38.75 ± 1.769.89 ±1.11>50
7d19.71 ± 7.238.95 ± 3.878.04 ±3.35
7e22.36 ± 1.219.52 ± 3.3122.16 ± 0.67
7f18.87 ± 1.975.45 ± 1.7119.69 ± 3.42
7g14.03 ± 3.3213.88 ± 2.5411.97 ± 4.07
7h15.89 ± 1.5316.21 ± 4.2818.78 ± 4.94
7i41.35 ± 1.7610.97 ± 1.71>50
7j12.56 ± 0.8116.44 ±1.7513.13 ± 3.94
7k15.89 ± 1.839.95 ± 1.8114.70 ± 3.91
Amonafide10.10 ± 2.596.86 ± 1.8920.29 ± 2.43
All data are expressed as means ± SD from three separate determinations. IC50 values were given only if they were less than 50 µM, which was the maximum concentration tested.
Figure 2. The proliferation inhibition of 7f and amonafide assayed by MTT.
Molecules 19 07646 g002

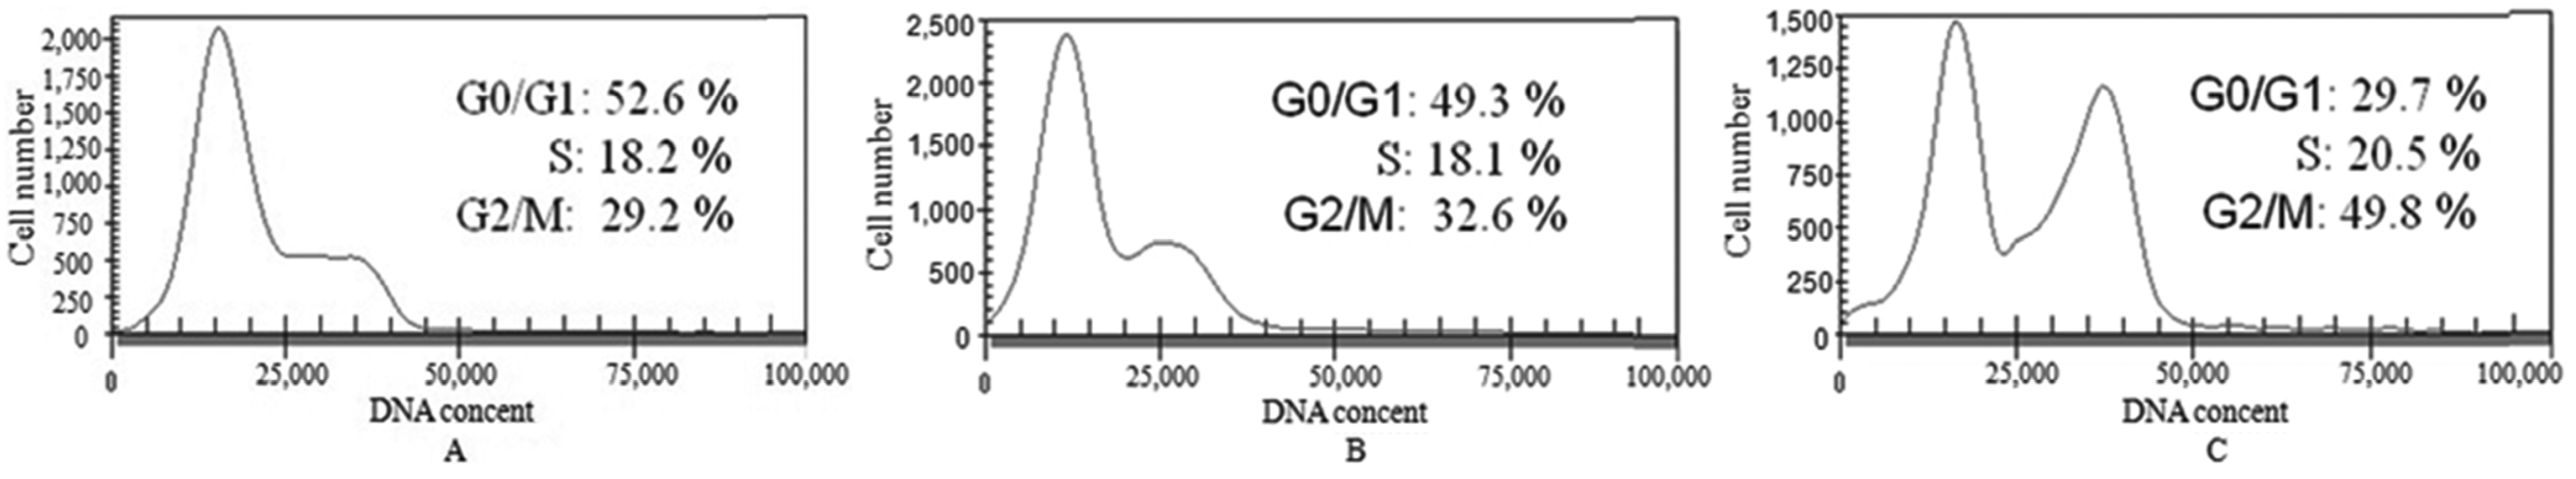
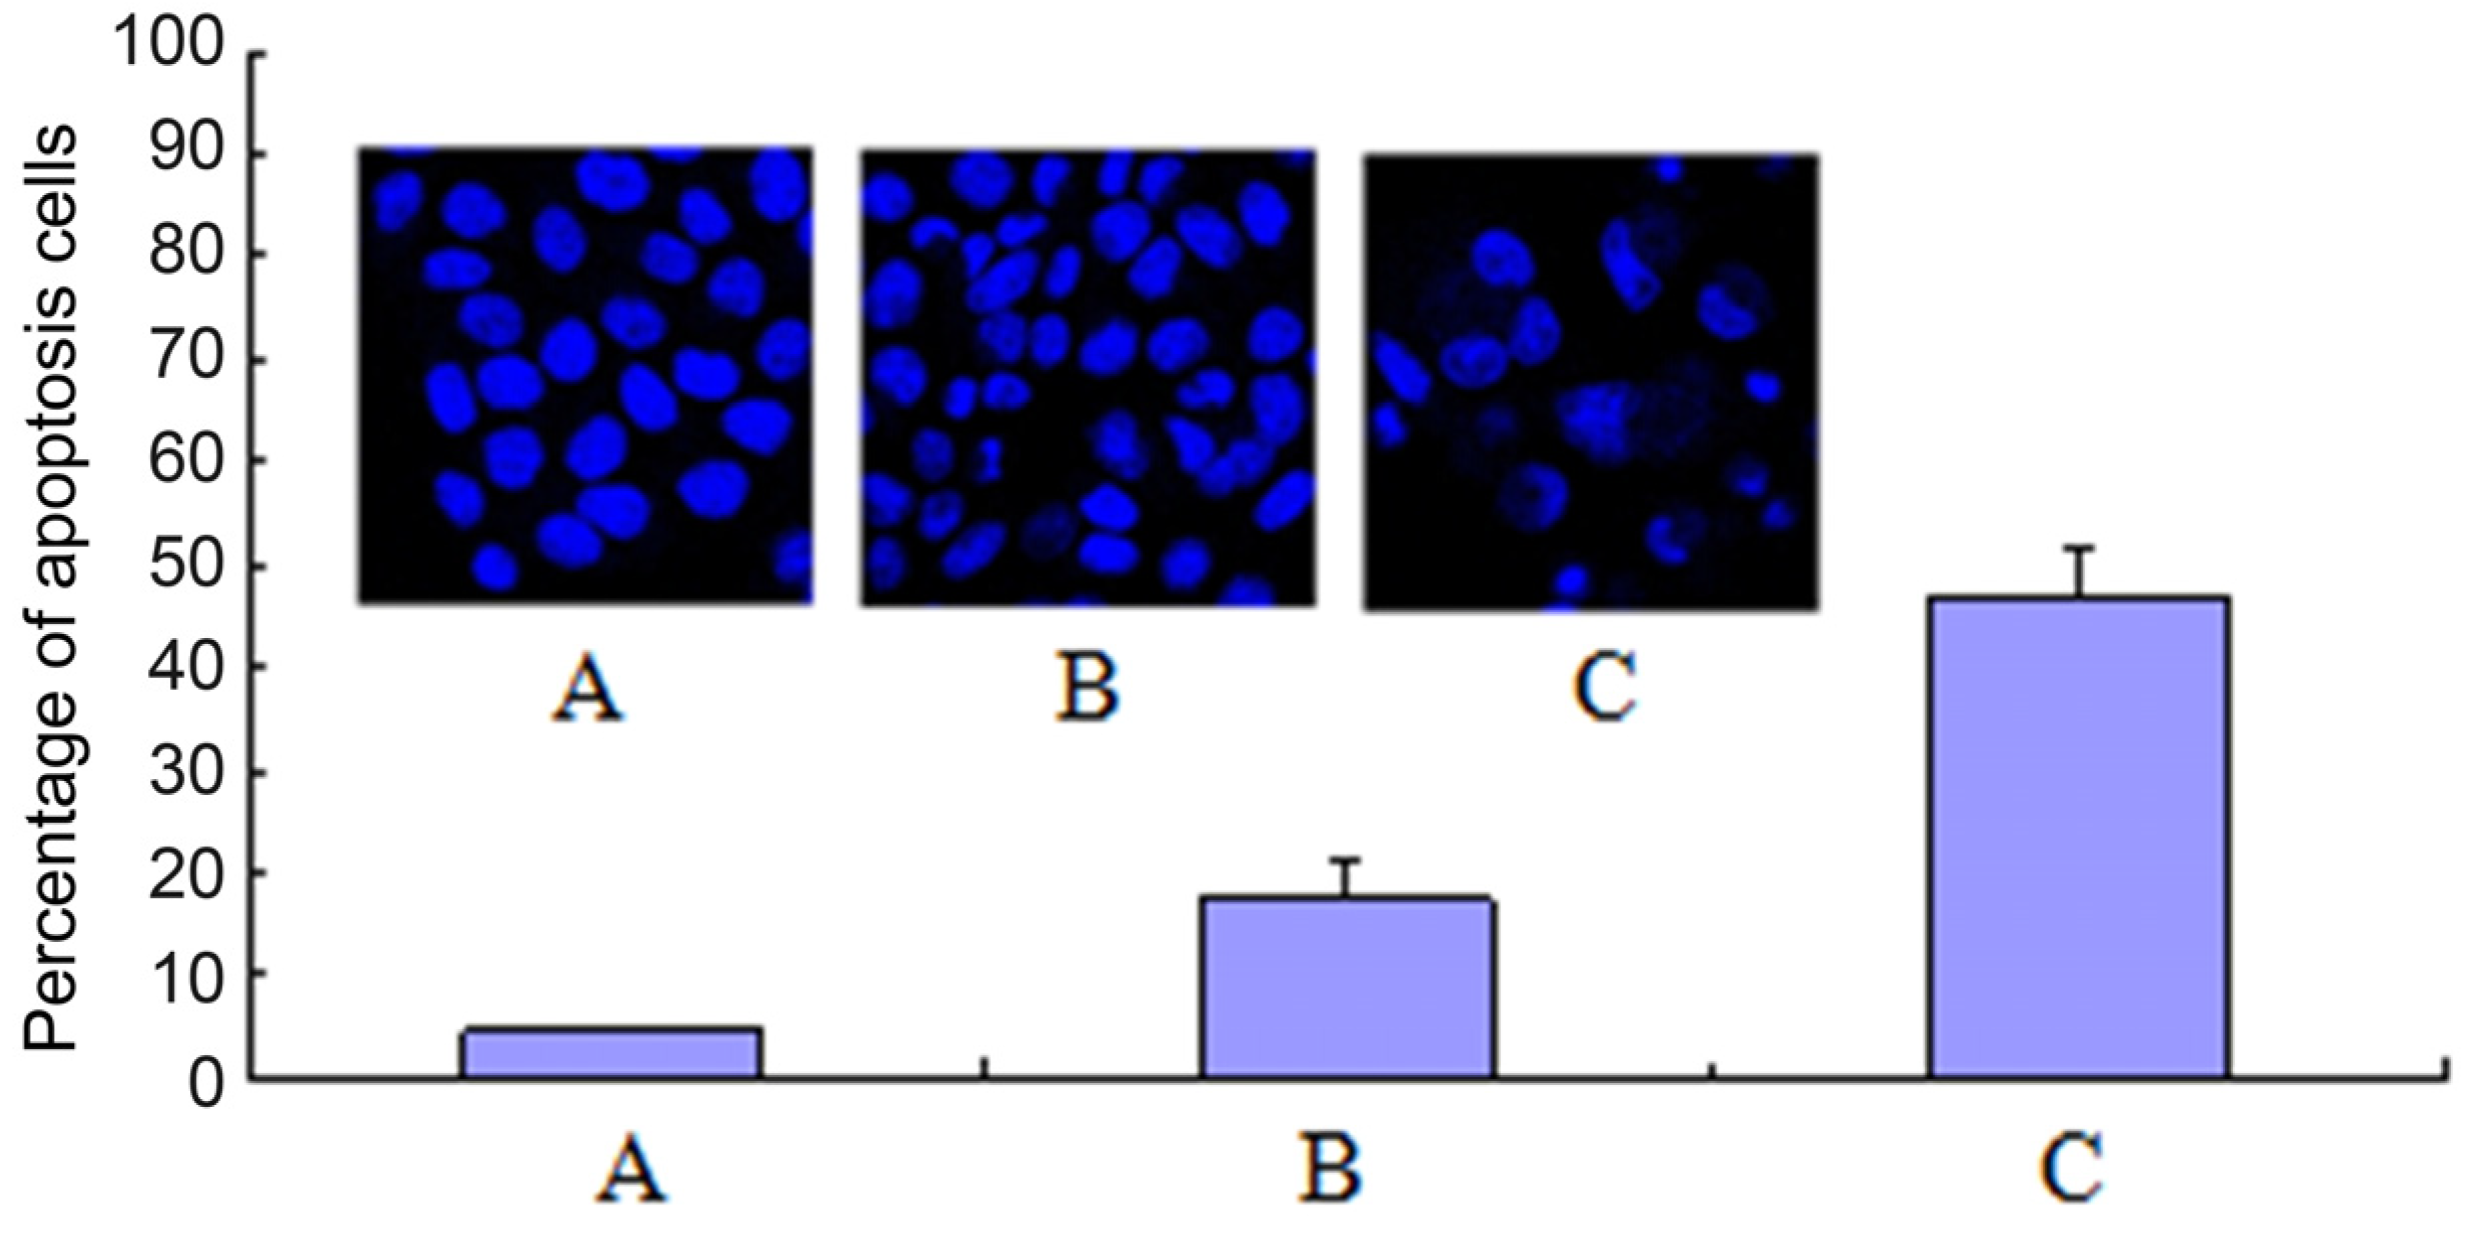
2.3. Cell Cycle Analysis and Apoptosis

To reveal the cytotoxic mechanism of compound 7f, we first examined its effects on the cell cycle perturbation. The DNA content analysis by High Content Screening (HCS) confirmed that 7f could induce HepG2 cell cycle perturbation (Figure 3). The exposure of HepG2 cells to 7f resulted in the dose-dependent accumulation of cells in G2/M phase from 29.7% of the control to 49.8% of 7f. Meanwhile, the corresponding reduction of G0/G1 phase from 52.6% of the control to 29.7% of 7f was also observed, accompanying by the little change in the S phase. The results showed that compound 7f could block HepG2 cells in the G2/M phase.
Figure 3. Arrest of cell cycle progress in HepG2 cells treated with 7f for 48 h. Cells were fixed with ethanol and stained with PI. Cell cycle distribution was analyzed by HCS. (A) Control; (B) Compound 7f: 10 μM; (C) Compound 7f: 20 μM.
Molecules 19 07646 g003
Apoptosis, or namely programmed cell death, can be triggered by several stimuli. Both naphthalimides and polyamine derivatives could trigger cell apoptosis [36]. In order to determine whether the antitumor-proliferative effect of compound 7f was associated with cell apoptosis, the HepG2 cell apoptosis was detected by the staining of DNA with Hoechst 33342, and the apoptotic cells were counted by selecting 200 cells randomly (Figure 4). The apoptotic bodies were observed clearly in 7f-treated groups by laser scanning confocal microscope. 7f could trigger apoptosis in a dose-dependent manner with the 47.0% apoptotic ratio of 7f at 20 μM compared with the less than five percent in the control group.
Figure 4. 7f induced HepG2 cell apoptosis. (A) Control; (B) Compound 7f: 10 μM; (C) Compound 7f: 20 μM.
Molecules 19 07646 g004

2.4. UV Spectroscopy

As is shown in Figure 5, the UV spectrum of compound 7f in the absence and presence of herring sperm DNA was measured by an ultraviolet visible range spectrophotometer. It was observed that a continuous decrease in the absorbance of compound 7f followed with the increasing concentration of DNA, implying compound 7f could insert into the base pairs of DNA. The spectral effects have been rationalized that the empty π*-orbital of the small molecule couples with the π*-orbital of the DNA base pairs, which causes an energy decrease and a decrease of the π–π* transition energy [37,38,39]. At the same time, the empty π*-orbital is partially filled with electrons to reduce the transition probability. Therefore, the absorption of small molecules should exhibit hypochromism.
Figure 5. UV absorption spectra of compound 7f with herring sperm DNA. Numbers 1–13 indicated the DNA concentration: 0.0, 4.56 × 10⁻⁶, 9.13 × 10⁻⁶, 13.69 × 10⁻⁶, 27.4 × 10⁻⁶, 41.08 × 10⁻⁶, 54.77 × 10⁻⁶, 68.46 × 10⁻⁶, 82.15 × 10⁻⁶, 95.84 × 10⁻⁶, 109.54 × 10⁻⁶, 123.23 × 10⁻⁶ and 136.92 × 10⁻⁶ mol∙L1, respectively. The concentration of compound 7f applied were 80 × 10−6 mol∙L−1.
Molecules 19 07646 g005
Utilizing the absorption spectrum obtained by UV, we could also calculate compound 7f’s apparent binding constant according to the following formula [40]:
Molecules 19 07646 i001
where A0 and A denote the absorbance in the absence and presence of DNA, respectively and where εGand ε H–G denote the molar absorption coefficient of compound and its formed complex with DNA. The value of apparent binding constant could be measured from the intercept and slope by plotting A0/(AA0) against cDNA, and the corresponding value of K was 9.806 × 10³ (Figure 6).
Figure 6. Plot of A0/(AA0) versus1/cDNA of the interaction between compound 7f and herring sperm DNA (10−6 mol∙L−1).
Molecules 19 07646 g006

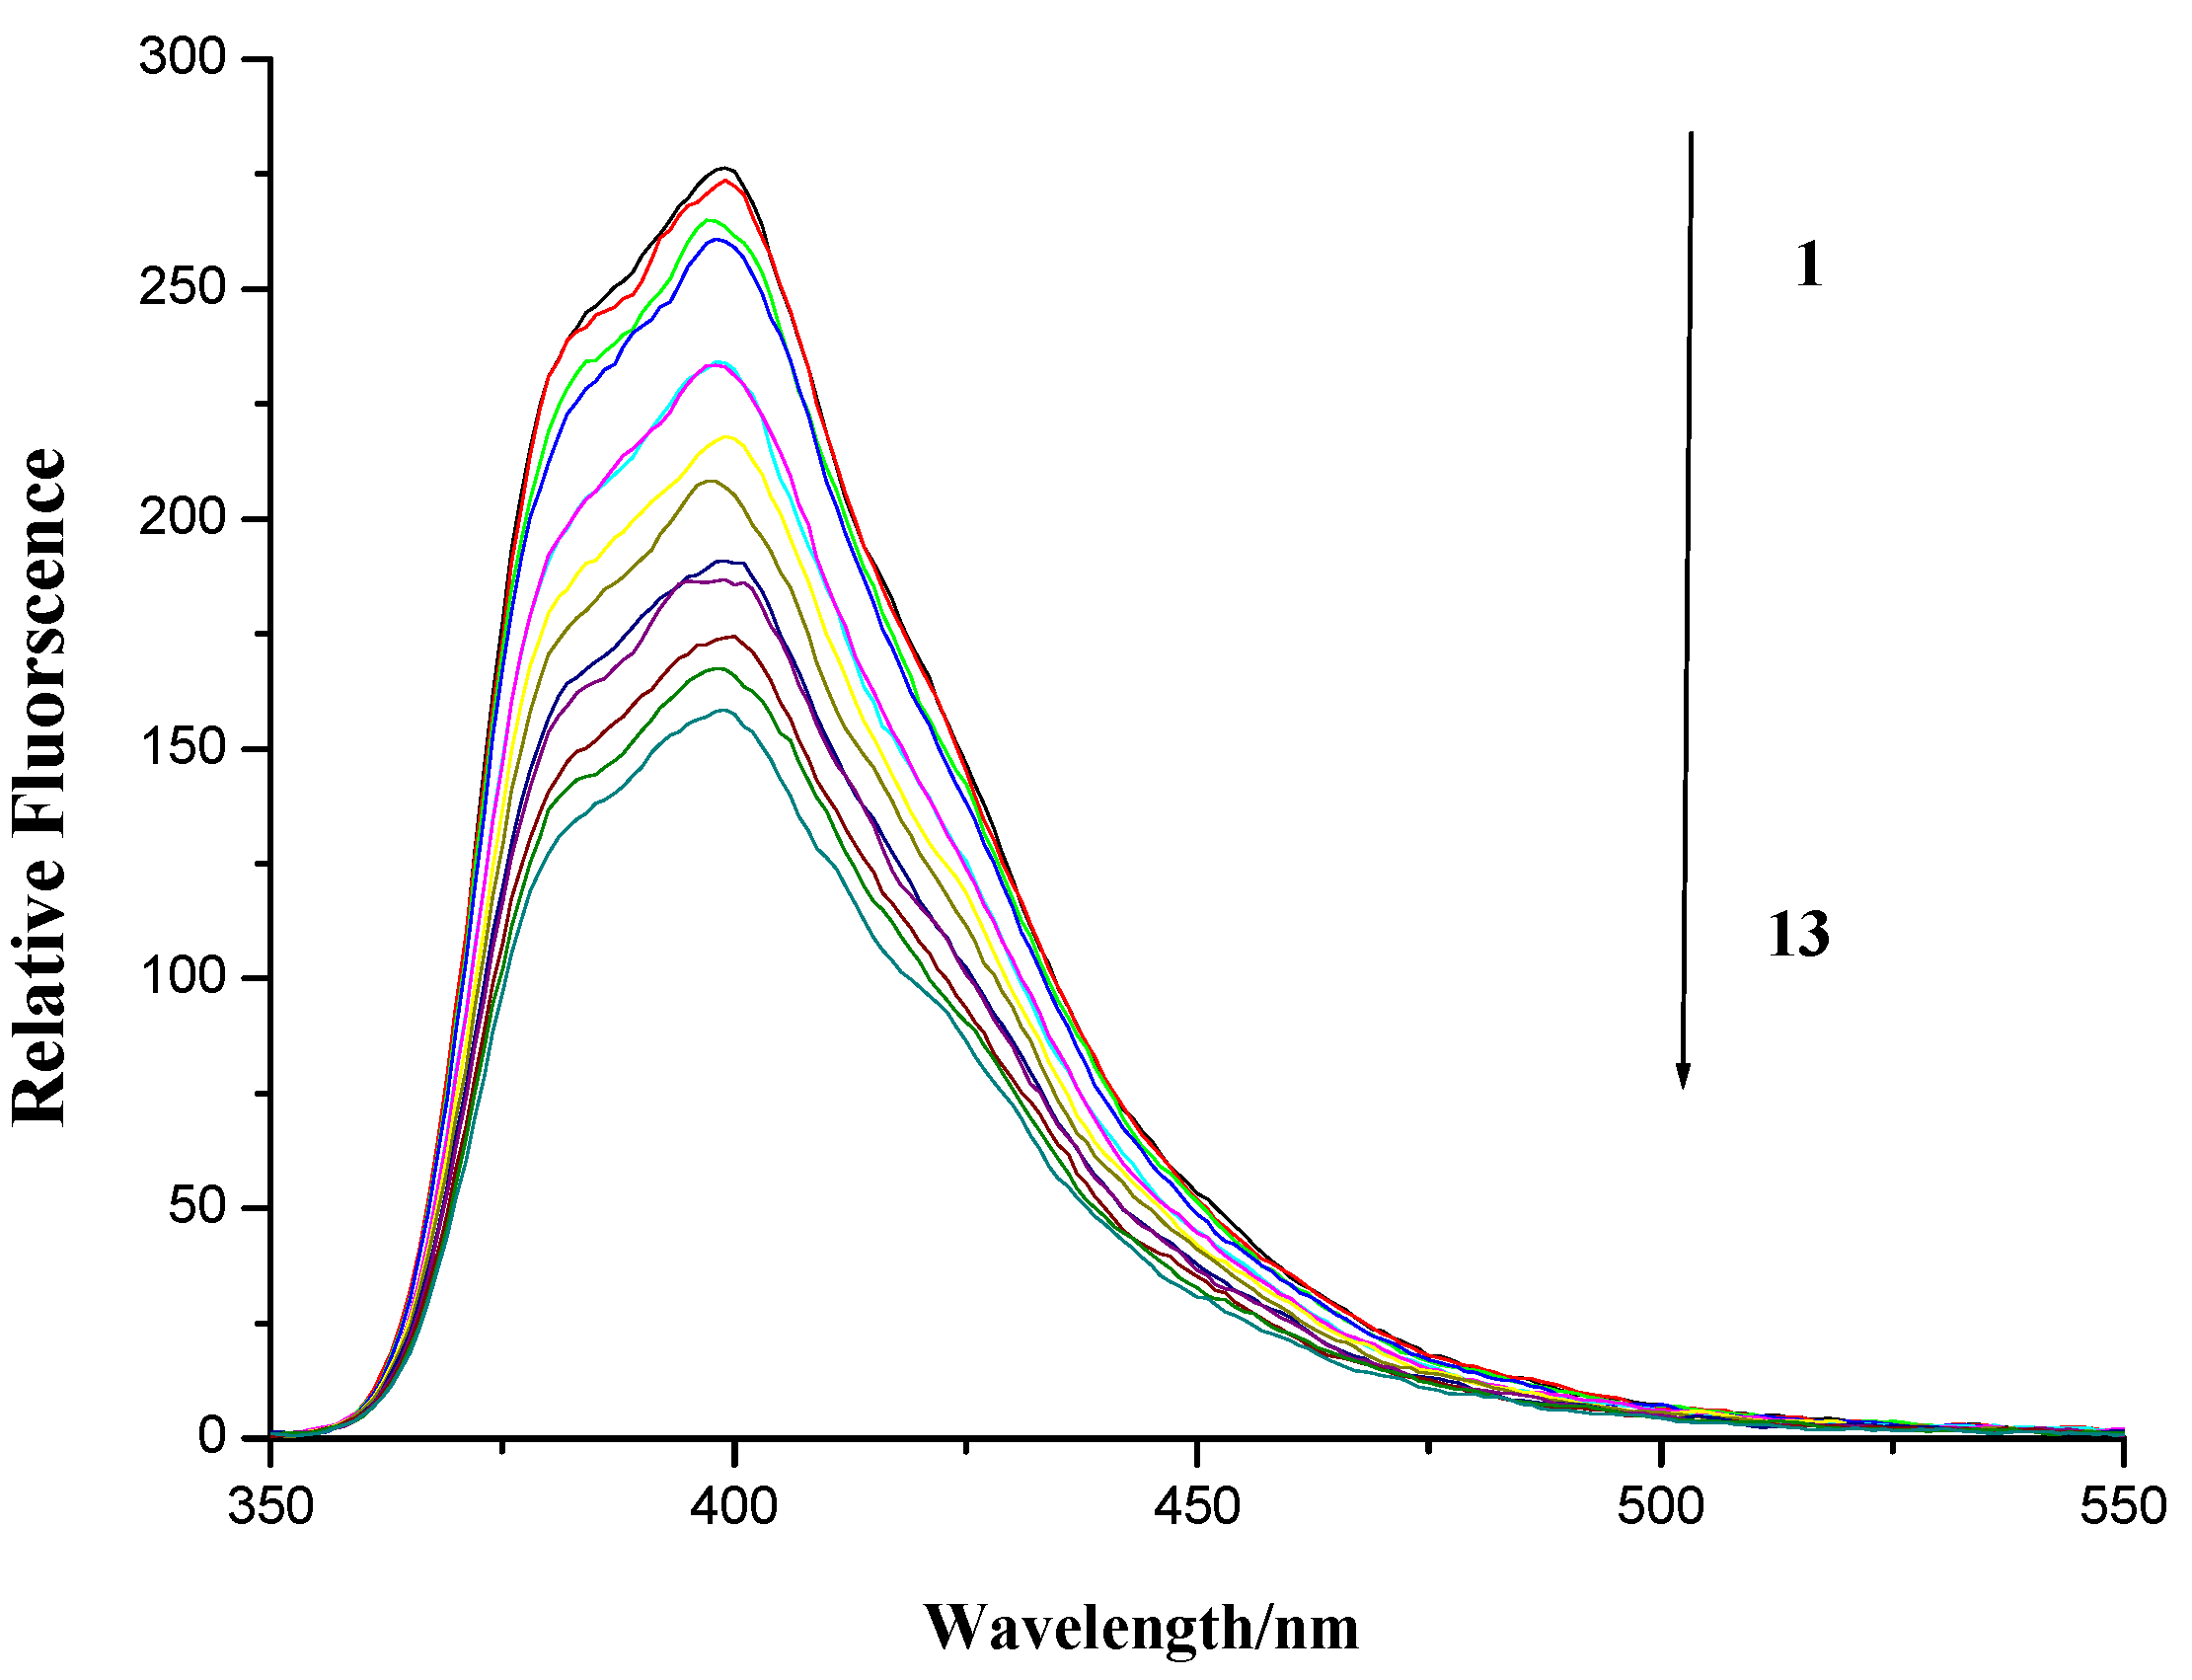
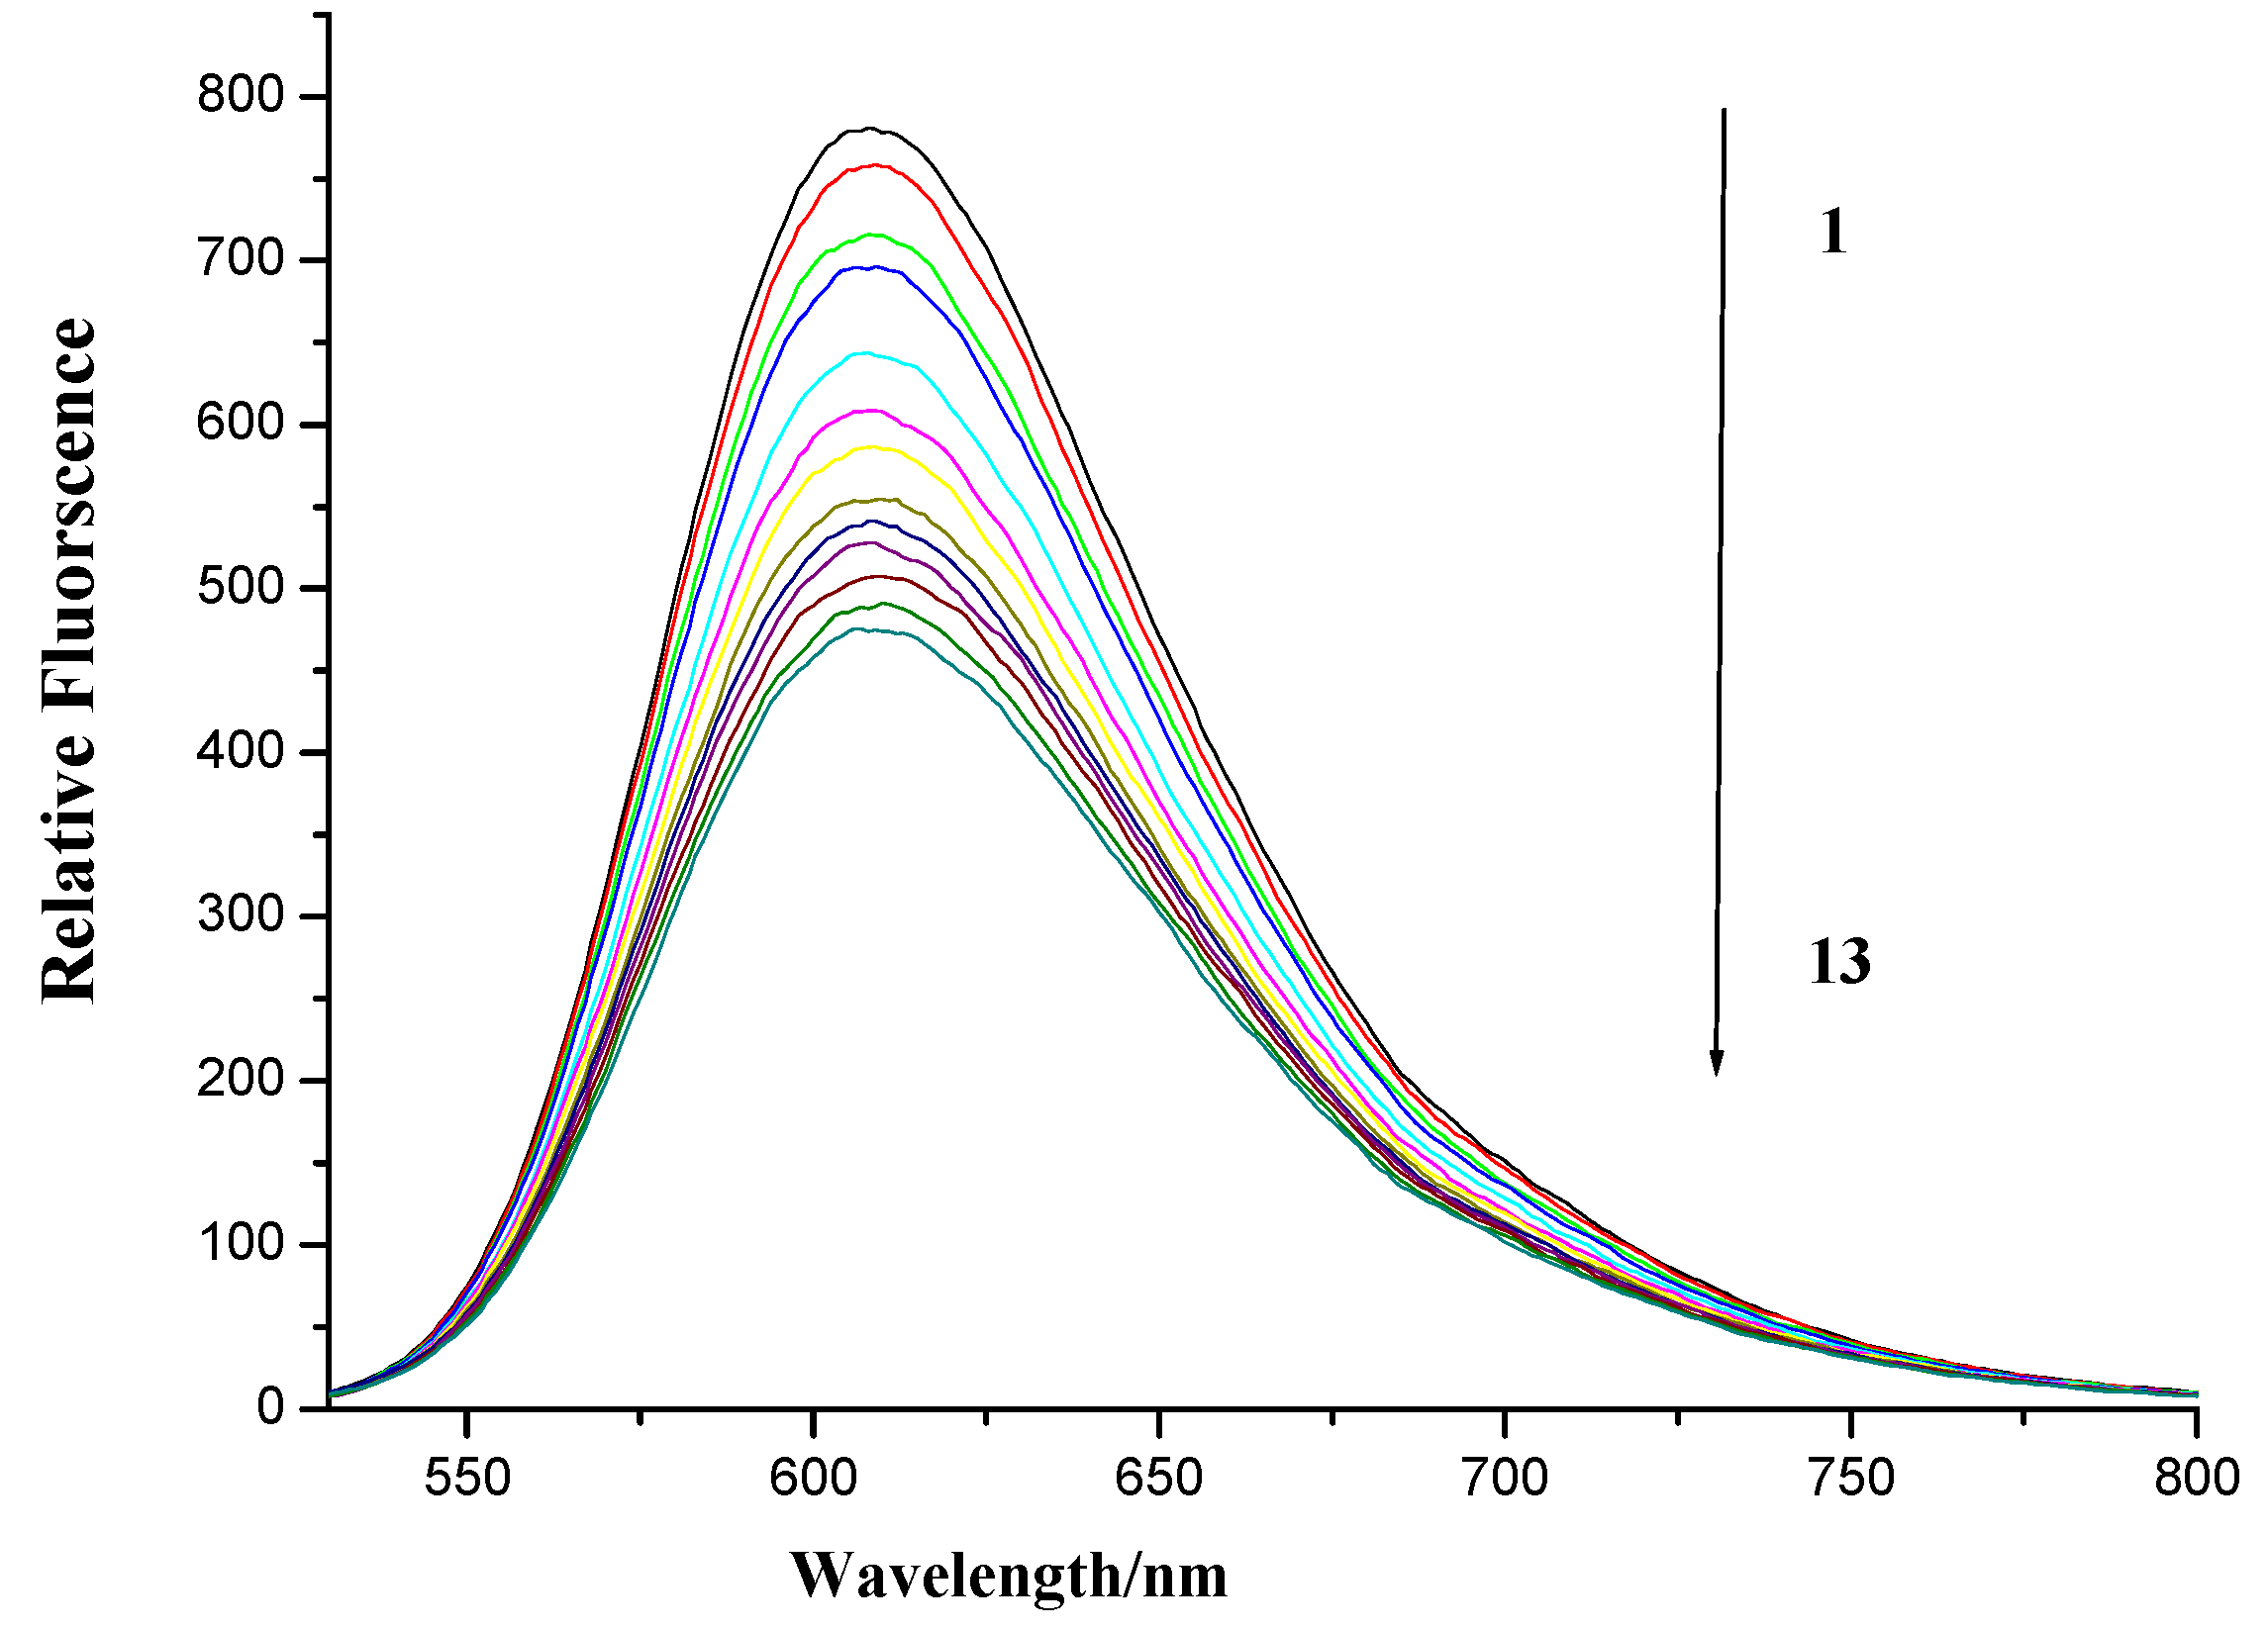
2.5. Fluorescence Spectroscopy

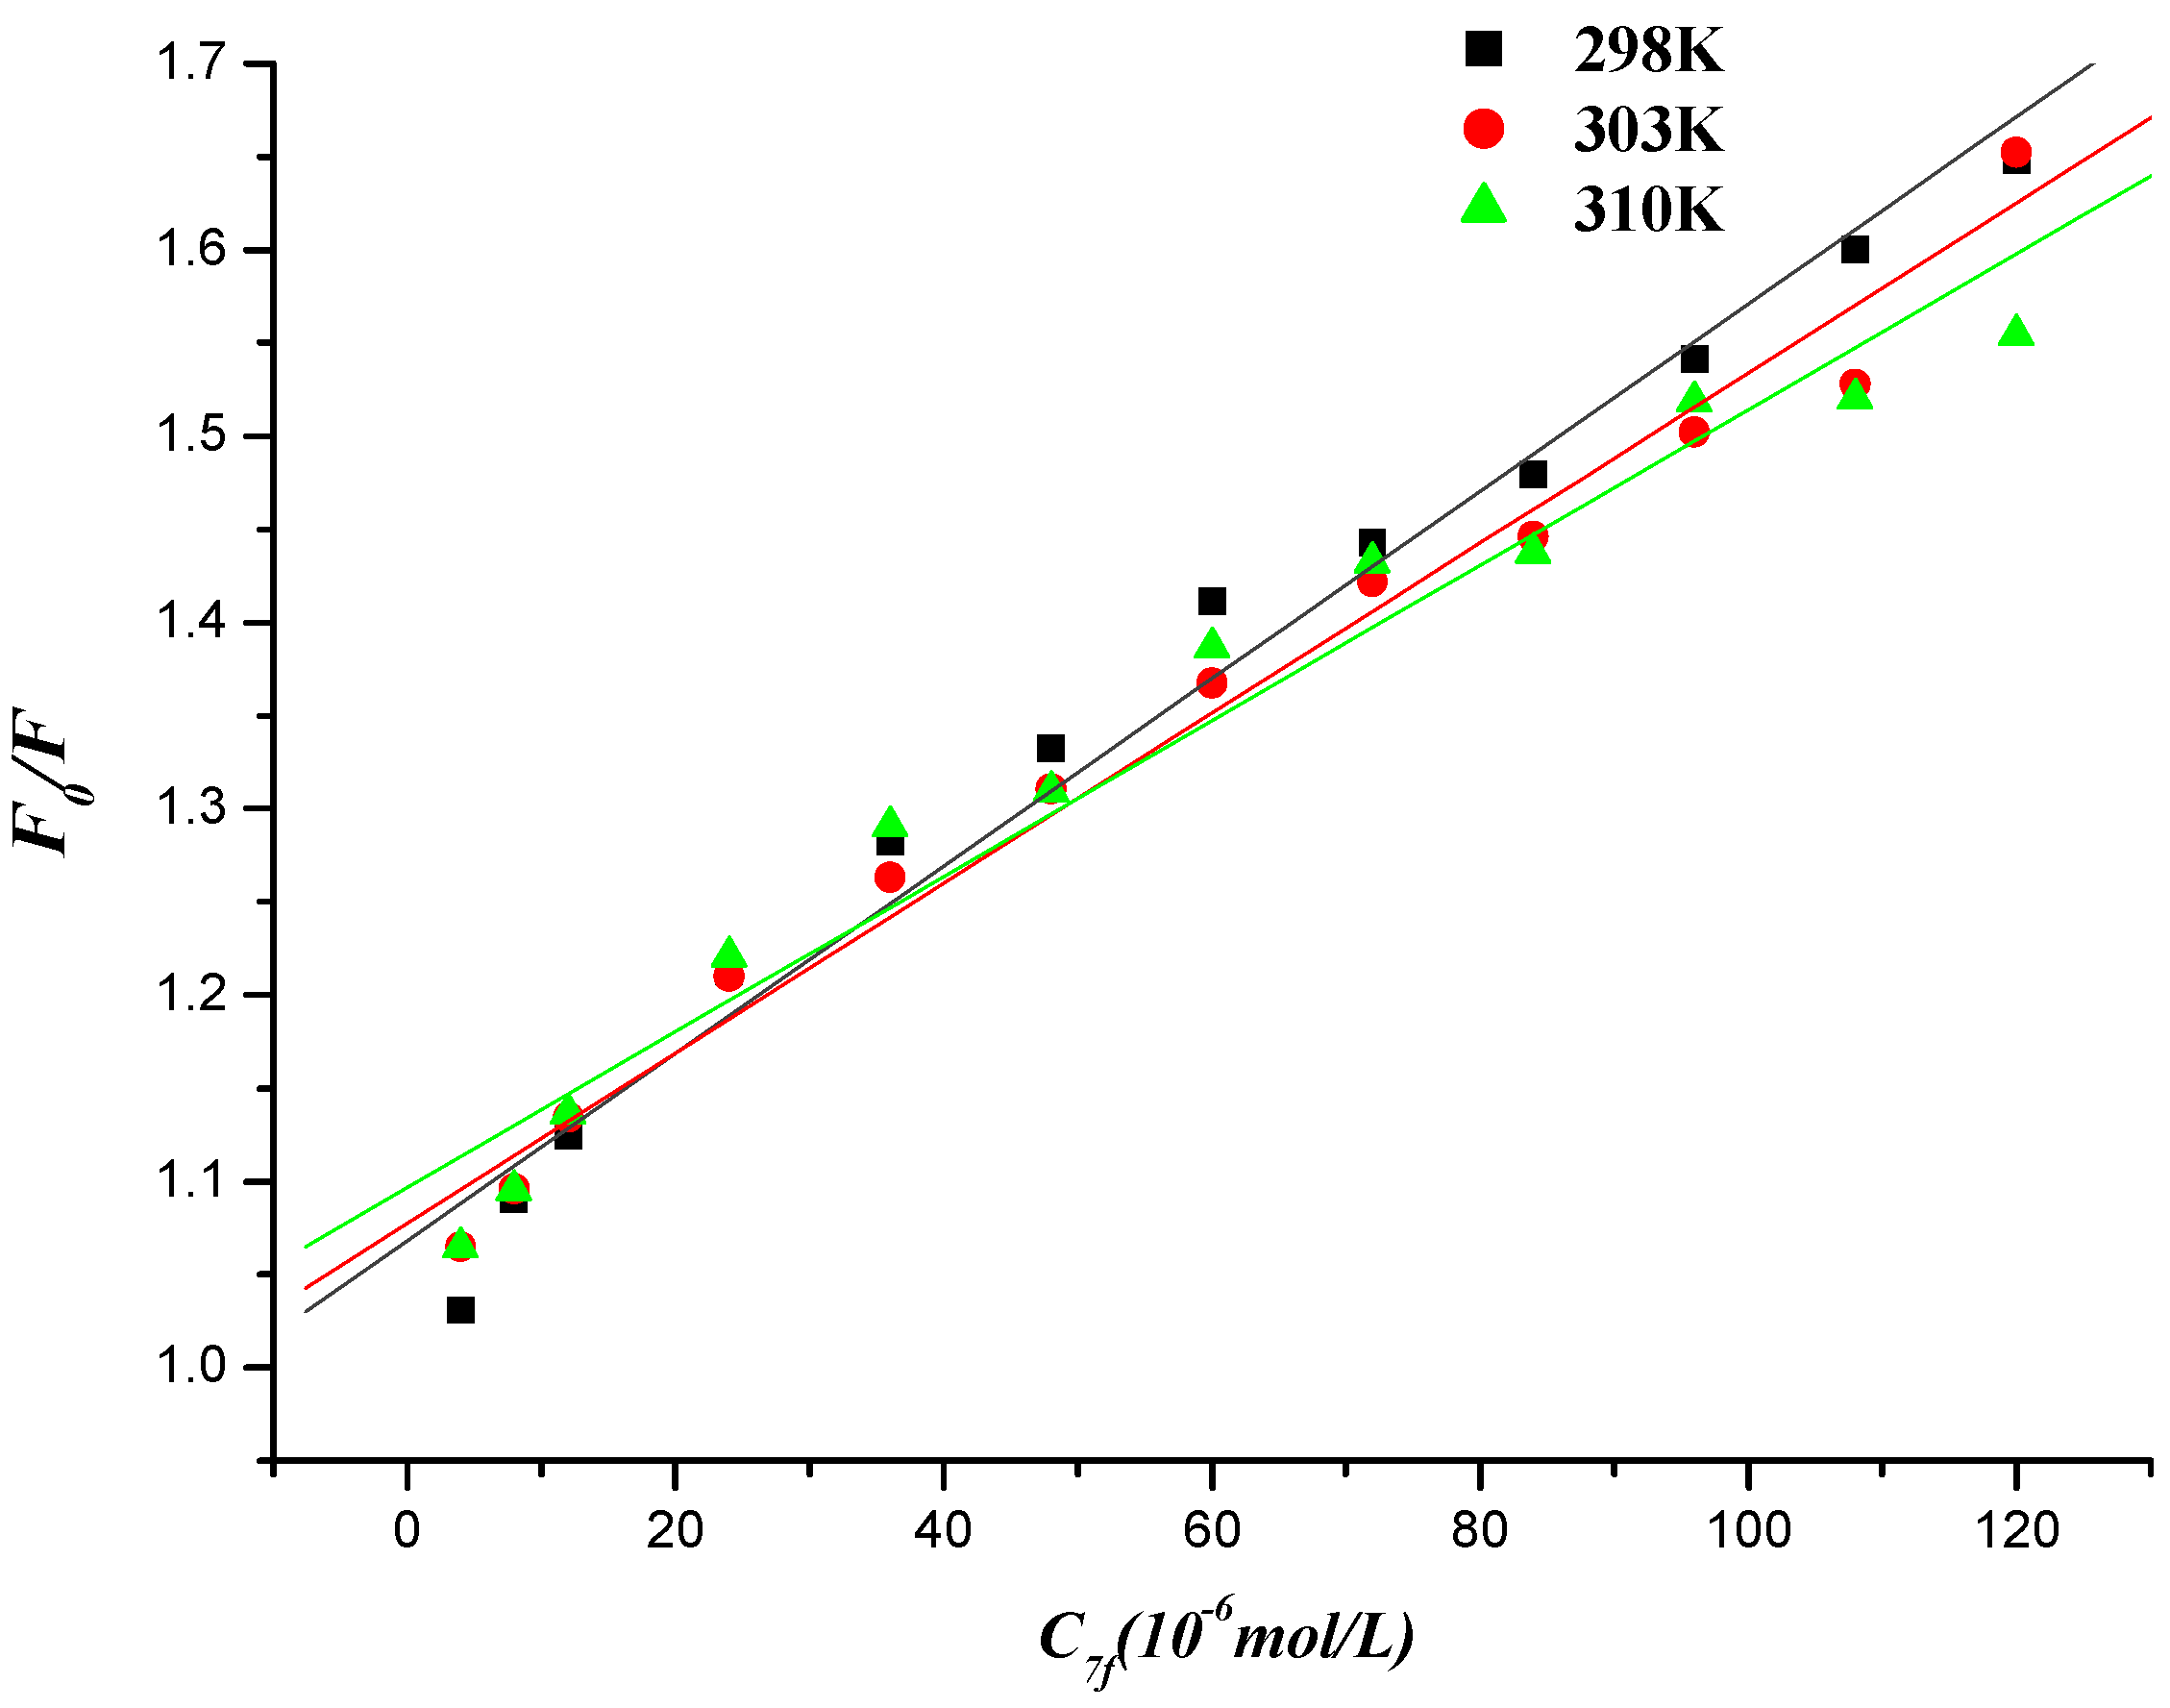
2.5.1. Fluorescence Quenching

To evaluate the DNA binding properties of naphthalimide homospermidine conjugate, the inherent fluorescence of compound 7f allowed us to investigate its interaction with herring sperm DNA by fluorescence spectrometry.
Figure 7. Fluorescence spectroscopy of compound 7f and herring sperm DNA. Numbers 1–13 indicated the DNA concentration: 0.0, 4.56 × 10⁻⁶, 9.13 × 10⁻⁶, 13.69 × 10⁻⁶, 27.4 × 10⁻⁶, 41.08 × 10⁻⁶, 54.77 × 10⁻⁶, 68.46 × 10⁻⁶, 82.15 × 10⁻⁶, 95.84 × 10⁻⁶, 109.54 × 10⁻⁶, 123.23 × 10⁻⁶ and 136.92 × 10⁻⁶ mol∙L−1, respectively. Compound 7f applied was 80 × 10−6 mol∙L−1. Scan condition of compound 7f: EX = 345nm, EM = 355~600 nm; Slits of both EX and EM were 5 nm and 2.5 nm, respectively.
Molecules 19 07646 g007
As is shown in Figure 7, the fluorescence of compound 7f was quenched upon the addition of DNA. This indicated that DNA is one potential target of compound 7f as expected.
Ethidium bromide (EB) is a well known DNA intercalator, which is often used as a spectral probe to establish the mode of binding of small molecules to double-helical DNA [41]. The fluorescence of EB increases after binding with DNA due to intercalation. Like EB, if naphthalimides intercalate into the helix of DNA, it would compete with EB for its intercalation sites in DNA, and the displacement of EB from the DNA–EB complex leads to a significant decrease in the fluorescence intensity of the DNA-EB complex [42,43,44]. Therefore, herring sperm DNA-EB complex in the presence of increasing concentrations of naphthalimide-diamine conjugate 7f was also measured. As is shown in Figure 8, the fluorescence intensity of DNA-EB complex was decreased by gradually growing concentrations of compound 7f, suggesting that compound 7f could intercalate into DNA and a new complex was possibly formed between compound 7f and DNA [45].
Figure 8. Fluorescence spectroscopy of compound 7f with herring sperm DNA-EB. Numbers 1–13 indicated the compound 7f concentration: 0.0, 4 × 10⁻⁶, 8 × 10⁻⁶, 12 × 10−6, 24 × 10−6, 36 × 10−6, 48 × 10−6, 60 × 10−6, 72 × 10−6, 84 × 10−6, 96 × 10−6, 108 × 10−6 and 120 × 10−6 mol∙L−1, respectively. DNA and EB applied was 13.7 × 10⁻⁶ and 15.7 × 10⁻⁶ mol∙L−1, respectively. Scan condition: EX = 510 nm, EM = 520~800 nm; Slits of both EX and EM were 5 nm and 10 nm, respectively.
Molecules 19 07646 g008

2.5.2. Fluorescence Quenching Mechanism

Fluorescence quenching can occur by different mechanisms, which are usually classified as dynamic quenching and static quenching. Dynamic quenching refers to a process whereby the fluorophore and the quencher come into contact during the transient existence of the excited state, so the bimolecular quenching constants would be larger at higher temperatures. Static quenching, however, results from the formation of a ground state complex between the fluorophore and the quencher, which decreases [46]. To elucidate the quenching mechanism of the interaction between naphthalimide-diamine conjugate and DNA (or DNA-EB), fluorescence quenching tests were also performed at 298, 303 and 310 K, which could be described by Stern-Volmer equation [47,48,49].
The Stern–Volmer equation is the following:
F0/F = 1+ K SV c = 1+ K τ0 c
where F0 and F are the fluorescence intensities in the absence and presence of quencher (DNA for compound 7f or compound 7f for DNA-EB, respectively), KSV is the Stern-Volmer quenching constant, [c] is the concentration of DNA (or compound 7f), Kq is the biomolecule quenching rate constant and Kq = KSV0. τ0 is the average lifetime of the molecule without any quencher and the fluorescence lifetime of the biopolymer is 10−8 s [50]. The Stern–Volmer plots of F0/F versus [c] at the three temperatures were shown in Figure 9 and Figure 10, and the calculated KSV and Kq values were presented in Table 2 and Table 3.
Figure 9. Stern-Volmer plot of fluorescence quenching of compound 7f by herring sperm DNA at different temperatures.
Molecules 19 07646 g009
Figure 10. Stern-Volmer plot of fluorescence quenching of herring sperm DNA-EB by compound 7f at different temperatures.
Molecules 19 07646 g010
Table 2. Quenching constants of the interaction between compound 7f and herring sperm DNA at different temperatures.
T/KKSV/(L∙mol−1)Kq/(L∙mol−1)R
2985.567 × 1035.567 × 10110.9956
3034.789 × 1034.789 × 10110.9987
3103.651 × 1033.651 × 10110.9945
Table 3. Quenching constants of the interaction between compound 7f and herring sperm DNA-EB at different temperatures.
T/KKSV/(L∙mol−1)Kq/(L∙mol−1)R
2985.028 × 1035.028 × 10110.9907
3034.564 × 1034.654 × 10110.9922
3104.176 × 1034.176 × 10110.9809
The values of the quenching constant KSV decreased with increasing temperature and the values of Kq were much greater than that of the maximum scattering collision quenching constant (2.000 × 10¹⁰ L∙mol−1), indicating that the fluorescence quenching of compound 7f initiated by DNA or DNA-EB complex initiated by compound 7f was static quenching [51].

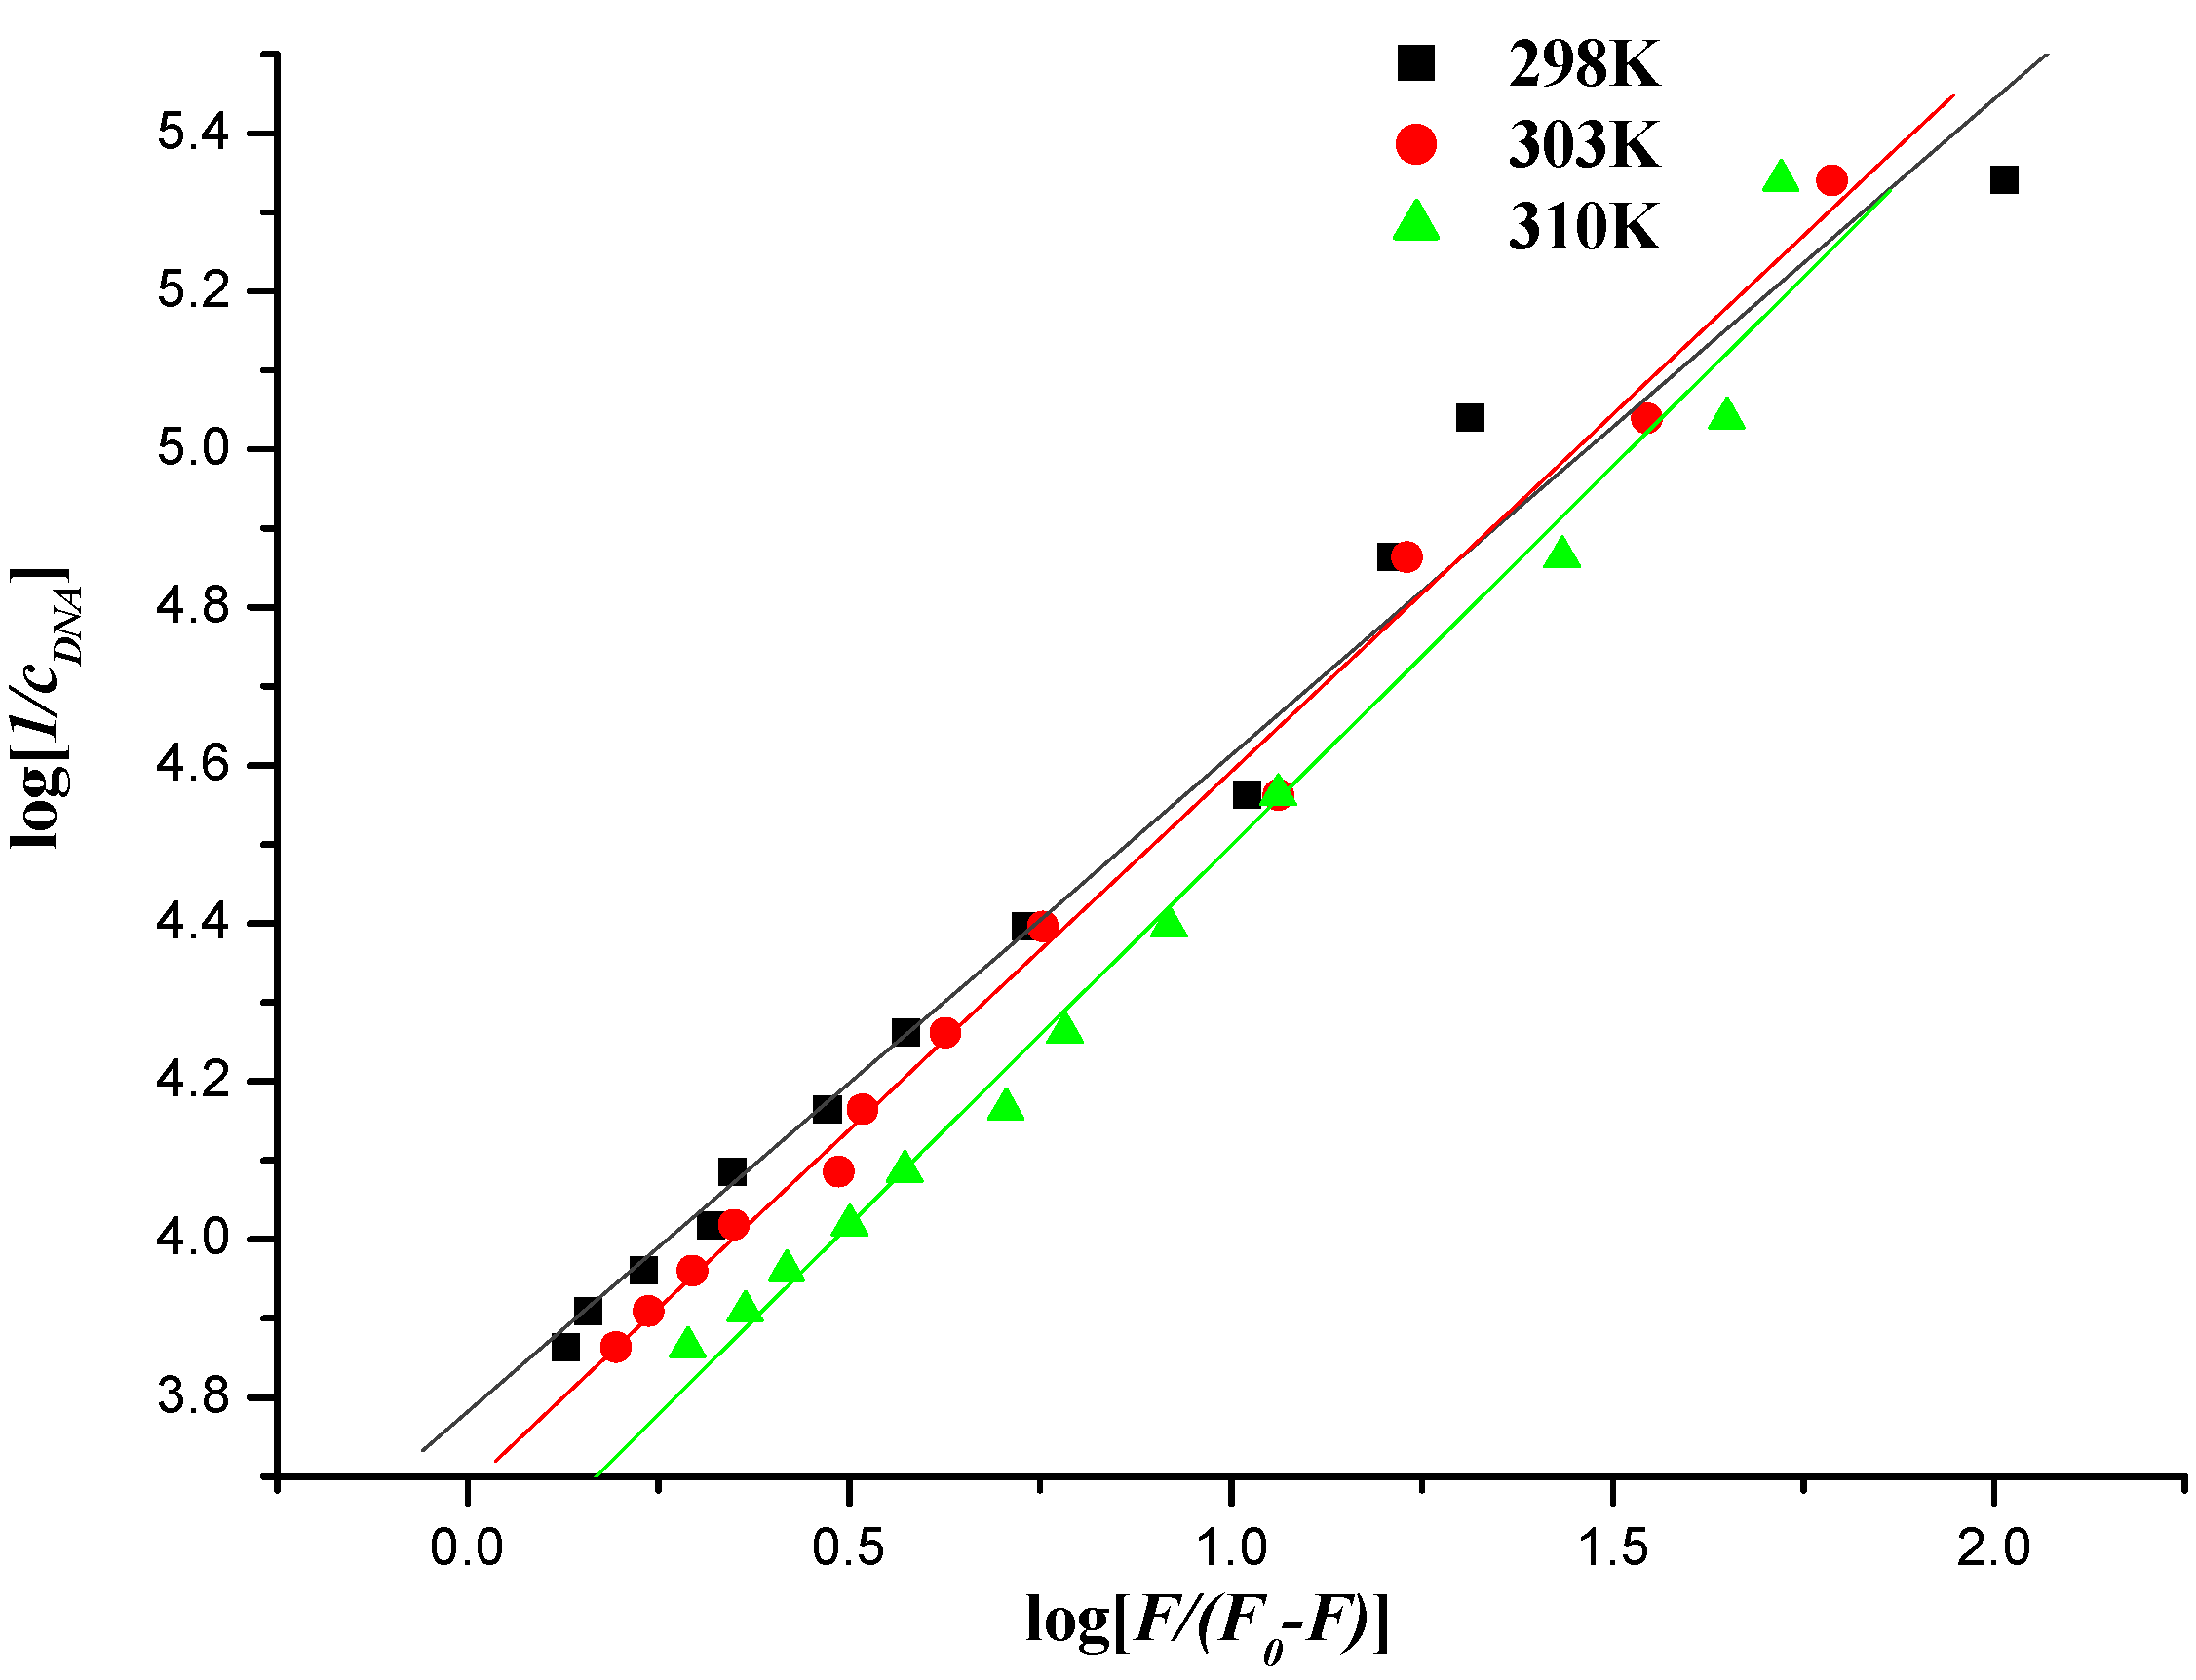
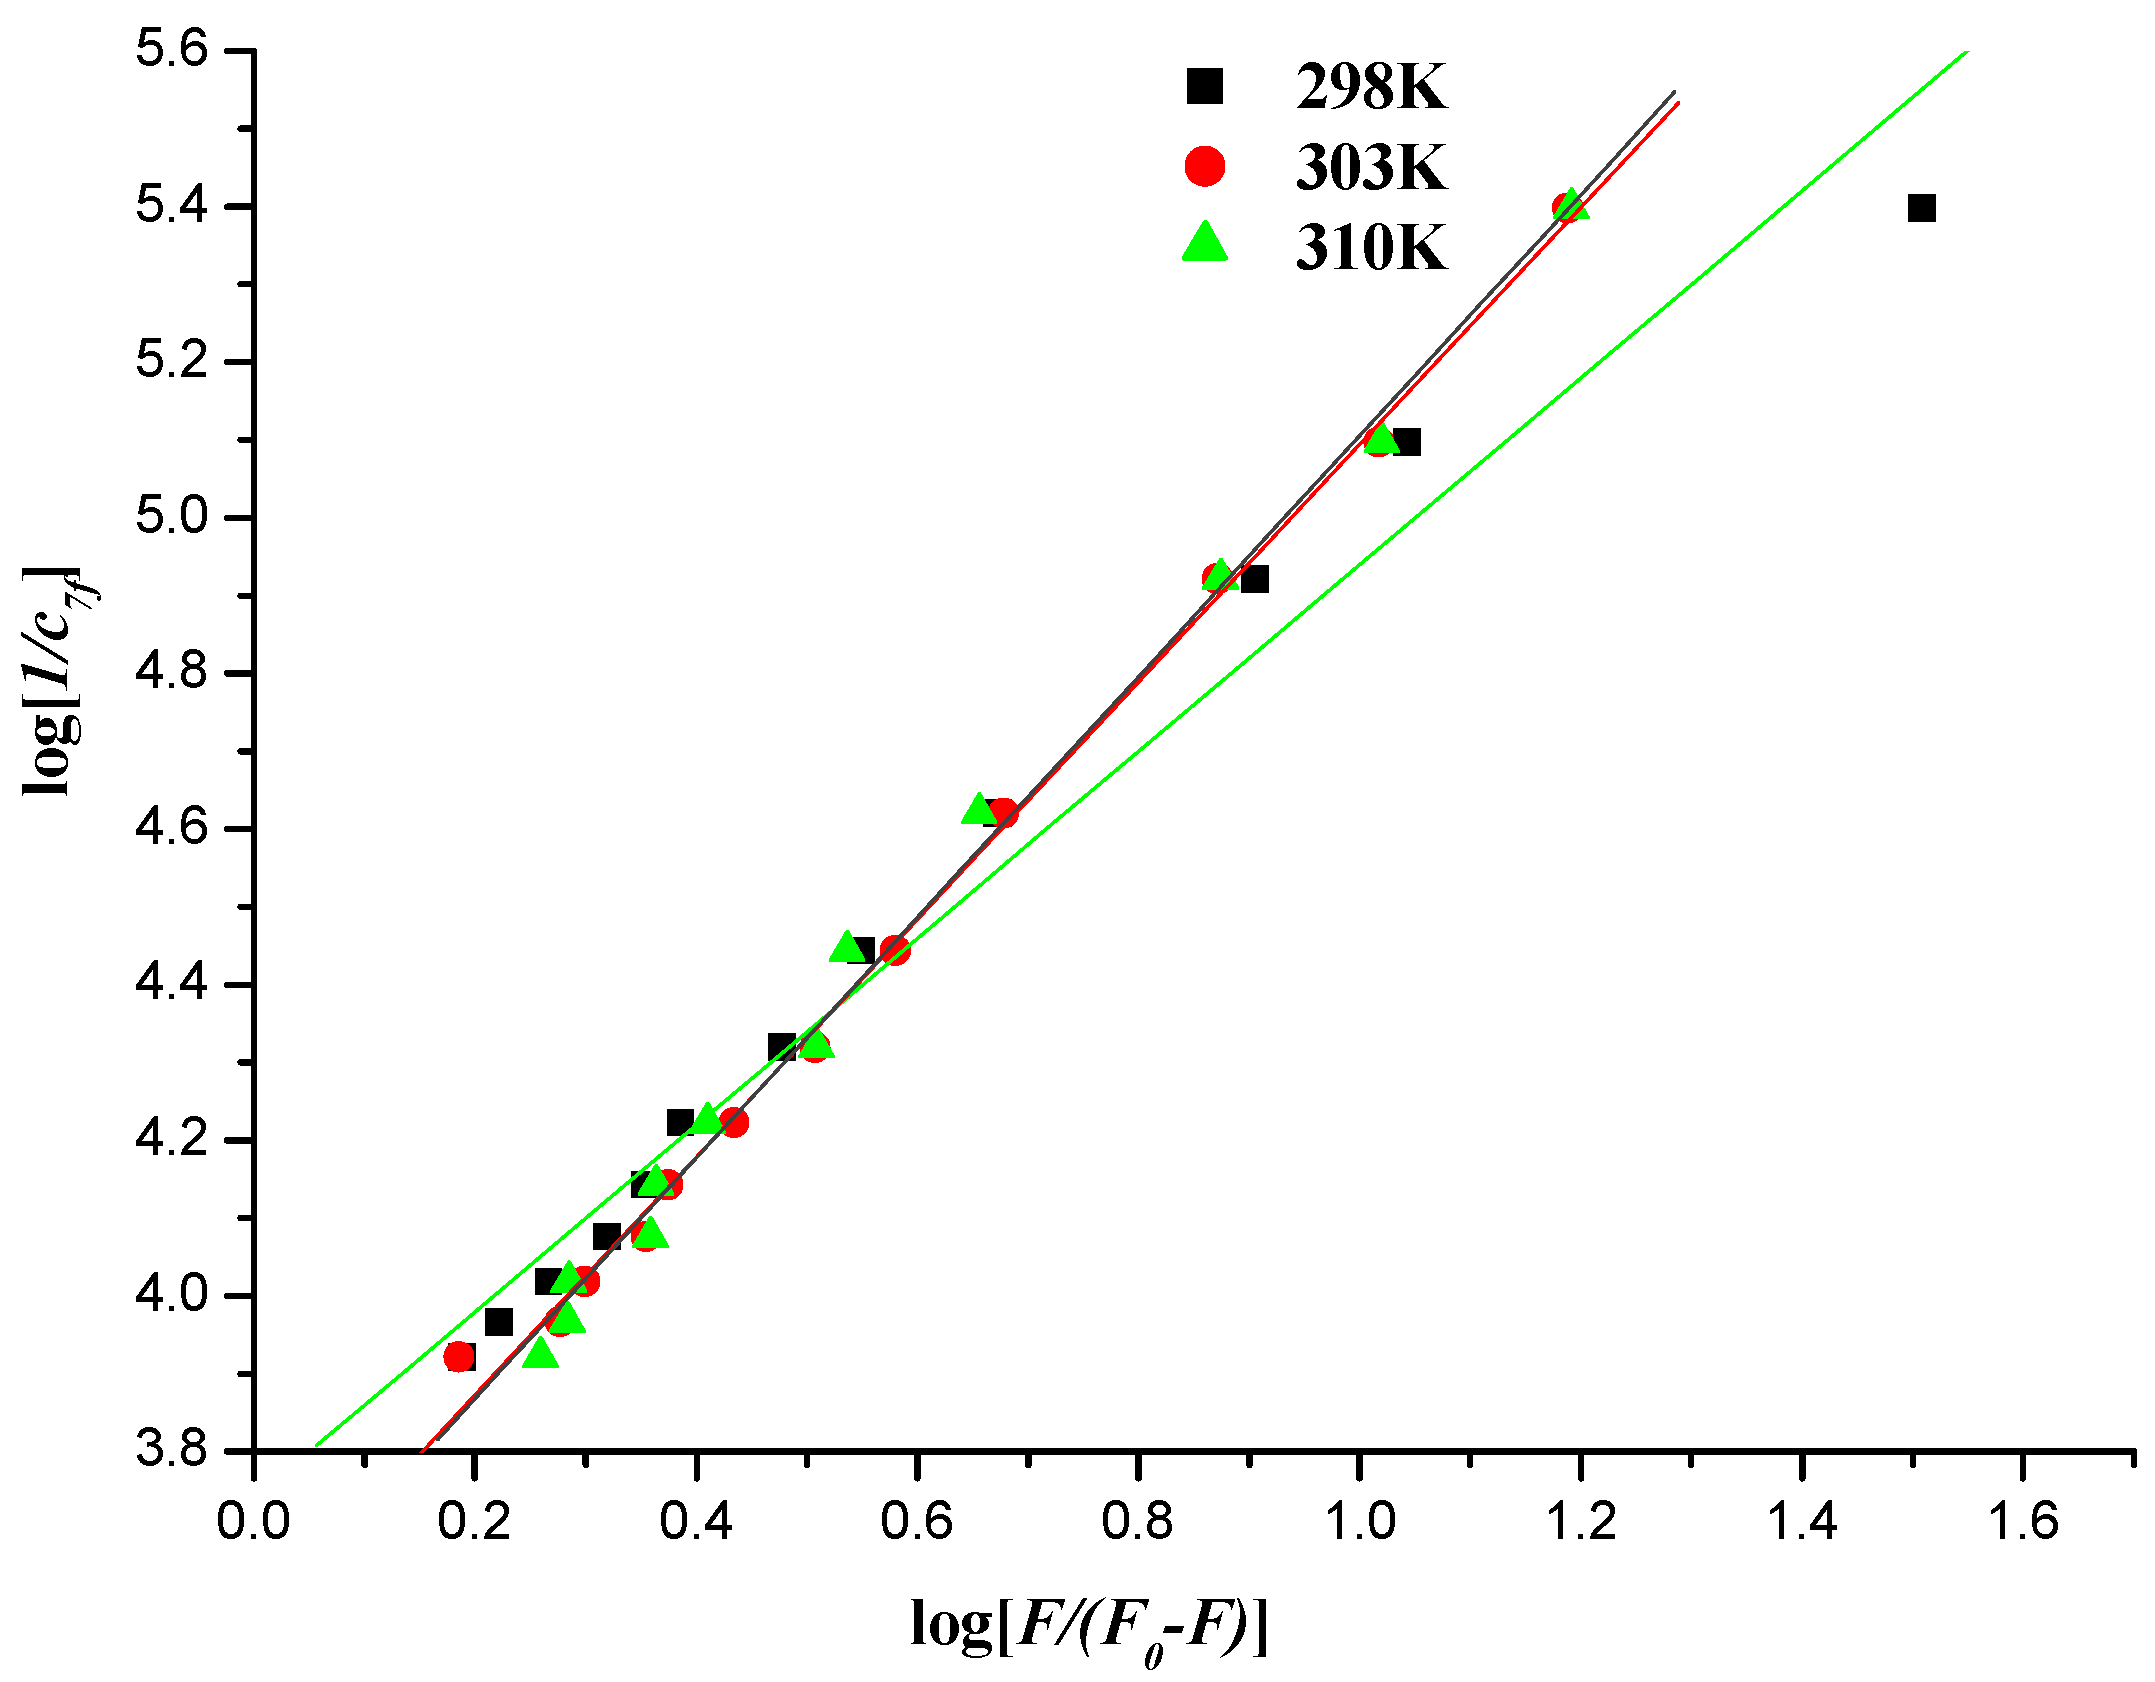
2.5.3. Interaction Mode between Compounds and DNA

When small molecules bind independently to a set of equivalent sites in a macromolecule, the binding constant (Kb) can be determined by the following equation [40,52]:
log[1/c] = log [F/(F0F)] + logKb
where Kb denotes the binding constant for interaction of naphthalimide–DNA, and F0, F, [c] have the same meanings as in Equation (2).
Figure 11. Plot of log [1/cDNA] versus log [F/(F0F)] of the interaction between compound 7f and herring sperm DNA at different temperatures.
Molecules 19 07646 g011
Figure 12. Plot of log [1/c7f] versus log [F/(F0F)] of the interaction between compound 7f and herring sperm DNA-EB at different temperatures.
Molecules 19 07646 g012
Table 4. Binding constants and thermodynamic parameters of the interaction between compound 7f and herring sperm DNA at different temperatures.
T/KKb/(kJ∙mol−1)/(kJ∙mol−1)/(kJ∙mol−1)/(kJ∙mol−1)R
2986.059 × 103−21.578−32.983−0.03830.9897
3034.864 × 103−21.387−32.983−0.03830.9965
3103.462 × 103−21.004−32.983−0.03830.9923
Table 5. Binding constants and thermodynamic parameters of the interaction between compound 7f and herring sperm DNA-EB at different temperatures.
T/KKb/(kJ∙mol−1)/(kJ∙mol−1)/(kJ∙mol−1)/(kJ∙mol−1)R
2985.482 × 103−21.330−59.229−0.1270.9884
3033.695 × 103−21.172−59.229−0.1270.9982
3103.611 × 103−21.112−59.229−0.1270.9975
The values of Kb could be measured from the intercept and slope by plotting log [1/c] against log [F/(F0F)] (intercept = log Kb) (Figure 11 and Figure 12), and the corresponding values of Kb were listed in Table 4 and Table 5. The down-regulated trend of Kb with increasing temperature was in accordance with KSVs dependence on temperature as mentioned above, implying that the binding between naphthalimide and DNA was moderate, and a reversible naphthalimide-DNA complex might be formed [53].
There are several acting forces between a small organic molecule and biomacromolecules, such as hydrophobic force, hydrogen bond, van der Waals force, electrostatic interactions, etc. It is assumed that the interaction enthalpy change (∆H°) does not vary significantly over the limited temperature range studied, thus the thermodynamic parameters can be calculated from the van’t Hoff equation:
ln (K2/K1) = (1/T1 − 1/T2) ∆H°/R
G° = −RT lnK =H° − TS°
In Equations (4) and (5), K is analogous to the binding constant at the corresponding temperature and R is gas constant. The enthalpy change (∆H°) and entropy change (∆S°) were calculated from the Equations (4) and (5), and the corresponding results were listed in Table 4 and Table 5. From Table 4 and Table 5, it can be seen that the negative ∆H° and negative ∆S° values showed that the hydrogen bond and weak van der Waals played a dominant role in the interactions between compound 7f and DNA [54].
Kenaka [55] found that hydrogen bonding was the main feature of DNA intercalating agents, and the present evidences indicated that compound 7f was a DNA intercalator. Therefore, it was inferred that the process of interaction between compound 7f and DNA was driven by hydrogen bonding and van der Waals forces. It was also inferred that planar structure of naphthalene ring intercalated into the DNA base pairs when compound 7f bound to DNA between the double helix and that the hydrogen bond and weak van der Waals played a dominant role in the interactions between compound 7f and DNA.

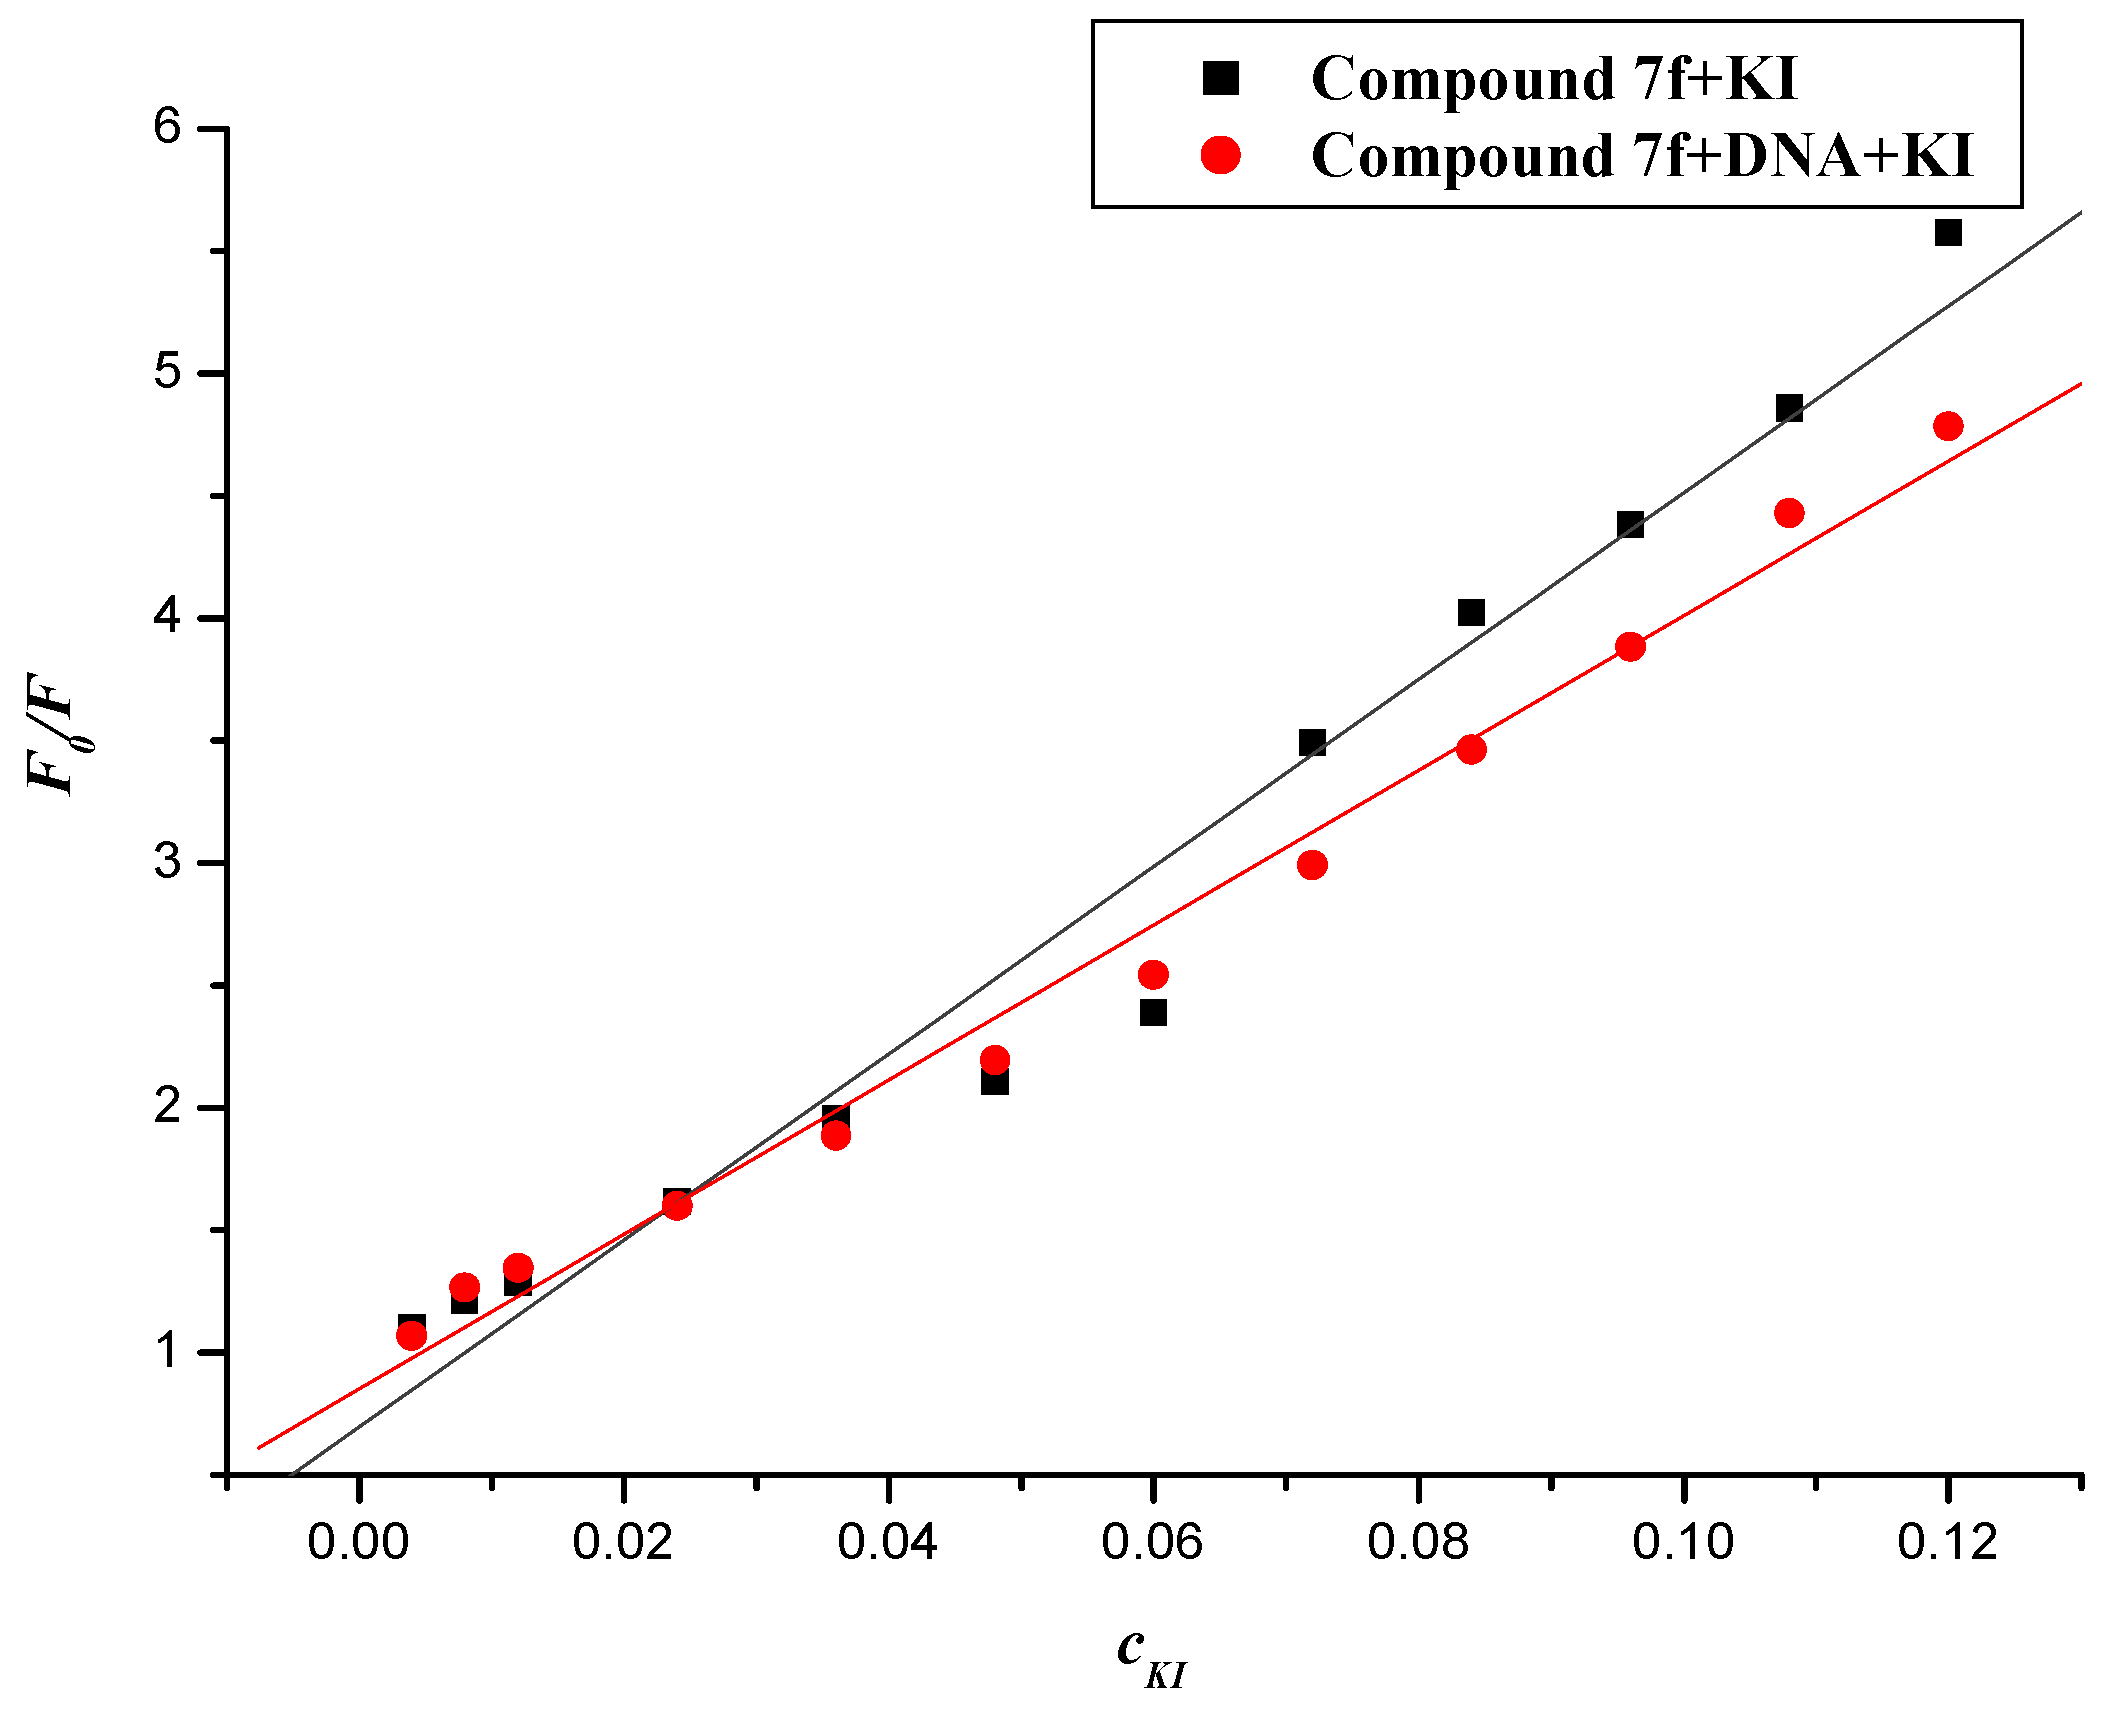
2.5.4. Iodide Quenching Studies

A highly negatively charged quencher is expected to be repelled by the negatively charged phosphate backbone of DNA, therefore an intercalative bound drug molecules should be protected from being quenched by anionic quencher, but the free aqueous complexes or groove binding drugs should be quenched readily by anionic quenchers. At the same time, whether the quencher accesses to fluorophore also plays a role in free and bound one [56].
Figure 13. Fluorescence quenching plots of compound 7fwith KI in the absence and presence of DNA. c(7f) = 20 × 10−6 mol∙L−1; c(DNA) = 22.84 × 10⁻⁶ mol∙L−1; the KI concentration was 4~120 × 10−3 mol∙L.
Molecules 19 07646 g013
Negatively charged I was selected for this purpose. The quenching constants (Ksv) were obtained from the Stern–Volmer equation. The values of Ksv of compound 7f with I ion in the absence and presence of DNA were 38.178 and 31.575 (L∙mol−1), respectively (shown in Figure 13). It was apparent that iodide quenching effect was decreased when compound 7f was bound to DNA, which suggested that the compound 7f is likely intercalated into the base pairs of DNA.

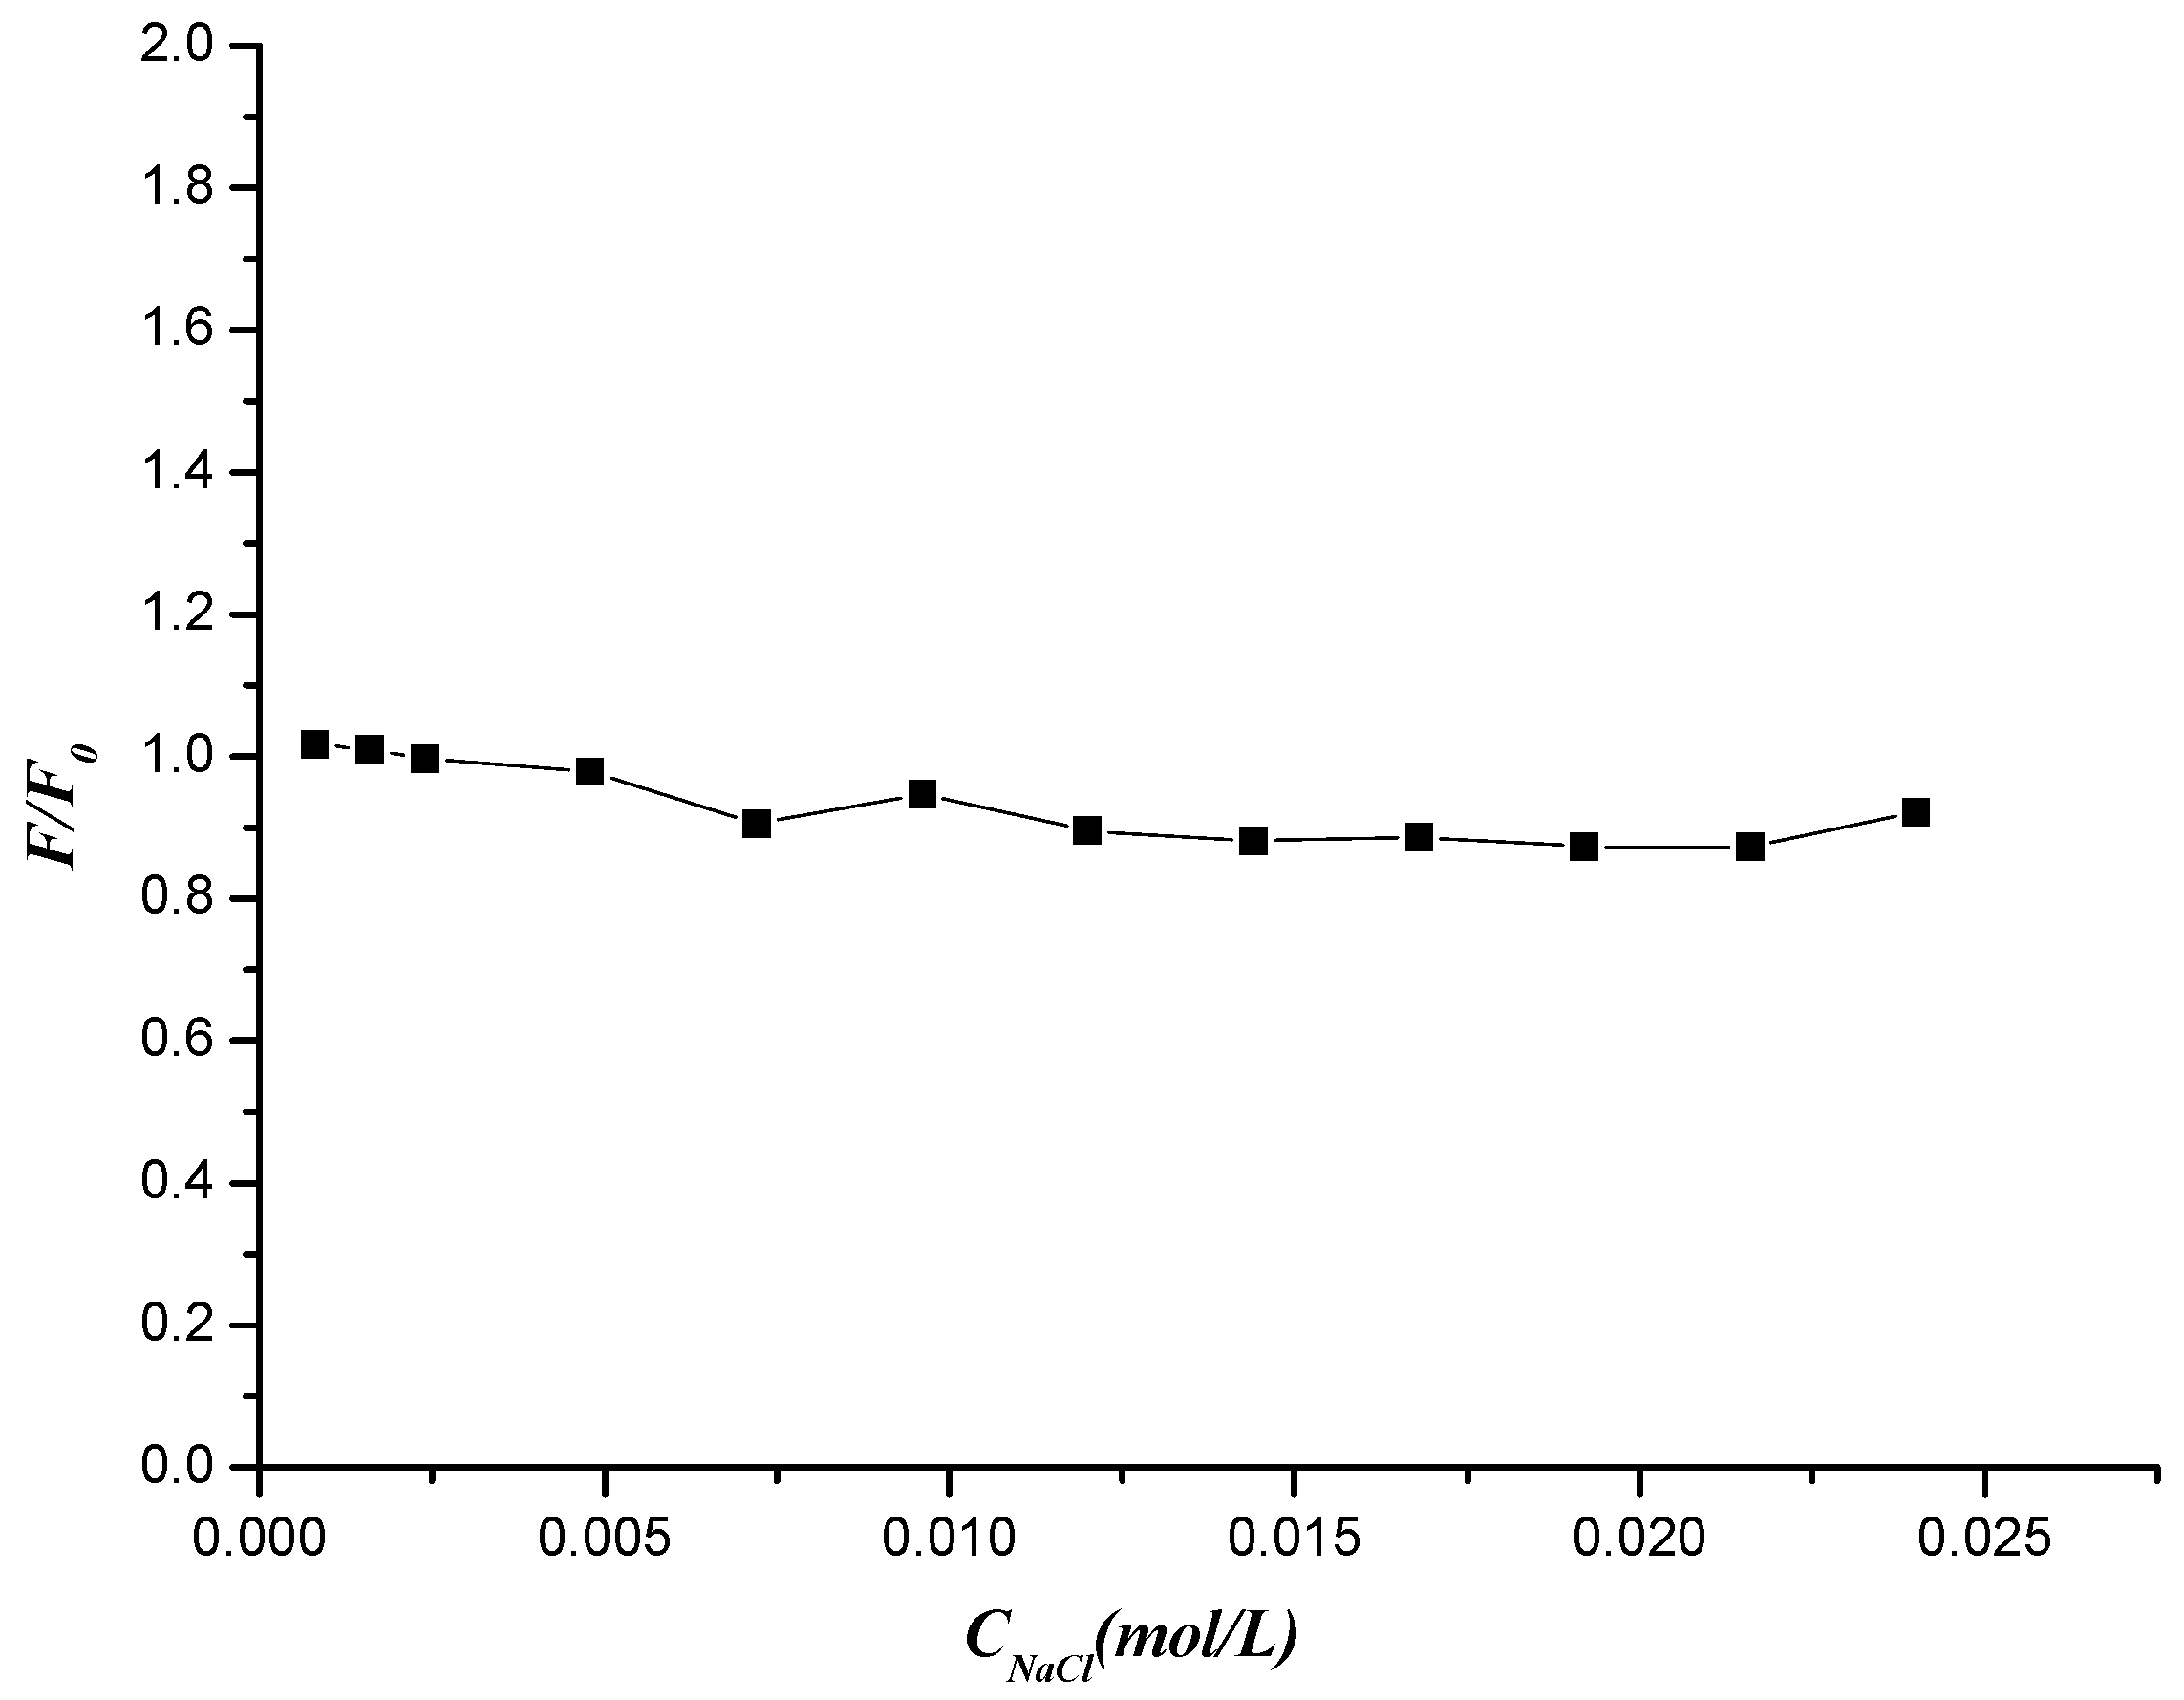
2.5.5. Effect of Ionic Intensity on the Compound 7f and DNA Interaction

DNA is an anionic polyelectrolyte with phosphate groups and monitoring the spectral change with different ionic strength is an efficient method to distinguish the binding modes between molecules and DNA. NaCl is used to control the ionic strength of the solutions. The addition of Na+ would attenuate the electrostatic interaction between molecules and DNA because of its competition for phosphate groups in DNA [57]. Hence the effect of NaCl on the fluorescence of DNA–compound 7f system was studied. As is seen from Figure 14, the fluorescence intensity of compound 7f-DNA complex was basically unchanged with increasing concentration of NaCl. The results revealed that interaction between compound 7f and DNA could exclude the electrostatic interaction mode and was prompted by hydrogen bond and van der Waals force.
Figure 14. Effects of NaCl on the fluorescence intensity of compound 7f-DNA system.
Molecules 19 07646 g014

3. Experimental Section

3.1. General Information

All chemicals (reagent grade) used were commercially available. All the 1H-NMR and 13C-NMR spectra were recorded on a Bruker AV-400 model spectrometer in D2O. Chemical shifts (δ) for 1H-NMR spectra were reported in parts per million to residual solvent protons. ESI-MS spectra were recorded on an ESQUIRE-LC Mass spectrometer. Elemental analyses were performed on a Gmbe VarioEL Elemental instrument and were within 0.4% of the theoretical values.

3.2. Synthesis of Naphthalimide-Diamine Conjugates

The Boc-protected amine 5 (3 mmol) was dissolved in anhydrous acetonitrile (30 mL), and solid K2CO3 (0.69 g, 5 mmol) was added. After the mixture was stirred for 15 minutes at ambient temperature, N-(3–bromopropyl)-1,8-naphthalimide (4a) (or N-(4–bromobutyl)-1,8-naphthalimide (4b) and N-(5–bromopentyl)-1,8-naphthalimide (4c), 2 mmol) in acetonitrile (10 mL) was added dropwise with constant stirring at 45 °C, then the reaction mixture was stirred overnight. The volatiles were removed under vacuum to give a residue which was redissolved in CHCl3 (30 mL) and washed with aqueous Na2CO3 (10%, w/v). The organic phase was separated, dried over anhydrous Na2SO4, filtered, and concentrated. The above residue was dissolved in methanol (30 mL), a solution of di-tert-butyl dicarbonate (3 mmol) in methanol (10 mL) was added dropwise and stirred at ambient temperature overnight. The solvents were removed under reduced pressure to give a residue, which was redissolved in CHCl3 (30 mL) and washed with water. The organic phase was separated, dried over anhydrous Na2SO4, filtered, and concentrated. The residue was subjected to flash chromatography (20% Petroleum /EtOAc, v/v, Rf = 0.25) to obtain the Boc protected intermediates 6.
The respective N-Boc-protected amine (1.2 mmol) was dissolved in EtOH (20 mL) and stirred at 0 °C for 10 min. 4 M HCl (15 mL) was added dropwise at 0 °C. The reaction mixture was stirred at room-temperature overnight. The solution typically gave a bright white solid as a precipitate. The solid was filtered, washed several times with absolute ethanol and dried under vacuum to give the pure target compounds 7.
2-[3-(2-Aminoethylamino)propyl]1H-benz-[de]isoquinoline-1,3(2H)-dione dihydrochloride (7a). Yield: 76.3%; m.p.: 233.4–235.1 °C; 1H-NMR (D2O) δ: 7.37 (d, 2H, J = 8.0 Hz), 7.33 (d, 2H, J = 7.2 Hz), 7.0 (t, 2H, J = 7.6 Hz), 3.55 (t, 2H,J = 7.2 Hz), 3.46 (s, 4H), 3.15 (t, 2H,J = 8.0 Hz), 1.83 (t, 2H,J = 6.8 Hz); 13C-NMR (D2O) δ: 163.75, 134.73, 130.76, 129.54, 126.52, 125.10, 118.75, 45.79, 44.35, 37.16, 35.50, 24.11; ESI-MS m/z: 298.2 (M+H-2HCl)+; Anal. calcd. for C17H21Cl2N3O2 C, 55.14; H, 5.72; N, 11.35; found: C, 54.83; H, 5.48; N, 10.94.
2-[4-(2-Aminoethylamino)butyl]1H-benz-[de]isoquinoline-1,3(2H)-dione dihydrochloride (7b). Yield: 58.1%; m.p.: 243.1–244.1 °C; 1H-NMR (D2O) δ: 7.39 (d, 2H, J = 8.0 Hz), 7.00 (d, 2H, J = 7.2 Hz), 7.12 (t, 2H, J = 7.6 Hz), 3.43–3.47 (m, 6H), 3.18 (t, 2H, J = 8.0 Hz), 1.71–1.74 (m, 2H), 1.45–1.46 (m, 2H); 13C-NMR (D2O) δ: 163.84, 134.60, 130.69, 129.59, 126.48, 125.17, 118.95, 47.60, 44.13, 39.47, 35.49, 23.99, 23.18; ESI-MS m/z: 312.2 (M+H-2HCl)+; Anal. calcd. for C18H23Cl2N3O2·0.5H2O: C, 56.26; H, 6.03; N, 10.93; found: C, 56.18; H, 5.76; N, 10.66.
2-[5-(2-Aminoethylamino)pentyl]1H-benz-[de]isoquinoline-1,3(2H)-dione dihydrochloride (7c). Yield: 63.7%; m.p.: 233.8–235.1 °C; 1H-NMR (D2O) δ: 7.42 (d, 2H, J = 8.0 Hz), 7.35 (d, 2H, J = 7.2 Hz), 7.02 (t, 2H, J = 7.6 Hz), 3.40–3.45 (m, 6H), 3.15 (t, 2H, J = 8.0 Hz), 1.73–1.77 (m, 2H), 1.36–1.38 (m, 4H); 13C-NMR (D2O) δ: 163.89, 134.54, 130.67, 129.64, 126.46, 125.23, 119.06, 48.08, 44.12, 39.86, 35.48, 26.40, 25.10, 23.21; ESI-MS m/z: 326.2 (M+H-2HCl)+; Anal. calcd. for C19H25Cl2N3O2·0.3H2O: C, 56.52; H, 6.39; N, 10.41; N, 10.09; found: C, 56.70; H, 6.10; N, 10.13.
2-[3-(3-Aminopropylamino)propyl]1H-benz-[de]isoquinoline-1,3(2H)-dione dihydrochloride (7d). Yield: 68.8%; m.p.: 233.1–234.2 °C; 1H-NMR (D2O) δ: 7.60 (d, 2H, J = 8.0 Hz), 7.57 (d, 2H, J = 7.2 Hz), 7.18 (t, 2H, J = 7.6 Hz), 3.69 (t, 2H,J = 7.2 Hz), 3.11–3.24 (m, 6H), 2.14–2.16 (m, 2H), 1.89–1.93 (m, 2H); 13C-NMR (D2O) δ: 164.20, 134.93, 130.98, 129.91, 126.68, 125.55, 119.18, 45.43, 44.72, 37.27, 36.61, 24.16, 23.79; ESI-MS m/z: 312.2 (M+H-2HCl)+; Anal. calcd. For C18H23Cl2N3O2·0.5H2O: C, 56.26; H, 6.03; N, 10.93; found: C, 56.29; H, 5.88; N, 10.69.
2-[5-(3-Aminopropylamino)pentyl]1H-benz-[de]isoquinoline-1,3(2H)-dione dihydrochloride (7e). Yield: 72.5%; m.p.: 238.6–239.8 °C; 1H-NMR (D2O) δ: 7.36 (d, 2H, J = 8.0 Hz), 7.29 (d, 2H, J = 7.2 Hz), 6.97 (t, 2H, J = 7.6 Hz), 3.36 (t, 2H, J = 7.2 Hz), 3.06–3.20 (m, 6H), 2.11–2.15 (m, 2H), 1.70–1.72 (m, 2H), 1.30–1.34 (m, 4H); 13C-NMR (D2O) δ: 163.78, 134.49, 130.60, 129.55, 126.41, 125.12, 118.95, 47.69, 44.51, 39.85, 36.61, 26.40, 25.07, 23.79, 23.26; ESI-MS m/z: 340.3 (M+H-2HCl)+; Anal. calcd. for C20H27Cl2N3O2·0.3H2O: C, 57.50; H, 6.66; N, 10.06; found: C, 57.52; H, 6.30; N, 9.78.
2-[3-(4-Aminobutylamino)propyl]1H-benz-[de]isoquinoline-1,3(2H)-dione dihydrochloride (7f). Yield: 69.7%; m.p.: 235.1–235.9 °C; 1H-NMR (D2O) δ: 7.59 (d, 2H, J = 8.0 Hz), 7.56 (d, 2H, J = 7.2 Hz), 7.17 (t, 2H, J = 7.6 Hz), 3.66 (t, 2H, J = 7.2 Hz), 3.01–3.11 (m, 6H), 1.76–1.88 (m, 6H); 13C-NMR (D2O) δ: 164.00, 134.70, 130.75, 129.69, 126.44, 125.35, 119.97, 46.83, 44.99, 39.58, 37.03, 23.91, 23.72, 22.56; ESI-MS m/z: 326.2 (M+H-2HCl)+; Anal. calcd. for C19H25Cl2N3O2·0.5H2O: C, 56.02; H, 6.43; N, 10.32; found: C, 56.29; H, 6.26; N, 10.69.
2-[4-(4-Aminobutylamino)butyl]1H-benz-[de]isoquinoline-1,3(2H)-dione dihydrochloride (7g). Yield: 78.6%; m.p.: 226.7–228.3 °C; 1H-NMR (D2O) δ: 7.75 (d, 2H, J = 8.0 Hz), 7.72 (d, 2H, J = 7.2 Hz), 7.31 (t, 2H, J = 7.6 Hz), 3.70 (t, 2H, J = 7.2 Hz), 3.11–3.20 (m, 6H), 1.78–1.86 (m, 6H), 1.60–1.63 (m, 2H); 13C-NMR (D2O) δ: 163.92, 134.66, 130.74, 129.68, 126.52, 125.27, 119.04, 47.08, 46.92, 39.52, 38.86, 24.10, 23.97, 23.19, 22.83; ESI-MS m/z: 340.3 (M+H-2HCl)+; Anal. calcd. for C20H27Cl2N3O2: C, 58.25; H, 6.60; N, 10.19; found: C, 56.14, H, 5.88, N, 10.69.
2-[5-(4-Aminobutylamino)pentyl]1H-benz-[de]isoquinoline-1,3(2H)-dione dihydrochloride (7h). Yield: 59.6%; m.p.: 236.6–237.9 °C; 1H-NMR (D2O) δ: 7.29 (d, 2H, J = 8.0 Hz), 7.21 (d, 2H, J = 7.2 Hz), 6.90 (t, 2H, J = 7.6 Hz), 3.30 (t, 2H, J = 7.2 Hz), 3.03–3.13 (m, 6H), 1.79–1.81 (m, 4H), 1.68–1.71 (m, 2H), 1.27–1.32 (m, 4H); 13C-NMR (D2O) δ: 163.66, 134.44, 130.54, 129.48, 126.38, 125.02, 118.87, 47.54, 46.92, 39.84, 38.88, 26.41, 25.08, 24.00, 23.31, 22.83; ESI-MS m/z: 354.3 (M+H-2HCl)+; Anal. calcd. for C21H29Cl2N3O2·0.7H2O: C, 57.46; H, 6.98; N, 9.57; found: C, 57.39; H, 6.92; N, 9.37.
2-[3-(6-Aminohexylamino)propyl]1H-benz-[de]isoquinoline-1,3(2H)-dione dihydrochloride (7i). Yield: 60.7%; m.p.: 230.6–231.8 °C; 1H-NMR (D2O) δ: 7.62 (d, 2H, J = 8.0 Hz), 7.58 (d, 2H, J = 7.2 Hz), 7.19 (t, 2H, J = 7.6 Hz), 3.68 (t, 2H, J = 7.2 Hz), 3.00–3.10 (m, 6H), 1.88–1.91 (m, 2H), 1.69–1.76 (m, 4H), 1.43-1.47 (m, 4H); 13C-NMR (D2O) δ: 164.22, 134.94, 130.98, 129.94, 126.70, 125.50, 119.22, 47.65, 45.08, 39.38, 37.31, 26.50, 25.36, 25.27, 25.16, 24.16; ESI-MS m/z: 354.3 (M+H-2HCl)+; Anal. calcd. for C21H29Cl2N3O2·1.0H2O: 56.76; H, 7.03; N, 9.46; found: C, 56.85; H, 6.71; N,9.85.
2-[4-(6-Aminohexylamino)butyl]1H-benz-[de]isoquinoline-1,3(2H)-dione dihydrochloride (7j). Yield: 64.5%; m.p.: 235.9–237.2 °C; 1H-NMR (D2O) δ: 7.57(d, 2H, J = 8.0 Hz), 7.52 (d, 2H, J = 7.2 Hz), 7.15 (t, 2H, J = 7.6 Hz), 3.54 (t, 2H, J = 7.2 Hz), 2.98–3.09 (m, 6H), 1.66–1.71 (m, 6H), 1.41–1.48 (m, 6H); 13C-NMR (D2O) δ: 164.11, 134.76, 130.86, 129.87, 126.60, 125.51, 119.27, 47.48, 46.96, 39.53, 39.33, 26.48, 25.37, 25.25, 25.14, 24.15, 23.16; ESI-MS m/z: 368.3 (M+H-2HCl)+; Anal. calcd. for C22H31Cl2N3O2·1.0H2O: C, 57.64; H, 7.26; N, 9.17; found: C, 57.36; H, 7.13; N, 8.85.
2-[5-(6-Aminohexylamino)pentyl]1H-benz-[de]isoquinoline-1,3(2H)-dione dihydrochloride (7k). Yield: 77.2%; m.p.: 229.1–230.3 °C; 1H-NMR (D2O) δ: 7.34 (d, 2H, J = 8.0 Hz), 7.30 (d, 2H, J = 7.2 Hz), 6.96 (t, 2H, J = 7.6 Hz), 3.33 (t, 2H, J = 7.2 Hz), 2.91–2.99 (m, 6H), 1.61–1.63 (m, 6H), 1.27–1.37c (m, 8H); 13C-NMR (D2O) δ: 163.96, 134.59, 130.71, 129.75, 126.52, 125.35, 119.19, 47.51, 47.39, 39.92, 39.40, 26.52, 26.49, 25.38, 25.31, 25.17, 25.11, 23.34; ESI-MS m/z: 382.3 (M+H-2HCl)+; Anal. calcd. for C23H33Cl2N3O2·0.9H2O: C, 58.69; H, 7.45; N, 8.93; found: C, 58.36; H, 7.06; N, 8.60.

3.3. Biological Materials and Methods

All chemicals used in bioassay were purchased from Sigma (Beijing, China), unless otherwise indicated. RPMI1640 and fetal calf serum (FCS) were purchased from Gibco (Shanghai, China). Stock solution (10 mM) was prepared in DMSO and diluted to various concentrations with serum-free culture medium.

3.3.1. Cell Culture

Cell lines, K562, 7721 and HCT116 were obtained from American Type Culture Collection (ATCC, Shanghai, China). Cells were cultured in RPMI1640, supplemented with 10% heat-inactivated fetal calf serum (FCS), antibiotics (penicillin, 100 units/mL; streptomycin sulfate, 100 μg/mL) at 37 °C, in an atmosphere of 95% air and 5% CO2 under humidified conditions. Aminoguanidine (1 mM) was added as an inhibitor of amine oxidase derived from FCS and had no effect on the various parameters of the cell measured in this study.

3.3.2. MTT Assay

Chemosensitivity was assessed using the 3-(4,5-dimethylthiazol-2-yl)-2,5-diphenyltetrazolium bromide (MTT) assay. Briefly, exponentially growing K562 cells were seeded into 96-well plates at 4000 cells/well and treated with indicated concentrations of samples for 48 h, and then 10 μL of MTT (10 mg/mL) was added. After incubation for 4 h at 37 °C, the purple formazan crystals (i.e., a reduced form of MTT) generated from viable cells were dissolved by adding 100 μL 10% sodium dodecyl sulphate (SDS) in each well. The absorbance of each well was then read at 570 nm.
In addition, exponentially growing HCT116 or 7721 cells were seeded into 96-well plates at 5000 cells/well and allowed to attach overnight, and then 100 μL of MTT (1 mg/mL) was added. After incubation for 4 h at 37 °C, the MTT solution was removed and the remaining formazan crystals were dissolved with 150 μL DMSO in each well. The absorbance of each well was then read at 570 nm.

3.4. Cell Cycle Analysis and Apoptosis

3.4.1. Cell Cycle Analysis

Exponentially growing HepG2 cells were seeded in 96 well plates (4 × 10⁵ cells/well), cultured for 24 h and then treated with different concentrations of compound 7f for 48 h. After incubation for 48 h, cells were washed twice with ice-cold 10% PBS, fixed and permeabilized with ice-cold 70% ethanol at −20 °C overnight. The cells were treated with 50 μg/mL RNase A at room temperature for 30 min after washed with ice-cold PBS, and finally stained with 50 μg/mL propidium iodide (PI) in the dark at 4 °C for 30 min. The distribution of cell cycle phases with different DNA contents was read in image analysis system of high content screening living cells.

3.4.2. Apoptosis

Exponentially growing HepG2 cells were seeded in 96 well plates (6 × 10⁴ cells/well) and treated with indicated concentrations of 7f. After incubated for 48 h, cells were washed three times with PBS, and finally stained with with 10 μM Hoechst 33342 in the dark at 37 °C for 20 min. They were detected by laser scanning confocal microscope and the apoptotic cells were count by selecting 200 cells randomly.

3.5. Spectroscopy Measurement

3.5.1. Apparatus

UV–vis absorption spectra were measured on a Unicam UV 500 spectrophotometer (Beijing, China) using a 1.0 cm cell. Fluorescence measurements were performed with a Cary Eclipse spectrofluorimeter (Shanghai, China).

3.5.2. UV–Vis Measurements

2 mL solution of compound 7f (2.00 × 10⁻⁴ mol∙L−1 in Tris-HCl (pH = 7.4) was mixed with 0.0, 0.10, 0.20, 0.30, 0.60, 0.90 1.20, 1.50, 1.80, 2.10, 2.40, 2.70 and 3.0 mL of herring sperm DNA (2.284 × 10⁻⁴ mol∙L−1) respectively. The mixture was diluted to 5 mL with Tris-HCl (pH = 7.4). Thus, samples were prepared in the concentration of DNA at 0.0, 4.56, 9.13, 13.69, 27.4, 41.08, 54.77, 68.46, 82.15, 95.84, 109.54, 123.23 and 136.92 × 10⁻⁶ mol∙L−1. One contained only compound 7f (80 × 10−6 mol∙L−1) as control, the others contained different concentration of DNA but had the same concentration of compound 7f. All the above solution was shaken for 30 min. at room temperature.

3.5.3. Fluorescence Measurement

3.5.3.1. Interaction of Compound 7f with DNA

Preparation of sample is the same as that of UV-Vis measurement. Fluorescence wavelengths and intensity areas of samples were measured at following conditions: EX = 345 nm, EM = 355~600 nm temperature: 298, 303 and 310 K.

3.5.3.2. Interaction of Compound 7f with DNA-EB Complex

Solution of herring sperm DNA (0.3 mL, 2.284 × 10⁻⁵ mol∙L−1 in Tris-HCl (pH = 7.4) and 0.5 mL EB (1.57 × 10⁻⁵ mol∙L−1) was mixed with 0.0, 0.10, 0.20, 0.30, 0.60, 0.90 1.20, 1.50, 1.80, 2.10, 2.40, 2.70 and 3.00 mL of compound 7f (2.0 × 10⁻⁴ mol∙L−1) respectively. The mixture was diluted to 5 mL with Tris-HCl (pH = 7.4). Thus, samples were prepared in the concentration of compound 7f at 0.0, 4.0, 8.0, 12.0, 24.0, 36.0, 48.0, 60.0, 72.0, 84.0, 96.0 and 108.0 and 120.0 × 10⁻⁶ mol∙L−1. One contained only DNA (13.7 × 10⁻⁶ mol∙L−1) and EB (15.7 × 10⁻⁶ mol∙L−1) as control, the others contained different concentration of compound 7f but had the same concentration of DNA and EB. All the above solution was shaken for 30 min. at room temperature. Fluorescence wavelengths and intensity areas of samples were measured at following conditions: EX = 510 nm, EM = 520~800 nm; temperature: 298, 303 and 310 K.

3.5.3.3. Iodide Quenching

Solution of compound 7f (0.5 mL, 2.00 × 10⁻⁴ mol/L and herring sperm DNA 0.5 mL (22.84 × 10⁻⁴ mol/L) in Tris-HCl (pH = 7.4) were mixed with 0.0, 0.10, 0.20, 0.30, 0.60, 0.90 1.20, 1.50, 1.80, 2.10, 2.40, 2.70 and 3.00 of KI (2.0 × 10⁻² mol∙L−1) respectively. Meanwhile, 0.5 mL solution of compound 7f (2.00 × 10⁻⁴ mol/L was only mixed with 0.0, 0.10, 0.20, 0.30, 0.60, 0.90 1.20, 1.50, 1.80, 2.10, 2.40, 2.70 and 3.00 mL of KI (2.0 × 10⁻² mol∙L−1) respectively. The mixture was diluted to 5 mL with Tris-HCl (pH = 7.4). Thus, samples were prepared in the concentration of KI at 0.0, 400, 800, 1,200, 2,400, 3,600, 4,800, 6,000, 7,200, 8,400, 9,600, 10,800, 12,000 × 10−6 mol∙L−1. One kind of samples contained compound 7f (20 × 10−6 mol∙L−1), DNA (22.82 × 10⁻⁶ mol∙L−1) and different concentrations of KI. The other groups of samples contained only different concentration of KI and the same concentration of compound 7f as the control. All the above solution was shaken for 30 min. at room temperature. Fluorescence wavelengths and intensity areas of samples were measured at following conditions: EX = 345 nm, EM = 355~600 nm.

3.5.3.4. Effect of Ionic Intensity on The Interaction between Compound 7f and DNA

Solution of compound 7f (1.0 mL, 2.00 × 10⁻⁴ mol∙L−1) and herring sperm DNA 1.0 mL (2.284 × 10⁻⁴ mol∙L−1) in Tris-HCl (pH = 7.4) were mixed with 0.0, 0.10, 0.20, 0.30, 0.60, 0.90 1.20, 1.50, 1.80, 2.10, 2.40, 2.70 and 3.00 mL of NaCl (4.0 × 10⁻² mol∙L−1) respectively. The mixture was diluted to 5 mL with Tris-HCl (pH = 7.4). Thus, samples were prepared with the concentration of NaCl at 0.0, 800, 1,600, 2,400, 4,800, 7,200, 9,600, 12,000, 14,400, 16,800, 19,200, 21,600 and 24,000 × 10−6 mol∙L−1. The above mixtures were divided into two groups, in which one contained only compound 7f (40 × 10−6 mol∙L−1) and DNA (45.68 × 10⁻⁶ mol∙L−1) as control, the others contained different concentration of NaCl with the same concentration of compound 7f and DNA. All the above solution was shaken for 30 min. at room temperature. Fluorescence wavelengths and intensity areas of samples were measured at following conditions: EX = 345 nm, EM = 355~600 nm.

4. Conclusions

A series of naphthalimide-diamine conjugates were synthesized and their in vitro antitumor activities were evaluated. Compound 7f was found to have potent antitumor activity and good cell selectivity with amonafide as a control. Moreover, compound 7f could arrest HepG2 cells in the G2/M phase and induce HepG2 cells apoptosis. The interaction of compound 7f with DNA was first studied by spectroscopic methods. The binding of compound 7f to DNA resulted in a series of changes in the spectral characteristics. The absorption spectra of compound 7f with added DNA showed a hypochromic effect and the fluorescence emission of DNA-EB was efficiently quenched by compound 7f. These observed spectral data and the iodide quenching effect suggested that compound 7f interacts with DNA through an intercalative mode. Further fluorescent assays at different temperatures disclosed that the quenching mechanism of both compound 7f with DNA and compound 7f with DNA-EB was a static type. Meanwhile, the binding constant, thermodynamic parameters obtained from the same caloric fluorescent tests and the effect of NaCl on compound 7f-DNA interaction suggested that the binding process was driven by hydrogen bonding and van der Waals forces.

Acknowledgments

This work was supported by the China Postdoctoral Science Foundation Funded Project (No. 20110490991), the Henan Natural Science Foundation (Nos. 112300410181, 134200510009), the Henan Programs for Science and Technology Development (No. 132102310026) and the Natural Science Foundation of Education (No. 2011B3500001, 14A350004).

Author Contributions

Z.-Y.T. and C.-J.W. designed the research; all authors performed the experimental work; Z.-Y.T., Q.L. and C.-J.W. wrote the manuscript; All authors discussed, edited and approved the final version.

Conflicts of Interest

The authors declare no conflict of interest.

References

  1. Braña, M.F.; Sanz, A.M.; Castellano, J.M.; Roldán, C.M.; Roldán, C. Synthesis and cytostatic activity of benz[de]isoquinoline-1,3-diones, structure-activity relationships. Eur. J. Med. Chem. Chim. Ther. 1981, 16, 207–212. [Google Scholar]
  2. Sami, S.M.; Dorr, R.T.; Alberts, D.S.; Remers, W.A. 2-Substituted 1,2-dihydro- 3H- dibenz [de,h] isoquinoline-1, 3-diones. A new class of antitumor agent. J. Med. Chem. 1993, 36, 765–770. [Google Scholar] [CrossRef]
  3. Baily, C.; Braña, M.F.; Waring, M.J. Sequence-selective intercalation of antitumor bisnaphthalimides into DNA. Evident for an approach via the major groove. Eur. J. Biochem. 1996, 240, 195–208. [Google Scholar] [CrossRef]
  4. Braña, M.F.; Castellano, J.M.; Morán, M.; Pérez de Vega, M.J.; Perron, D.; Conlon, D.; Bousquet, P.F.; Romerdahl, C.A.; Robinson, S.P. Bis naphthalimides 3: Synthesis and antitumor activity of N,N'-bis[2-(1,8-naphthalimido)-ethyl]alkanedimines. Anticancer Drug Des. 1996, 11, 297–309. [Google Scholar]
  5. Rosell, R.; Carles, J.; Abad, A.; Ribelles, N.; Barnadas, A.; Benavides, A.; Martin, M. Phase I study of mitonafide in 120 h continuous infusion in non-small cell lung cancer. Investig. New Drugs 1992, 10, 171–175. [Google Scholar] [CrossRef]
  6. Costanza, M.E.; Berry, D.; Henderson, I.C.; Ratain, M.J.; Wu, K.; Shapiro, C.; Duggan, D.; kalra, J.; Berkowitz, I.; Lyss, A.P. Amonafide: An active agent in the treatment of previously untreated advanced breast cancer—a cancer and leukemia group B study (CALGB 8642). Clin. Cancer Res. 1995, 1, 699–704. [Google Scholar]
  7. Sami, S.M.; Dorr, R.T.; Sólyom, A.M.; Alberts, D.S.; Remers, W.A. Amino-substituted 2-[2'-(dimethyl-amino)ethyl 1,2-dihydro-3H-dibenz[de,h] isoquinoline-1,3-diones. Synthesis, antitumor activity and quantitative structure- activity relation-ship. J. Med. Chem. 1995, 38, 983–993. [Google Scholar] [CrossRef]
  8. Thompson, J.; Pratt, C.B.; Stewart, C.F.; Avery, L.; Bowman, L.; Zamboni, W.C.; Pappo, A. Phase I study of DMP 840 in pediatric patients with refractory solid tumors. Investig. New Drugs 1998, 16, 45–49. [Google Scholar]
  9. Nitiss, J.L.; Zhou, J.; Rose, A.; Hsiung, Y.; Gale, K.C.; Osheroff, N. The bis(naphthalimide) DMP-840 causes cytotoxicity by its action against eukaryotic topoisomerase II. Biochemistry 1998, 37, 3078–3085. [Google Scholar] [CrossRef]
  10. Bousquet, P.F.; Braña, M.F.; Conlon, D.; Fitzgerald, K.M.; Perron, D.; Cocchiaro, C.; Miller, R.; Moran, M.; George, J.; Qian, X.D.; et al. Preclinical evaluation of LU 79553: A novel bisnaphthalimide with potent antitumor activity. Cancer Res. 1995, 55, 1176–1180. [Google Scholar]
  11. Diaz-Rubio, E.; Martin, M.; López-Vega, J.M.; Casado, A.; Benavides, A. Phase I study of mitonafide with a 3-day administration schedule: Early interruption due to severe central nervous system toxity. Investig. New Drugs 1994, 12, 277–281. [Google Scholar] [CrossRef]
  12. Braña, M.F.; Domínguez, G.; Sáez, B.; Romerdahl, C.; Robinson, S.; Barlozzari, T. Synthesis and antitumour activity of new dendritic polyamines-(imide-DNA-intercalator) conjugates: Potent Lck inhibitors. Eur. J. Med. Chem. 2002, 37, 541–551. [Google Scholar] [CrossRef]
  13. Braña, M.F.; Cacho, M.; Ramos, A.; Dominguez, M.T.; Pozuelo, J.M.; Abradelo, C.; Rey-Stolle, M.F.; Yuste, M.; Carrasco, C.; Bailly, C. Synthesis, biological evaluation and DNA binding properties of novel mono and bisnaphthalimides. Org. Biomol. Chem. 2003, 1, 648–654. [Google Scholar] [CrossRef]
  14. Van Quaquebeke, E.; Mahieu, T.; Dumont, P.; Dewelle, J.; Ribaucour, F.; Simon, G.; Sauvage, S.; Gaussin, J.F.; Tuti, J.; El Yazidi, M.; et al. 2,2,2-Trichloro-N-({2-[2-(dimethylamino)ethyl]-1,3-dioxo-2,3-dihydro-1H-benzo[de] isoquinolin-5-yl} car-bamoyl) acetamide (UN BS3157), a novel nonhematotoxic naphthalimide derivative with potent antitumor activity. J. Med. Chem. 2007, 50, 4122–4134. [Google Scholar]
  15. Chen, Z.; Liang, X.; Zhang, H.Y.; Xie, H.; Liu, J.W.; Xu, Y.F.; Zhu, W.P.; Wang, Y.; Wang, X.; Tan, S.Y.; et al. A new class of naphthalimide-based antitumor agents that inhibit topoisomerase II and induce lysosomal membrane permeabilization and apoptosis. J. Med. Chem. 2010, 53, 2589–2600. [Google Scholar] [CrossRef]
  16. Sk, U.H.; Prakasha Gowda, A.S.; Crampsie, M.A.; Yun, J.K.; Spratt, T.E.; Amin, S.; Sharma, A.K. Development of novel naphthalimide derivatives and their evaluation as potential melanoma therapeutics. Eur. J. Med. Chem. 2011, 46, 3331–3338. [Google Scholar] [CrossRef]
  17. Roy, S.S.; Ghosh, P.; Sk, U.H.; Chakraborty, P.; Biswas, J.; Mandal, S.; Bhattacharjee, A.; Bhattacharya, S. Naphthalimide based novel organo-selenocyanates: Finding less toxic forms of selenium that would retain protective efficacy. Bioorg. Med. Chem. Lett. 2010, 21, 6951–6955. [Google Scholar]
  18. Filosa, R.; Peduto, A.; Micco, S.D.; Caprariis, P.D.; Festa, M.; Petrella, A.; Capranico, G.; Bifulco, G. Molecular modeling studies, synthesis and biological activity of a series of novel bisnaphthalimides and their development as new DNA topoisomerase II inhibitors. Bioorg. Med. Chem. 2009, 17, 13–24. [Google Scholar]
  19. Kamal, A.; Ramu, R.; Tekumalla, V.; Khanna, G.B.; Barkume, M.S.; Juvekar, A.S.; Zingde, S.M. Remarkable DNA binding affinity and potential anticancer activity of pyrrolo[2,1-c][1,4]benzodiazepine-naphthalimide conjugates linked through piperazine side-armed alkane spacers. Bioorg. Med. Chem. 2008, 16, 7218–7224. [Google Scholar] [CrossRef]
  20. Machado, K.E.; Oliveira, K.N.; Santos-Bubniak, L.; Licínio, M.A.; Nunes, R.J.; Santos-Silva, M.C. Evaluation of apoptotic effect of cyclic imide derivatives on murine B16F10 melanoma cells. Bioorg. Med. Chem. 2011, 19, 6285–6291. [Google Scholar] [CrossRef]
  21. Minarini, A.; Milelli, A.; Tumiatti, V.; Ferruzzi, L.; Marton, M.R.; Turrini, E.; Hrelia, P.; Fimognari, C. Design, synthesis and biological evaluation of new naphtalene diimides bearing isothiocyanate functionality. Eur. J. Med. Chem. 2012, 48, 124–131. [Google Scholar] [CrossRef]
  22. Barron, G.A.; Bermano, G.; Gordon, A.; Kong Thoo Lin, P. Synthesis, cytotoxicity and DNA-binding of novel bisnaphthalimidopropyl derivatives in breast cancer MDA-MB-231 cells. Eur. J. Med. Chem. 2010, 45, 1430–1437. [Google Scholar] [CrossRef]
  23. Banerjee, S.; Kitchen, J.A.; Bright, S.A.; O’Brien, J.E.; Williams, D.C.; Kelly, J.M.; Gunnlaugsson, T. Synthesis, spectroscopic and biological studies of a fluorescent Pt(II) (terpy) based 1,8-naphthalimide conjugate as a DNA targeting agent. Chem. Commun. 2013, 49, 8522–8524. [Google Scholar] [CrossRef]
  24. Banerjee, S.; Kitchen, J.A.; Gunnlaugsson, T.; Kelly, J.M. The effect of the 4-amino functionality on the photophysical and DNA binding properties of alkyl-pyridinium derived 1,8-naphthalimides. Org. Biomol. Chem. 2013, 11, 5642–5655. [Google Scholar] [CrossRef]
  25. Banerjee, S.; Kitchen, J.A.; Gunnlaugsson, T.; Kelly, J.M. Synthesis and photophysical evaluation of a pyridinium 4-amino-1,8-naphthalimide derivative that upon intercalation displays preference for AT-rich double-stranded DNA. Org. Biomol. Chem. 2012, 10, 3033–3043. [Google Scholar] [CrossRef]
  26. Wang, C.J.; Delcros, J.G.; Cannon, L.; Konate, F.; Carias, H.; Bigger staff, J.; Gardner, R.A.; Phanstiel, O., IV. Defining the molecular requirements for the selective delivery of polyamine conjugates into cells containing active polyamine transporters. J. Med. Chem. 2003, 46, 5129–5138. [Google Scholar] [CrossRef]
  27. Casero, R.A., Jr.; Marton, L.J. Targeting polyamine metabolism and function in cancer and other hyperproliferative diseases. Nat. Rev. Drug Discov. 2007, 6, 373–390. [Google Scholar] [CrossRef]
  28. Tian, Z.Y.; Xie, S.Q.; Du, Y.W.; Ma, Y.F.; Zhao, J.; Gao, W.Y.; Wang, C.J. Synthesis, cytotoxicity and apoptosis of naphthalimide polyamine conjugates as antitumor agents. Eur. J. Med. Chem. 2009, 44, 393–399. [Google Scholar] [CrossRef]
  29. Tian, Z.Y.; Xie, S.Q.; Mei, Z.H.; Zhao, J.; Gao, W.Y.; Wang, C.J. Conjugation of substituted naphthalimides to polyamines as cytotoxic agents targeting the Akt/mTOR signal pathway. Org. Biomol. Chem. 2009, 7, 4551–4560. [Google Scholar] [CrossRef]
  30. Yang, L.H.; Li, W.; Tian, Z.Y.; Zhao, J.; Wang, C.J. Mononaphthalimide spermidine conjugate induces cell proliferation inhibition and apoptosis in HeLa cells. Toxicol. In Vitro 2011, 52, 882–889. [Google Scholar]
  31. Pasternack, R.F.; Gibbs, E.J.; Villafranca, J.J. Interactions of water souble porphyrins with Z-poly (dG-dC). Biochemistry 1983, 22, 2406–2414. [Google Scholar]
  32. Xie, S.Q.; Cheng, P.F.; Liu, G.C.; Ma, Y.F.; Zhao, J.; Chehtane, M.; Khaled, A.R.; Phanstiel, O., IV; Wang, C.J. Synthesis and bioevaluation of N-(arylalkyl)-homospermidine conjugates. Bioorg. Med. Chem. Lett. 2007, 17, 4471–4475. [Google Scholar]
  33. Wang, C.J.; Delcros, J.G.; Bigger staff, J.; Phanstiel, O., IV. Molecular requirements for targeting the polyamine transport system. Synthesis and biological evaluation of polyamine-anthracene conjugates. J. Med. Chem. 2003, 46, 2672–2682. [Google Scholar] [CrossRef]
  34. Mosmann, T. Rapid colorimetric assay for cellular growth and survival: Application to proliferation and cytotoxicity assays. J. Immunol. Meth. 1983, 65, 55–63. [Google Scholar]
  35. Tian, Z.Y.; Su, L.P.; Xie, S.Q.; Zhao, J.; Wang, C.J. Study on synthesis, biological activitity and fluorescence spectroscopy of naphthalimide-polyamine conjugates. Chin. J. Org. Chem. 2013, 33, 1514–1521. [Google Scholar] [CrossRef]
  36. Zhu, H.; Huang, M.; Yang, F.; Chen, Y.; Miao, Z.H.; Qian, X.H.; Xu, Y.F.; Qin, Y.X.; Luo, H.B.; Shen, X.; et al. Ganoderic acid DM, a natural triterpenoid, induces DNA damage, G1 cell cycle arrest and apoptosis in human breast cancer cells. Mol. Cancer Ther. 2007, 6, 484–495. [Google Scholar] [CrossRef]
  37. Long, E.C.; Barton, J.K. On demonstrating DNA intercalation. Acc. Chem. Res. 1990, 23, 271–273. [Google Scholar] [CrossRef]
  38. Tysoe, S.A.; Morgan, R.J.; Baker, A.D.; Strekas, T.C. Spectroscopic investigation of differential binding modes of Δ- and Λ-Ru(bpy)2(ppz)2+ with calf thymus DNA. J. Phys. Chem. 1993, 97, 1707–1711. [Google Scholar] [CrossRef]
  39. Li, N.; Ma, Y.; Yang, C.; Gong, L.P.; Yang, X.H. Interaction of anticancer drug mitoxantrone with DNA analyzed by electrochemical and spectroscopic methods. Biophys. Chem. 2005, 116, 199–205. [Google Scholar] [CrossRef]
  40. Sirajuddin, M.; Ali, S.; Badshah, A. Drug-DNA interactions and their study by UV-Visible, fluorescence spectroscopies and cyclic voltametry. J. Photoch. Photobio. B: Biol. 2013, 124, 1–19. [Google Scholar] [CrossRef]
  41. Sahoo, B.K.; Ghosh, K.S.; Bera, R.; Dasgupta, S. Studies on the interaction of diacetylcurcumin with calf thymus-DNA. Chem. Phys. 2008, 351, 163–169. [Google Scholar] [CrossRef]
  42. Ghaderi, M.; Bathaie, S.Z.; Saboury, A.A.; Sharghi, H.; Tangestaninejad, S. Interaction of an Fe derivative of TMAP (Fe (TMAP) OAc) with DNA in comparison with free-base TMAP. Int. J. Biol. Macromol. 2007, 41, 173–179. [Google Scholar] [CrossRef]
  43. Hassanien, M.M.; Abou-EI-Sherbini, K.S. Synthesis and characterisation of morin-functionalised silica gel for the enrichment of some precious metal ions. Talanta 2006, 68, 1550–1559. [Google Scholar] [CrossRef]
  44. Selim, M.; Chowdhury, S.R.; Mukherjea, K.K. DNA binding and nuclease activity of a one-dimensional heterometallic nitrosyl complex. Int. J. Biol. Macromol. 2007, 41, 579–583. [Google Scholar] [CrossRef]
  45. Lin, H.; Lan, J.F.; Guan, M.; Sheng, F.L.; Zhang, H.X. Spectroscopic investigation of interaction between mangiferin and bovine serum albumin. Spectrochim. Acta. A. Mol. Biomol. Spectrosc. 2009, 73, 936–941. [Google Scholar] [CrossRef]
  46. Hu, Y.J.; Liu, Y.; Zhao, R.M.; Dong, J.X.; Qu, S.S. Spectroscopic studies on the interaction between methylene blue and bovine serum albumin. J. Photochem. Photobiol. A: Chem. 2006, 179, 324–329. [Google Scholar] [CrossRef]
  47. Gelamo, E.L.; Silva, C.H.; Imasato, H.; Tabak, M. Interaction of bovine (BSA) and human (HSA) serum albumins with ionic surfactants: Spectroscopy and modeling. Biochim. Biophys. Acta 2002, 1594, 84–99. [Google Scholar] [CrossRef]
  48. Sun, Y.; Wei, S.; Yin, C.; Liu, L.S.; Hu, C.M.; Zhao, Y.Y.; Ye, Y.X.; Hu, X.Y.; Fan, J. Synthesis and spectroscopic characterization of 4-butoxyethoxy-N- octadecyl-1,8- naphthalimide as a new fluorescent probe for the determination of proteins. Bioorg. Med. Chem. Lett. 2011, 21, 3798–3804. [Google Scholar] [CrossRef]
  49. Lakowicz, J.R. Principles of Fluorescence Spectroscopy; Plenum Press: New York, NY, USA, 1999; pp. 237–265. [Google Scholar]
  50. Lakowicz, J.R. Principles of Fluorescence Spectroscopy; Springer: New York, NY, USA, 2006; pp. 97–155. [Google Scholar]
  51. Hu, Y.J.; Liu, Y.; Zhang, L.X.; Zhao, R.M.; Qu, S.S. Study of interaction between colchicines and bovine serum albumin by fluorescence quenching method. J. Mol. Struct. 2005, 750, 174–178. [Google Scholar] [CrossRef]
  52. Feng, Q.; Li, N.Q.; Jiang, Y.Y. Electrochemical studies of porphyrin interacting with DNA and determination of DNA. Anal.Chim. Acta 1997, 344, 97–104. [Google Scholar] [CrossRef]
  53. Hu, Y.J.; Liu, Y.; Xiao, X.H. Investigation of the interaction between Berberine and human serum albumin. Biomacromolecules 2009, 10, 517–521. [Google Scholar] [CrossRef]
  54. Ross, P.D.; Subramanian, S. Thermodynamics of protein association reactions: Forces contributing to stability. Biochemistry 1981, 20, 3096–3102. [Google Scholar] [CrossRef]
  55. Takenaka, S.; Ihara, T.; Takagi, M. Bis-9-acridinyl derivative containing a viologen linker chain: Electrochemically active intercalator for reversible labelling of DNA. J. Chem. Soc. Chem. Commun. 1990, 23, 1485–1487. [Google Scholar] [CrossRef]
  56. Qiao, C.Y.; Bi, S.Y.; Sun, Y.; Song, D.Q.; Zhang, H.Q.; Zhou, W.H. Study of interactions of anthraquinones with DNA using ethidium bromide as a fluorescence probe. Spectrochim. Acta A: Mol. Biomol. Spectrosc. 2008, 70, 136–143. [Google Scholar] [CrossRef]
  57. Zhang, G.W.; Hu, X.; Zhao, N.; Li, W.B.; He, L. Studies on the interaction of aminocarb with calf thymus DNA by spectroscopic methods. Pestic. Biochem. Phys. 2010, 98, 206–212. [Google Scholar] [CrossRef]
  • Sample Availability: Samples of the compounds are available from the authors.

