Article

ROS-Dependent Antiproliferative Effect of Brassinin Derivative Homobrassinin in Human Colorectal Cancer Caco2 Cells

1
Department of Pharmacology, Faculty of Medicine, Pavol Jozef Safarik University, 040 11 Kosice, Slovak Republic
2
Department of Organic Chemistry, Institute of Chemical Sciences, Faculty of Science, Pavol Jozef Safarik University, 040 80 Kosice, Slovak Republic
3
Department of Experimental Medicine, Faculty of Medicine, Pavol Jozef Safarik University, 040 11 Kosice, Slovak Republic
4
Department of Gynaecology and Obstetrics, Faculty of Medicine, Pavol Jozef Safarik University, 040 11 Kosice, Slovak Republic
5
Pasteur University Hospital, 040 11 Kosice, Slovak Republic
*
Author to whom correspondence should be addressed.
These authors contributed equally to this work.
Molecules 2014, 19(8), 10877-10897; https://doi.org/10.3390/molecules190810877
Submission received: 30 April 2014 / Revised: 17 July 2014 / Accepted: 18 July 2014 / Published: 25 July 2014
(This article belongs to the Special Issue Phytoalexins: Current Progress and Future Prospects)

Abstract

:
This study was designed to examine the in vitro antiproliferative effect of brassinin and its derivatives on human cancer cell lines. Among seven tested compounds, homobrassinin (K1; N-[2-(indol-3-yl)ethyl]-S-methyldithiocarbamate) exhibited the most potent activity with IC50 = 8.0 μM in human colorectal Caco2 cells and was selected for further studies. The flow cytometric analysis revealed a K1-induced increase in the G2/M phase associated with dysregulation of α-tubulin, α1-tubulin and β5-tubulin expression. These findings suggest that the inhibitory effect of K1 can be mediated via inhibition of microtubule formation. Furthermore, simultaneously with G2/M arrest, K1 also increased population of cells with sub-G1 DNA content which is considered to be a marker of apoptotic cell death. Apoptosis was also confirmed by annexin V/PI double staining, DNA fragmentation assay and chromatin condensation assay. The apoptosis was associated with the loss of mitochondrial membrane potential (MMP), caspase-3 activation as well as intracellular reactive oxygen species (ROS) production. Moreover, the antioxidant Trolox blocked ROS production, changes in MMP and decreased K1 cytotoxicity, which confirmed the important role of ROS in cell apoptosis. Taken together, our data demonstrate that K1 induces ROS-dependent apoptosis in Caco2 cells and provide the rationale for further in vivo anticancer investigation.

1. Introduction

A plethora of epidemiological and animal studies show that consumption of cruciferous vegetables may lower the risk for variety of cancers [1,2,3,4]. It is suggested that the cancer-protective effects of cruciferous vegetables can be associated with the presence of glucosinolates, which are cleaved to biologically active compounds, such as indoles and isothiocyanates [5].
Another group of cruciferous-derived phytochemicals, the indole phytoalexins, have attracted scientists’ interest because of their ability to modulate processes involved in oncogenic transformation, such as alterations of cell cycle control, apoptosis evasion and inhibition of different signalling pathways [6,7,8].
Generally, phytoalexins are low molecular weight secondary metabolites biosynthesized de novo by plants in response to stress caused by biotic or abiotic factors [9,10]. Although phytoalexins are part of general defense mechanisms used to ward off plant invaders, their chemical diversity suggest substantially broader biological activities. In addition to their antimicrobial activity, some phytoalexins also possess antiinflammatory [11], antioxidant [12], antiproliferative [13,14], as well as anticancer [15,16] properties.
Indole phytoalexins are structurally unique, sulfur-containing natural products isolated from plants of the family Cruciferae (syn. Brassicaceae). Besides their antimicrobial properties, several indole phytoalexins also exhibit antiproliferative/anticancer activity [17,18,19,20,21].
Brassinin ([3-(S-methyldithiocarbamoyl) aminomethyl indole]), first isolated from Chinese cabbage [22], is an indole phytoalexin with demonstrated antiproliferative/anticancer activity. Mehta and co-workers [23] documented dose-dependent inhibition of 7,12-dimethylbenz[a]anthracene (DMBA)-induced preneoplastic lesion formation by brassinin and cyclobrassinin in a mouse mammary gland organ culture model. Later, Csomós et al. [24] showed antiproliferative effects of brassinin, isobrassinin and isobrassinin derivatives in different cancer cell types. Recently, Izutani et al. [6] described the ability of brassinin to inhibit cell growth in human colon cancer cells by arresting the cell cycle at the G1 phase via increased expression of p21 and p27. In the last decade we have also documented the antiproliferative effects of brassinin or its derivatives in different cancer cells [25,26,27,28,29,30].
Although the precise mechanism(s) of the antiproliferative activity of brassinin and its derivatives still remain unknown, inhibition of indoleamine 2,3-dioxygenase and inhibition of PI3K/Akt/mTOR signalling pathways may interfere with cancer cell survival and proliferation [7,31]. However, so far there is no published information about the antiproliferative molecular mechanisms of homobrassinin on cancer cells.
It is well known that oxidative stress may play role in the cytotoxicity of different natural compounds [32,33]. Recently, it was documented that the antiproliferative effect of some indole phytoalexins may be associated with ROS production [34,35] or glutathione depletion [19,30], which may lead to imbalance between antioxidant and prooxidant factors. This prompted us to explore the role of ROS in the antiproliferative effects of brassinin and its derivatives. Our results demonstrate that homobrassinin (K1) is the most active in inhibiting the growth of Caco2 cells among the compounds studied. Effect of K1 is associated with ROS production leading to mitochondrial dysfunction, caspase 3 activation and apoptosis induction. The role of ROS in K1-induced cell death was analysed by intracellular ROS generation and ROS scavenger experiments. These findings generate a rationale for in vivo efficacy studies with this compound in preclinical cancer models.

2. Results and Discussion

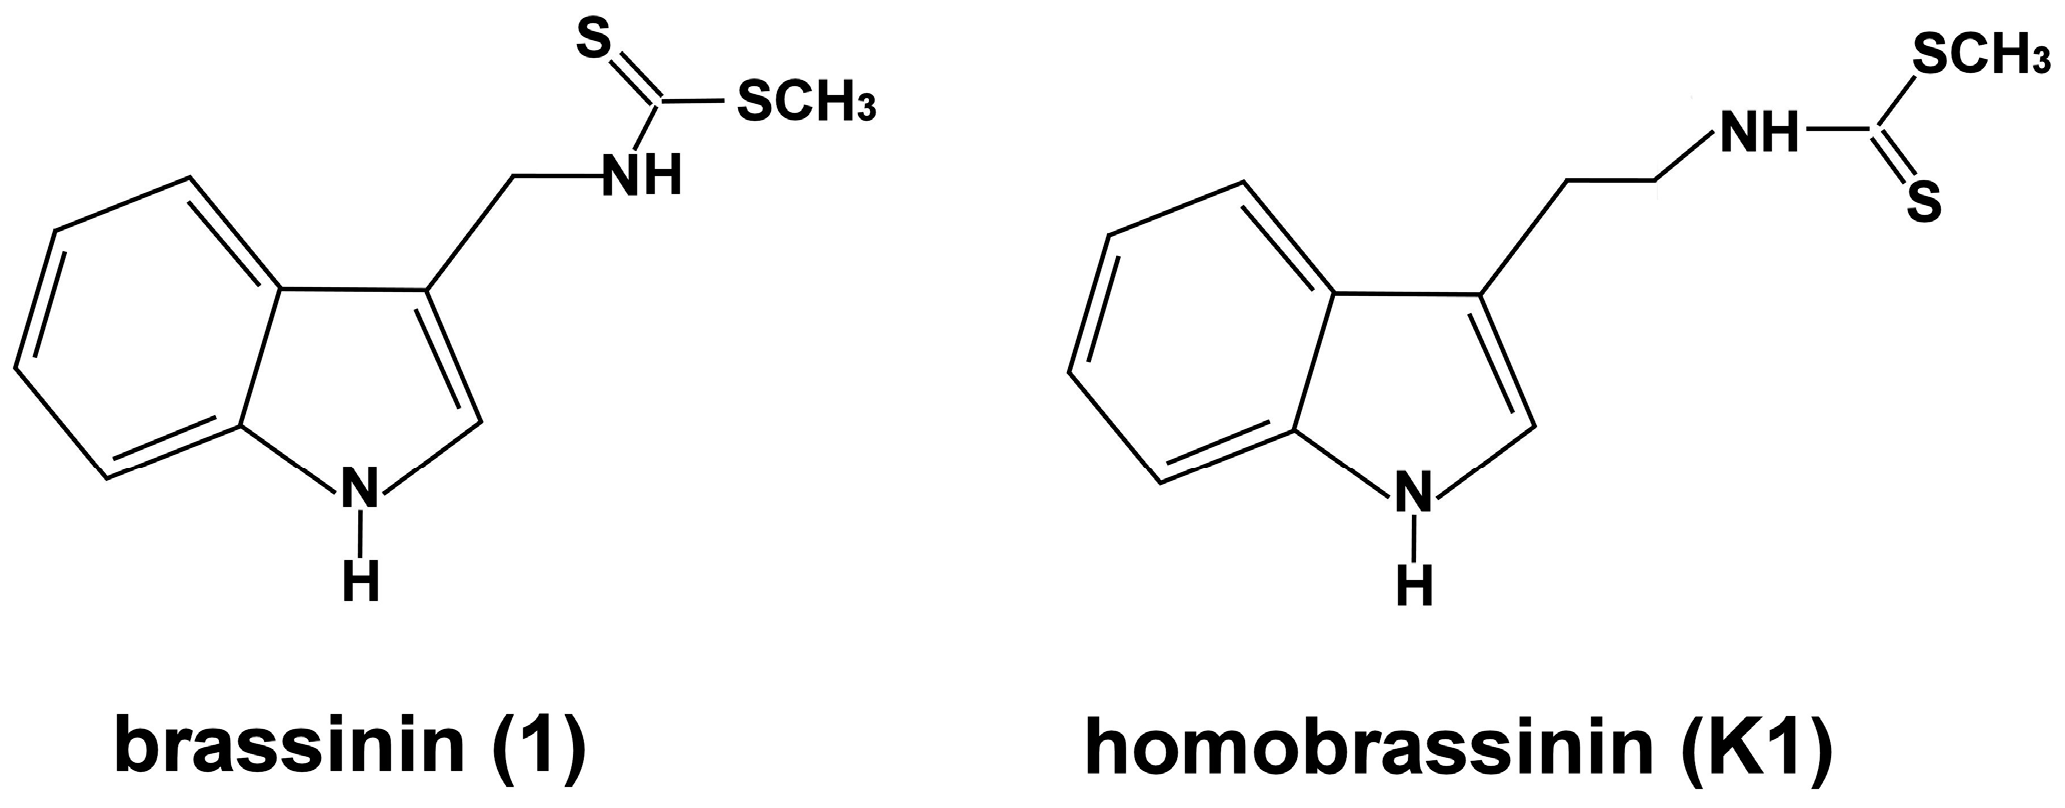
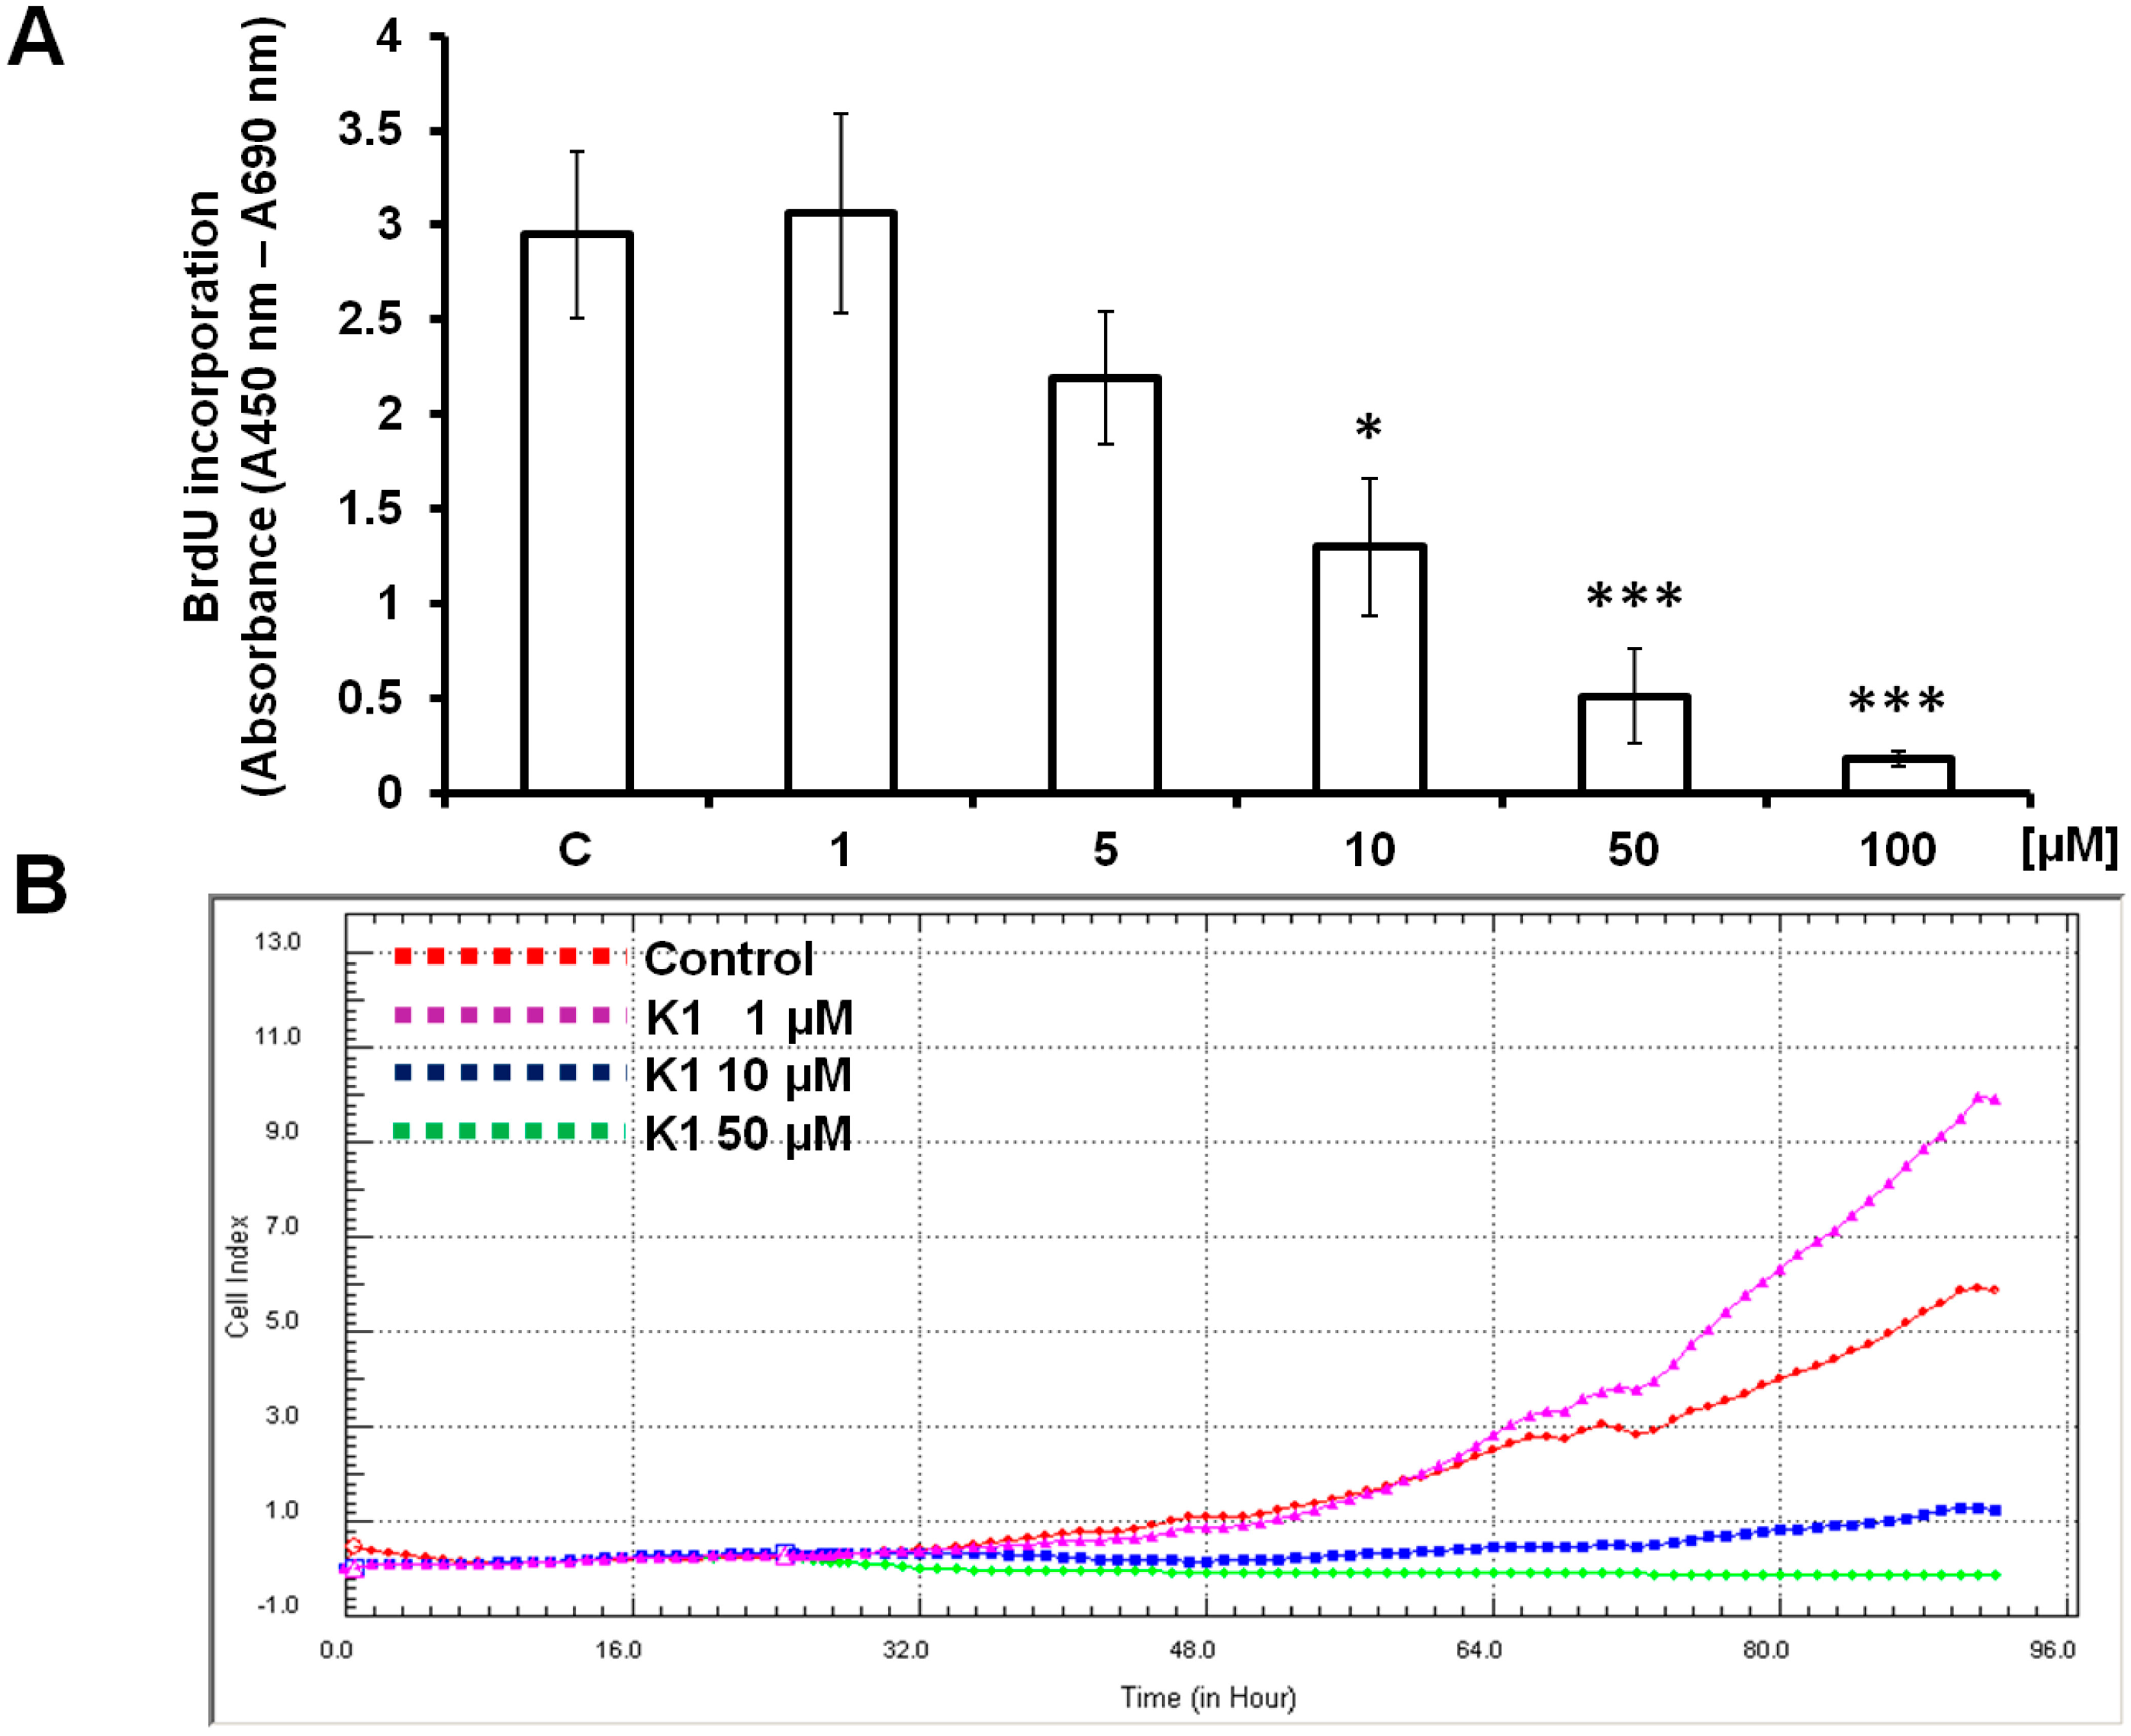
2.1. Effect of Brassinin and Its Derivatives on Cell Proliferation

The antiproliferative effect of indole phytoalexins was evaluated on eight human cancer cell lines using the MTT assay. Survival of cancer cells exposed to the studied indole phytoalexins is shown in Table 1. Our data showed that brassinin (1, Figure 1) possesses relatively weak antiproliferative effect with IC50 > 100 μM in all cancer cell lines used. Similar results were obtained also with compounds K10 and 47. On the other hand, homobrassinin (K1, Figure 1) displayed the highest antiproliferative activity with IC50 from 8.0 to 35.0 μM with the greatest antiproliferative activity in Caco2 cells. Other indole phytoalexins (K49, K124 and K170) were less potent.
Table 1. The IC50 (μM) of tested compounds in different cell lines after 72 h incubation. Results are presented as a mean ± SD of three independent experimental determinations performed in triplicate. The tested compounds: Brassinin (1), Homobrassinin (K1), N-{[1-(tert-Butoxycarbonyl)indol-3-yl]methyl}-N'-methyl-N'-phenylthiourea (K10), N-{[(1-tert-Butoxycarbonyl)indol-3-yl]metyl}-N'-(4-methoxyphenyl)thiourea (K124), 1-(β-d-glucopyranosyl)brassinin (47), 1-[(1R,2S,5R)-Menthoxycarbonyl]brassinin (K49); 1-[(1R,2S,5R)-8-Phenylmenthoxycarbonyl]brassinin (K170).
CompoundCancer Cell Lines
JurkatCaco2HepG2HCT-116A549HeLaMCF-7MDA-MB-231
1>100>100>100>100>100>100>100>100
K128.2 ± 1.28.0 ± 0.621.3 ± 2.327.3 ± 1.833.4 ± 0.826.1 ± 2.435.0 ± 2.122.8 ± 1.4
K10>100>100>100>100>100>100>100>100
K12430.0 ± 0.5>100>10030.7 ± 2.9>10034.0 ± 0.792.0 ± 2.7>100
K4939.6 ± 1.889.4 ± 1.337.4 ± 3.776.0 ± 2.522.8 ± 0.545.6 ± 1.462.0 ± 3.4>100
K17044.3 ± 3.2>100>10053.7 ± 2.196.5 ± 4.1>100>100>100
47>100>100>100>100>100>100>100>100
Because only K1 displayed interesting antiproliferative activity, it was selected for further mechanistic studies in Caco2 cells. The antiproliferative activity of compound K1 was also compared with its activity against non-cancer cells, human umbilical vein endothelial cells (HUVEC). Our results shown that compound K1 was more active against cancer cells than non-cancer cells (IC50 = 8.0 vs. IC50 = 46.2 μM).
Figure 1. Chemical structure of brassinin (1) and homobrassinin (K1).
Molecules 19 10877 g001
To confirm the potential antiproliferative effect of K1, the BrdU proliferation assay was used. The magnitude of the absorbance for the developed colour is proportional to the quantity of BrdU incorporated into cells, which is a direct indication of cell proliferation. As shown in Figure 2A, K1 at concentrations of 100, 50 and 10 μM significantly decreased BrdU incorporation compared with the control (approximately 94%, 83% and 56% respectively) (p < 0.001; p < 0.05). Antiproliferative effect was not observed at the concentration of 1 μM.
Figure 2. Antiproliferative effect of compound K1 on Caco2 cells. (A) Effect of 72 h K1 treatment on proliferation of Caco2 cells, as measured by the BrdU ELISA proliferation assay, *** p < 0.001, * p < 0.05. Data were obtained from three independent replicate experiments with at least three wells per treatment group in each individual replicate. (B) Real-time monitoring of Caco2 cell proliferation after incubation with K1 using the xCELLigence system. Appropriate concentrations of K1 were added 24 h after seeding.Representative picture from three independent experiments is shown.
Molecules 19 10877 g002
The antiproliferative effect of compound K1 on Caco2 cells was also evaluated by xCELLigence system. As shown in Figure 2B the cell index of Caco2 cells decreased significantly after treatment with K1 in a concentration-dependent manner. However, the cells treated with 1 μM of K1 exhibited a similar proliferation rate as control for most of the duration of the experiment, which confirm results obtained by BrdU proliferation assay.

2.2. K1 Blocks Cell Cycle at G2/M Transition

To evaluate the effect of K1 treatment on Caco2 cell cycle progression, we performed flow cytometric analysis on cells treated with 10 μM K1 for 24, 48 and 72 h as described in the Experimental Section. Results obtained are summarized in Table 2. The significant enrichment in G2/M cell populations was observed after 24 h (70.48%) of K1 treatment, as compared to untreated cells (36.64%) (p < 0.001). As a consequence, a significant reduction of the G0/G1 phase cell population confirms the cell cycle arrest in G2/M as an effect of colorectal cells exposure to K1. After 48 and 72 h incubation G2/M arrest still persisted with addition of increased sub-G1 population of cells. These results strongly suggest that K1-induced cell cycle arrest may represent one of the mechanisms by which this indole phytoalexin inhibits colorectal cancer cells growth.
Table 2. The distribution of cell cycle in Caco2 cells treated with K1. Cells were treated with K1 derivate (c = 10 µM) for 24, 48 and 72 h. The distribution of cell cycle was assessed by flow cytometry. Each value is the mean ± SD of three independent experiments. The significant differences between control and K1-treated cells were signed as p < 0.05 (*), p < 0.01 (**), p < 0.001 (***).
TreatmentTime (h)Sub-G1G0/G1SG2/M
Control 0.29 ± 0.15 40.81 ± 3.2918.25 ± 3.9036.64 ± 2.29
K1241.49 ± 0.37 21.34 ± 3.13 **6.69 ± 1.56 *70.48 ± 2.28 ***
K1483.36 ± 1.67 *30.89 ± 2.81 *9.58 ± 2.4356.20 ± 2.58 **
K1725.58 ± 1.16 *30.17 ± 1.65 *11.47 ± 1.6552.79 ± 2.77 **

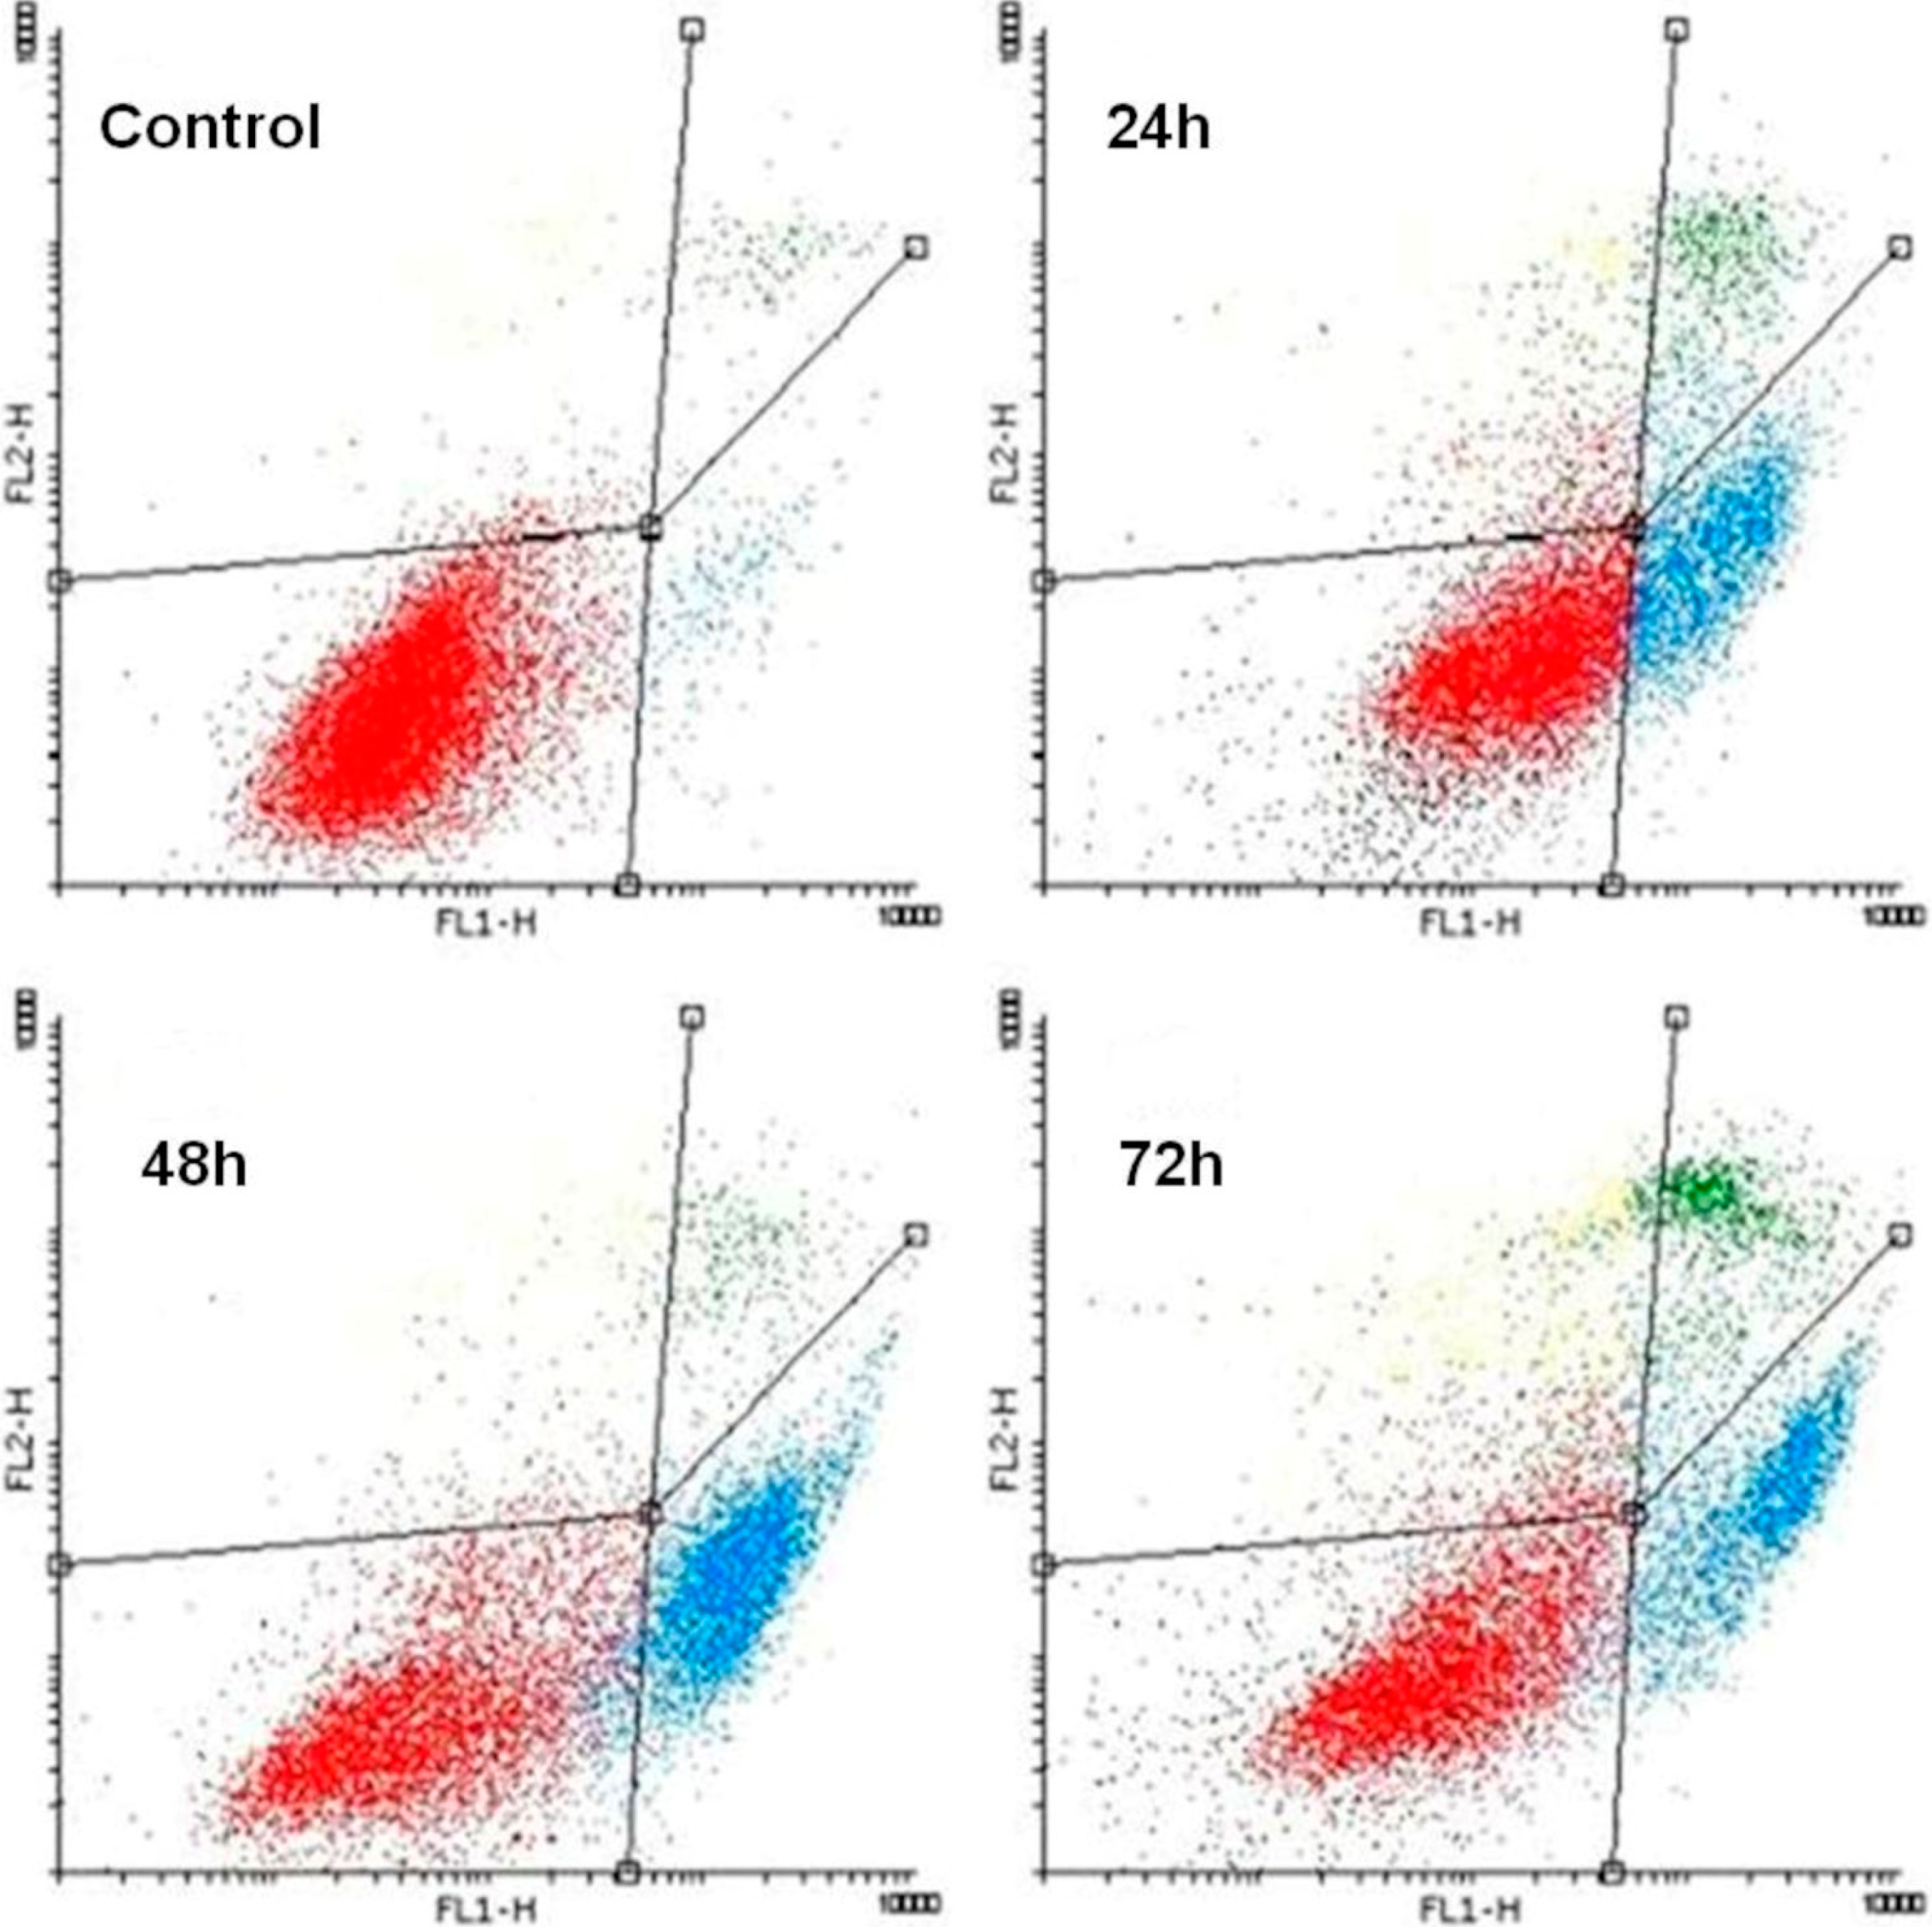
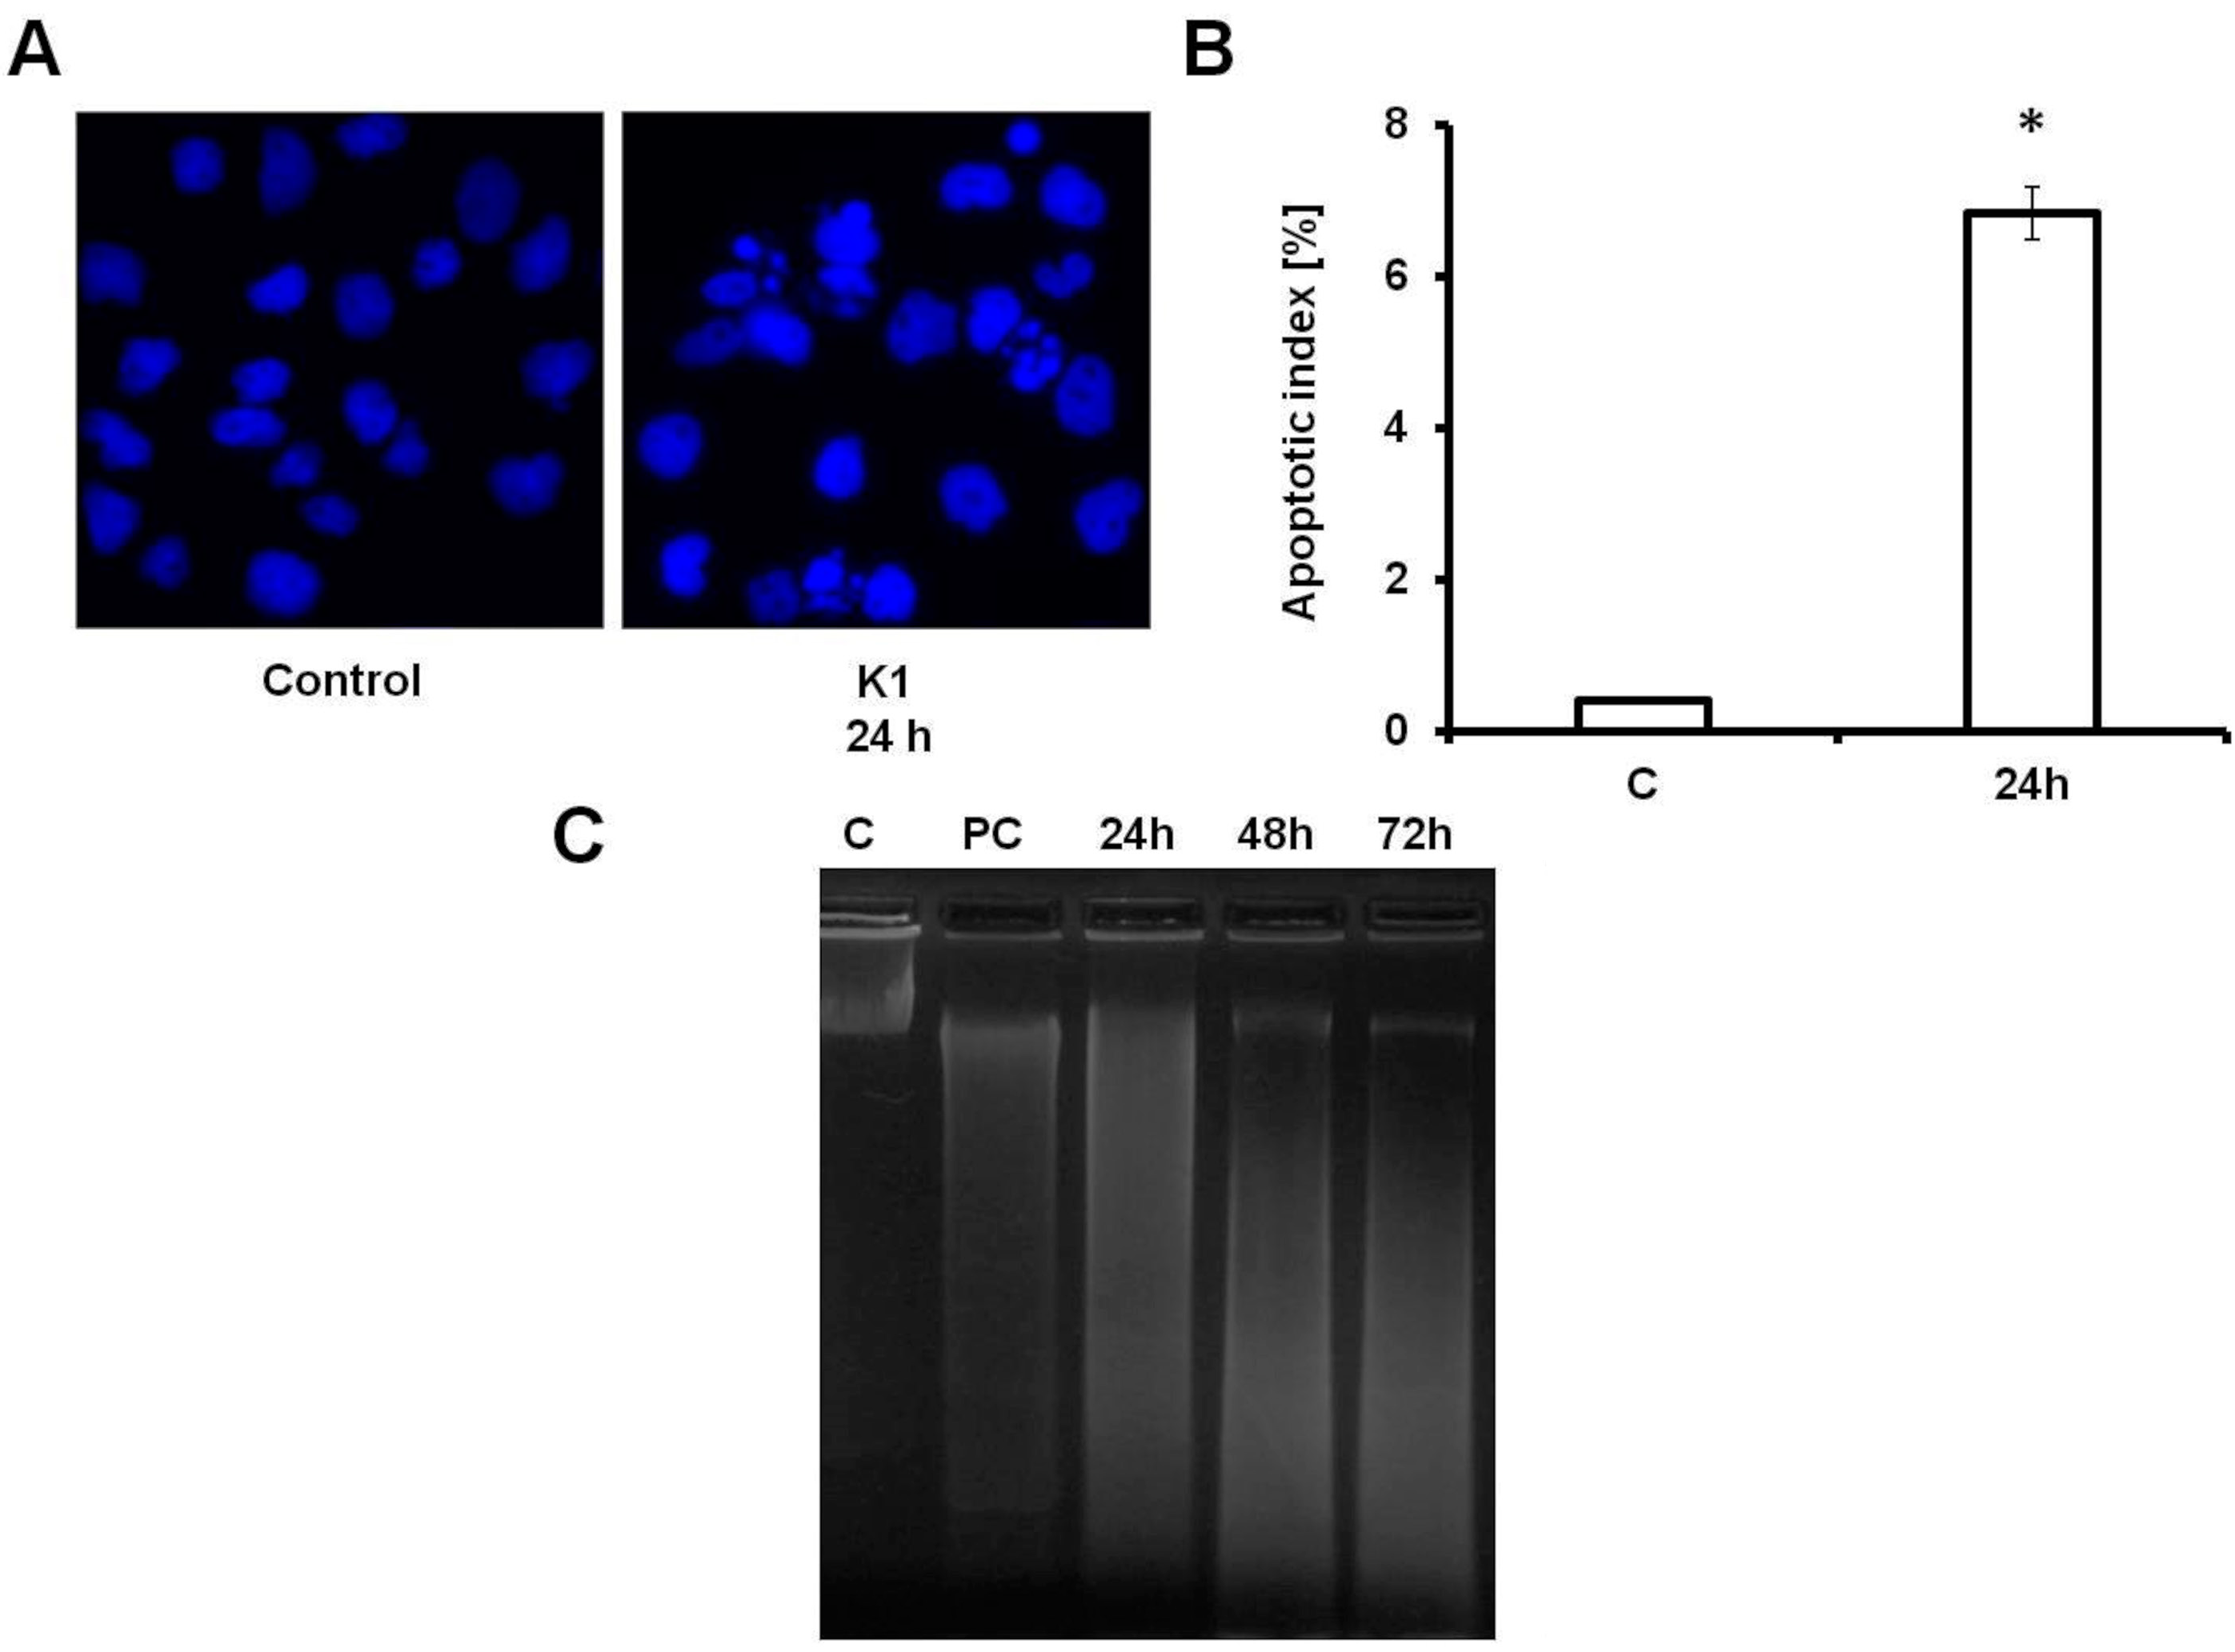
2.3. K1 Induces Apoptotic Cell Death

The increase of cell having sub-G1 DNA content is considered to be a marker of apoptotic cell death. To confirm whether K1 could induce apoptosis on colorectal cell lines, we performed Annexin V/PI staining, which detects an early stage of apoptosis and combined staining with PI, which detects a late stage of apoptosis or necrosis. The results showed that only a small percentage of untreated Caco2 cells (3.17%) bound with annexin V. In contrast, the percentage of annexin V binding Caco2 cells significantly increased in a time-dependent manner after 24, 48 and 72 h of treatment with 10 μM K1 (18.54% to 37.07%, p < 0.01; p < 0.001 ). Simultaneously, percentage of annexin V/PI positive cells increase from 2.05% (untreated cells) to 20.85% (K1 treated cells after 72 h of incubation). These experimental results demonstrate that K1 induced apoptosis of Caco2 cells (Table 3; Figure 3).
Chromatin condensation is one of the most important markers for apoptotic cells. The nuclear morphological changes of Caco2 cells were analysed using DAPI staining. In control groups, cells appeared to be round and manifested homogeneous nuclei. In cells treated with K1 at concentration 10 μM, cells displayed condensed nuclei. A significant increase of cells with typical apoptotic morphology was observed (Figure 4A), reaching 6.83% after 24 h of treatment, as evaluated by determination of apoptotic index (Figure 4B).
Table 3. Induction of apoptosis after K1 treatment measured by Annexin V/PI staining Caco2 cells were treated with K1 for 24, 48 and 72 h, stained with fluoresceinated Annexin V and PI, and analysed by flow cytometry. The percentage of events in the nonapoptotic (lower left, An/PI), early apoptotic (lower right, An+/PI), and late apoptotic/necrotic (upper left + right, An/PI+ + An+/PI+) quadrants (Figure 3) is indicated. The significant differences between control and K1-treated cells were signed as p < 0.05 (*), p < 0.01 (**), p < 0.001 (***).
TreatmentTime (h)An/PIAn+/PIAn+/PI+
Control 94.07 ± 1.323.17 ± 0.602.05 ± 0.50
K12467.81 ± 1.18 **18.54 ± 1.63 **13.75 ± 2.43 *
K14849.92 ± 3.20 ***38.55 ± 2.47 ***11.81 ± 2.24 *
K17242.36 ± 3.65 ***37.07 ± 2.66 ***20.85 ± 3.69 **
Figure 3. Induction of apoptosis after K1 treatment measured by Annexin V/PI staining. Caco2 cells were treated with K1 for 24, 48 and 72 h, stained with fluoresceinated Annexin V and PI, and analysed by flow cytometry. One representative experiment out of three is shown. The percentage of events in the nonapoptotic (lower left, An/PI), early apoptotic (lower right, An+/PI), and late apoptotic/necrotic (upper left + right, An/PI+ + An+/PI+) quadrants is indicated in Table 3.
Molecules 19 10877 g003
Figure 4. Apoptotic effect of K1 on Caco2 cells. (A) Morphological changes of Caco2 cells treated with 10 μM of K1 for 24 h. Cells were cultured in chamber slides and stained with DAPI to show typical apoptotic morphology. Magnification 400×. (B) Apoptotic index of Caco2 cells treated with 10 μM of K1 for 24 h. The results (mean ± SD) of three independent experiments are shown as the apoptotic index evaluated as a percentage of cells with fragmented nuclei from a total number of minimum 300 cells, * p < 0.05. (C) DNA fragmentation of Caco2 cells after incubation with 10 μM of K1 for 24, 48 and 72 h, C-control (untreated cells), PC-positive control (cells treated with 10 μM of cisplatin). A representative picture from three independent experiments is shown.
Molecules 19 10877 g004
Analysis of DNA fragmentation by agarose gel electrophoresis is one of the most widely used biochemical markers for cell death. Fragmentation of DNA was observed in Caco2 cells after 24 h incubation with 10 μM of compound K1 compared to control (untreated cells). This effect also persisted after 48 and 72 h of incubation (Figure 4C).

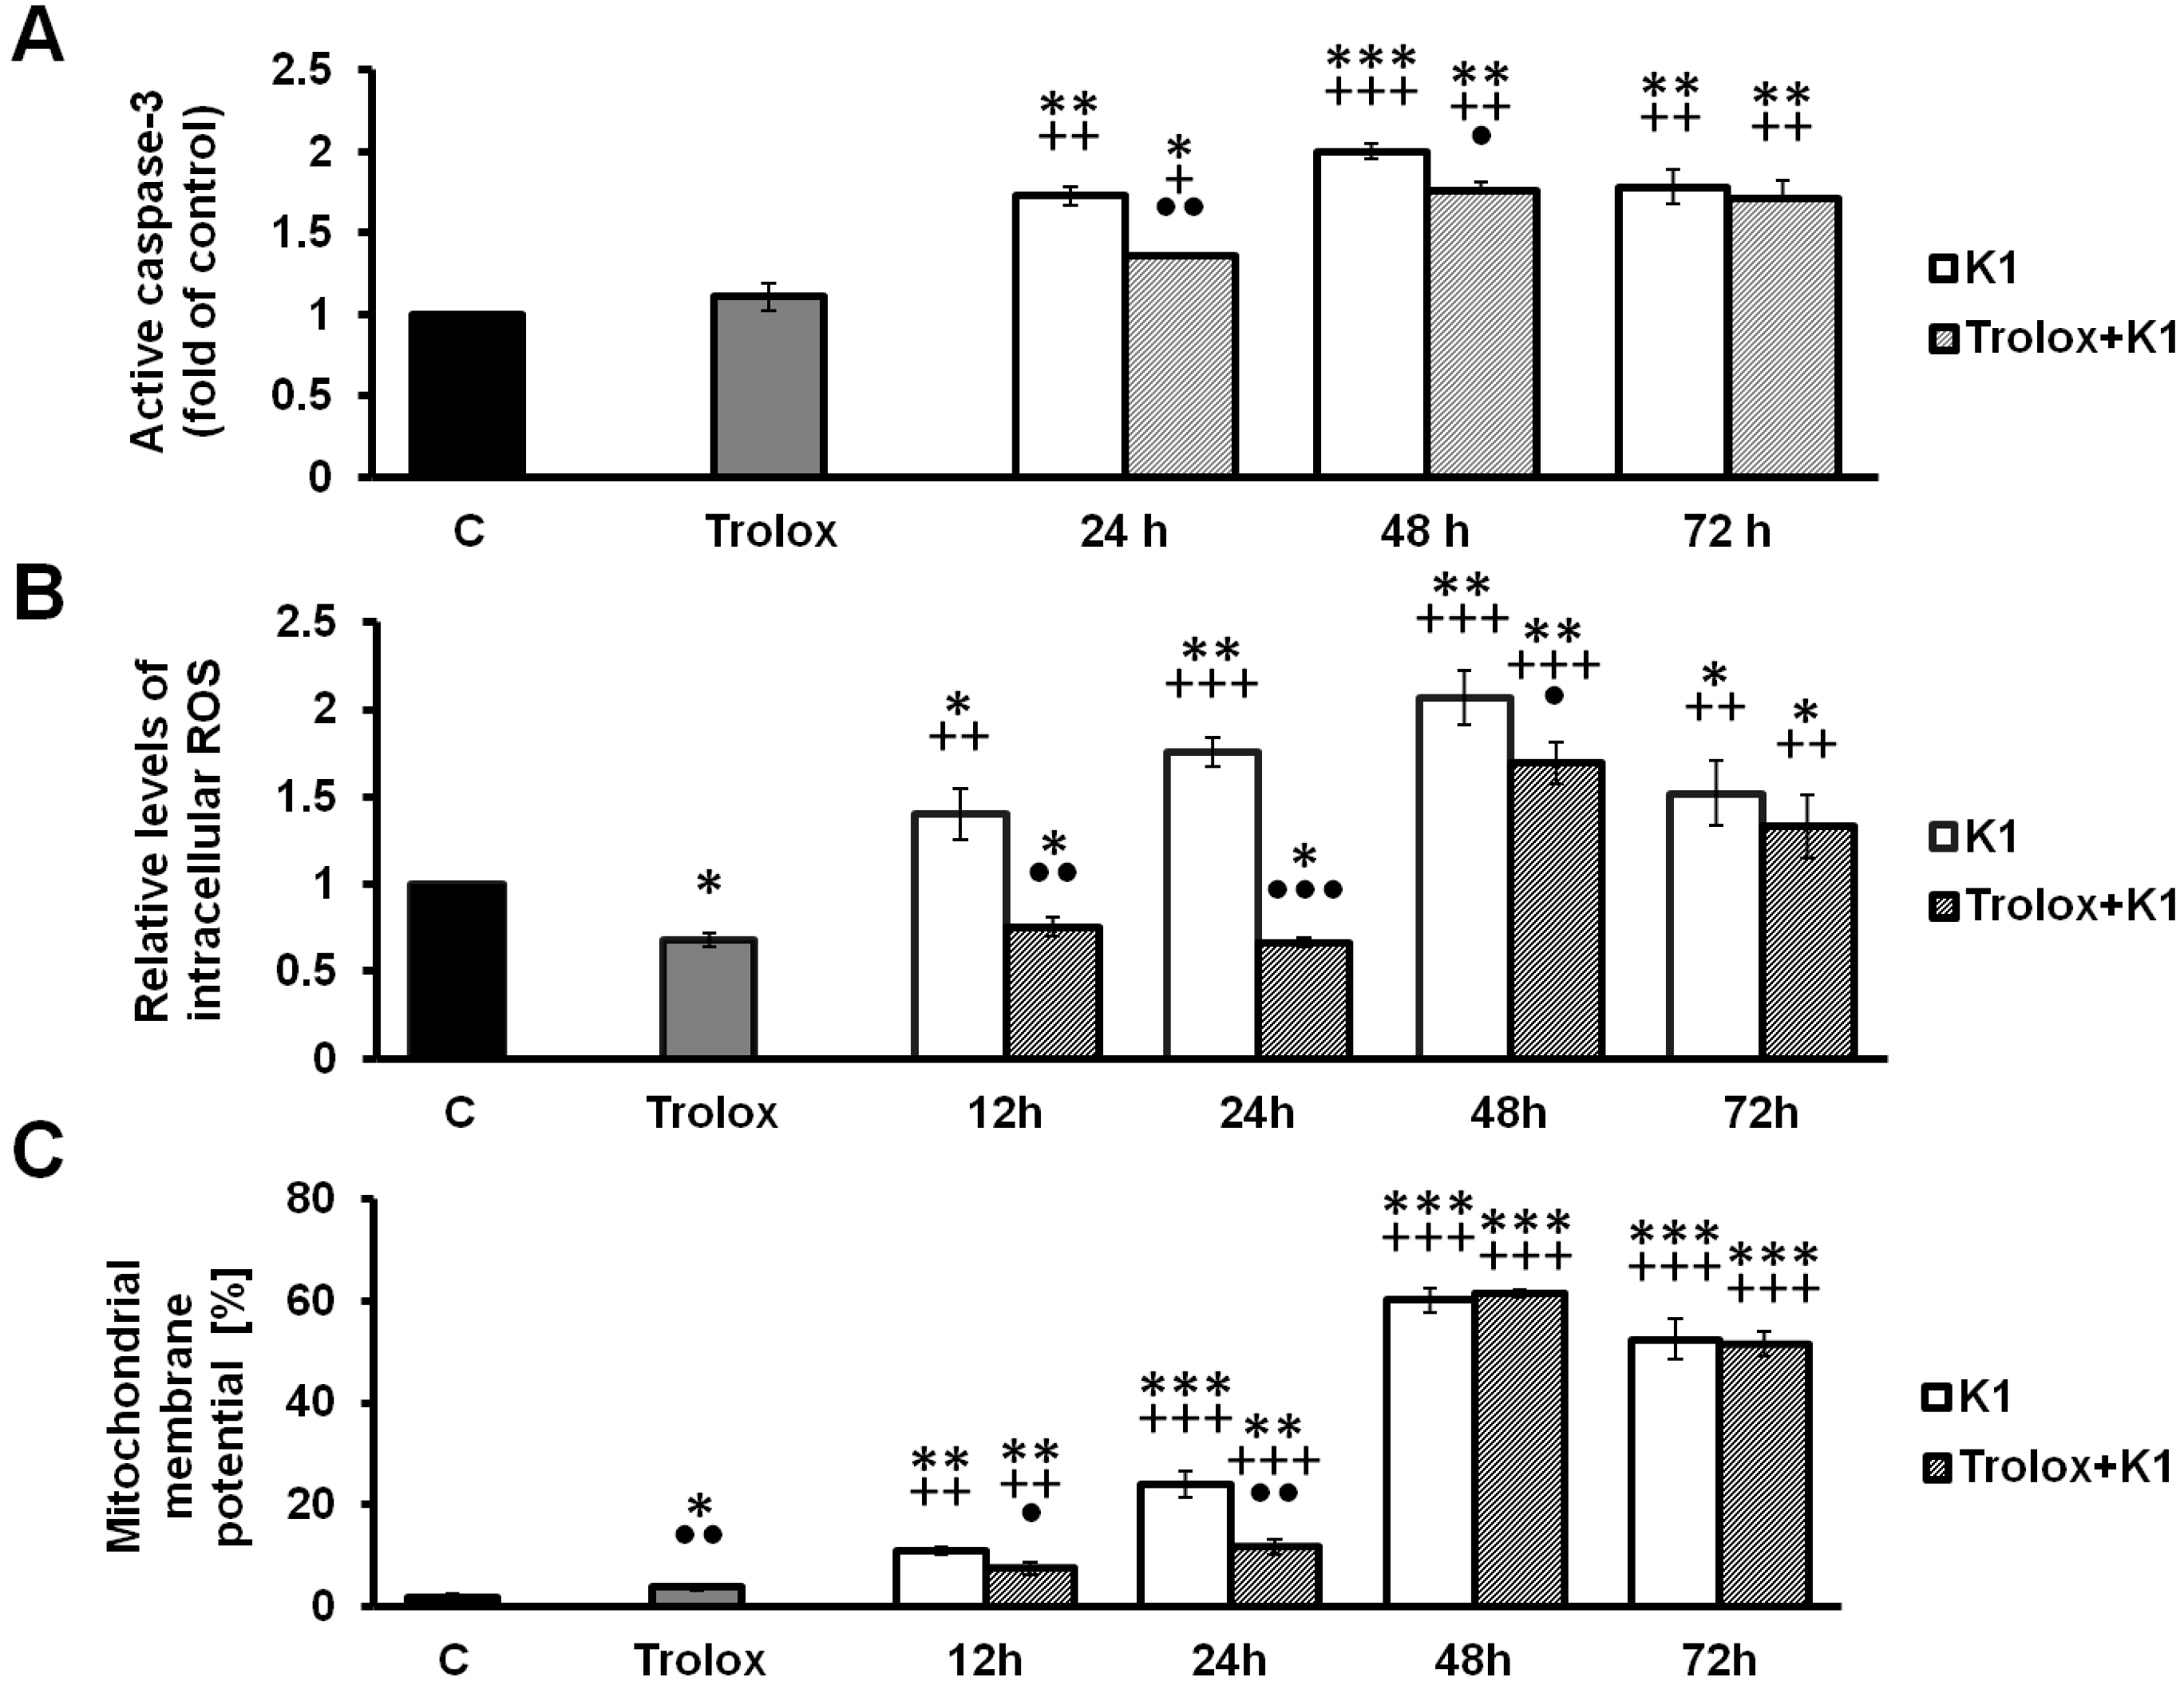
2.4. Effect of K1 on ROS Formation

It has been reported that increased liberation of ROS can activate a cascade of events leading to apoptosis [36]. Therefore, we decided to detect whether K1 was able to trigger ROS generation by measuring the rhodamine 123 fluorescence intensity. The results showed that treatment of the cells with K1 significantly increased ROS generation in a time-dependent manner. After 12 h incubation with K1 the significant ROS accumulation was observed. Culminated accumulation was marked after 48 h treatment (Figure 5B). On the other hand, no increase in ROS production was observed after 1, 3 and 6 h of incubation (data not shown). In order to show that generation of ROS is a key step in the K1-induced apoptotic pathway, Caco2 cells were pretreated with Trolox, a water-soluble analogue of the free radical scavenger α-tocopherol. Trolox significantly decreased ROS accumulation in time dependent manner. These effects were associated also with recovered cell viability (Figure 6).
Figure 5. Effect of K1 and Trolox on caspase-3, ROS accumulation and MMP. (A) Effect of K1 and Trolox treatment on caspase-3 activation. Caspase-3 activation was measured 24, 48 and 72 h after treatment by quantifying the fluorescence intensity. (B) Measurement of ROS production in Caco2 cells treated with K1, Trolox or mutual combinations. Cytosolic ROS were measured 12, 24, 48 and 72 h after treatment by quantifying the fluorescence intensity of activate DHR-123. The results (mean ± SD) of three independent experiments are shown as multiples of the control group fluorescence. (C) MMP changes in Caco2 cells treated with K1, Trolox or mutual combinations were analysed 12, 24, 48 and 72 h after treatment.
Molecules 19 10877 g005
Results are expressed as mean values ± SD of three independent experiments. * p < 0.05, ** p < 0.01, *** p < 0.001 vs. untreated control; + p < 0.05, ++ p < 0.01, +++ p < 0.001 vs. Trolox; p < 0.05, ●● p < 0.01, ●●● p < 0.001 vs. K1.
Collectively, these findings suggest that an increase in ROS generation may take part in the K1-induced apoptosis in Caco2 cells.

2.5. K1-Induced Mitochondrial Dysfunction

A decrease in MMP is one of the earliest events in apoptosis. Mitochondrial membrane integrity was evaluated using the cationic dye TMRE, a highly specific probe for detecting changes in mitochondrial ΔΨm. In our experiments, changes in MMP were detected 12, 24, 48 and 72 h after K1 treatment. Effect of K1 treatment on Caco2 cells led to intensive and considerable destruction of mitochondrial function demonstrated with significant changes in the percentage of cells with dissipated MMP in time-dependent manner. On the other hand, co-treatment with Trolox significantly diminished effect of K1 on MMP changes and prevented mitochondrial dysfunction (Figure 5C).
Figure 6. Relative survival of Caco2 cells treated with K1, Trolox or mutual combinations as evaluated by MTT assay. Cells were incubated with tested compounds for 24, 48 and 72 h.
Molecules 19 10877 g006
Data is presented as a mean ± SD of three independent experimental determinations performed in triplicate. ** p < 0.01, *** p < 0.001 vs. untreated control; + p < 0.05, ++ p < 0.01, +++ p < 0.001 vs. Trolox; ●● p < 0.01, ●●● p < 0.001 vs. K1.

2.6. Activation of Caspase-3 by K1

Analysis of caspase-3 activation (Figure 5A) clearly demonstrated caspase-dependent form of cell death in Caco2 cells line. The more than 2-fold higher increase of caspase-3 activation after 48 h treatment confirmed this suggestion. On the other hand, co-treatment with Trolox significantly decreased the effect of K1 on caspase-3 activation. Significant caspase-3 activation correlated well with apoptosis occurrence frequency, ROS and loss of MMP leading to cell death after K1 treatment. These results clearly indicate that caspase-3 activation plays an important role in Caco2 cell apoptosis induced by K1.

2.7. Effect of K1 on Gene Expression of Tubulins

The cell cycle analysis showed that K1 induces the G2/M arrest. Based on this result, the alteration in selected gene expression was analysed after 24, 48 and 72 h incubation by real-time PCR. We found significant downregulation of β-tubulin expression and significant upregulation of α-tubulin expression after 24 h treatment with compound K1 at concentration 10 μM. Similar results were also obtained after 72 h of incubation. After 48 h incubation with the tested compound an opposite but non-significant effect was noted (Table 4).
Table 4. Fold changes of specific genes after 24, 48 and 72 h treatment with K1 (c = 10 μM). β-actin gene was used as a housekeeping gene to normalize each sample.
GenesNormalized Ratio
24 h48 h72 h
α-tubulin5.591.683.35
α1-tubulin1.890.651.47
β5-tubulin0.290.990.48
These results suggest that K1 may affect microtubule and microtubule assembly. The results of real-time PCR analysis for selected genes are in direct correlation with the data obtained in cell cycle analysis.

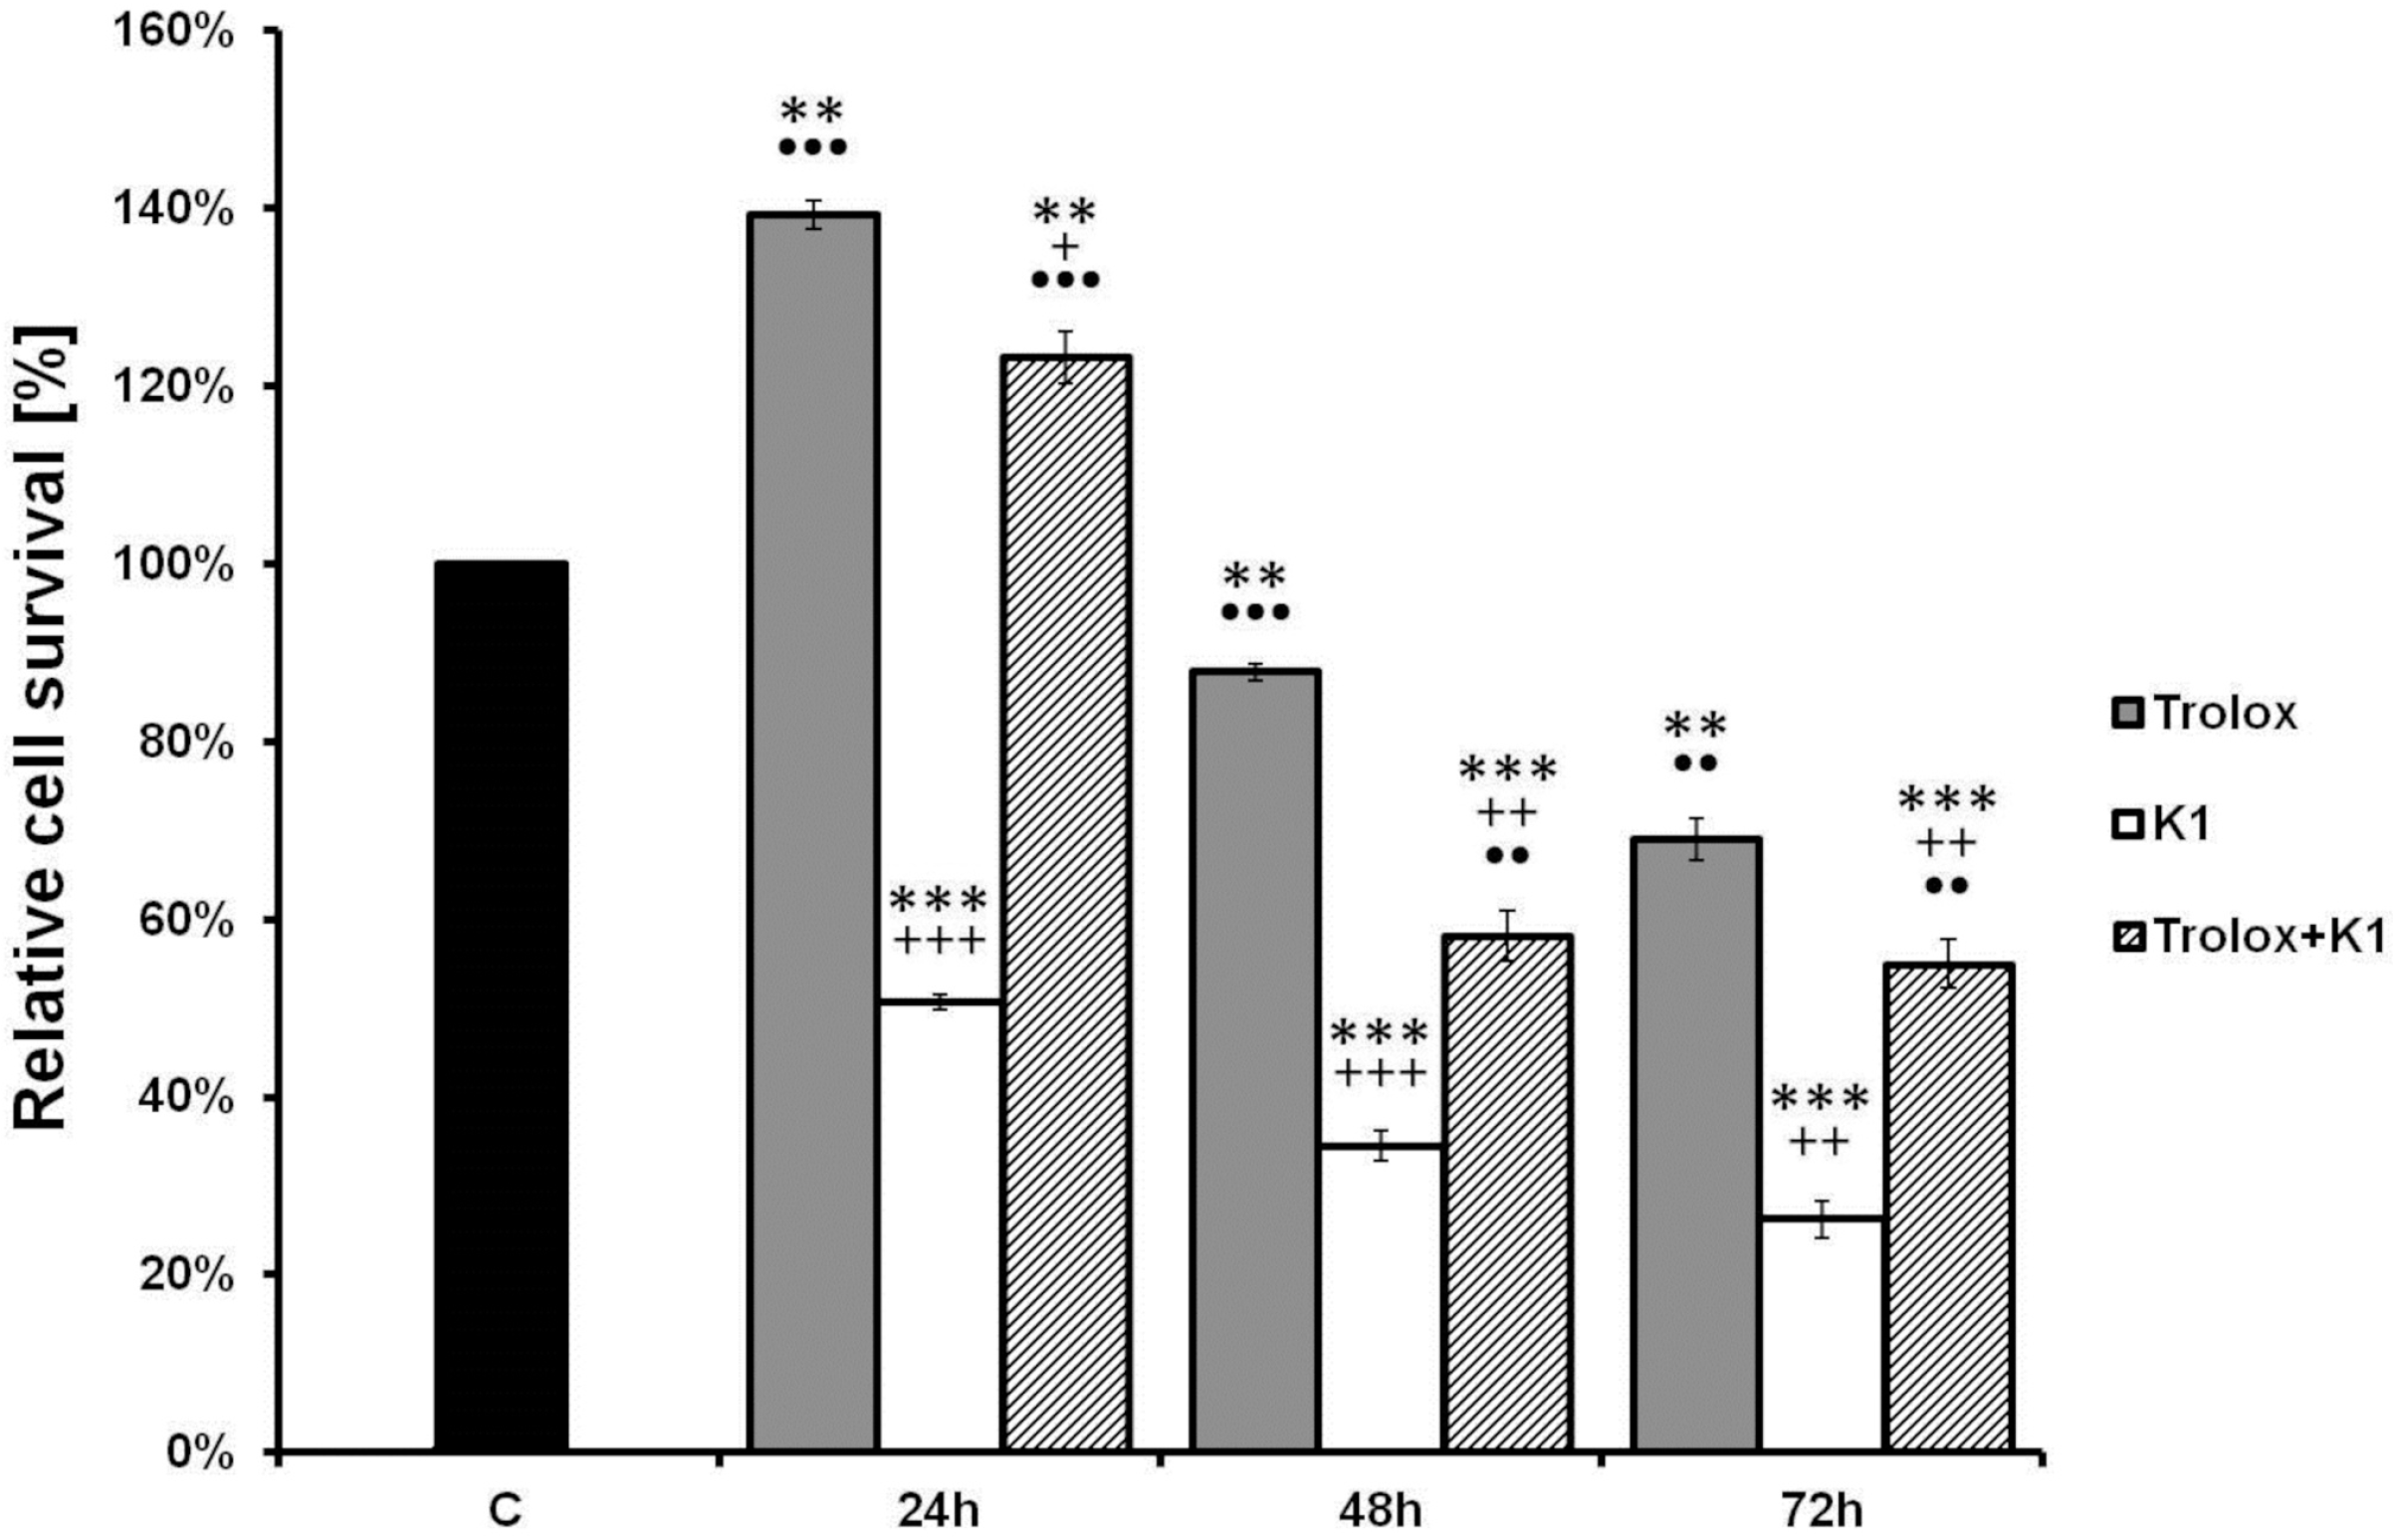
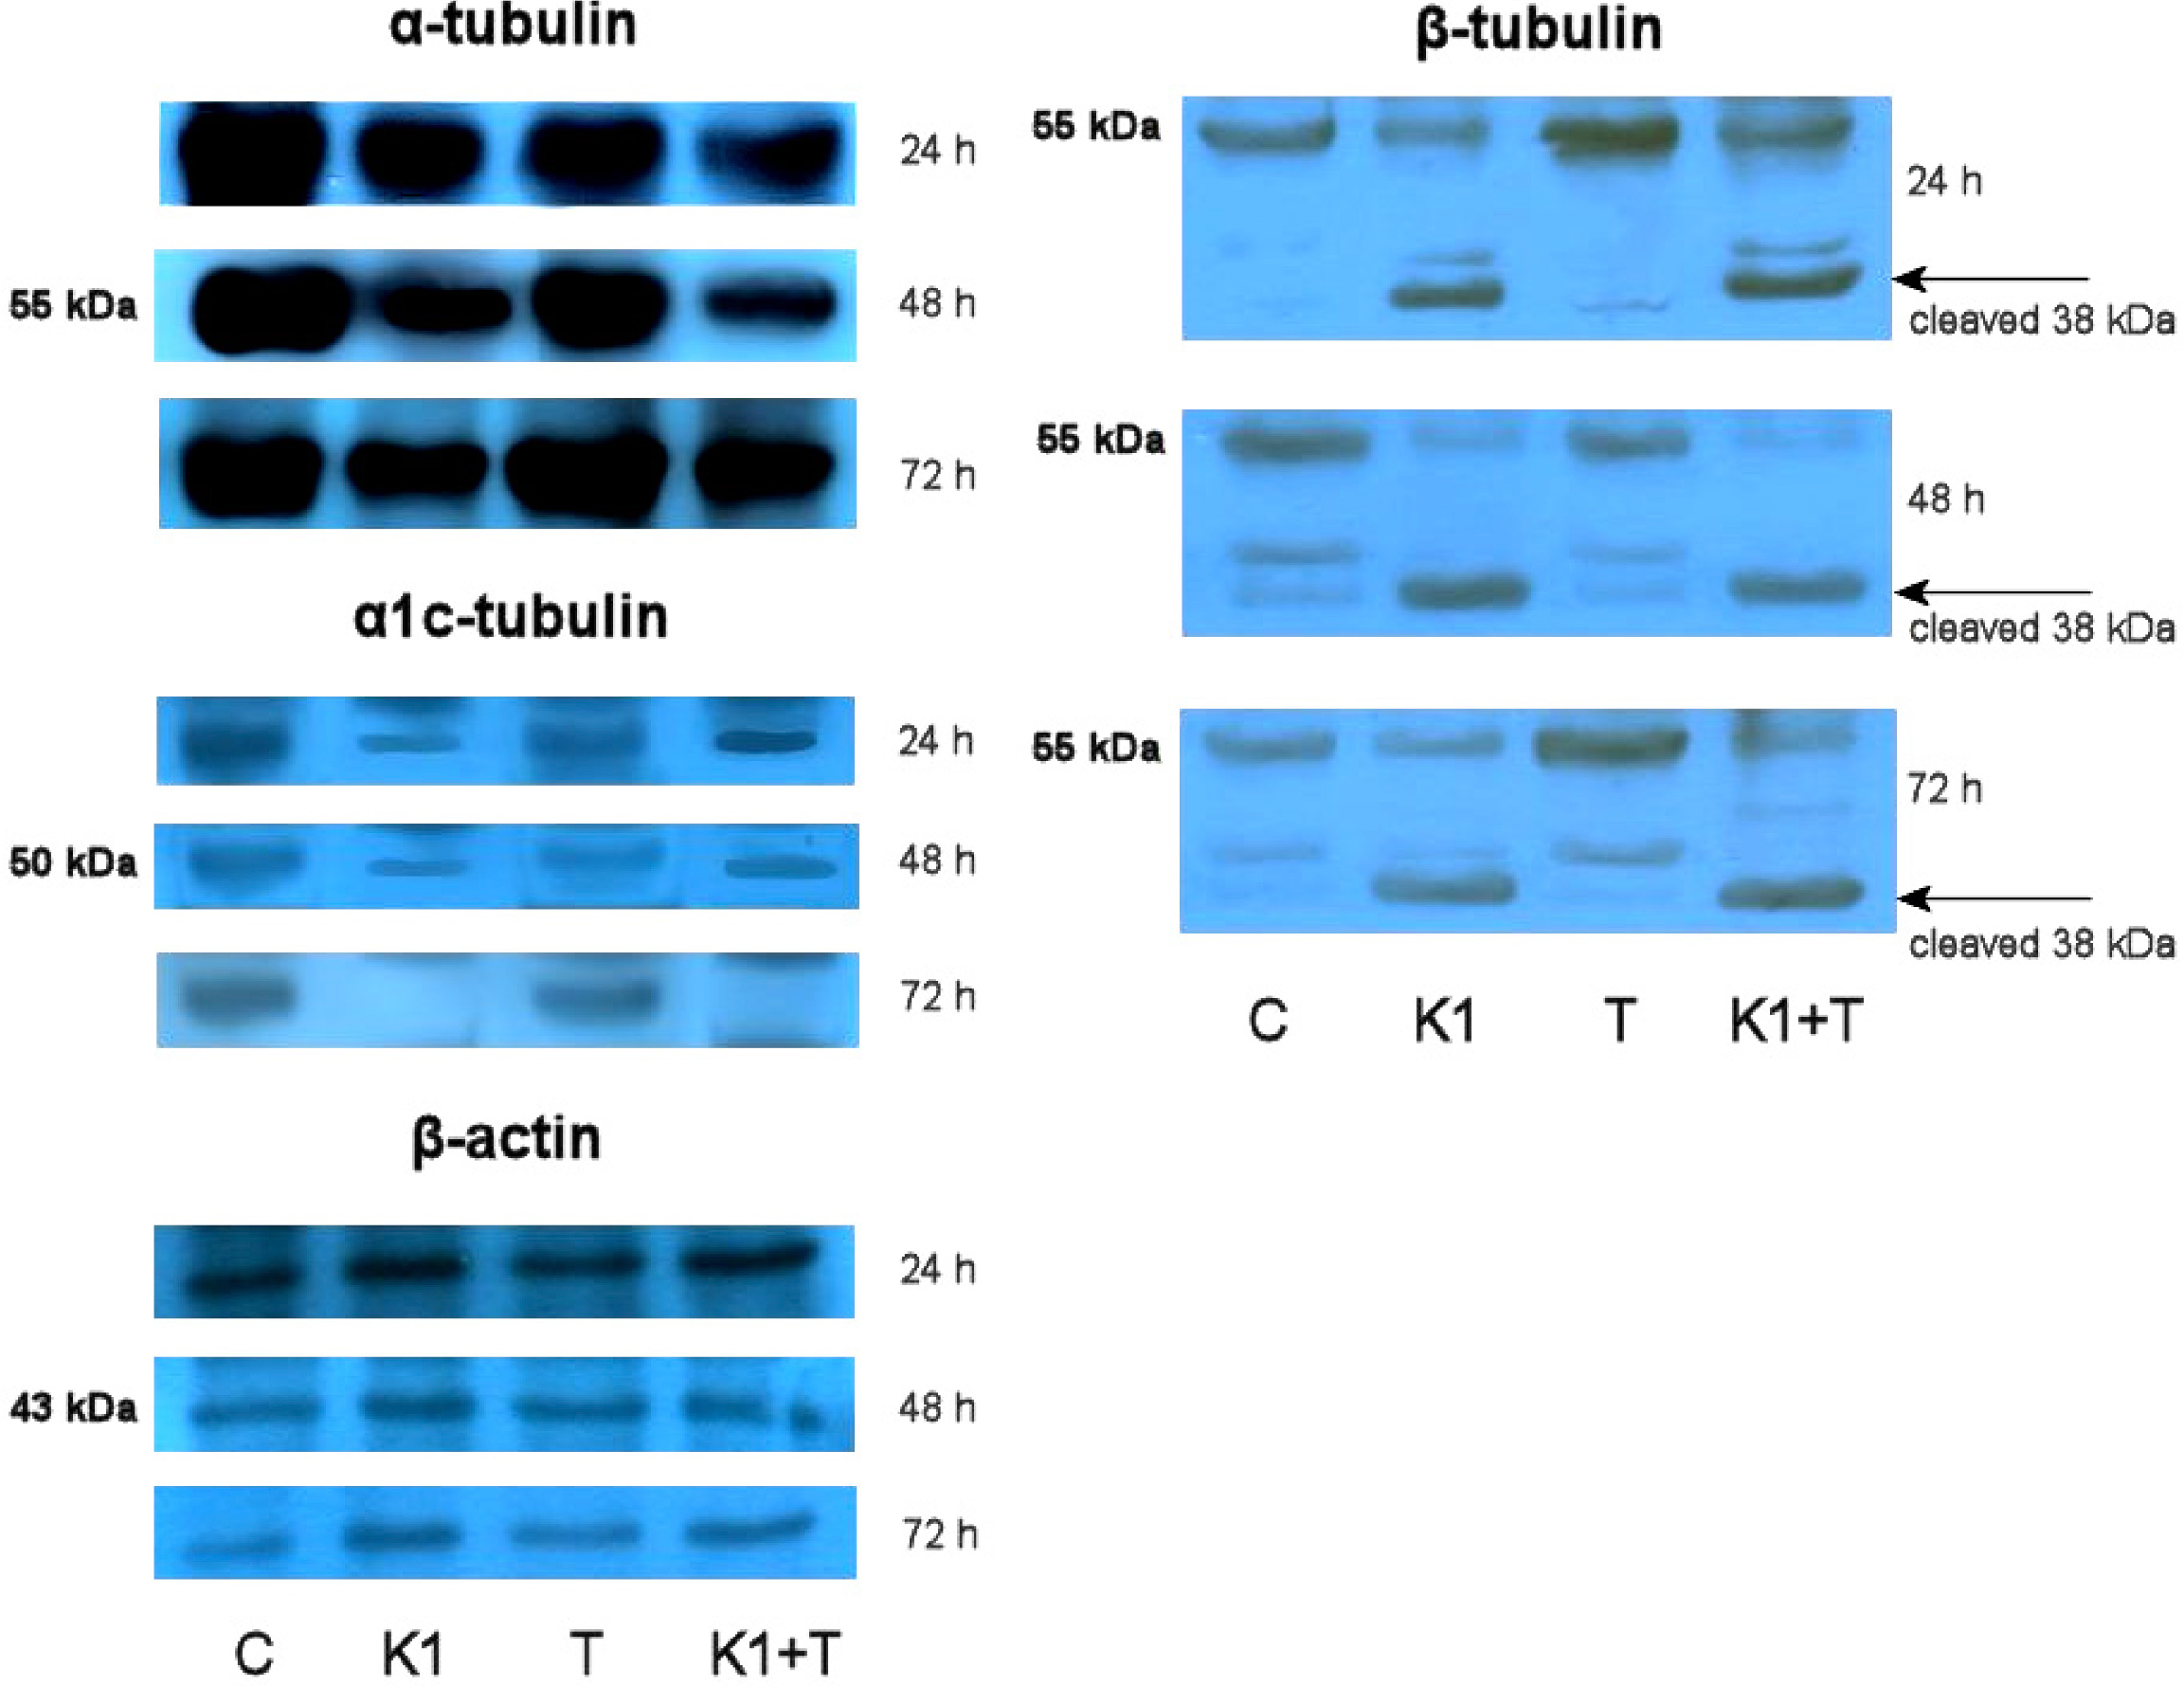
2.8. Effect of K1 on Cytoskeletal Tubulins Assembly

To determine whether the tubulins are involved in K1-mediated apoptosis of Caco2 cells, western blotting was used to detect cellular changes of α, α1c and β tubulins from whole cell lysates. All α, α1c and β tubulin levels showed a time-dependent decrease after treatment with K1 (Figure 7).
Figure 7. Western blot detection of α and β tubulins in Caco2 cells treated with K1, Trolox or mutual combinations. Cells were incubated with tested compounds for 24, 48 and 72 h. Representative picture from three independent experiments is shown. β-Actin served as a loading control.
Molecules 19 10877 g007
The β tubulin analysis also confirmed degradation and cleaving of presented protein to lower mass form. The results from both 48 and 72 h treatments indicated that tubulin levels decreased rapidly, and the effects proceeded for a long time. The correlation between changes of tubulins level and cell cycle distribution suggests that tubulin degradation may be involved in cell cycle arrest and apoptosis after K1 treatment. To explain the possible involvement of oxidative stress in the tubulin degradation, disaggregation or deregulation we used Trolox as an antioxidant to prevent an oxidative burst after K1 treatment. Data showed that Trolox alone has minimal or no effect on tubulin assembly. In combination, Trolox with K1 treatment is not able to diminish the effect of K1 on tubulin levels. Only short time treatment (24 h) with K1 and Trolox at the β tubulins level pointed to a minor Trolox effect compared with K1 treatment.

2.9. Discussion

Cancer, characterized by unregulated proliferation of cells, is the second major cause of death after cardiovascular disease [37]. Despite enormous progress in the understanding of carcinogenesis, the discovery of anticancer drugs remains a highly challenging endeavor. Natural products provide one of the most important sources of promising leads for the development of novel chemotherapeutics.
In the present study, the antiproliferative effects of brassinin and some of its synthetic derivatives on cancer cells were investigated. Our results revealed that the natural or synthesized compounds exhibited different levels of antiproliferative activity in cancer cells. Compound K1, in particular, showed much higher levels of bioactivity than naturally occurring brassinin, with IC50 = 8.0 μM in human colorectal adenocarcinoma Caco2 cells. Interestingly, K1 at lower concentration stimulated cancer cell proliferation. Similar biphasic, dose-dependent effect of natural compounds or their chemical analogues have been documented only in a limited number of studies. Polyphenols such as apigenin, quercetin, genistein or red wine polyphenols at low concentrations stimulated cell growth. On the contrary, at the higher concentrations decrease in cell proliferation was observed [38,39,40,41].
To our knowledge, this is the first report of an investigation into the effect of K1 on proliferation in cancer cells. We demonstrated that K1-induced antiproliferative effect in human colorectal Caco2 cells was related to cell cycle arrest and increase of cells with sub-G1 DNA content and induction of apoptosis, as confirmed by annexin V/PI staining, measurement of chromatin condensation, DNA fragmentation and caspase 3 activation. Our data also indicated that K1 induced apoptosis of Caco2 cells through generation of ROS and mitochondrial dysfunction, suggesting that ROS act as upstream signalling molecules for initiation of cell death.
Flow cytometric analysis showed that the K1-induced decrease in Caco2 cell viability is associated with cell cycle arrest in the G2/M phase. This result prompted us to analyse expression of selected genes involved in microtubules formation. Microtubules are built up of a heterodimer of α- and β-tubulin. These constantly growing and shortening dynamic structures are involved in many important cellular processes particularly associated with cell division [42]. Their importance in mitotic spindle formation and chromosome movement during cell division which is uncontrolled in cancer cells makes tubulin an important target for cancer therapy. The effect of the most successful antineoplastic drugs called as tubulin inhibitors, such as the taxanes and the vinca alkaloids, interfere directly with the tubulin system [43]. The tested compound K1 increased expression of α-tubulin and decreased expression of β-tubulin. Dysregulated expression of tubulins can lead to insufficiency of α/βhetero-dimer production, material necessary for mitotic spindle formation, resulting in the G2/M cell cycle arrest, eventually resulting in apoptotic cell death [44]. Furthermore, K1 treatment led to degradation or cleavage of corresponding proteins in time dependent manner (Figure 7). Presented destruction of cytoskeletal tubulin assembly also correlates with the observed apoptosis progression.
In addition to G2/M cell cycle arrest, the increase of cells with sub-G1 DNA content was observed. Compared with the control, cells with sub-G1 DNA content were increased 5.1-, 11.5- and 19.2-fold after 24, 48 and 72 h of treatment, respectively. The appearance of the sub-G1 fraction and conventional morphological signs of apoptosis provided support for the idea that K1 induced apoptosis in Caco2 cells (Figure 4). Pro-apoptotic effect of K1 was further confirmed by annexin V/PI staining. The percentage of apoptotic cells increased in a time-dependent manner (Figure 3). These findings also supported caspase 3 activation observed after K1 treatment that could be one of crucial step to execution of apoptotic features.
Mitochondria are crucial for energy production, intermediary metabolism, and calcium homeostasis [45]. On the other hand, mitochondrial dysfunction has been recognized as one of the key events occurring at the initial stages of apoptosis [46]. Several experimental studies reported a fall in the MMP during apoptosis induced by various compounds with anticancer properties [47,48,49]. Therefore, MMP changes after K1 treatment in Caco2 cells were measured.
In our study, the decrease of MMP was detected 12 h after K1 treatment, suggesting K1 induced cell apoptosis in Caco2 cells might be mitochondria dependent (Figure 5). Mitochondria are also the major sites for ROS production. It is well known that excessive generation of ROS may result in cell death [50,51]. Our results showed K1 treatment significantly stimulated ROS generation in Caco2 cells (Figure 5). To confirm role of ROS in K1-induced apoptosis and cell death, Caco2 cells were pretreated with the antioxidant Trolox. Compared to K1 treatment only, Trolox pretreatment caused a reduction in ROS levels and prevented loss of MMP as well as significantly rescued K1-induced Caco2 cytotoxicity (Figure 6). We have also demonstrated that peroxyl radical scavenging does not affect K1-mediated tubulin degradation, but we cannot disprove the involvement of other free radical forms in the shortened time of treatment shown in Figure 7.

3. Experimental Section

3.1. Test Compounds

Brassinin (1), homobrassinin (K1), N-{[1-(tert-butoxycarbonyl)indol-3-yl]methyl}-N'-methyl-N'-phenylthiourea (K10), N-{[(1-tert-butoxycarbonyl)indol-3-yl]methyl}-N'-(4-methoxyphenyl)thiourea (K124), 1-(β-d-glucopyranosyl)brassinin (47), 1-[(1R,2S,5R)-menthoxycarbonyl]brassinin (K49); 1-[(1R,2S,5R)-8-phenylmenthoxycarbonyl]brassinin (K170). The synthesis of tested compounds was described in the previous studies: 1, K1 [52]; K10, K124 [28]; 47 [53]; 49, K170 [54].

3.2. Cell Culture

The human cancer cell lines HCT116 (human colorectal carcinoma), HepG2 (human hepatocellular carcinoma), HeLa (human cervical adenocarcinoma), Jurkat (human leukemic T cell lymphoma) were cultured in RPMI 1640 medium (PAA Laboratories, Pasching, Austria) and Caco2 (human colorectal adenocarcinoma), A549 (human alveolar adenocarcinoma), MCF-7 (human Caucasian breast adenocarcinoma) and MDA-MB-231 (human mammary gland adenocarcinoma) were maintained in growth medium consisting of high glucose Dulbecco’s Modified Eagle Medium (Invitrogen, Carlsbad, CA, USA). Both media were supplemented with a 10% fetal bovine serum (FBS), penicillin (100 IU/mL) and streptomycin (100 μg/mL) (all from Invitrogen). The cells (obtained from the American Tissue Culture Collection, ATCC, Rockville, MD, USA) were maintained under standard tissue culture conditions of 37 °C, 95% air/5% CO2. Cell viability, estimated by trypan blue exclusion, was greater than 95% before each experiment. Human umbilical vein endothelial cells (HUVECs) were isolated and cultured as previously described by Ivanova et al. [55].

3.3. Growth Inhibition Assay

The antiproliferative effects of compounds were determined using colorimetric microculture assay with the MTT end-point [56]. Briefly, 3 × 10³ cells were plated per well in 96-well polystyrene microplates (Sarstedt AG & Co, Nümbrecht, Germany) in the culture medium containing tested chemicals at final concentrations of 10−4–10−6 mol/L or Trolox (6-hydroxy-2,5,7,8-tetramethylchroman-2-carboxylic acid; Fluka, Buchs, Schwitzerland) at final concentrations 300 μM, or at mutual combinations. After 72 h of incubation (for Trolox and mutual combinations also after 24 and 48 h), 10 μL of MTT (5 mg/mL) (Sigma-Aldrich Corporation, St. Louis, MO, USA) were added in each well. After an additional 4 h, during which insoluble formazan was produced, 100 μL of 10% sodium dodecyl sulfate were added in each well and another 12 h were allowed for the dissolution of formazan. The absorbance was measured at 540 nm using the automated uQuant ™ Universal Microplate Spectrophotometer (Biotek, Winooski, VT, USA). The blank-corrected absorbance of the control wells was taken as 100% and the results were expressed as a percentage of the control. All experiments were performed in triplicate. Due to spontaneous apoptosis, HUVEC cells were incubated only 48 h.

3.4. 5-Bromo-2'-Deoxyuridine (BrdU) Cell Proliferation Assay

Cell proliferation activity was directly monitored by quantification of BrdU incorporated into the genomic DNA during cell growth. DNA synthesis was assessed using colorimetric cell proliferation ELISA assay (Roche Diagnostics GmbH, Mannheim, Germany) following the vendor’s protocol. Briefly, 2 × 10³ cells/well in 80 µL medium were plated in a 96-well polystyrene microplates (Sarstedt AG & Co, Nümbrecht, Germany). Twenty-four hours after cell seeding different concentrations (10−4–10−6 mol/L) of the compound were added. After 48 h of treatment, cells were incubated with BrdU labeling solution (10 µM final concentration) for another 24 h at 37 °C followed by fixation and incubation with anti-BrdU peroxidase conjugate for an additional 1.5 h at room temperature. Finally, after substrate reaction, the stop solution was added (25 µL 1 M H2SO4) and colour intensity was measured with multi-well microplate ELISA reader at 450 nm (reference wavelength: 690 nm).

3.5. xCELLigence Cell Analysis System

The xCELLigence system is a unique, impedance-based system for cell-based assays, allowing for label-free and real-time monitoring of cellular processes such as cell growth, proliferation, cytotoxicity, adhesion, morphological dynamics and modulation of barrier function. It measures impedance changes in a meshwork of interdigitated gold microelectrodes located at the well bottom (E-plate) or at the bottom side of a microporous membrane (CIM16-plate). These changes are caused by the gradual increase of electrode surface occupation by (proliferated/ migrated/invaded) cells during the course of time and thus can provide an index of cell viability, migration and invasion. This method of quantification is directly proportional to cellular morphology, spreading, ruffling and adhesion quality as well as cell number [57,58].
The xCELLigence RTCA system was initialized, as per manufacturer’s instructions, prior to commencement of the experiment by filling all 16 wells of the E-plate (ACEA Biosciences, San Diego, CA, USA) with the growth medium (100 μL) and equilibrated at room temperature for 30 min. The plate was placed into the single plate (SP) station cradle (housed in a humidified incubator at 37 °C with a 5% CO2 atmosphere) to establish a background reading. Then, Caco2 cells were seeded in E-plates at a density of 2 × 10³ cells per well. After 24 h, K1 was added at final concentrations of 1–50 μM and cells were allowed to grow for additional 72 h under label-free conditions. The electrical impedance was measured by the RTCA-integrated software of the xCELLigence system (ACEA Biosciences) as a dimensionless parameter termed CI.

3.6. Experimental Design for Flow Cytometry Analysis

Caco2 cells (3 × 10⁵) were seeded in Petri dishes and cultivated 24 h in a complete medium with 10% FBS. Cells were treated with K1 (c = 10 µM) for 12, 24, 48 and 72 h prior to analysis. The apoptosis, caspase 3 activation and cell cycle parameters were analysed 24, 48 and 72 h after treatment. Changes in MMP and ROS production were also analysed after 12 h of incubation. To evaluate ROS-dependent/independent mechanisms of K1 treatment we used Trolox, a water-soluble analogue of vitamin E, as antioxidant. Trolox (300 μM) was used 1 h before K1 treatment and after as a co-treatment with K1 for 12, 24, 48 and 72 h before ROS and MMP analysis.

3.7. Analysis of Cell Cycle

For flow cytometric analysis (FCM) of the cell cycle, floating and adherent cells were harvested together 24, 48 and 72 h after treatment, washed in cold PBS, fixed in cold 70% ethanol and kept at −20 °C overnight. Prior to analysis, cells were washed twice in PBS, resuspended in staining solution (final concentration 0.1% Triton X-100, 0.5 mg/mL ribonuclease A and 0.025 mg/mL propidium iodide-PI), incubated in the dark at room temperature for 30 min and analysed using a FACSCalibur flow cytometer (Becton Dickinson, San Jose, CA, USA).

3.8. Annexin V-FITC Labelling

The plasma membrane changes characteristic of apoptosis were analysed by double staining with Annexin V-FITC and PI according to the manufacturer’s instructions. Adherent and floating cells (1 × 10⁵) were harvested together 24, 48 and 72 h after treatment and stained with Annexin V-FITC (BD Biosciences Pharmingen, San Diego, CA, USA) in binding buffer for 15 min, washed, stained with PI for 5 min and thereafter analysed using a BD FACSCalibur flow cytometer. Three populations of cells were observed: viable cells: Annexin V-FITC negative and PI negative; apoptotic cells: Annexin V-FITC positive and PI negative; late apoptotic/necrotic cells: Annexin V-FITC positive and PI positive or and Annexin V-FITC negative and PI positive.

3.9. Measurement of ROS

The intracellular production of ROS was detected with FCM analysis using dihydrorhodamine-123 (DHR-123, Fluka), which reacts with intracellular hydrogen peroxide. The cells treated with an appropriate agent were harvested, washed twice in PBS, and resuspended in PBS. DHR-123 was added at a final concentration of 0.2 μM. The samples were then incubated for 15 min in dark and after incubation samples were placed on ice. Fluorescence was detected with 530/30 (FL-1) optical filter. Forward and side scatters were used to gate the viable populations of cells.

3.10. Detection of MMP

The changes in MMP were analysed with FCM using tetramethylrhodamine ethyl ester per chlorate (TMRE, Molecular Probes, Eugene, OR, USA). The cells were washed with PBS, resuspended in 0.1 μM of TMRE in PBS, and incubated for 30 min at room temperature in the dark. The cells were then washed twice with PBS, resuspended in 500 μM of the total volume, and analysed (1 × 10⁴ cell per sample). Fluorescence was detected with 585/42 (FL-2) optical filter.

3.11. Detection of Active Caspase 3

The changes in caspase 3 activation were analysed with FCM using BD Pharmingen Active Caspase-3 PE MAb Apoptosis kit (BD Bioscience, San Diego, CA, USA). The cells were prepared according to manufactory condition and stained with PE conjugated antibody and incubated for 30 min at room temperature in the dark. The cells were then washed twice with PBS, resuspended in 500 μM of the total volume, and analysed (1 × 10⁴ cell per sample). Fluorescence was detected with 585/42 (FL-2) optical filter.

3.12. DNA Fragmentation Assay

The culture medium was removed from untreated (1 × 10⁶) and treated Caco2 cells (K1 10 μM for 24, 48 and 72 h and 10 μM of cisplatin as positive control) and centrifuged at 1300 rpm for 5 min to collect them. Cells were washed twice with PBS calcium and magnesium free. Then cells were lysed in a lysis buffer containing 10 mmol/L EDTA, 0.5% Triton X-100. Proteinase K (1 mg/mL) was added and cells were incubated at 37 °C for 1 h followed by 10 min incubation at 70 °C. RNase (200 µg/mL) was added and cells were incubated for another 1 h at 37 °C. Samples were transferred to 2% agarose gel and run with 40 V for 3 h. DNA fragments were visualized by a UV illuminator.

3.13. DAPI Staining

Twenty four hours after treatment (K1 10 μM), Caco2 cells grown on cover slips were fixed with 2% paraformaldehyde for 20 min at 4 °C. After incubation, the cells were washed briefly with PBS and incubated at room temperature with SlowFade® Gold antifade reagent with 4',6-diaminidino-2-phenyl-indole, dihydrochloride (DAPI) (Invitrogen) for nuclear visualization. The slides were analysed using fluorescence microscope Leica DMI6000 B (Leica Microsystems, Inc., Bannockburn, IL, USA) and evaluated as percentages of cells with a fragmented nucleus from a minimum of 300 cells.

3.14. RNA Isolation and cDNA Synthesis

Total RNA was isolated from Caco2 cells using the TRI Reagent (Molecular Research Center, Inc., Cincinnati, OH, USA) according to the manufacturer’s instruction. Total RNA quality was verified on an agarose gel. Total RNA (0.5 µg) was reverse transcribed into cDNA by the RevertAidTM H Minus First Strand cDNA synthesis kit (Fermentas GmbH, St. Leon-Rot, Germany) according to the manufacturer’s instruction, and used for quantitative real time PCR.

3.15. Quantitative Real-Time PCR

Quantitative real time PCR analysis was performed in Light Cycler (Roche, Mannheim, Germany) using iQTM SYBR Green Supermix (Bio-Rad Laboratories, Hercules, CA, USA) to verify the alterations of α-tubulin, α1-tubulin, β5-tubulin gene expression. The PCR program was initiated by 5 min at 95 °C before 40 thermal cycles, each of 30 s at 95 °C and 45 s at 55 °C. Data were analysed according to the comparative Ct method and were normalized by β-actin expression in each sample. Melting curves for each PCR reaction were generated to ensure the purity of the amplification product.

3.16. Western Blot Analysis

Caco2 cells were treated with compound K1 (10 μM), Trolox (300 μM) and mutual combinations for 24, 48 and 72 h. Protein extracts were obtained using a lysis buffer containing 100 mM Tris (pH 7.4), 1% SDS and 10% glycerol in the presence of PIC (protease inhibitor cocktail), for 30 min on ice. After the insoluble materials were removed by centrifugation at 12,000 g for 10 min at 4 °C, total protein concentrations were quantified using the Pierce® BCA Protein Assay Kit (Thermo Fisher Scientific, Waltham, MA, USA). Twenty micrograms of total cellular proteins were separated on 10% SDS polyacrylamide gels and electrotransferred onto nitrocellulose membranes (Pall Corporation, Port Washington, NY, USA). Membranes were blocked in 5% skim milk in Tris-buffered saline (TBS) containing 0.1% Tween-20 for 1 h at room temperature to minimize non-specific binding and incubated with the primary antibodies overnight at 4 °C. Immunoblotting was carried out with α Tubulin (E-19), α1c Tubulin (MH-87), β Tubulin (H-235) and β-Actin (C4) Antibody (all from Santa Cruz Biotechnology, Inc. Dallas, Texas, USA). After incubation with primary antibodies, membranes were washed 1 × 5 min with TBS-Tween followed by an incubation of 1 h at room temperature with the corresponding horseradish peroxidase-conjugated secondary antibodies (anti-rabbit IgG-HRP, anti-mouse IgG-HRP, all from Sigma-Aldrich). After washing 4 × 10 min with TBS-Tween expression was detected by chemiluminescence emission using ECL (Thermo Fisher Scientific) and then the blots were exposed to x-ray films.

3.17. Statistical Analysis

Results are expressed as mean ± SD. Statistical analyses of the data were performed using standard procedures, with one-way ANOVA followed by the Bonferroni multiple comparisons test. Differences were considered significant when p values were smaller than 0.05.

4. Conclusions

In summary, the results revealed that K1 exhibited the highest levels of antiproliferative activity against Caco2 colon cancer cells and was selected for follow-up study. The cell cycle results demonstrated that K1 induced time-dependent G2/M arrest simultaneously with an increase in cells with sub-G1 DNA content. Furthermore, the apoptosis data showed that K1 induced cellular apoptosis as confirmed by annexin V/PI double staining, DNA fragmentation and chromatin condensation. Moreover, increased ROS generation and loss of MMP and caspase 3 activation supported these findings. Application of Trolox, a water-soluble analogue of vitamin E, diminished Ros production and loss of MMP and prevented cytotoxicity of K1 in Caco2 cells. These results insinuate that K1 may inhibit the growth of colon cancer cells by inducing apoptosis through ROS-mitochondrial pathway. Although many details of the effects of K1 remain to be elucidated, the in vitro findings of the present study provide the basis for future in vitro and in vivo studies.

Acknowledgments

This study was supported (50%) by the project Medicínsky univerzitný park v Košiciach (MediPark, Košice) ITMS: 26220220185 (95%) supported by Operational Programme Research and Development (OP VaV-2012/2.2/08-RO) (Contract No. OPVaV/12/2013.) We would like also to thank the Slovak Grant Agency for Science (Grant No. 1/0322/14) for financial support of this work.

Author Contributions

Conceived and designed the experiments: JM, MK. Performed the experiments: MK, DD, MCh, MP. Synthesis of indole phytoalexins: MB. Analysed the data: JM, MK. Contributed reagents/materials/analysis tools: MK, DD, MCh, MP, LK, PU. Wrote the manuscript: JM, MK. All authors read and approved the final manuscript.

Conflicts of Interest

The authors declare no conflict of interest.

References

  1. Han, B.; Li, X.; Yu, T. Cruciferous vegetables consumption and the risk of ovarian cancer: A meta-analysis of observational studies. Diagn. Pathol. 2014, 9, 1–7. [Google Scholar] [CrossRef]
  2. Tse, G.; Eslick, G.D. Cruciferous vegetables and risk of colorectal neoplasms: A systematic review and meta-analysis. Nutr. Cancer 2014, 66, 128–139. [Google Scholar] [CrossRef]
  3. Liu, B.; Mao, Q.; Wang, X.; Zhou, F.; Luo, J.; Wang, C.; Lin, Y.; Zheng, X.; Xie, L. Cruciferous vegetables consumption and risk of renal cell carcinoma: A meta-analysis. Nutr. Cancer 2013, 65, 668–676. [Google Scholar] [CrossRef]
  4. Aras, U.; Gandhi, Y.A.; Masso-Welch, P.A.; Morris, M.E. Chemopreventive and anti-angiogenic effects of dietary phenethyl isothiocyanate in an N-methyl nitrosourea-induced breast cancer animal model. Biopharm. Drug Dispos. 2013, 34, 98–106. [Google Scholar] [CrossRef]
  5. Abdull Razis, A.F.; Noor, N.M. Cruciferous vegetables: Dietary phytochemicals for cancer prevention. Asian Pac. J. Cancer Prev. 2013, 14, 1565–1570. [Google Scholar] [CrossRef]
  6. Izutani, Y.; Yogosawa, S.; Sowa, Y.; Sakai, T. Brassinin induces G1 phase arrest through increase of p21 and p27 by inhibition of the phosphatidylinositol 3-kinase signalling pathway in human colon cancer cells. Int. J. Oncol 2012, 40, 816–824. [Google Scholar]
  7. Kim, S.M.; Park, J.H.; Kim, K.D.; Nam, D.; Shim, B.S.; Kim, S.H.; Ahn, K.S.; Choi, S.H. Brassinin induces apoptosis in PC-3 human prostate cancer cells through the suppression of PI3K/Akt/mTOR/S6K1 signalling cascades. Phytother. Res. 2014, 28, 423–431. [Google Scholar] [CrossRef]
  8. Smith, B.; Randle, D.; Mezencev, R.; Thomas, L.; Hinton, C.; Odero-Marah, V. Camalexin-induced apoptosis in prostate cancer cells involves alterations of expression and activity of lysosomal protease cathepsind. Molecules 2014, 19, 3988–4005. [Google Scholar] [CrossRef]
  9. Pedras, M.S.; Yaya, E.E.; Glawischnig, E. The phytoalexins from cultivated and wild crucifers: Chemistry and biology. Nat. Prod. Rep. 2011, 28, 1381–1405. [Google Scholar] [CrossRef]
  10. Jeandet, P.; Clement, C.; Courot, E.; Cordelier, S. Modulation of phytoalexin biosynthesis in engineered plants for disease resistance. Int. J. Mol. Sci. 2013, 14, 14136–14170. [Google Scholar] [CrossRef]
  11. Borriello, A.; Bencivenga, D.; Caldarelli, I.; Tramontano, A.; Borgia, A.; Zappia, V.; Della Ragione, F. Resveratrol: From basic studies to bedside. Cancer Treat. Res. 2014, 159, 167–184. [Google Scholar] [CrossRef]
  12. Kim, H.J.; Lim, J.S.; Kim, W.K.; Kim, J.S. Soyabean glyceollins: Biological effects and relevance to human health. Proc. Nutr. Soc. 2012, 71, 166–174. [Google Scholar] [CrossRef]
  13. Moody, C.J.; Roffey, J.R.; Stephens, M.A.; Stratford, I.J. Synthesis and cytotoxic activity of indolyl thiazoles. Anticancer Drugs 1997, 8, 489–499. [Google Scholar] [CrossRef]
  14. Yang, Q.; Wang, B.; Zang, W.; Wang, X.; Liu, Z.; Li, W.; Jia, J. Resveratrol inhibits the growth of gastric cancer by inducing G1 phase arrest and senescence in a Sirt1-dependent manner. PLoS One 2013, 8, e70627. [Google Scholar]
  15. Romagnolo, D.F.; Davis, C.D.; Milner, J.A. Phytoalexins in cancer prevention. Front. Biosci. 2012, 17, 2035–2058. [Google Scholar] [CrossRef]
  16. Yin, H.T.; Tian, Q.Z.; Guan, L.; Zhou, Y.; Huang, X.E.; Zhang, H. In vitro and in vivo evaluation of the antitumor efficiency of resveratrol against lung cancer. Asian Pac. J. Cancer Prev. 2013, 14, 1703–1706. [Google Scholar] [CrossRef]
  17. Mezencev, R.; Mojzis, J.; Pilatova, M.; Kutschy, P. Antiproliferative and cancer chemopreventive activity of phytoalexins: Focus on indole phytoalexins from crucifers. Neoplasma 2003, 50, 239–245. [Google Scholar]
  18. Curillova, Z.; Kutschy, P.; Solcaniova, E.; Pilatova, M.; Mojzis, J.; Kovacik, V. Synthesis and antiproliferative activity of 1-methoxy-, 1-(α-d-ribofuranosyl)- and 1-(β-d-ribofuranosyl)brassenin B. ARKIVOC 2008, 8, 85–104. [Google Scholar]
  19. Mezencev, R.; Kutschy, P.; Salayova, A.; Curillova, Z.; Mojzis, J.; Pilatova, M.; McDonald, J. Anticancer properties of 2-piperidyl analogues of the natural indole phytoalexin 1-methoxyspirobrassinol. Chemotherapy 2008, 54, 372–378. [Google Scholar] [CrossRef]
  20. Kutschy, P.; Salayova, A.; Curillova, Z.; Kozar, T.; Mezencev, R.; Mojzis, J.; Pilatova, M.; Balentova, E.; Pazdera, P.; Sabol, M.; et al. 2-(Substituted phenyl)amino analogs of 1-methoxyspirobrassinol methyl ether: synthesis and anticancer activity. Bioorg. Med. Chem. 2009, 17, 3698–3712. [Google Scholar] [CrossRef]
  21. Pilatova, M.; Ivanova, L.; Kutschy, P.; Varinska, L.; Saxunova, L.; Repovska, M.; Sarissky, M.; Seliga, R.; Mirossay, L.; Mojzis, J. In vitro toxicity of camalexin derivatives in human cancer and non-cancer cells. Toxicol. In Vitro 2013, 27, 939–944. [Google Scholar] [CrossRef]
  22. Takasugi, M.; Katsui, N.; Shirata, A. Isolation of 3 novel sulfur-containing phytoalexins from the Chinese-cabbage brassica-campestris L ssp pekinensis (cruciferae). J. Chem Soc. Chem Commun. 1986, 14, 1077–1078. [Google Scholar] [CrossRef]
  23. Mehta, R.G.; Liu, J.; Constantinou, A.; Thomas, C.F.; Hawthorne, M.; You, M.; Gerhuser, C.; Pezzuto, J.M.; Moon, R.C.; Moriarty, R.M. Cancer chemopreventive activity of brassinin, a phytoalexin from cabbage. Carcinogenesis 1995, 16, 399–404. [Google Scholar] [CrossRef]
  24. Csomos, P.; Zupko, I.; Rethy, B.; Fodor, L.; Falkay, G.; Bernath, G. Isobrassinin and its analogues: Novel types of antiproliferative agents. Bioorg. Med. Chem. Lett. 2006, 16, 6273–6276. [Google Scholar] [CrossRef]
  25. Pilatova, M.; Sarissky, M.; Kutschy, P.; Mirossay, A.; Mezencev, R.; Curillova, Z.; Suchy, M.; Monde, K.; Mirossay, L.; Mojzis, J. Cruciferous phytoalexins: Antiproliferative effects in T-Jurkat leukemic cells. Leuk. Res. 2005, 29, 415–421. [Google Scholar] [CrossRef]
  26. Monde, K.; Taniguchi, T.; Miura, N.; Kutschy, P.; Curillova, Z.; Pilatova, M.; Mojzis, J. Chiral cruciferous phytoalexins: Preparation, absolute configuration, and biological activity. Bioorg. Med. Chem. 2005, 13, 5206–5212. [Google Scholar] [CrossRef]
  27. Kutschy, P.; Sykora, A.; Curillova, Z.; Repovska, M.; Pilatova, M.; Mojzis, J.; Mezencev, R.; Pazdera, P.; Hromjakova, T. Glyoxyl analogs of indole phytoalexins: Synthesis and anticancer activity. Collect. Czech. Chem. C 2010, 75, 887–903. [Google Scholar] [CrossRef]
  28. Budovska, M.; Pilatova, M.; Varinska, L.; Mojzis, J.; Mezencev, R. The synthesis and anticancer activity of analogs of the indole phytoalexins brassinin, 1-methoxyspirobrassinol methyl ether and cyclobrassinin. Bioorg. Med. Chem. 2013, 21, 6623–6633. [Google Scholar] [CrossRef]
  29. Ocenas, P.; Tomasova, L.; Kutschy, P.; Pazdera, P.; Mojzis, J.; Pilatova, M. Spirocyclisation of phytoalexin 1-methoxybrassinin in the presence of Grignard reagents. Chem. Pap. 2013, 67, 631–642. [Google Scholar] [CrossRef]
  30. Chripkova, M.; Drutovic, D.; Pilatova, M.; Mikes, J.; Budovska, M.; Vaskova, J.; Brogginy, M.; Mirossay, L.; Mojzis, J. Brassinin and its derivatives as potential anticancer agents. Toxicol. In Vitro 2014, 28, 907–915. [Google Scholar]
  31. Banerjee, T.; Duhadaway, J.B.; Gaspari, P.; Sutanto-Ward, E.; Munn, D.H.; Mellor, A.L.; Malachowski, W.P.; Prendergast, G.C.; Muller, A.J. A key in vivo antitumor mechanism of action of natural product-based brassinins is inhibition of indoleamine 2,3-dioxygenase. Oncogene 2008, 27, 2851–2857. [Google Scholar] [CrossRef]
  32. Patel, P.B.; Thakkar, V.R. l-Carvone induces p53, caspase 3 mediated apoptosis and inhibits the migration of breast cancer cell lines. Nutr. Cancer 2014, 66, 453–462. [Google Scholar] [CrossRef]
  33. Zhao, B.; Li, X. Altholactone induces reactive oxygen species-mediated apoptosis in bladder cancer T24 cells through mitochondrial dysfunction, MAPK-p38 activation and Akt suppression. Oncol. Rep. 2014, 31, 2769–2775. [Google Scholar]
  34. Mezencev, R.; Updegrove, T.; Kutschy, P.; Repovska, M.; McDonald, J.F. Camalexin induces apoptosis in T-leukemia Jurkat cells by increased concentration of reactive oxygen species and activation of caspase-8 and caspase-9. J. Nat. Med. 2011, 65, 488–499. [Google Scholar] [CrossRef]
  35. Smith, B.A.; Neal, C.L.; Chetram, M.; Vo, B.; Mezencev, R.; Hinton, C.; Odero-Marah, V.A. The phytoalexin camalexin mediates cytotoxicity towards aggressive prostate cancer cells via reactive oxygen species. J. Nat. Med. 2013, 67, 607–618. [Google Scholar] [CrossRef]
  36. Circu, M.L.; Aw, T.Y. Reactive oxygen species, cellular redox systems, and apoptosis. Free Radic. Biol. Med. 2010, 48, 749–762. [Google Scholar] [CrossRef]
  37. Jemal, A.; Bray, F.; Center, M.M.; Ferlay, J.; Ward, E.; Forman, D. Global cancer statistics. CA Cancer J. Clin. 2011, 61, 69–90. [Google Scholar] [CrossRef]
  38. Long, X.; Fan, M.; Bigsby, R.M.; Nephew, K.P. Apigenin inhibits antiestrogen-resistant breast cancer cell growth through estrogen receptor-alpha-dependent and estrogen receptor-alpha-independent mechanisms. Mol. Cancer Ther. 2008, 7, 2096–2108. [Google Scholar] [CrossRef]
  39. ElAttar, T.M.; Virji, A.S. Modulating effect of resveratrol and quercetin on oral cancer cell growth and proliferation. Anticancer Drugs 1999, 10, 187–193. [Google Scholar] [CrossRef]
  40. Baron-Menguy, C.; Bocquet, A.; Guihot, A.L.; Chappard, D.; Amiot, M.J.; Andriantsitohaina, R.; Loufrani, L.; Henrion, D. Effects of red wine polyphenols on postischemic neovascularization model in rats: Low doses are proangiogenic, high doses anti-angiogenic. FASEB J. 2007, 21, 3511–3521. [Google Scholar] [CrossRef]
  41. Choi, E.J.; Kim, G.H. Antiproliferative activity of daidzein and genistein may be related to ERalpha/c-erbB-2 expression in human breast cancer cells. Mol. Med. Rep. 2013, 7, 781–784. [Google Scholar]
  42. Downing, K.H.; Nogales, E. Tubulin and microtubule structure. Curr. Opin. Cell. Biol. 1998, 10, 16–22. [Google Scholar] [CrossRef]
  43. Perez, E.A. Microtubule inhibitors: Differentiating tubulin-inhibiting agents based on mechanisms of action, clinical activity, and resistance. Mol. Cancer Ther. 2009, 8, 2086–2095. [Google Scholar] [CrossRef]
  44. Jordan, M.A.; Wilson, L. Microtubules as a target for anticancer drugs. Nat. Rev. Cancer 2004, 4, 253–265. [Google Scholar] [CrossRef]
  45. Kang, J.; Pervaiz, S. Mitochondria: Redox metabolism and dysfunction. Biochem. Res. Int. 2012, 2012, 896751. [Google Scholar]
  46. Green, D.R. Apoptotic pathways: Ten minutes to dead. Cell 2005, 121, 671–674. [Google Scholar] [CrossRef]
  47. Erejuwa, O.O.; Sulaiman, S.A.; Wahab, M.S. Effects of honey and its mechanisms of action on the development and progression of cancer. Molecules 2014, 19, 2497–2522. [Google Scholar] [CrossRef]
  48. Villena, J.; Madrid, A.; Montenegro, I.; Werner, E.; Cuellar, M.; Espinoza, L. Diterpenylhydroquinones from natural ent-labdanes induce apoptosis through decreased mitochondrial membrane potential. Molecules 2013, 18, 5348–5359. [Google Scholar] [CrossRef]
  49. Yang, T.; Li, M.H.; Liu, J.; Huang, N.; Li, N.; Liu, S.N.; Liu, Y.; Zhang, T.; Zou, Q.; Li, H. Benzimidazole derivative, BMT-1, induces apoptosis in multiple myeloma cells via a mitochondrial-mediated pathway involving H+/K+-ATPase inhibition. Oncol. Rep. 2014. [Google Scholar] [CrossRef]
  50. Thangam, R.; Senthilkumar, D.; Suresh, V.; Sathuvan, M.; Sivasubramanian, S.; Pazhanichamy, K.; Gorlagunta, P.K.; Kannan, S.; Gunasekaran, P.; Rengasamy, R.; et al. Induction of ROS-dependent mitochondria-mediated intrinsic apoptosis in MDA-MB-231 cells by glycoprotein from codium decorticatum. J. Agric. Food Chem. 2014, 62, 3410–3421. [Google Scholar] [CrossRef]
  51. Duan, D.; Zhang, B.; Yao, J.; Liu, Y.; Fang, J. Shikonin targets cytosolic thioredoxin reductase to induce ROS-mediated apoptosis in human promyelocytic leukemia HL-60 cells. Free Radic. Biol. Med. 2014, 70, 182–193. [Google Scholar] [CrossRef]
  52. Gaspari, P.; Banerjee, T.; Malachowski, W.P.; Muller, A.J.; Prendergast, G.C.; DuHadaway, J.; Bennett, S.; Donovan, A.M. Structure-activity study of brassinin derivatives as indoleamine 2,3-dioxygenase inhibitors. J. Med. Chem. 2006, 49, 684–692. [Google Scholar] [CrossRef]
  53. Kutschy, P.; Sabol, M.; Maruskova, R.; Curillova, Z.; Dzurilla, M.; Geci, I.; Alfoldi, J.; Kovacik, V. A linear synthesis of 1-(beta-d-glucopyranosyl)brassinin, -brassenin A, -brassenin B and 9-(beta-d-glucopyranosyl)-cyclobrassinin. Collect. Czech. Chem. Commun. 2004, 69, 850–866. [Google Scholar] [CrossRef]
  54. Budovska, M.; Kutschy, P.; Kozar, T.; Gondova, T.; Petrovaj, J. Synthesis of spiroindoline phytoalexin (S)-(−)-spirobrassinin and its unnatural (R)-(+)-enantiomer. Tetrahedron 2013, 69, 1092–1104. [Google Scholar] [CrossRef]
  55. Ivanova, L.; Varinska, L.; Pilatova, M.; Gal, P.; Solar, P.; Perjesi, P.; Smetana, K., Jr.; Ostro, A.; Mojzis, J. Cyclic chalcone analogue KRP6 as a potent modulator of cell proliferation: An in vitro study in HUVECs. Mol. Biol. Rep. 2013, 40, 4571–4580. [Google Scholar] [CrossRef]
  56. Mosmann, T. Rapid colorimetric assay for cellular growth and survival: Application to proliferation and cytotoxicity assays. J. Immunol. Meth. 1983, 65, 55–63. [Google Scholar] [CrossRef]
  57. Limame, R.; Wouters, A.; Pauwels, B.; Fransen, E.; Peeters, M.; Lardon, F.; de Wever, O.; Pauwels, P. Comparative analysis of dynamic cell viability, migration and invasion assessments by novel real-time technology and classic endpoint assays. PLoS One 2012, 7, e46536. [Google Scholar] [CrossRef] [Green Version]
  58. Ke, N.; Wang, X.; Xu, X.; Abassi, Y.A. The xCELLigence system for real-time and label-free monitoring of cell viability. Methods Mol. Biol. 2011, 740, 33–43. [Google Scholar] [CrossRef]
  • Sample Availability: Sample of the compound K1 is available from the authors.

