Article

Constituents of the Roots and Leaves of Ekebergia capensis and Their Potential Antiplasmodial and Cytotoxic Activities

1
Kenya Medical Research Institute, Centre for Traditional Medicine and Drug Research, P.O. Box 54840-00200, Nairobi 00200, Kenya
2
Department of Chemistry, University of Nairobi, P.O. Box 30197-00100, Nairobi 00100, Kenya
3
Sahlgrenska Cancer Centre, University of Gothenburg, Gothenburg SE-405 30, Sweden
4
Kenya Medical Research Institute, Centre for Biotechnology Research and Development, P.O. Box 54840-00200, Nairobi 00200, Kenya
5
Department of Chemistry and Molecular Biology, University of Gothenburg, Gothenburg SE-412 96, Sweden
6
Swedish-NMR Centre, University of Gothenburg, Gothenburg SE-405 30, Sweden
*
Authors to whom correspondence should be addressed.
Molecules 2014, 19(9), 14235-14246; https://doi.org/10.3390/molecules190914235
Submission received: 18 July 2014 / Revised: 24 August 2014 / Accepted: 2 September 2014 / Published: 10 September 2014
(This article belongs to the Collection Bioactive Compounds)

Abstract

:
A new triterpenoid, 3-oxo-12β-hydroxy-oleanan-28,13β-olide (1), and six known triterpenoids 27 were isolated from the root bark of Ekebergia capensis, an African medicinal plant. A limonoid 8 and two glycoflavonoids 910 were found in its leaves. The metabolites were identified by NMR and MS analyses, and their cytotoxicity was evaluated against the mammalian African monkey kidney (vero), mouse breast cancer (4T1), human larynx carcinoma (HEp2) and human breast cancer (MDA-MB-231) cell lines. Out of the isolates, oleanonic acid (2) showed the highest cytotoxicity, i.e., IC50’s of 1.4 and 13.3 µM against the HEp2 and 4T1 cells, respectively. Motivated by the higher cytotoxicity of the crude bark extract as compared to the isolates, the interactions of oleanonic acid (2) with five triterpenoids 37 were evaluated on vero cells. In an antiplasmodial assay, seven of the metabolites were observed to possess moderate activity against the D6 and W2 strains of P. falciparum (IC50 27.1–97.1 µM), however with a low selectivity index (IC50(vero)/IC50(P. falciparum-D6) < 10). The observed moderate antiplasmodial activity may be due to general cytotoxicity of the isolated triterpenoids.

Graphical Abstract

1. Introduction

Ekebergia capensis Sparrm (Meliaceae) is a deciduous tree attaining a height of up to 30 m. It is widely distributed in the central and Nyanza regions of Kenya [1,2], and is also widespread in South Africa, Swaziland, Zimbabwe, Uganda and Ethiopia. The Zulu community in South Africa uses its wood to facilitate childbirth [3]. In Kenya, the Sabaot community uses its leaf macerations internally and externally to treat headache, fever, cough and skin diseases, while the Agĩkũyũ community treats diarrhea with its stem bark [1,4]. Pharmacological studies have indicated antiplasmodial, antiinflammatory, hypotensive, uterotonic and antituberculotic activities of the crude extracts of this plant [3,5,6,7,8], providing scientific support for their indigenous use. Phytochemical investigations of its stem bark led to isolation of triterpenoids, steroids and flavonoids [3,9,10]. The safe application of E. capensis in traditional medicine requires the presence of metabolites with useful pharmacological properties and low toxicity levels. Here, the isolation, spectroscopic identification, and biological evaluation of the constituents of E. capensis root bark and leaf extracts are reported, with special attention given to the evaluation of the cytotoxicity of the constituents.

2. Results and Discussion

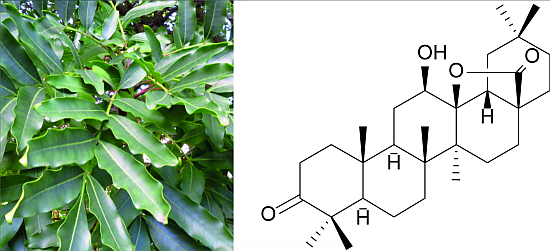
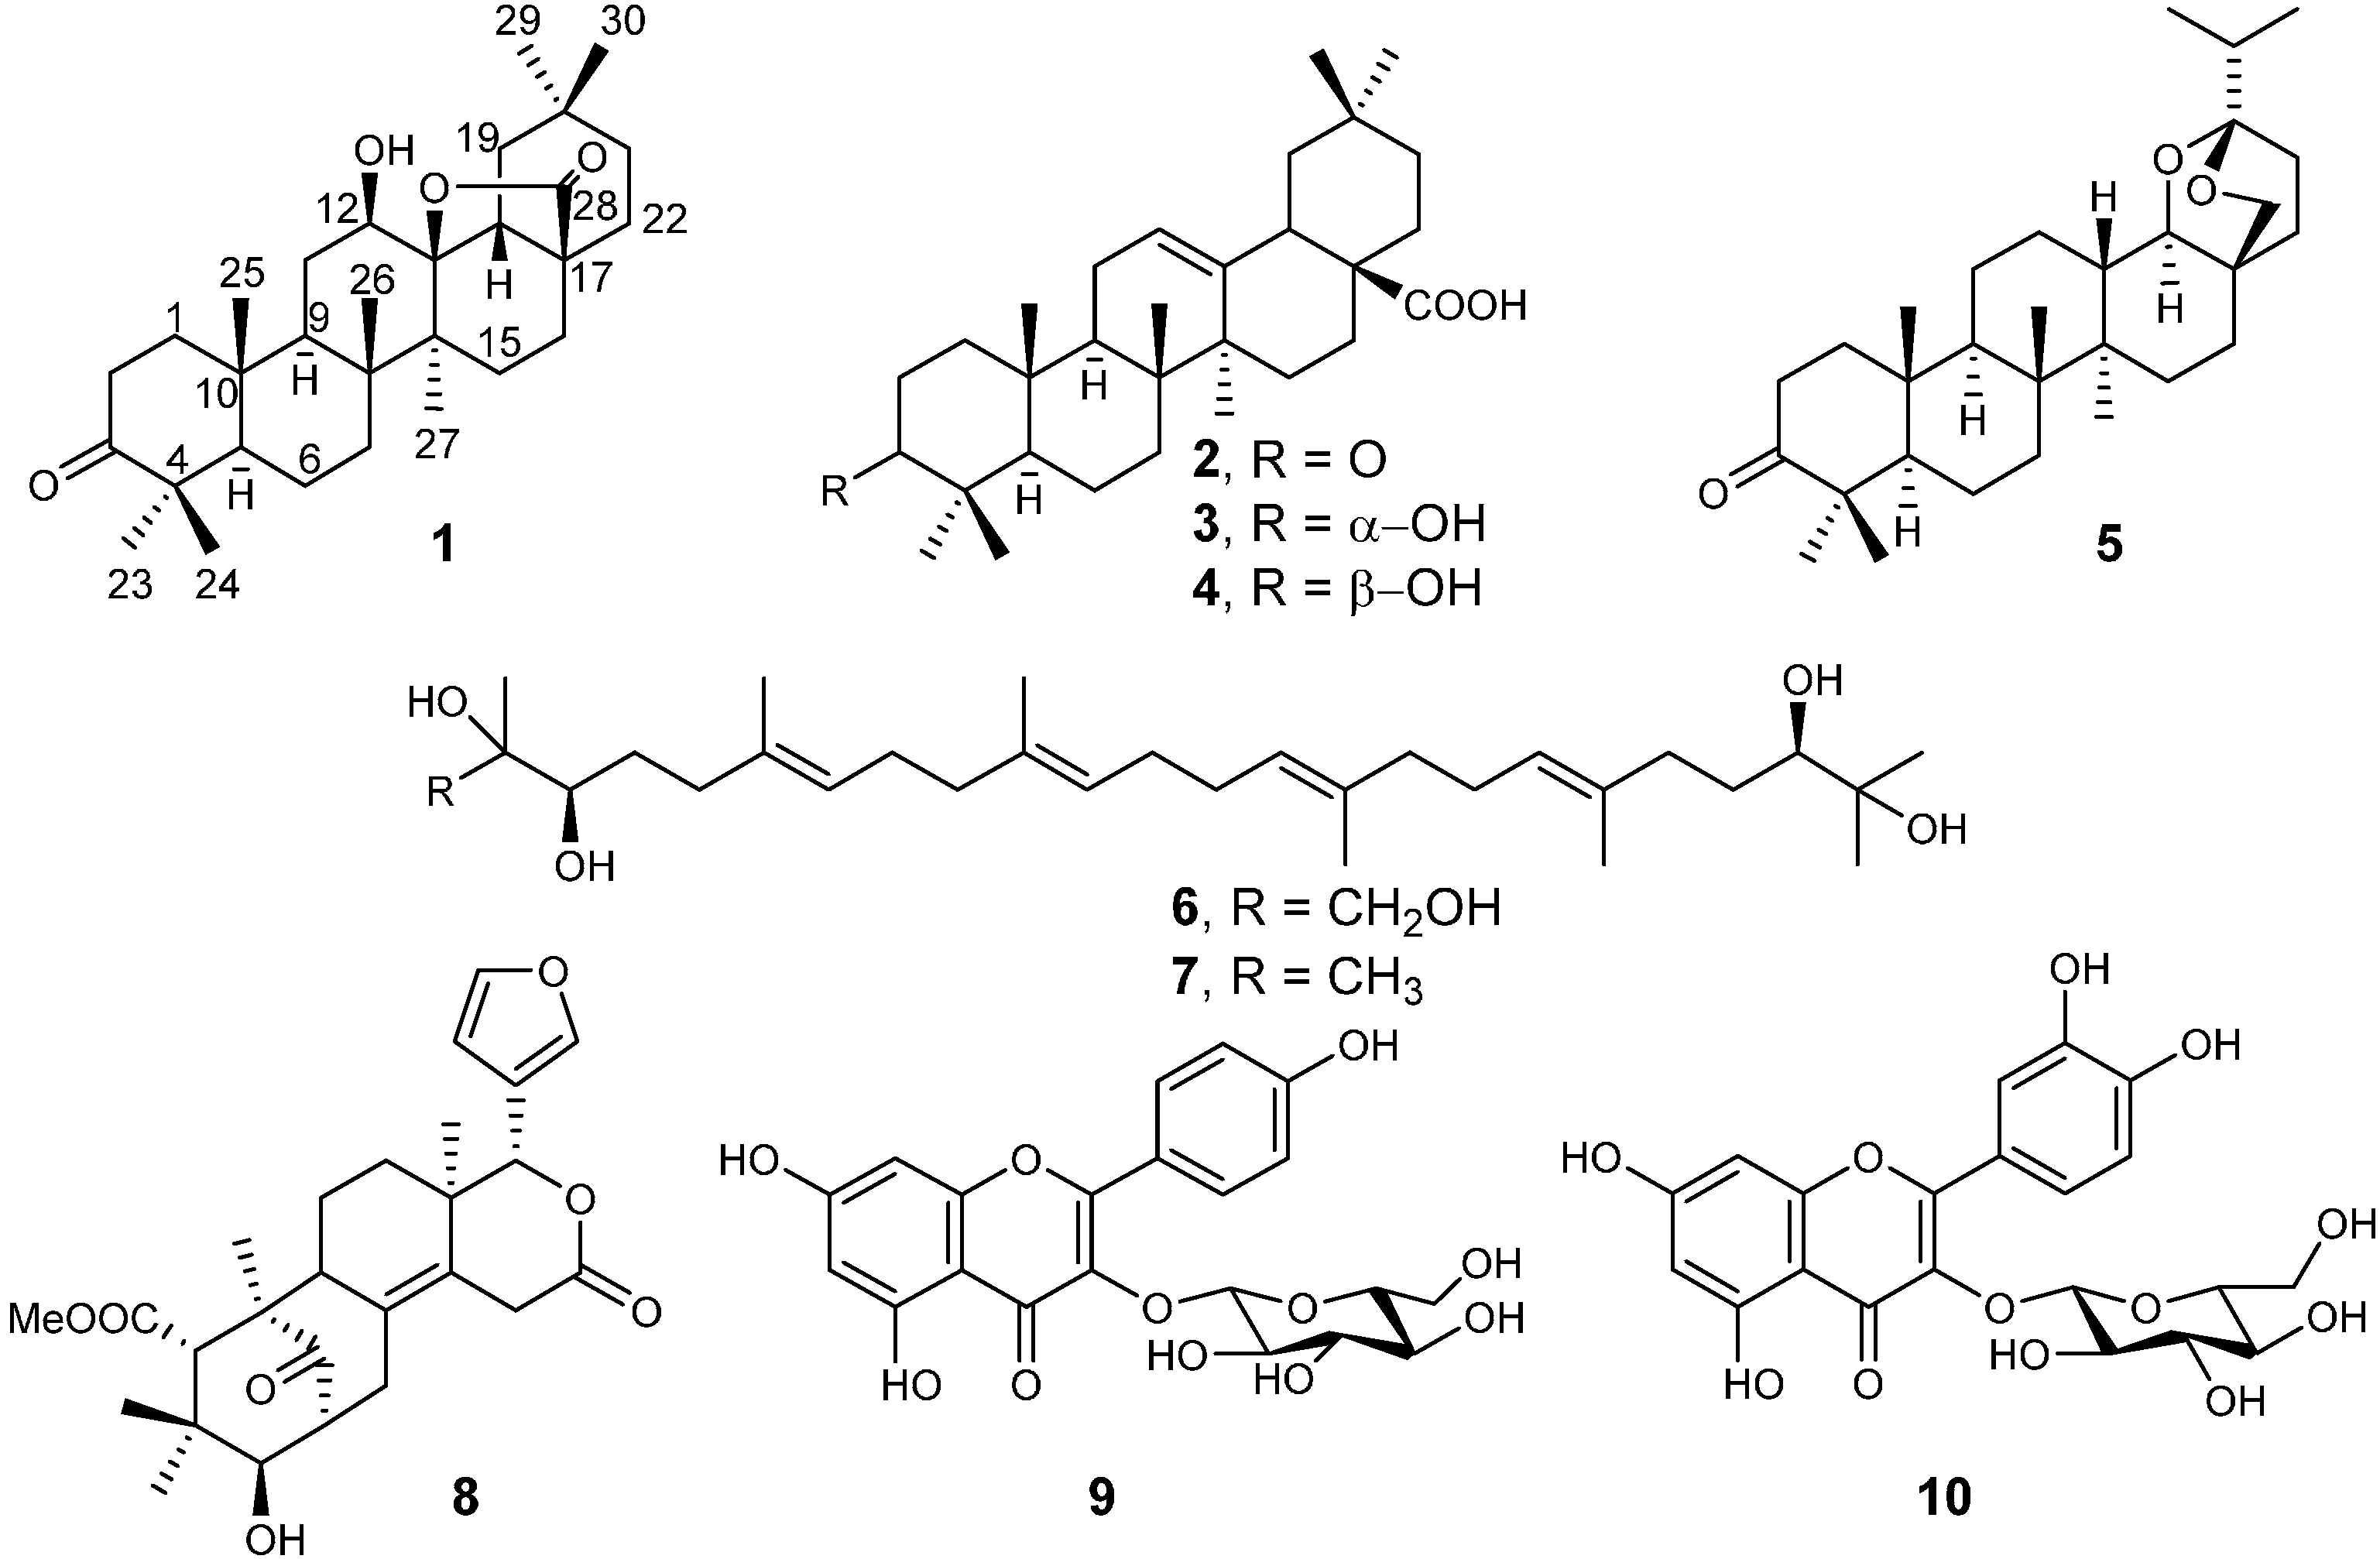
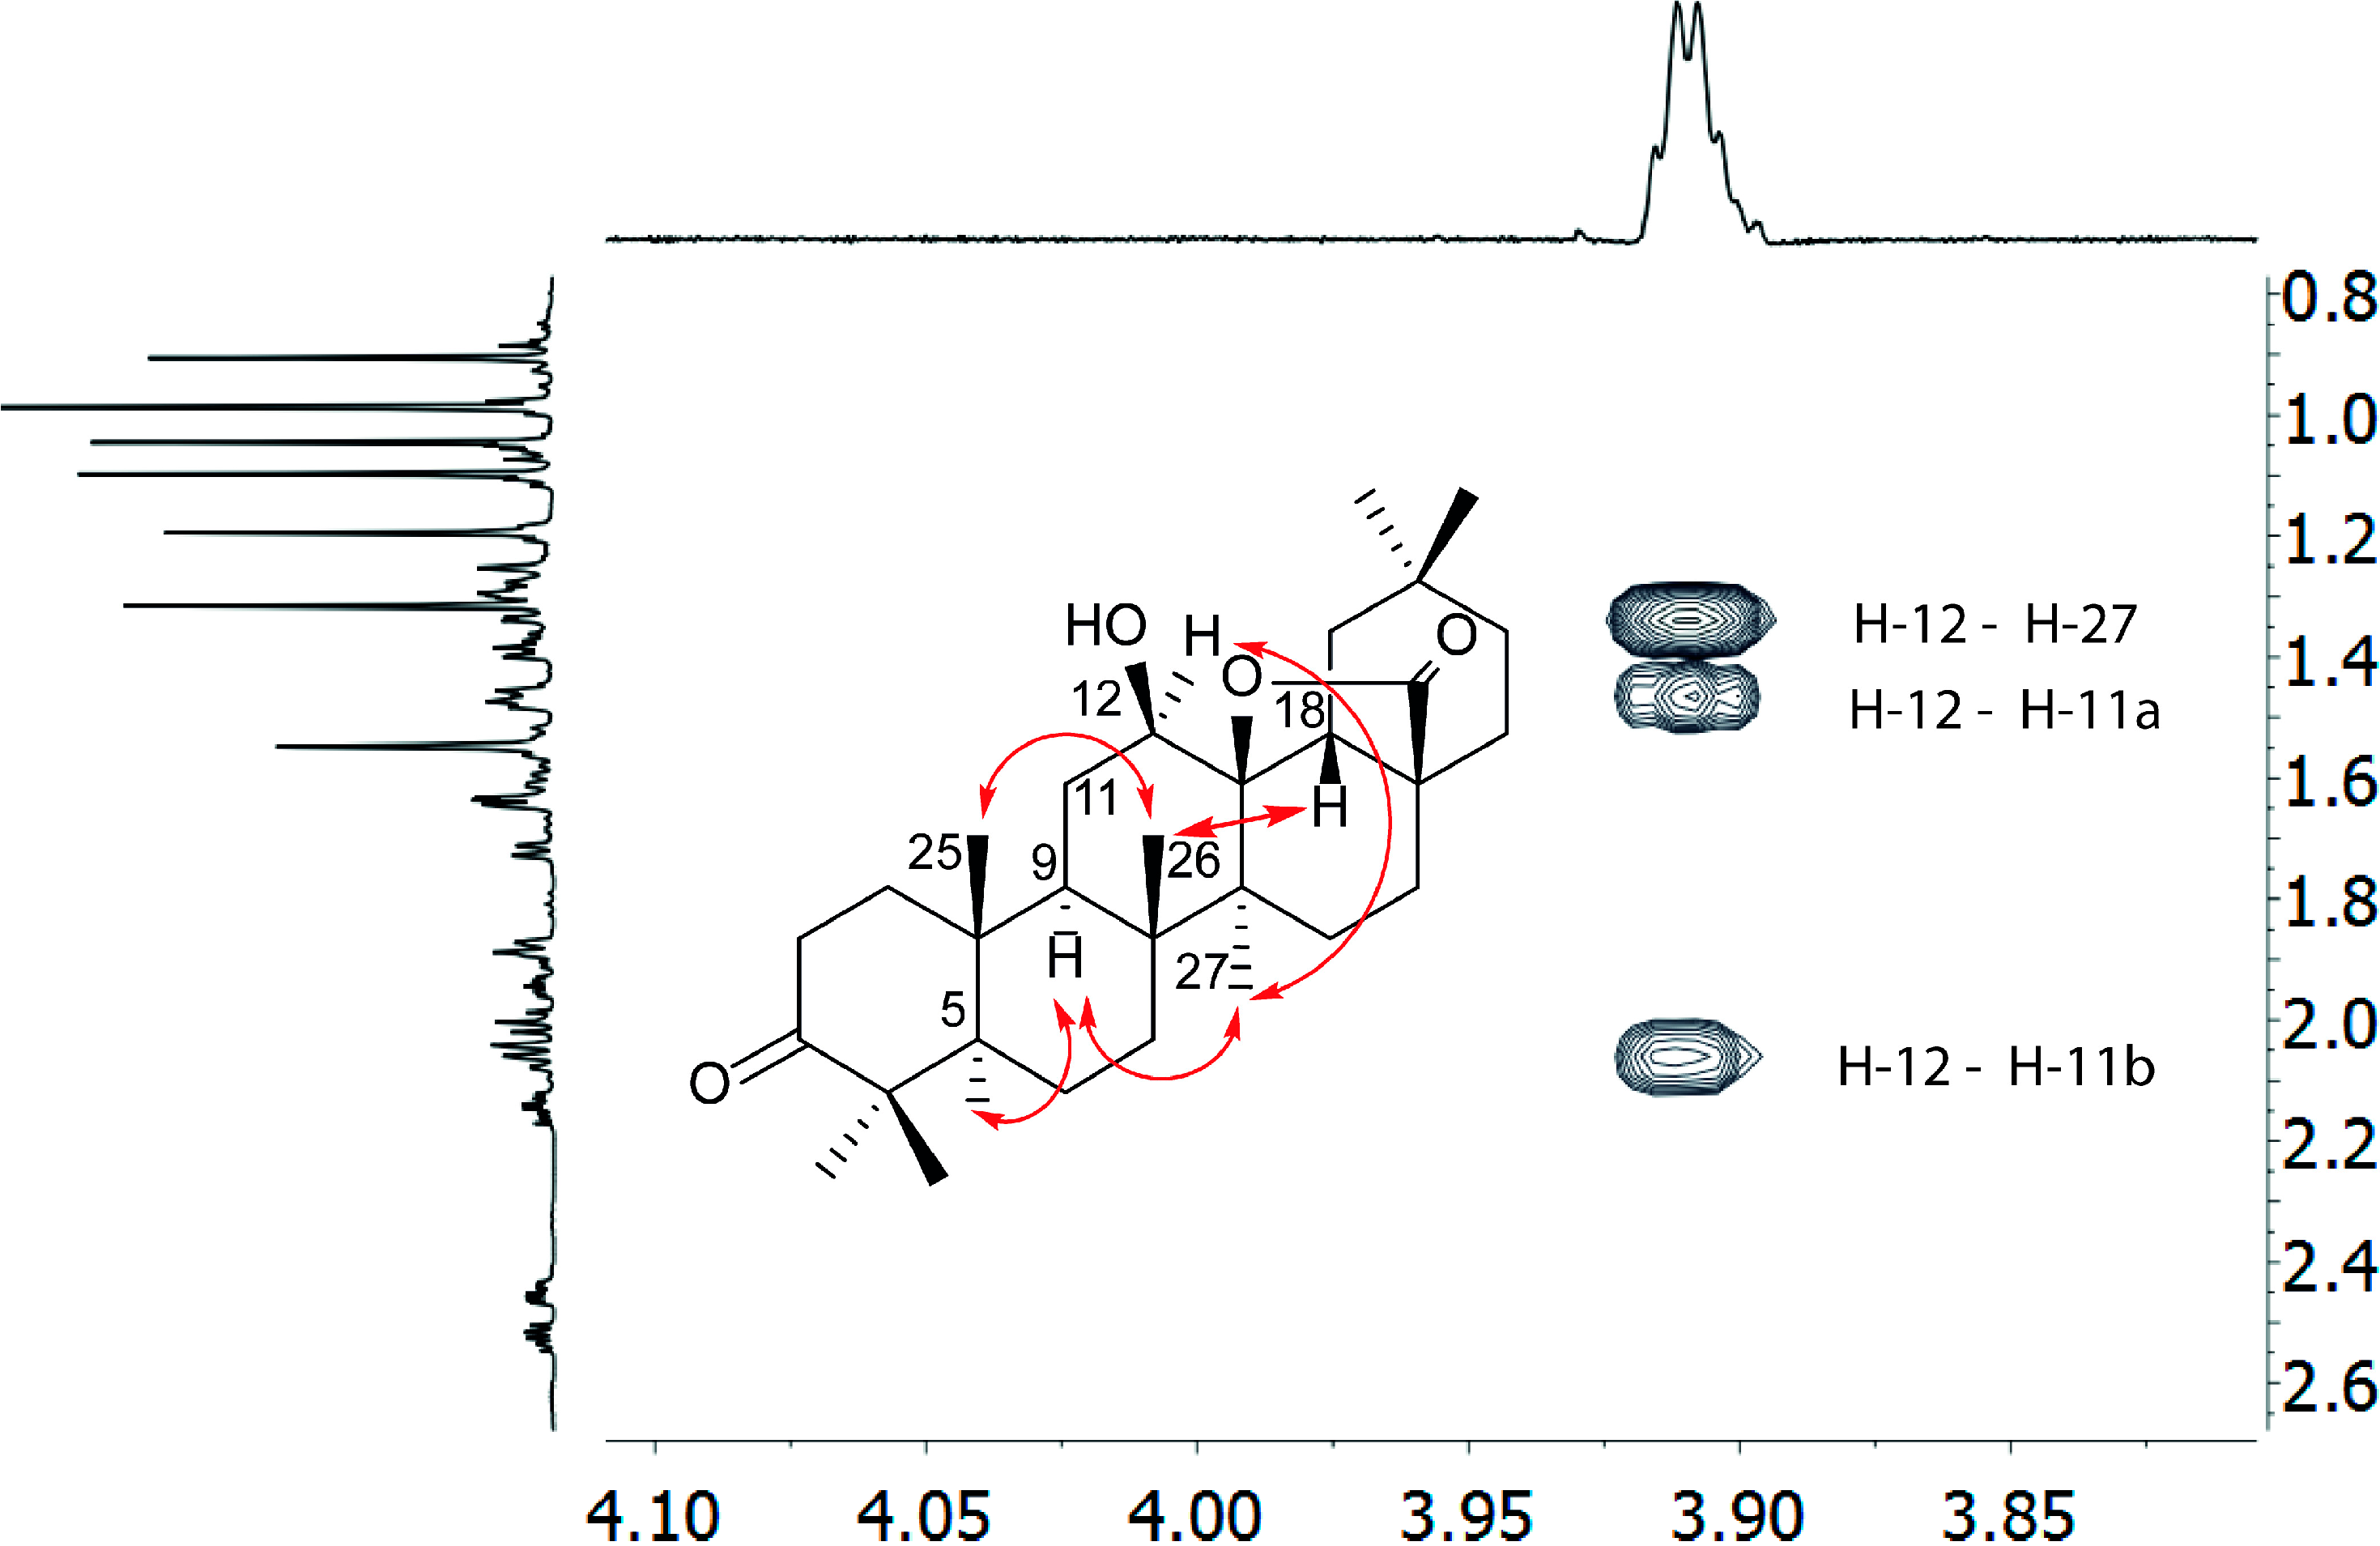
2.1. Isolation and Spectroscopic Identification

The air-dried root bark and the leaves of E. capensis were extracted separately with MeOH-CH2Cl2 (1:1) at room temperature. The two extracts were subjected to column chromatography on silica gel yielding ten metabolites (Figure 1), which were characterized by NMR and MS. Out of the seven constituents isolated from the roots, one (compound 1) was new, whereas six were known triterpenoids, namely oleanonic acid (2) [3,9], 3-epi-oleanolic acid (3) [3,9], oleanolic acid (4) [9], ekeberin A (5) [9], 2-hydroxymethyl-2,3,22,23-tetrahydroxy-6,10,15,19,23-pentamethyl-6,10,14,18-tetracosatetraene (6) [9,10], and 2,3,22,23-tetrahydroxy-2,6,10,15,19,23-hexamethyl-6,10,14,18-tetracosatetraene (7) [9,10]. From the leaves, proceranolide (8) [9], kaempferol-3-O-β-d-glucopyranoside (9) [11], and quercetin-3-O-β-d-glucopyranoside (10) [12] were identified.
Figure 1. Compounds 110 isolated from Ekebergia capensis.
Molecules 19 14235 g001
Compound 1 was isolated as a white amorphous powder. Its HR(ESI)MS analysis suggested the molecular formula C30H46O4 (observed [M+H]+, m/z 471.3386, calcd. 471.3474). The presence of seven methyl singlets in its 1H-NMR spectrum at δH 1.32, 1.20, 1.10, 1.05, 0.91 integrating for 3H each, a methyl at δH 0.99 integrating for 6H (Table 1), and that of thirty 13C-NMR signals including an oxygenated methine (δC 76.2), a quaternary carbon (δC 90.6), and two carbonyls (δC 217.7 and 179.9) was compatible with a pentacyclic triterpenoid skeleton. This presumption was supported by the high similarity of its NMR data to that of the oleanane triterpenoid 3-oxo-11α-12α-epoxy-oleanan-28,13β-olide, previously isolated from Cedrela montana [13]. The HMBC correlations (Table 1) of the carbonyl carbon at δC 217.7 ppm to the methyl protons at δH 1.10 ppm (H-23) and δH 1.05 ppm (H-24), and to the methylene protons at δH 2.53 and 2.45 ppm (CH2-2) suggests its C-3 position in the triterpenoid backbone. The placement of a hydroxyl group at C-12 (δC 76.2 ppm) was established following the 1H,1H COSY correlation of H-11 and H-12, and the HMBC correlation of H-12 (δH 3.91 ppm) with C-9 (δC 44.0 ppm), C-13 (δC 90.6 ppm) and C-14 (δC 42.3 ppm). This was further confirmed by the HMBC correlation of H-11 (δH 2.06, 1.46 ppm) and H-9 (δH 1.72 ppm) to C-12 (δC 76.2 ppm). The relative configuration of the C12-hydroxyl group was determined based on the NOE observed between H-12 (δH 3.91 ppm) and H-27 (δH 1.32 ppm), revealing their syn orientation (Figure 2). This assignment was further supported by the absence of NOE between H-12 and CH3-26 (δH 1.20 ppm). Small, comparable 3JH12-H11a and 3JH12-H11b indicate the gauche orientation of H-12 to both H-11a and H-11b, and thus its pseudo-equatorial orientation. The 13C-NMR shifts δC 179.9 ppm (C-28) and δC 90.6 ppm (C-13) are typical of a 28,13β-lactone moiety [13,14,15,16]. It should be noted that so far all naturally occurring triterpenes possessing a 28,13-lactone moiety were reported to have 28,13β-configuration [13,17,18]. The relative orientation of the bridgehead methyl groups and protons was elucidated based on their NOE correlations, shown in Figure 2. Hence, the absence of NOE between H-18 and H-27, H-5 and H-25, and H-26 and H-27 is diagnostic for their anti-orientation. The observed NOEs revealed that H-5, H-9, H-12 and H-27 are α-oriented, whilst H-18, H-25, and H-26 are β-oriented. The assigned relative configuration is in excellent agreement with previous literature reports [13,17,18]. On the basis of the above spectroscopic data, the new compound was characterized as 3-oxo-12β-hydroxy-oleanan-28,13β-olide (1). Compounds 210 were identified by their 2D NMR and MS data (see Supporting Information). Their structures were confirmed by comparison of their spectroscopic data to that previously reported [9,10,11,12].
Table 1. 1H- (799.88 MHz) and 13C- (201.20 MHz) NMR data for 3-oxo-12β-hydroxy-oleanan-28,13β-olide (1) in CDCl3.
δH (I, multiplicity, J in Hz)δCHMBC (2J, 3J)
11.47 (1H, ddd, 7.6, 9.8, 12.5)39.8C2, C3, C5, C10, C25
1.94 (1H, ddd, 4.4, 7.6, 12.5)
22.53 (1H, ddd, 7.6, 9.8, 15.7)34.1C1, C3, C4, C10
2.45 (1H, ddd, 4.4, 7.6, 15.7)
3-217.7-
4-47.5-
51.39 (1H, dd, 2.7, 12.0)55.0C4, C6, C7, C9, C10, C23, C25
61.55 (1H, m)19.2C7, C8, C10, C26
1.47 (1H, m)C7, C8, C10, C25, C26
71.61 (1H, m)33.5C5, C6, C8, C26
1.30 (1H, m)C5, C8, C9, C26
8-42.3-
91.72 (1H, dd, 2.3, 13.1)44.0C1, C5, C8, C10, C11, C25, C26
10-36.3-
112.06 (1H, m)29.3C8, C9, C10, C12, C13
1.46 (1H, m)
123.91 (1H, dd, 3.3, 3.3)76.2C9, C13, C14
13-90.6-
14-42.3-
151.88 (1H, ddd, 2.6, 2.6, 12.4) 28.2C14, C16, C17, C18, C27
1.20 (1H, m)
162.14 (1H, ddd, 5.9, 13.3, 13.3)21.3C17, C18, C22, C28
1.29 (1H, m)-
17-44.9-
182.05 (1H, dd, 3.5, 13.4)51.3C12, C13, C14, C16, C19, C20
192.01 (1H, dd, 13.1, 13.4)39.7C17, C18, C20, C21, C29, C30
1.87 (1H, dd, 3.5, 13.1)
20-31.8-
211.38 (1H, m)34.3C20, C22, C30
1.27 (1H, m)
221.64 (2H, m)27.6C16, C17, C18, C20, C28, C29
231.10 (3H, s)26.7C3, C4, C5, C24
241.05 (3H, s)21.2C3, C4, C5, C23
250.99 (3H, s)16.4C1, C5, C9, C10
261.20 (3H, s)18.4C7, C9, C13, C14, C27
271.32 (3H, s)18.6C8, C13, C14, C15
28-179.9-
290.99 (3H, s)33.4C19, C20, C21,C30
300.91 (3H, s)24.0C19, C20, C21,C29
Figure 2. Key NOE correlations observed for compound 1 (mixing time 700 ms, CDCl3, 25 °C, 799.88 MHz), allowing determination of its relative configuration, are shown to the left. An expansion of the NOESY spectrum showing the characteristic NOE correlations of H-12 is shown to the right. The NOE correlation of H-12 and H-27, and the absence of NOE between CH-12 and H-26 indicate the β-orientation of OH-12. The full NOESY spectrum is shown in the Supporting Information.
Molecules 19 14235 g002

2.2. Antimalarial Activity and Cytotoxicity

Previous phytochemical studies have revealed the in vitro antiplasmodial potency of some triterpenoids [9,19]. Therefore, the constituents of E. capensis were tested against the chloroquine sensitive (D6), and the chloroquine resistant (W2) strains of Plasmodium falciparum. Seven metabolites showed moderate in vitro antiplasmodial activity against the D6 (IC50 = 27–97.1 µM), whilst four had moderate activity against the W2 (IC50 = 64–82.7 µM, Table 2) strains. Due to the low amount isolated, the bioactivity of 1 was not evaluated. A moderate in vitro antiplasmodial activity of oleanolic acid (4) against the 3D7 strain of P. falciparum has been previously reported [20].
For evaluation of the possible risks associated with the application of E. capensis extracts in traditional medicine, we have studied their cytotoxicity using vero cells (Table 2). The flavonoid containing leaf extract showed a low, whereas the root bark extract, rich in triterpenoids, a high toxicity towards vero cells. The latter observation is in agreement with the cytotoxicity reported for triterpenoids previously isolated from other plants [11,16].
The substantial toxicity of the root bark extract of E. capensis towards vero cells motivated us to assess the anticancer properties of its metabolites. Indeed, compounds 2, 3, 6 and 7 exhibited even higher toxicity against the 4T1 murine breast cancer cell line than against vero cells (Table 2). This toxicity and the corresponding low selectivity index (IC50(vero)/IC50(D6) < 10) suggest that the observed moderate antiplasmodial activity of the metabolites likely originates from their cytotoxicity. For further evaluation of anticancer potency, we assessed the toxicity of the samples against the HEp2 and MDA-MB-231 human cancer cell lines (Table 2). Of the seven triterpenoids isolated from the root bark, oleanonic acid (2) showed the highest cytotoxicity, 1.4 μM against HEp2 cells. Here, it should be noted that the toxicity of 2 against “normal” vero cells is as low as that of the positive control chloroquine, motivating its further assessment as a possible anticancer agent.
Table 2. The antiplasmodial and cytotoxic activities of Ekebergia capensis leaf and root bark crude extracts and their constituents.
IC50 a
D6 bW2 bVero4T1 cHEp2MDA-MB-231
roots18.2 ± 0.134 ± 0.82.8 ± 0.19.3 ± 0.161 ± 1.4n.d.
leaves44.9 ± 0.845.3 ± 0.597.8 ± 0.882.1 ± 5.771.6 ± 1.8n.d.
238.8 ± 0.576.7 ± 4.035.8 ± 1.313.3 ± 0.21.4 ± 0.1>212
3205.0 ± 3.0179.4 ± 6.058.0 ± 5.230.3 ± 2.629.8 ± 0.336.54 ± 0.02
449.6 ± 2.382.7 ± 2.0112.0 ± 5.1117.6 ± 2.6134.9 ± 0.739.82 ± 0.03
5182.2 ± 6.0>219>219163.2 ± 4.3>219n.d.
627.1 ± 0.466.9 ± 0.635.7 ± 2.130.2 ± 1.338.4 ± 0.836.69 ± 0.04
756.1 ± 0.464.3 ± 1.024.7 ± 1.822.5 ± 3.235.5 ± 3.1> 209
884.7 ± 0.8150.2 ± 3.0>213>213>213n.d.
997.1 ± 1.0105.8 ± 0.5>223>223>223>223
1042.9 ± 0.3105.8 ± 1.0>216>216>216>216
a IC50: half maximal inhibitory concentration, given in μM for pure compounds and in μg/mL for crude extracts. The mean values of at least three independent experiments are reported; b Chloroquine was used as positive control (IC50(D6) = 7.7 ± 1 nM, IC50(vero) = 43.9 ± 0.5 µM); c Positive control: podophyllum resin, IC50(4T1) = 0.47 ± 0.05 µg/mL; n.d., not determined.
It is interesting to note that the root extract was more toxic to vero cells than to HEp2 cells, while the reverse situation (Table 2) was observed for oleanonic acid (2). The high toxicity of the root extract to vero cells may be due to synergistic effect of some of its constituents. Therefore, the interaction of oleanonic acid (2), the most toxic metabolite against HEp2 cells, with triterpenoids 37 against vero cells was evaluated. 3-Epi-oleanolic acid (3) markedly antagonized the cytotoxic effects of 2 at all concentrations tested, whereas its stereoisomer (4) showed only slight antagonistic effect (Table 3). The cytotoxicity of oleanonic acid (2) was antagonized by high concentrations of ekeberin A (5), but at lower relative concentrations 5 enhanced the toxicity of 2. Triterpenoids 6 and 7 showed weak antagonistic effects. Overall, no significant synergistic effect was observed.
Table 3. Interaction of oleanonic acid (2) (IC50 14.84 µg/mL) with other constituents (37) of the root bark extract of Ekebergia capensis against vero cells.
CompoundIC50 (μg/mL)
0:1 a1:3 a1:1 a3:1 a
322.5 b9.8 c5.2 c5.8 c
440.3 b3.3 c4.7 c3.6 c
5>100 b<4 c<1.4 c<1.3 c
613.6 b2.2 c2.2 c2.3 c
711 b2 c1.9 c2.2 c
a Ratio of oleanonic acid (2) versus various constituents of the root extract; b IC50 (µg/mL) in the absence of 2; c ∑FIC.

3. Experimental Section

3.1. General Information

Column chromatography was carried out on silica gel 60, 0.06–0.2 mm, 70–230 mesh ASTM, obtained from Scharlab SL, or on Sephadex® LH-20, purchased from Fluka (Buchs, Switzerland). PTLC was performed on locally made 20 × 20 cm glass plates using Silica gel G/UV 254 (Macherey-Nagel, Düren, Germany). TLC was run using fluorescent silica gel 60 obtained from Fluka, and was visualized under UV light, 254 or 366 nm, followed by spraying with 1% vanillin dissolved in sulphuric acid. LC(ESI)MS spectra was acquired on a PE SCIEX API 150EX instrument (Perkin Elmer, Waltham, MA, USA) equipped with a Turbolon spray ion source (30 eV ionization energy) and a Gemini 5 mm C-18 110 Å HPLC column, using water:acetonitrile gradient (80:20 to 20:80). Preparative HPLC separation was carried out on a Waters 600E HPLC system (Waters Corp, Milford, MA, USA) using the Chromulan software (Pikron Ltd., Praha, Czech Republic) with a Kromasil C-8 250 × 25 mm C-8 column with water-acetonitrile eluent mixtures. For structure elucidation gCOSY [21], gNOESY [22], gHSQC [23] and gHMBC [24] NMR spectra were acquired on an 800 MHz (Bruker BioSpin AG, Fällanden, Switzerland) or on Varian 500 and 400 MHz spectrometers (Agilent, Palo Alto, CA, USA). Spectra were processed using the MestReNova (v9.0.0) software. Chemical shifts were referenced indirectly to tetramethylsilane via the residual solvent signal (CDCl3, 1H at 7.26 ppm and 13C at 77.16 ppm). High resolution mass analysis (Q-TOF-MS) was performed by Stenhagen Analyslab AB (Gothenburg, Sweden) using a Micromass Q-TOF micro instrument (Waters Corp, Milford, MA, USA) equipped with a lockmass-ESI source.

3.2. Plant Material

The root bark and leaves of Ekebergia capensis were collected from Gakoe forest, Kiambu County, in April, 2013. The plant was authenticated by Mr. Patrick Mutiso and a voucher specimen (BN/1/2013) was deposited at the Herbarium of the School of Biological Sciences, University of Nairobi.

3.3. Extraction and Isolation

The air dried and ground root bark (600 g) of E. capensis was extracted twice with MeOH–CH2Cl2 (1:1, 1 L) for 48 h at room temperature. The filtrate was dried in vacuo to yield a blackish sticky solid (97 g). A 30 g portion of the extract was fractionated using gradient column chromatography with a petroleum ether (b.p.: 60–80 °C) ethyl acetate gradient in the following ratios: 100:0; 19:1; 9:1; 4:1; 3:2; 1:1; 2:3; 1:4; 0:100. A total of 86 fractions, ca. 250 mL each, was collected and combined into 22 fractions (labeled A to V) based on TLC. Fraction B was crystallized in acetone to yield oleanonic acid (2, 2.7 g). The supernatant of fraction B, following crystallization, was separated on Sephadex LH-20 with methanol eluent to yield fraction B1, which was crystallized in acetone to yield ekeberin A (5, 2.1 mg). Fraction C was precipitated with acetone to yield white solid (762.8 mg) that was further purified on reversed-phase HPLC (CH3OH-H2O gradient) to yield 3-epi-oleanolic acid (3, 7.4 mg). Fraction D was separated on PTLC with an 8:2 mixture of petroleum ether and acetone to yield 3-oxo-12α-hydroxy-oleanan-28,13β-olide (1, 2.3 mg) as a white, amorphous solid. Fraction G yielded oleanolic acid (4, 284 mg) as white powder. Fractions I and M were separated on PTLC with petroleum ether-acetone (7:3) eluent to yield 2-hydroxymethyl-2,3,22,23-tetrahydroxy-6,10,15,19,23-pentamethyl-6,10,14,18-tetracosatetraene (6, 30.3 mg) and 2,3,22,23-tetrahydroxy-2,6,10,15,19,23-hexamethyl-6,10,14,18-tetracosate (7, 90.6 mg), respectively.
The dried and ground leaf of E. capensis (500 g) was extracted with MeOH–CH2Cl2 (1:1, 1 L) to yield 21 g of a greenish sticky solid. A 20 g portion was fractionated on a silica gel column eluting with a mixture of petroleum ether and acetone with the gradient 100:0, 9.75: 0.25, 9.5:0.5, 9.25:0.75, 9:1, 8.75:1.25, 8.5:1.5, 8.25:1.75, 8:2, 7:3, 1:1, 0:100. A total of 81 fractions, ca. 250 ml each, were collected and combined into 22 fractions labeled as A-V, upon TLC analysis. Fraction Q was further fractionated with reverse-phase HPLC using CH3OH:H2O gradient to yield fractions Q2 and Q6. Fraction Q2 was purified on preparative TLC with iso-hexane:acetone (4:1) to yield proceranolide (8, 5.7 mg). Fractions T and W were purified on reversed-phase HPLC using a CH3OH:H2O gradient to yield kaempferol-3-O-β-d-glucopyranoside (9, 3.5 mg) and quercetin-3-O-β-d-glucopyranoside (10, 10.1 mg), respectively.

3.4. Cytotoxicity Assays

A rapid colorimetric assay was carried out using 3-(4,5-dimethylthiazol-2-yl)-2,5-diphenyltetrazolium bromide (MTT) [25,26]. This assay is based on the ability of a mitochondrial dehydrogenase enzyme from viable cells to cleave the tetrazolium rings of the pale yellow MTT and thereby form dark blue formazan crystals, which are largely impermeable to cell membranes, resulting in their accumulation within healthy cells. The amount of generated formazan is directly proportional to the number of cells [25]. In this assay, the mammalian cell lines African monkey kidney (vero), mouse breast cancer (4T1) and human larynx carcinoma (HEp2) were used. Cells were maintained in Eagle’s Minimum Essential Medium (MEM) containing 10% fetal bovine serum (FBS). A cell density of 20.000 cells per well in 100 μL were seeded on 96-well plates and incubated for 12 h at 37 °C and 5% CO2 to attach to the surface. Samples of the tested extracts and isolated compounds were added to the cultured cells in rows H-B over a concentration range of 0.14 to 100 μg/mL, whereas wells 1–8 of row A served as untreated controls and wells 9–12 as blank (1% DMSO, v/v). The plates were incubated for 48 h at 37 °C and 5% CO2, followed by an addition of 10 µL MTT viability indicator reagent. The plates were incubated for additional 4 h at the same conditions. Next, all media was removed from the plates and 100 µL DMSO was added to dissolve the formazan crystals. The plates were read on a Multiskan EX Labsystems scanning multi-well spectrophotometer at 562 nm, and 620 nm as reference. The results were recorded as optical density (OD) per well at each drug concentration. The data was transferred into the software Microsoft Excel and expressed as percentage of the untreated controls. Percentage cytotoxicity (PC) as compared to the untreated controls was calculated as PC = [A − B/A] × 100, where A is the mean OD of the untreated cells and B is the mean OD at each drug concentration [26]. The drug concentration required for 50% inhibition of cell growth was estimated using nonlinear regression analysis of the dose- response curve.
Cytotoxicity tests on MDA-MB-231 cells were carried out following a previously described procedure [27]. MDA-MB-231 human breast cancer cells were cultured in Dulbecco’s modified eagle medium (DMEM) supplemented with 10% (v/v) fetal bovine serum, 2 mM L-glutamine, 100 units/mL penicillin and 100 μg/mL streptomycin at 37 °C in humidified 5% CO2. For cytotoxicity assays, cells were seeded in 96-well plates at optimal cell density (10,000 cells per well) to ensure exponential growth for the duration of the assay. After a 24 h preincubation growth, the medium was replaced with experimental medium containing the appropriate drug concentrations or vehicle controls (0.1% or 1.0% v/v DMSO). After 72 h of incubation, cell viability was measured using Alamar Blue reagent (Invitrogen Ab, Lidingö, Sweden) according to the manufacturer’s instructions. Absorbance was measured at 570 nm with 600 nm as a reference wavelength. Results were expressed as the mean ± standard error for six replicates as a percentage of vehicle control (taken as 100%). Experiments were performed independently at least six times. Statistical analyses were performed using a two-tailed Student’s t-test. p < 0.05 was considered to be statistically significant.
The interaction of oleanonic acid (2) with other triterpenoids was studied using the fixed concentration ratios oleanonic acid: ‘other triterpenoid’ 0:1, 1:3, 1:1, 3:1, 1:0. The vero cell cytotoxicity assay was used, as described above, to evaluate the toxicity of the mixtures. To determine whether there was synergy, additive effect or antagonism, the sum of fractional inhibition concentration (∑FIC) was calculated using the formula Ax/Ay + Bx/By = K, where Ax and Bx are the IC50s when the substances are used in combination, and Ay and By are the IC50s, when the substances are used alone. The data was scored with the scale ∑FIC < 1: synergism, 2 > ∑FIC ≥ 1: additive, 4 > ∑FIC ≥ 2: slight antagonism, ∑FIC ≥ 4: marked antagonism [28].

3.5. In Vitro Antiplasmodial Assay

Continuous in vitro cultures of asexual erythrocytic stages of Indochinese chloroquine-resistant W2 and Sierra Leonean chloroquine-sensitive D6 strains of P. falciparum were maintained following the modified procedure described by Trager and Jensen [29]. Drug assay was carried out following a modification of the semiautomated microdilution technique, which measures the ability of the extracts to inhibit the incorporation of (G-3H) hypoxanthine into the malaria parasite [30]. Plates were harvested onto glass fibre filters and (G-3H) hypoxanthine uptake was determined using a micro-beta trilux liquid scintillation and luminescence counter (Wallac, MicroBeta TriLux) with the results recorded as counts per minute (cpm) per well at each drug concentration. Data was transferred into the software Microsoft Excel and was expressed as the percentage of the untreated controls. The drug concentration required for 50% inhibition of (G-3H) hypoxanthine incorporation into parasite nucleic acid was calculated with nonlinear regression analysis of the dose-response curve. The criterion described by Batista and co-workers for scoring activity was adopted [31], i.e., IC50 < 1 μM: highly active; 20 μM > IC50 ≥ 1: active; 100 μM > IC50 ≥ 20: moderately active; IC50 > 100 inactive.

4. Conclusions

Phytochemical analysis indicated that the root bark of E. capensis contains pentacyclic triterpenoids. The major secondary metabolites of the root bark are present in the stem bark as well [9]. The triterpenoid 3-oxo-12β-hydroxy-oleanan-28,13β-olide (1) is a new compound. Most constituents of the root bark showed moderate antiplasmodial activity with low selectivity indices, revealing their limited applicability for antimalarial drug development. The triterpenoids 37 showed comparable cytotoxicity towards “normal” (vero) and tumor cells, whereas oleanonic acid (2) possessed low toxicity against vero cells yet high toxicity (1.4 μM) against the 4T1 and HEp2 cancer cell lines. Its low activity against MDA-MB-231 human breast cancer cells indicates some selectivity of its anticancer activity. No significant synergism on the cytotoxicity of oleanonic acid (2) with other constituents of the root bark was detected. Based on the above observations we recommend further evaluation of oleanonic acid (2) on additional normal and cancerous cell lines for careful evaluation of its potency as anticancer lead. Whereas the root bark extract of E. capensis possesses high toxicity against “normal” (2.8 μM, vero) cells, no toxicity for its leaf extract or its constituents was observed. Although in vitro toxicity cannot be directly extrapolated to in vivo toxicity, our observations suggest a low risk of the indigenous application of E. capensis leaf extracts, but a substantial risk associated with the traditional medicinal use of its root extracts.

Supplementary Materials

Supplementary materials can be accessed at: https://www.mdpi.com/1420-3049/19/9/14235/s1.

Supplementary Files

Supplementary File 1

Acknowledgments

BNI acknowledges UNICEF/UNDP/WORLD BANK/WHO Special Programme for Research and Training in Tropical Diseases (TDR) (SPHQ10-RTG-6 ID: A90208) for funding her PhD training and research visit to the Department of Chemistry, University of Gothenburg, Sweden. The Swedish Research Council (#2012–6124) is gratefully acknowledged for financial support. The director of KEMRI is acknowledged for permission to publish this work. We thank N. Adipo, K. Murega and I. Kirema for technical assistance.

Author Contributions

The listed authors contributed to this work as follows: Beatrice Irungu has collected and extracted the roots and the leaves, and has fractionated and isolated their constituents. Spectroscopic characterization was carried out by Beatrice Irungu, Abiy Yenesew, Máté Erdélyi and Jacob Midiwo. Antiplasmodial and cytotoxicity assays and data analysis was carried out by Francis Kimani, Jennifer Orwa, Beatrice Irungu, Amra Gruhnojic, Paul Fitzpatrick and Göran Landberg. B.N.I., M.E. and A.Y. contributed to the preparation of the manuscript.

Conflicts of Interest

The authors declare no conflict of interest.

References

  1. Gachathi, M. Kikuyu Botanics Dictionary: A Guide to Plant Names Uses and Culture Values, 2nd ed.; Tropical Botany Press: Nairobi, Kenya, 2007; p. 116. [Google Scholar]
  2. Beentje, H.J. Kenya Trees, Shrubs, and Lianas; National Museums of Kenya: Nairobi, Kenya, 1994; p. 404. [Google Scholar]
  3. Sewram, V.; Raynor, M.W.; Mulholland, D.A.; Raidoo, D.M. The uterotonic activity of compounds isolated from the supercritical fluid extract of Ekebergia capensis. J. Pharm. Biomed. Anal. 2000, 24, 133–145. [Google Scholar] [CrossRef]
  4. Okello, S.V.; Nyunja, R.O.; Netondo, G.W.; Onyango, J.C. Ethnobotanical study of medicinal plants used by Sabaots of Mt. Elgon Kenya. Afr. J. Tradit. Complement. Altern. Med. 2010, 7, 1–10. [Google Scholar] [CrossRef]
  5. Kamadyaapa, D.R.; Gondwe, M.M.; Moodley, K.; Ojewole, J.A.O.; Musabayane, C.T. Cardiovascular effects of Ekebergia capensis Sparrm (Meliaceae) ethanolic leaf extract in experimental animal paradigms. Cardiovasc. J. Afr. 2009, 20, 162–167. [Google Scholar]
  6. Lall, N.; Meyer, J.J.M. In vitro inhibition of drug-resistant and drug-sensitive strains of Mycobacterium tuberculosis by ethnobotanically selected South African plants. J. Ethnopharmacol. 1999, 66, 347–354. [Google Scholar] [CrossRef]
  7. Mulaudzi, R.B.; Ndhlala, A.R.; Kulkarni, M.G.; Finnie, J.F.; Staden, J.V. Anti-inflammatory and mutagenic evaluation of medicinal plants used by Venda people against venereal and related diseases. J. Ethnopharmacol. 2013, 146, 173–179. [Google Scholar] [CrossRef]
  8. Muregi, F.W.; Chhabra, S.C.; Njagi, E.N.M.; Lang’at-Thoruwa, C.C.; Njue, W.M.; Orago, A.S.; Omar, S.A.; Ndiege, I.O. Anti-plasmodial activity of some Kenyan medicinal plant extracts singly and in combination with chloroquine. Phytother. Res. 2004, 18, 379–384. [Google Scholar] [CrossRef]
  9. Murata, T.; Miyase, T.; Muregi, F.W.; Naoshima-Ishibashi, Y.; Umehara, K.; Warashina, T.; Kanou, S.; Mkoji, G.M.; Terada, M.; Ishih, A. Antiplasmodial triterpenoids from Ekebergia capensis. J. Nat. Prod. 2008, 71, 167–174. [Google Scholar] [CrossRef]
  10. Nishiyama, Y.; Moriyasu, M.; Ichimaru, M.; Tachibana, Y.; Kato, A.; Mathenge, S.G.; Nganga, J.N.; Juma, F.D. Acyclic triterpenoids from Ekebergia capensis. Phytochemistry 1996, 42, 803–807. [Google Scholar] [CrossRef]
  11. Kim, K.H.; Choi, S.U.; Lee, K.R. Cytotoxic triterpenoids from Berberis koreana. Planta Med. 2012, 78, 86–89. [Google Scholar] [CrossRef]
  12. Kim, H.Y.; Moon, B.H.; Lee, H.J.; Choi, D.H. Flavonol glycosides from the leaves of Eucommia ulmoides O. with glycation inhibitory activity. J. Ethnopharmacol. 2004, 93, 227–230. [Google Scholar] [CrossRef]
  13. Castellanos, L.; de Correa, R.S.; Martínez, E.; Calderon, J.S. Oleanane triterpenoids from Cedrela montana (Meliaceae). Z. Naturforsch. C 2002, 57, 575–578. [Google Scholar]
  14. Konoike, T.; Takahashi, K.; Araki, Y.; Horibe, I. Practical partial synthesis of myriceric acid A, and endothelin receptor antagonist, from oleanolic acid. J. Org. Chem. 1997, 62, 960–966. [Google Scholar] [CrossRef]
  15. Salvador, J.A.R.; Moreira, V.M.; Pinto, R.M.A.; Leal, A.S.; Paixao, J.A. Efficient oxidation of oleanolic acid derivatives using magnesium bis(monoperoxyphtalate) hexahydrate (MMPP): A convenient two-step procedure towards 12-oxo-28-carboxylic acid derivatives. Beilstein J. Org. Chem. 2012, 8, 164–169. [Google Scholar] [CrossRef]
  16. Leal, A.S.; Wang, R.; Salvador, J.A.R.; Jing, I. Synthesis of novel heterocyclic oleanolic acid derivatives with improved antiproliferative activity in solid tumor cells. Org. Biomol. Chem. 2013, 11, 1726–1738. [Google Scholar] [CrossRef]
  17. Hu, J.; Wu, G.; Xu, Y.; Xiao, G.; Lei, P. 12α-Hydroxy-3,27-dioxooleanano-28,13-lactone. Acta Crystallogr. Sect. E 2012, 68, o1586. [Google Scholar]
  18. Ikuta, A.; Tomiyasu, H.; Morita, Y.; Yoshimura, K. Ursane- and oleanane-type triterpenes from Ternstroemia gymnanthera callus tissues. J. Nat. Prod. 2003, 66, 1051–1054. [Google Scholar] [CrossRef]
  19. Ngouamegne, E.T.; Fongang, R.S.; Ngouela, S.; Boyom, F.F.; Rohmer, M.; Tsamo, E.; Gut, J.; Rosenthal, P.J. Endodesmiadiol, a friedelane triterpenoid, and other antiplasmodial compounds from Endodesmia calophylloides. Chem. Pharm. Bull. 2008, 56, 374–377. [Google Scholar] [CrossRef]
  20. Sairafianpour, M.; Bahreininejad, B.; Witt, M.; Ziegler, H.L.; Jaroszewski, J.W.; Staerk, D. Terpenoids of Salvia hydrangea: Two new, rearranged 20-norabietanes and the effect of oleanolic acid on erythrocyte membrane. Planta Med. 2003, 69, 846–850. [Google Scholar] [CrossRef]
  21. Wokaun, A.; Ernst, R.R. Selective detection of multiple quantum transitions in NMR by two-dimensional spectroscopy. Chem. Phys. Lett. 1977, 52, 407–412. [Google Scholar] [CrossRef]
  22. Kumar, A.; Ernst, R.R.; Wüthrich, K. A Two-dimensional nuclear Overhauser enhancement (2D NOE) Experiment for the elucidation of complete proton-proton cross-relaxation networks in biological macromolecules. Biochem. Biophys. Res. Commun. 1980, 95, 1–6. [Google Scholar] [CrossRef]
  23. Perpickdumont, M.; Reynolds, W.F.; Enriquez, R.G. C-13-H-1 shift correlation with full H-1-H-1 decoupling. Magn. Reson. Chem. 1988, 26, 358–361. [Google Scholar] [CrossRef]
  24. Hurd, R.E.; John, B.K. Gradient-enhanced proton-detected heteronuclear multiple-quantum coherence spectroscopy. J. Magn. Reson. 1991, 91, 648–653. [Google Scholar]
  25. Mosmann, T. Rapid colorimetric assay for cellular growth and survival: Application to proliferation and cytotoxicity assays. J. Immunol. Methods 1983, 65, 55–63. [Google Scholar] [CrossRef]
  26. Prayong, P.; Barusrux, S.; Weerapreeyakul, N. Cytotoxic activity screening of some indigenous Thai plants. Fitoterapia 2008, 79, 598–601. [Google Scholar] [CrossRef]
  27. Negera, A.; Induli, M.; Fitzpatrick, P.; Alao, J.P.; Sunnerhagen, P.; Landberg, G.; Yenesew, A.; Erdélyi, M. Cytotoxic quinones from the roots of Aloe dawei. Molecules 2014, 19, 3264–3273. [Google Scholar] [CrossRef]
  28. Gupta, S.; Thapar, M.M.; Wernsdorfer, W.H.; Björkman, A. In vitro interactions of artemisinin with atovaquone, quinine, and mefloquine against Plasmodium falciparum. Antimicrob. Agents Chemother. 2002, 46, 1510–1515. [Google Scholar] [CrossRef]
  29. Trager, W.; Jensen, J.B. Human malaria parasites in continuous culture. Science 1976, 193, 673–675. [Google Scholar]
  30. Desjardins, R.E.; Canfield, C.J.; Haynes, J.D.; Chulay, J.D. Quantitative assessment of antimalarial activity in vitro by a semiautomated microdilution technique. Antimicrob. Agents Chemother. 1979, 16, 710–718. [Google Scholar] [CrossRef]
  31. Batista, R.; Júnior, A.J.S.; Oliveira, A.B. Plant-derived antimalarial agents: New leads and efficient phytomedicines. Part II. Non-alkaloidal natural products. Molecules 2009, 14, 3037–3072. [Google Scholar] [CrossRef]
  • Sample Availability: Samples of the compounds 210 are available from the authors.

