Article

Antihypertensive Effects of Artemisia scoparia Waldst in Spontaneously Hypertensive Rats and Identification of Angiotensin I Converting Enzyme Inhibitors

1
Department of Food Biotechnology and Solar Salt Research Center, Mokpo National University, Jeonnam 534-729, Korea
2
Division of Functional Food & Nutrition, National Academy of Agricultural Sciences, Rural Development Administration (RDA), Jeonbuk 560-500, Korea
3
Department of Food Science & Technology, and Functional Food Research Center, Chonnam National University, Gwangju 500-757, Korea
*
Author to whom correspondence should be addressed.
These authors contributed equally to this work.
Molecules 2015, 20(11), 19789-19804; https://doi.org/10.3390/molecules201119657
Submission received: 22 June 2015 / Revised: 26 October 2015 / Accepted: 27 October 2015 / Published: 3 November 2015
(This article belongs to the Collection Bioactive Compounds)

Abstract

:
We investigated the antihypertensive effects of Artemisia scoparia (AS) in spontaneously hypertensive rats (SHR). The rats were fed diets containing 2% (w/w) hot water extracts of AS aerial parts for 6 weeks. The AS group had significantly lower systolic and diastolic blood pressure levels than the control group. The AS group also had lower angiotensin I converting enzyme (ACE) activity and angiotensin II content in serum compared to the control group. The AS group showed higher vascular endothelial growth factor and lower ras homolog gene family member A expression levels in kidney compared to the control group. The AS group had significantly lower levels of plasma lipid oxidation and protein carbonyls than the control group. One new and six known compounds were isolated from AS by guided purification. The new compound was determined to be 4′-O-β-d-glucopyranoyl (E)-4-hydroxy-3-methylbut-2-enyl benzoate, based on its nuclear magnetic resonance and electrospray ionization-mass spectroscopy data.

1. Introduction

High blood pressure is a risk factor for stroke, coronary heart disease and renal vascular disease [1,2]. The control of blood pressure has received considerable attention for public health reasons. Many studies have indicated that foods such as fruits and vegetables have blood pressure-lowering abilities [3,4,5]. Therefore, the clinical importance of fruits and vegetables has received considerable attention.
Halophytes grow widely in the saline environments of coastal sand dunes, salt marshes, mud flats, and inland deserts [6]. They are able to thrive under high salt conditions, although their growth patterns are slightly different depending on the saline concentration. Many studies have indicated that several halophytes, including Salicornia herbacea, Cressia cretica, and Suaeda fruticosa, have various biological effects, including antioxidant, anti-inflammation, and anticancer activities [6,7,8,9]. In addition, halophytes accumulate large amounts of essential minerals, amino acids, and phytochemicals, such as phenolic acids and flavonoids [10,11,12]. These plants accumulate various secondary metabolites including antioxidative compounds with multiple biochemical functions such as the maintenance of ion homeostasis and cell protection in response to saline stress [13,14]. Therefore, halophytes are seen as a potentially useful crop and food source. Recently, we have analyzed the various biological activities of 22 halophytes which were grown in the saline environment of South Korea [15]. Artemisia scoparia (AS) had higher angiotensin I converting enzyme (ACE) inhibitory activity than other halophytes tested.
AS belongs to the family of Asteraceae, which includes A. vulgaris (mugwort) and A. capillaris. The AS aerial parts are eaten as a seasoned vegetable and herb in Korea. The AS has various biological effects, including anti-oxidative, antimicrobial, anti-allergic, anti-atherogenic, anticancer, anti-inflammatory, and liver protection activities [16,17,18,19,20,21]. Chemical constituents of AS, such as flavonoids, coumarins, and essential oils, have been investigated [16,17,18,19,22]. However, studies on the antihypertensive effects of AS in animal models have not yet been performed.
Garlic (Allium sativum) is widely used as a seasoning and ingredient in cooking around the world and has been reported to show various biological activities, such as anti-hypertension, anti-oxidant, and anticancer properties [23,24,25,26]. In particular, garlic is well known to be a useful food to prevent high blood pressure [27,28]. The addition of garlic to AS was expected to synergistically increase the high blood pressure prevention effects more than AS alone. Therefore, in this study, the water extract powder of garlic and AS mixture (ASG) was prepared and used in the animal study. In addition, understanding the chemical constituents of AS is very important in acquiring basic information on blood pressure-lowering ability and the value of this plant as food.
In the present study, we evaluated the antihypertensive effects of AS and ASG in spontaneously hypertensive rats (SHR), which have been widely used as an animal model for evaluating the antihypertensive effects of natural products or foods [29]. In addition, the isolation and identification of ACE inhibitors from AS aerial parts, using purification guided by an ACE inhibitory assay, were performed.

2. Results and Discussion

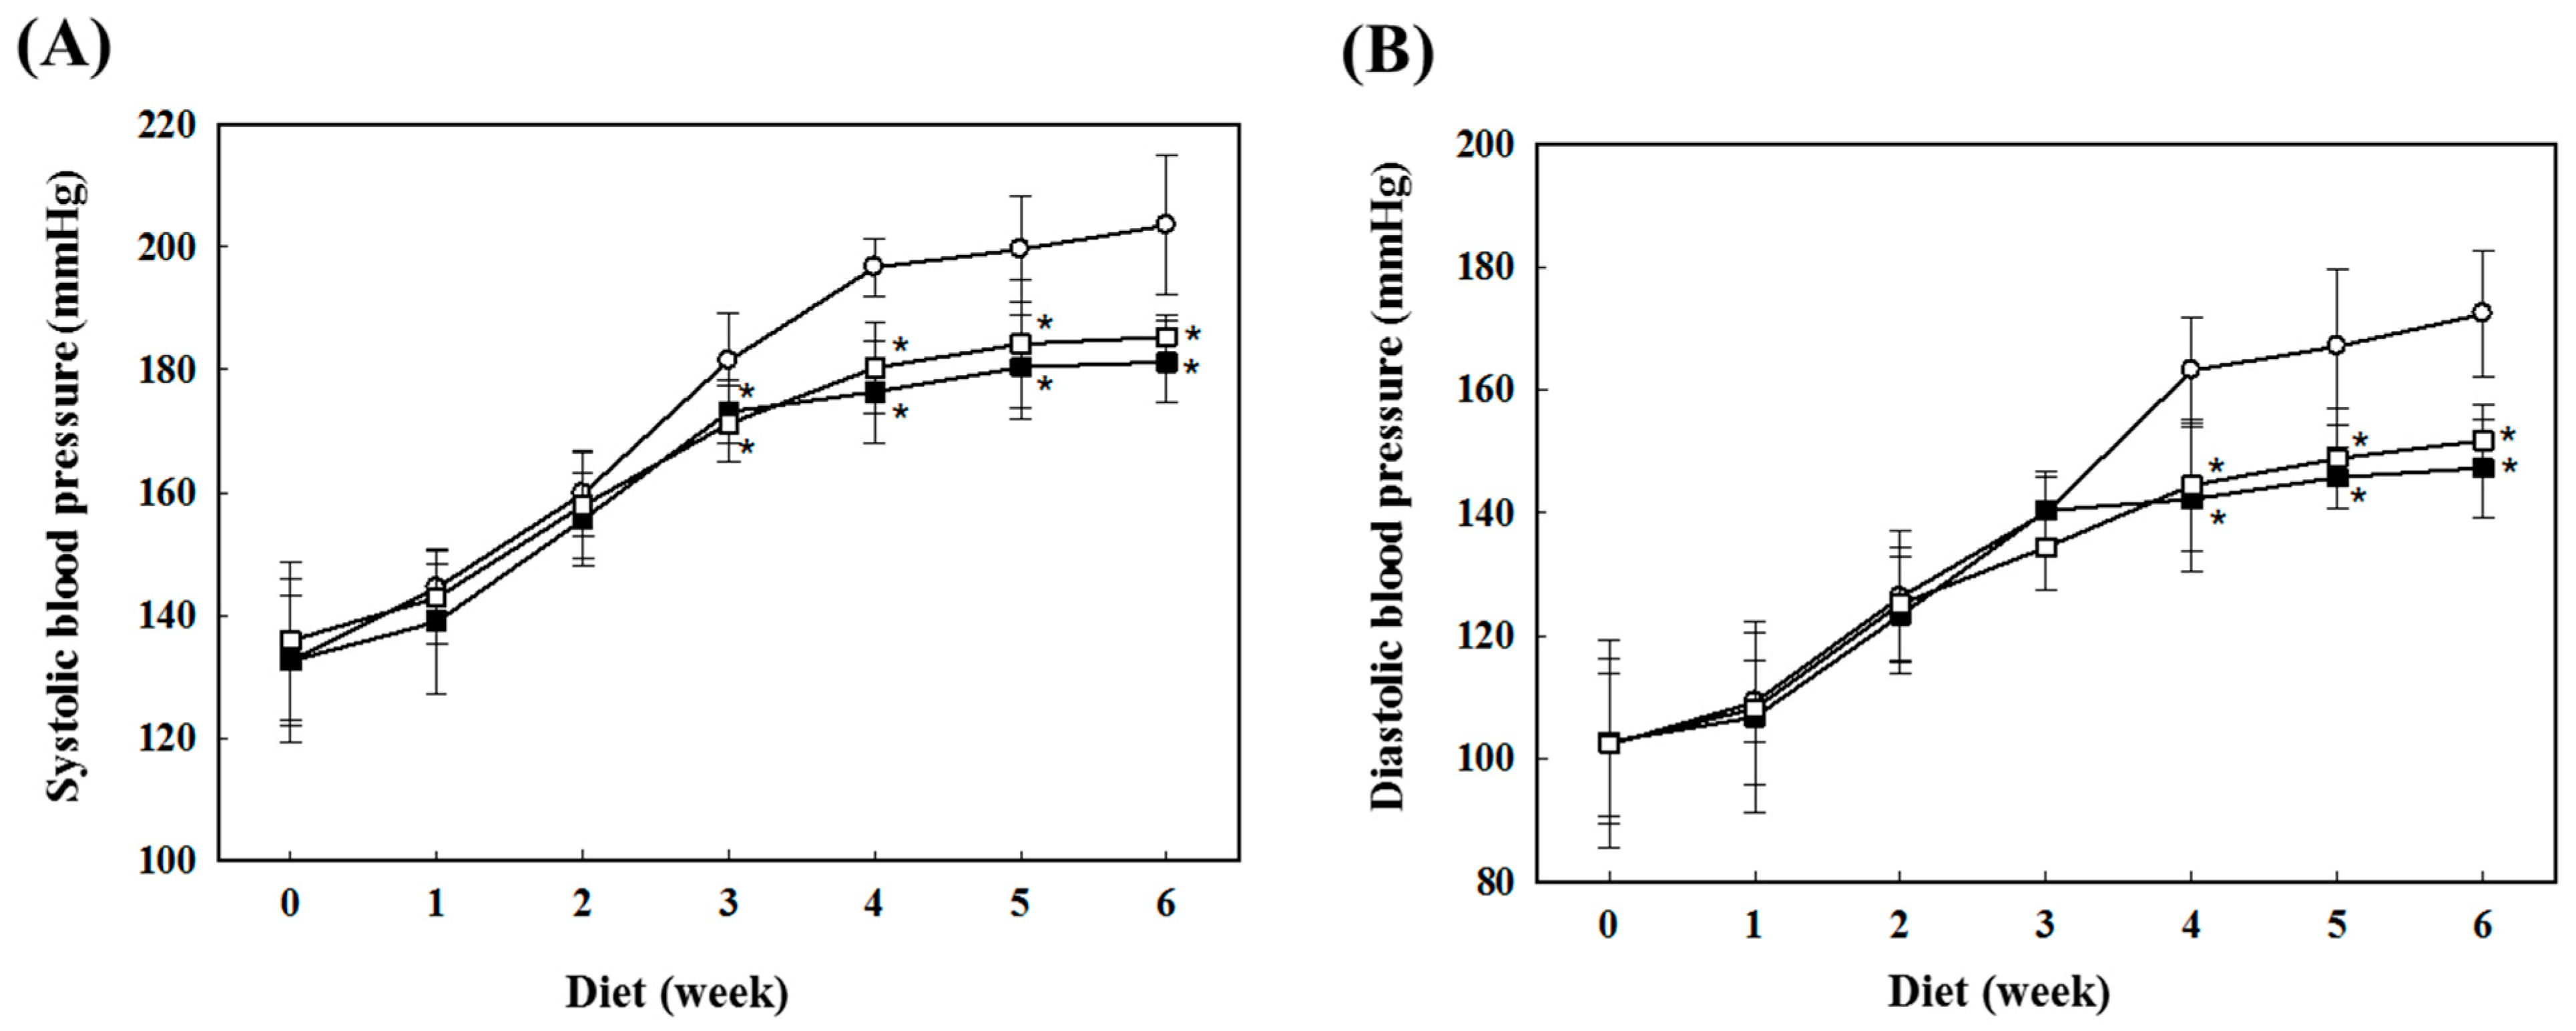
2.1. Preventive Effects of AS on Blood Pressure in SHR

The blood pressure of the SHR fed AS and ASG during 6 weeks was measured using a tail cuff method (Figure 1). The systolic and diastolic blood pressures of the rats fed with normal diet (control) gradually increased during the diet. The AS and ASG diets inhibited the increase of blood pressure in SHR. The blood pressures of the rats fed AS and ASG were similar to that of control rats until 2 weeks into the diet and, thereafter, were significantly lower than that of the control group. At 6 weeks of diet, systolic pressure levels of AS and ASG groups were about 15 mmHg lower than that of the control rats (Figure 1A). The blood pressure of ASG diet group, which was prepared with the addition of garlic to AS, was similar to AS diet group during the diet. This trend in systolic blood pressure was similar to the results of diastolic blood pressure (Figure 1B).
Figure 1. Changes of systolic (A) and diastolic (B) blood pressure in the rats fed the diets of AS and ASG for 6 weeks. ○, Control; □, AS water extract; ■, ASG water extract. Values are expressed as mean ± SD (n = 8). * p < 0.05, compared with control (Tukey’s test).
Molecules 20 19657 g001
Figure 2. Serum ACE activity (A); serum angiotensin II content (B); ACE expression level of kidney (C); and plasma nitric oxide content (D) in rats fed diets of AS and ASG for 6 weeks. Values are expressed as mean ± SD (n = 8). * p < 0.05 and ** p < 0.01, compared with control (Tukey’s test).
Molecules 20 19657 g002
The renin-angiotensin-aldosterone system (RAAS) plays an important role in controlling blood pressure in the body [30]. In this system, ACE converts angiotensin I to angiotensin II that increases blood pressure by causing the constriction of blood vessels [31,32]. Angiotensin II also promotes oxidative stress, inflammation and fibrosis [33]. The ACE activities and angiotensin II contents in the blood of the rats fed AS and ASG are shown in Figure 2. The AS and ASG groups exhibited significantly lower ACE activities and angiotensin II contents in the blood than the control rats (Figure 2A,B). However, significant differences in the ACE activities and angiotensin II contents between AS and ASG groups were not observed. These results were consistent with the results of systolic and diastolic blood pressure levels. The reduced ACE activity could be due to the reduced expression of ACE protein or due to the reduced catalytic activity by inhibitors. We analyzed ACE protein expression level in the kidney using immunoblotting. As shown in Figure 2C, there was no significant difference in protein expression levels of ACE among the control, AS, and ASG groups, indicating that the reduced ACE activities of the AS and ASG groups were probably due to the reduced catalytic activity. In vitro high ACE-inhibitory activities in AS and ASG, lower ACE activities and angiotensin II contents in the blood of the rats fed AS and ASG, no significant difference in protein expression levels of ACE among the groups, and lower systolic and diastolic blood pressures of the rats fed AS and ASG lead to a possibility that ACE inhibitors in AS and ASG inhibit ACE activity of rats, which results in the reduction of angiotensin II production and blood pressure of the rats fed AS and ASG.
Figure 3. Expression levels of VEGF and RhoA in the rats fed the diet of AS and ASG for 6 weeks. The VEGF expression in kidney (A) and skeletal muscle (B); The RhoA expression in kidney (C) and skeletal muscle (D). Values are expressed as mean ± SD (n = 8). * p < 0.05, compared with control (Tukey’s test).
Molecules 20 19657 g003
Endogenous nitric oxide (NO), which is released by endothelial cells of blood vessel through NO synthesis, is a major vasodilator, possibly resulting in lowered blood pressure [34]. No significant difference for the plasma NO concentration among the groups was observed (Figure 2D), although there was a trend that plasma NO concentrations in the rats fed AS and ASG appeared to be slightly higher than that of the control rats. Vascular endothelial growth factor (VEGF) increases NO production by stimulation of endothelial NO synthase (eNOS) and leads to vasodilation [35,36]. In addition, NO suppresses the activation of ras homolog gene family member A (RhoA) that plays a role in regulating vasoconstriction via inhibition of dephosphorylation by myosin phosphatase [37]. Angiotensin II promotes VEGF secretion and the activation of RhoA [38,39]. However, in case of VEGF, relation between VEGF expression and angiotensin II is somehow complicated because ACE inhibition was also reported to induce the expression of VEGF via bradykinin that is increased by ACE inhibition [40,41]. The rats fed AS and ASG had higher levels of VEGF expression and lower levels of RhoA expression in the kidney and skeletal muscle compared to the control rats, although their expression levels were slightly different in each tissue (Figure 3). The AS more efficiently enhanced VEGF expression and suppressed RhoA expression in the kidney. In contrast, the ASG was more effective in the skeletal muscle of SHR. However, there were no statistically significant differences among the AS and ASG groups. These results indicate that AS and ASG reduce blood pressure in SHR via the enhancement of VEGF expression and the suppression of RhoA expression.
In this study, we demonstrated that AS and ASG inhibited ACE activity, but did not increase NO generation. However, no significant difference in NO content and inhibition of ACE activity between AS and ASG was observed, indicating that additional amount of garlic in AS could not synergistically induce an antihypertensive effect. Reduction of blood pressure by AS and ASG could be due to ACE inhibition, decreased oxidative stress, enhanced endothelial function, or direct action on the vascular smooth muscle. Our study demonstrated a possibility that ACE inhibitors in AS played a role in reduction of blood pressure as intake of AS reduced ACE activity and angiotensin II content, but did not suppress ACE expression. There could be another possible mechanism that ACE inhibitors reduce blood pressure. It has been reported that endothelial dysfunction is an early feature of angiotensin II-mediated hypertension [41]. Therefore, it may be possible that reduced angiotensin II content by ACE inhibitors of AS could improve endothelial function and played a role in reduction of blood pressure.

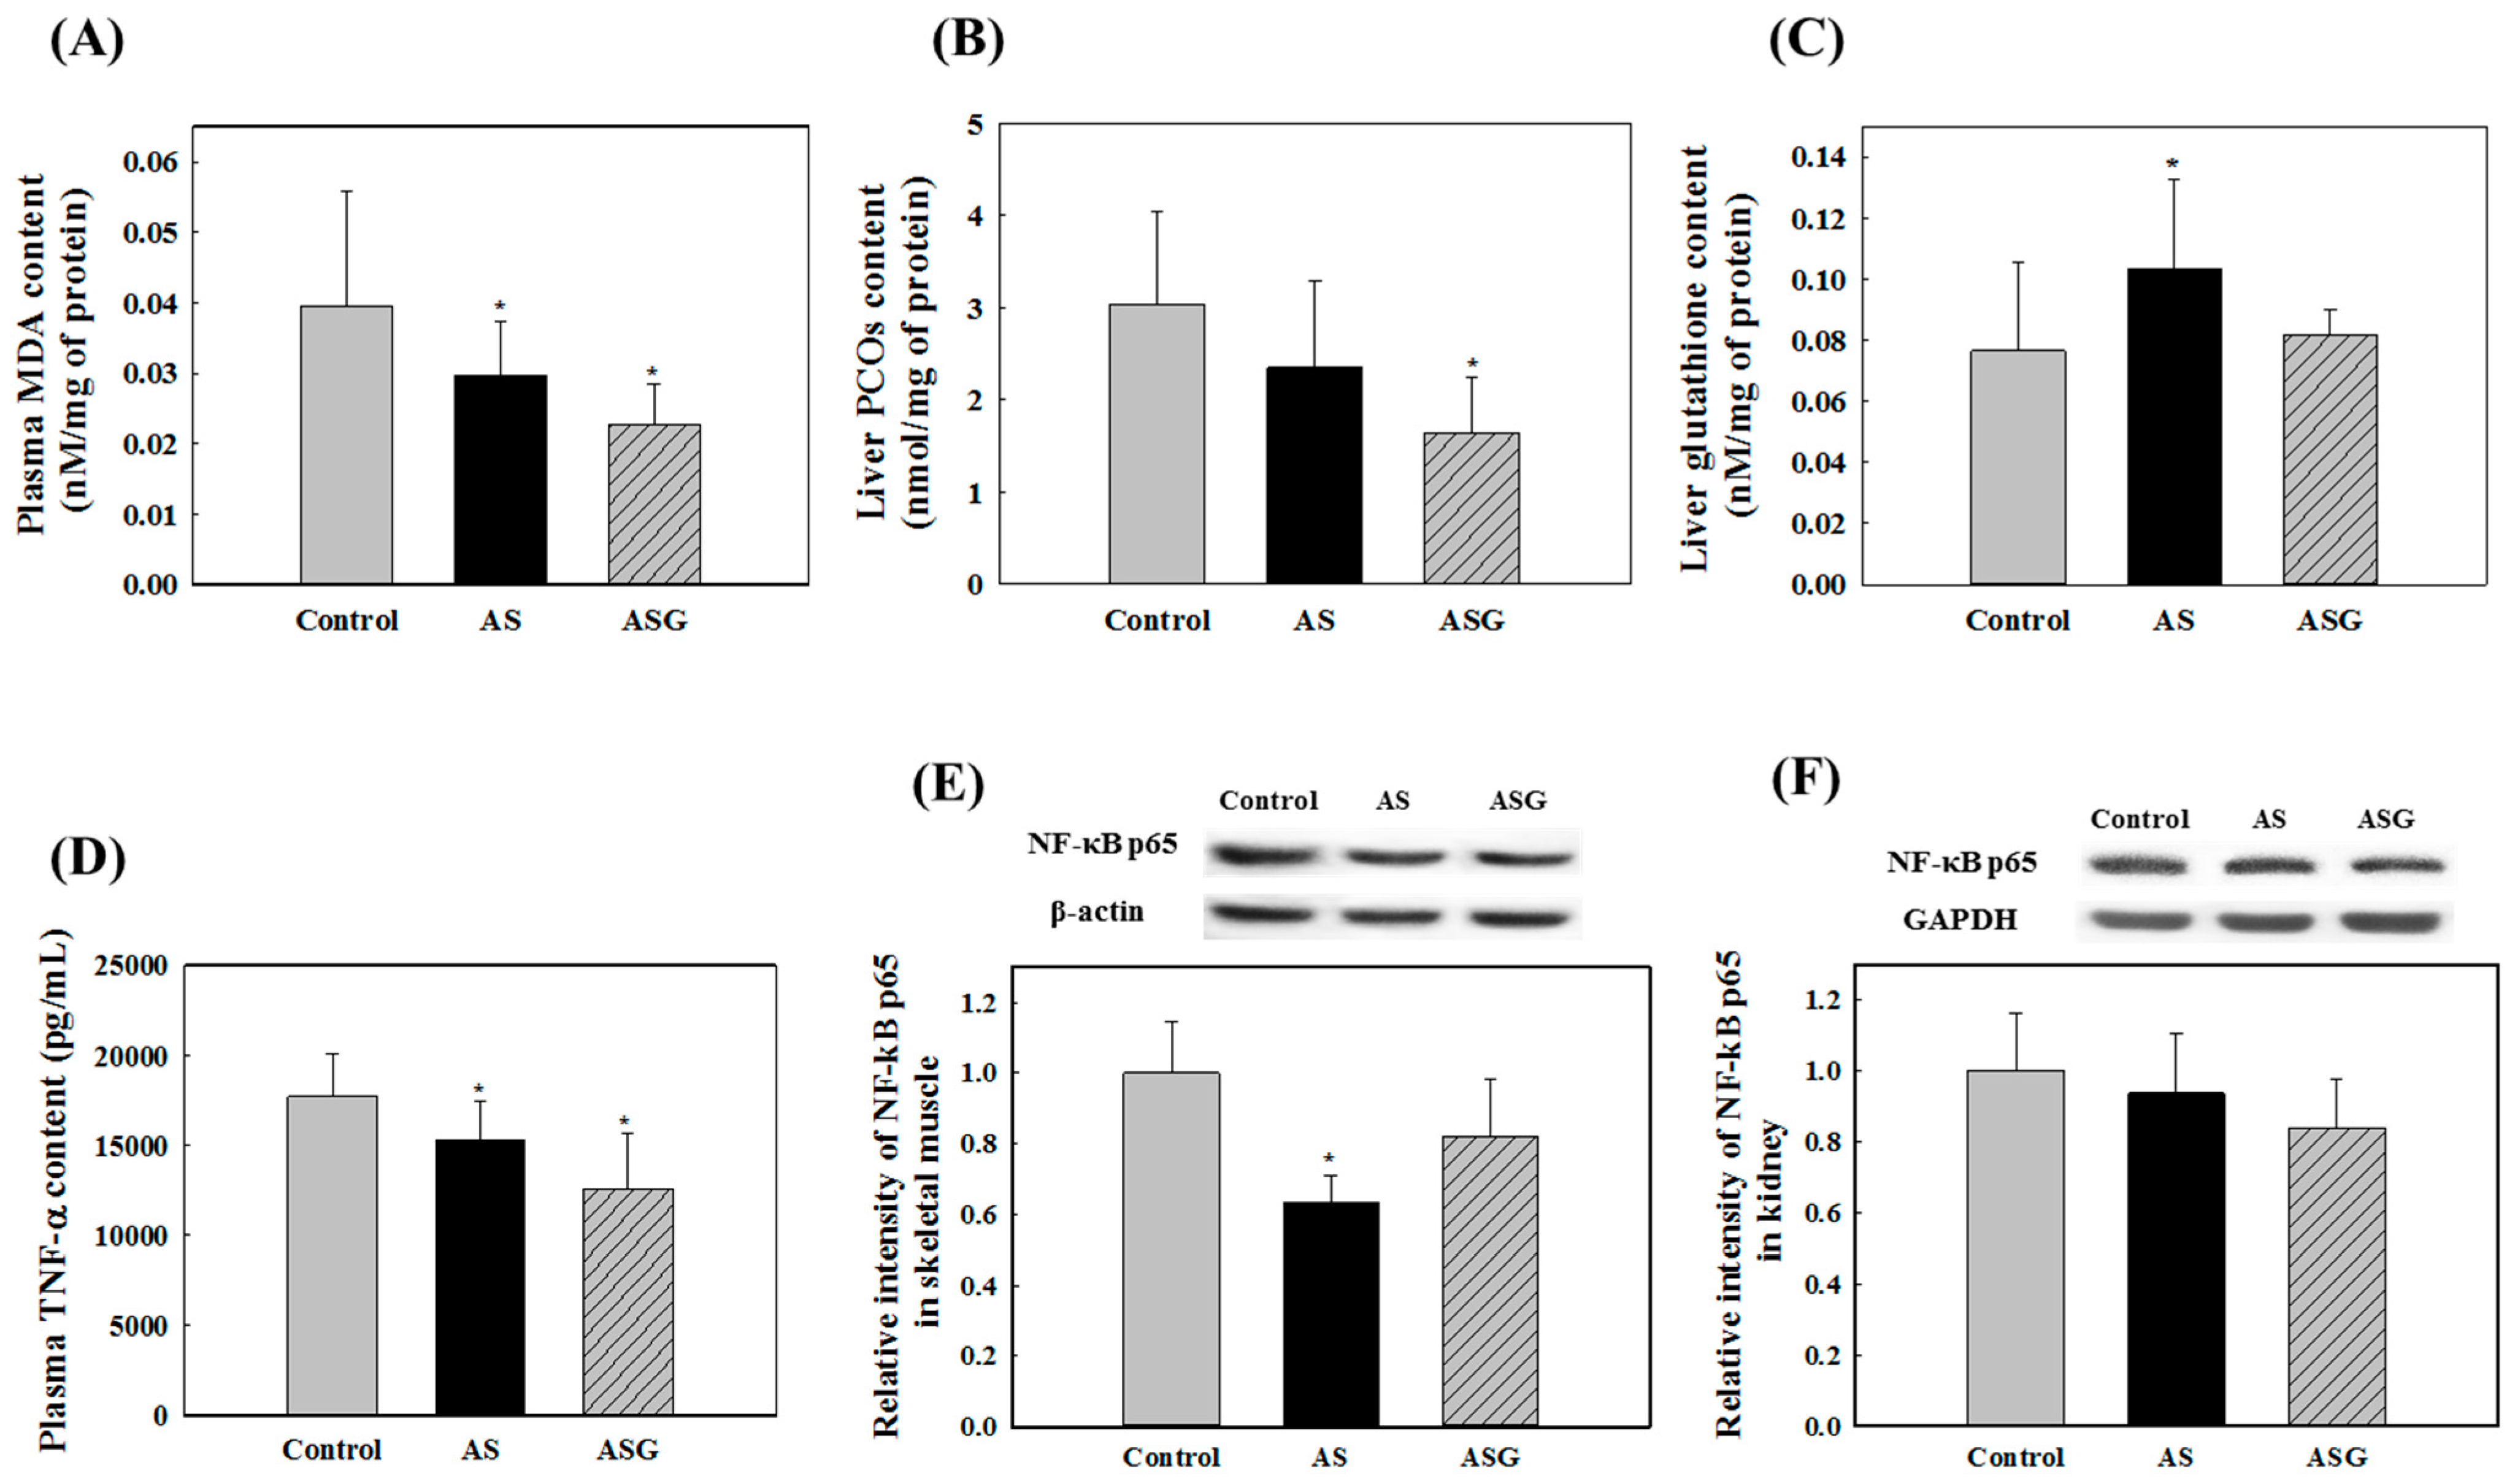
2.2. Preventive Effects of AS on Oxidative Stress in SHR

Oxidative stress is increased in high blood pressure in response to vessel stimulation [42]. Breakdown of redox balance produces excessive reactive oxygen species and lead to oxidize cellular components such as DNA, RNA, proteins, and lipids. Malondialdehyde (MDA) and protein carbonyls (PCO) are important markers of lipid peroxidation and protein oxidation, respectively [43,44]. In addition, the increase of oxidative stress induces inflammation by activating NF-κB via tumor necrosis factor alpha (TNF-α) [45]. In this study, we found that AS and ASG more efficiently suppressed the increasing levels of oxidative stress- and inflammation-related biomarkers. That is, the rats fed with AS had lower levels of MDA in the plasma and PCO in the liver (Figure 4A,B) than the control rats. In addition, the rats fed with the AS had higher total glutathione content in the liver than the control rats (Figure 4C,D). The rats fed with the AS had lower levels of TNF-α in plasma and NF-κB expression in kidney than the control rats (Figure 4E,F). These results indicate that AS and ASG reduce oxidative stress and inflammation in SHR. Garlic has been reported to inhibit hypertension by suppressing NF-κB expression and lowering ROS concentration [46]. In particular, reduction of oxidative stress and inflammation of ASG was more effective than those of AS, although they were no statistically significant differences between the AS and ASG groups. Therefore, it seemed apparent that reduced oxidative stress by AS and ASG at least partially played a role in lowering of blood pressure.
We found that AS and ASG reduce blood pressure in SHR via the inhibition of plasma ACE activity, the enhancement of VEGF expression, and the suppression of RhoA expression. However, antihypertensive effects between AS and ASG had no significant difference, suggesting that mainly AS has contributed to the antihypertensive effect of ASG. In particular, AS may reduce blood pressure via an inhibition of ACE, one of the important factors in regulation of blood pressure. In addition, ACE inhibitors have been reported to show various preventive effects for heart failure, myocardial infarction, and diabetic nephropathy [37,38,39,40,41,42,43,44,45,46,47,48,49]. Therefore, we attempted the isolation and identification of the ACE inhibitors from AS aerial parts with guided purification of ACE inhibitory assay. The hot water extracts of the AS aerial part were solvent-fractionated to obtain n-hexane, chloroform (CHCl3), ethyl acetate (EtOAc), water-saturated n-butanol (BuOH), and H2O fractions. The ACE inhibitory activities of these fractions were evaluated by comparing their activity against ACE extracts of rabbit lung. The CHCl3 and EtOAc fractions showed higher ACE inhibitory activity than the other fractions. The n-hexane and BuOH fractions showed very low ACE inhibitory activity, similar to the H2O fraction. Therefore, we pursued purification of ACE inhibitors from the CHCl3 and EtOAc fractions.
Figure 4. Effects of AS and ASG on oxidative stress in rats. (A) Lipid peroxidation in plasma; (B) Protein oxidation in liver; (C) Glutathione content in liver; (D) TNF-α level in plasma; (E) NF-κB p65 expression in kidney; (F) NF-κB p65 expression in skeletal muscle. Values are expressed as mean ± SD (n = 8). * p < 0.05, compared with control (Tukey’s test).
Molecules 20 19657 g004
Seven ACE inhibitors 17 were isolated from the CHCl3 and EtOAc fractions of AS aerial parts by various column chromatographic procedures with the guided assay of ACE inhibition. The structures of the isolated compounds were determined by NMR and ESI-MS analyses. Among them, six known compounds previously isolated from AS aerial parts were identified as eugenol 2 O-β-d-glucopyranoside (1), 4-(O-β-d-glucopyranoyl)-3-(3′-methyl-2′-butenyl)acetophenone (3) [50], salicylic acid (4) [51], 3,4-dihydroxybenzoic acid (5) [52], caffeic acid (6) [52], and isofraxidin 7-O-β-d-glucopyranoside (7) (Figure 5). Compounds 46 were identified via comparison of their NMR and MS spectroscopic data with values previously reported in the relevant literature. Compounds 1 and 7 were identified by 1D- and 2D- (HSQC, HMBC, 1H-1H COSY, and NOE) NMR and MS spectroscopic data. These compounds have been identified from Michelia hedyosperma [53] and Apium graveolens [54], respectively.
Figure 5. Structures of ACE inhibitors from AS and the important 1H-1H COSY (bold lines) and HMBC (arrows) correlations for 2.
Molecules 20 19657 g005

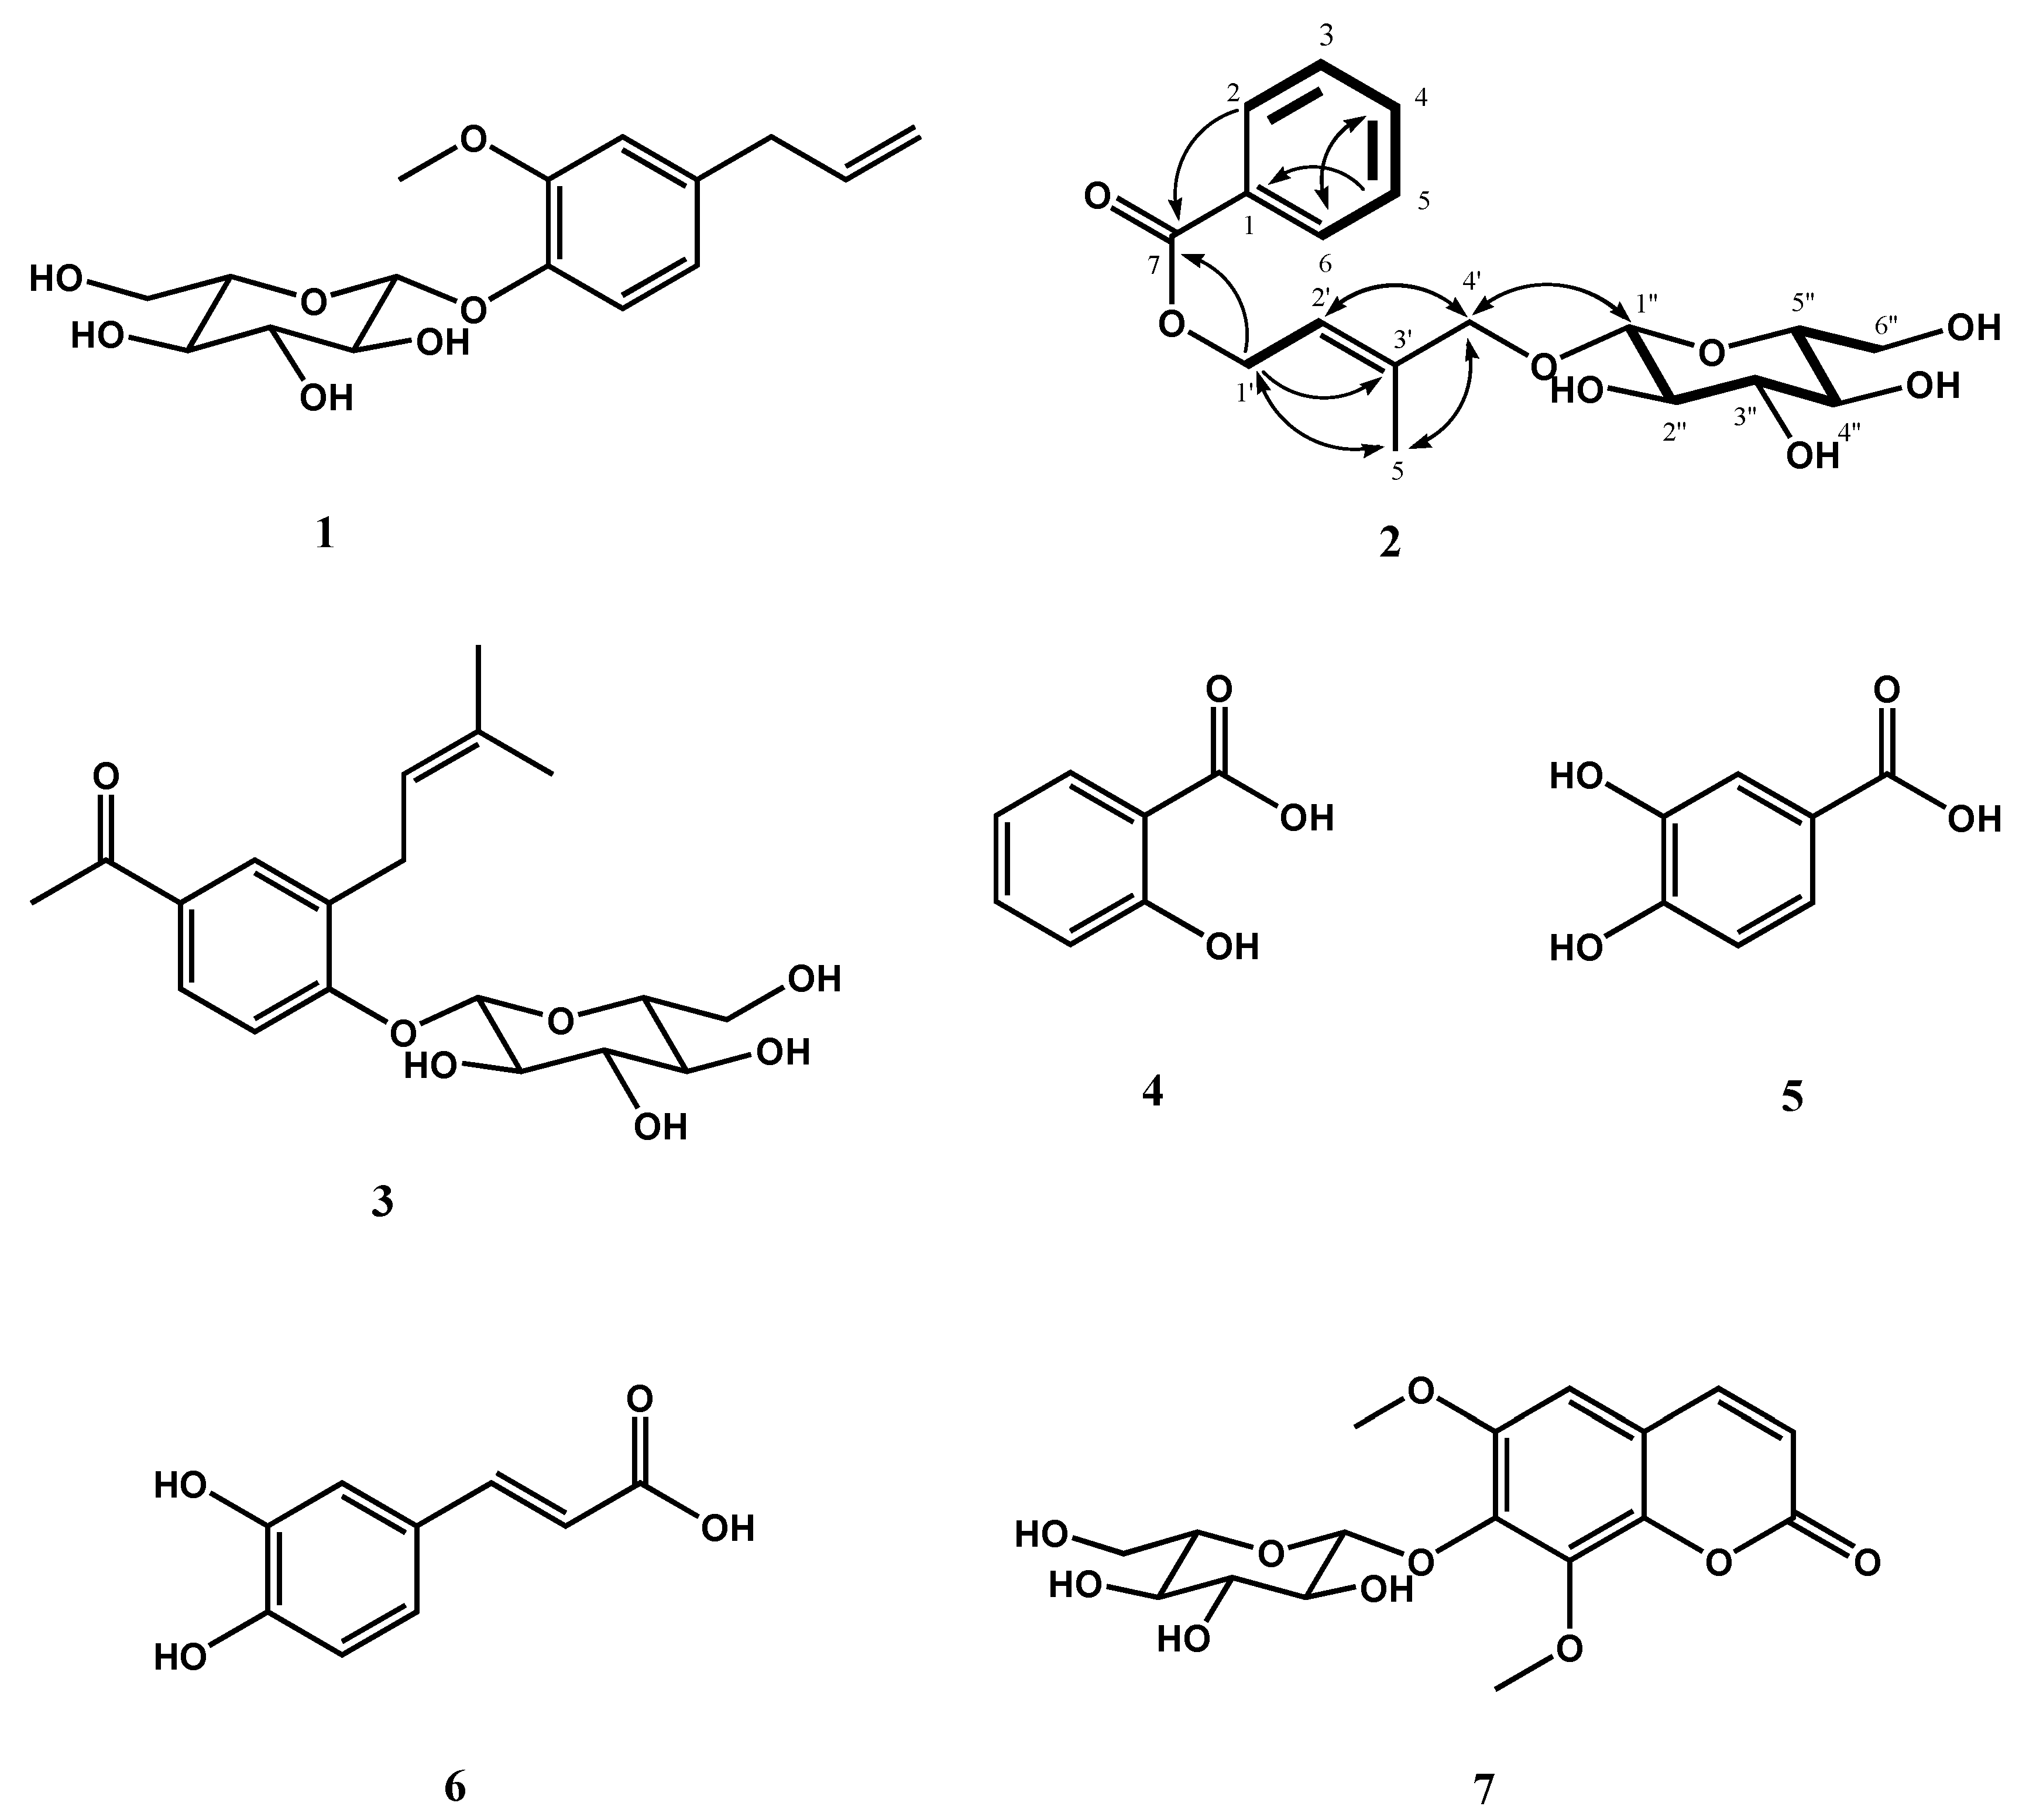
2.3. Isolation and Structural Determination of 2

The molecular formula of 2 was C18H24O8 (MW, 368), as established by a pseudomolecular ion peak at m/z 391.1365 [M + Na]+ (calculated for C18H24O8Na, m/z 391.1369, −0.4 mDa) in the HRESI-MS (positive) data (supplementary data). The 1H-NMR spectrum exhibited three phenyl group proton signals at δ 8.01 (2H, dd, J = 8.4, 1.8 Hz, H-2,6), 7.48 (2H, dd, J = 8.4, 8.4 Hz, H-3,5), and 7.60 (1H, tt, J = 8.4, 1.8 Hz, H-4) (Table 1). In addition, a sp2 methine carbon proton signal at δ 5.83 (1H, m, H-2′), two oxygenated sp3 methylene carbon proton signals at δ 4.31 (1H, d, J = 12.6 Hz, H-1′a), 4.11 (1H, d, J = 12.6 Hz, H-1′b), and 4.92 (2H, s, H-4′), and one methyl carbon proton signal at δ 1.84 (3H, m, H-5′) were observed in the spectrum, suggesting that the other partial structure was 2-methylbut-2-ene-1,4-diol. The presence of a sugar moiety was derived from the anomeric signal at δ (δ 4.28, H-1′′) and other signals at δ 3.86–3.21 (6H, m, H-2′′–H-6′′). The configuration of β-d-glucopyranoside was assigned by the coupling constant values (J = 7.8–9.0 Hz) of sugar proton signals and their proton-proton correlations (Figure 5, bold lines) in the 1H-1H correlation spectroscopy (COSY) spectrum. This result was also supported by the 13C-NMR spectrum, which contained 18 carbon signals, including nine aglycone signals [a carbonyl carbon (δ 168.1, C-7), eight sp2 carbons (δ 139.6–122.3), two oxygenated sp3 methylene carbon (δ 62.1, C-1′; 74.6, C-4′) and a methyl carbon (δ 14.5, C-5′)] and six sugar carbon signals (δ 103.3–62.9). The proton signals at 4.92 (2H, s, H-4′) and 3.34 (1H, t, J = 9.0 Hz, H-4′′) overlapped with those of the solvents were confirmed in the HSQC spectrum (supplementary data). From the HRESI-MS and 1D-NMR spectra, 2 was suggested to be benzoic acid connected with 2-methylbut-2-ene-1,4-diol and glucose moieties. Complete NMR assignment and connectivity of 2 were further determined by 1H-1H COSY (Figure 5, bold lines), HSQC, and HMBC (Figure 5, arrows) experiments. In particular, correlation from H-1′ to C-7′ observed in the HMBC spectrum indicated that 2-methylbut-2-ene-1,4-diol was esterified with benzoic acid (Figure 5, arrows). Correlations from H-1′′ to C-4′ and H-4′ to C-1′′ observed in the HMBC spectrum indicated that glucose moiety was etherified with the 4 position of 2-methylbut-2-ene-1,4-diol (Figure 5, arrows). Consequently, the structure of 2 was unambiguously determined to be 4′-O-β-d-glucopyranoyl (E)-4-hydroxy-3-methylbut-2-enyl benzoate (Figure 5), which is a new compound.
Table 1. 1H- and 13C-NMR data of 2 in methanol-d4.
Position2
δH (rel. int., mult., J in Hz)δC
1-131.7
2,68.01 (2H, dd, 8.4, 1.8)130.6
3,57.48 (2H, dd, 8.4, 8.4)129.7
47.60 (1H, tt, 8.4, 1.8)134.4
7-168.1
1′a4.31 (1H, d, 12.6)62.5
1′b4.11 (1H, d, 12.6)
2′5.83 (1H, m)122.3
3′-139.6
4′4.92 (2H, s) (a)74.6
5′1.84 (3H, s)14.5
1′′4.28 (1H, d, 7.8)103.3
2′′3.21 (1H, dd, 9.0, 7.8)75.2
3′′3.34 (1H, t, 9.0) (b)78.2
4′′3.28 (1H, t, 9.0)71.8
5′′3.24 (1H, m)78.2
6′′a3.65 (1H, dd, 12.0, 5.4)62.9
6′′b3.86 (1H, dd, 12.0, 2.4)
(a), (b) The signals of H-4′ and H-3′′ overlapped with those of solvent.

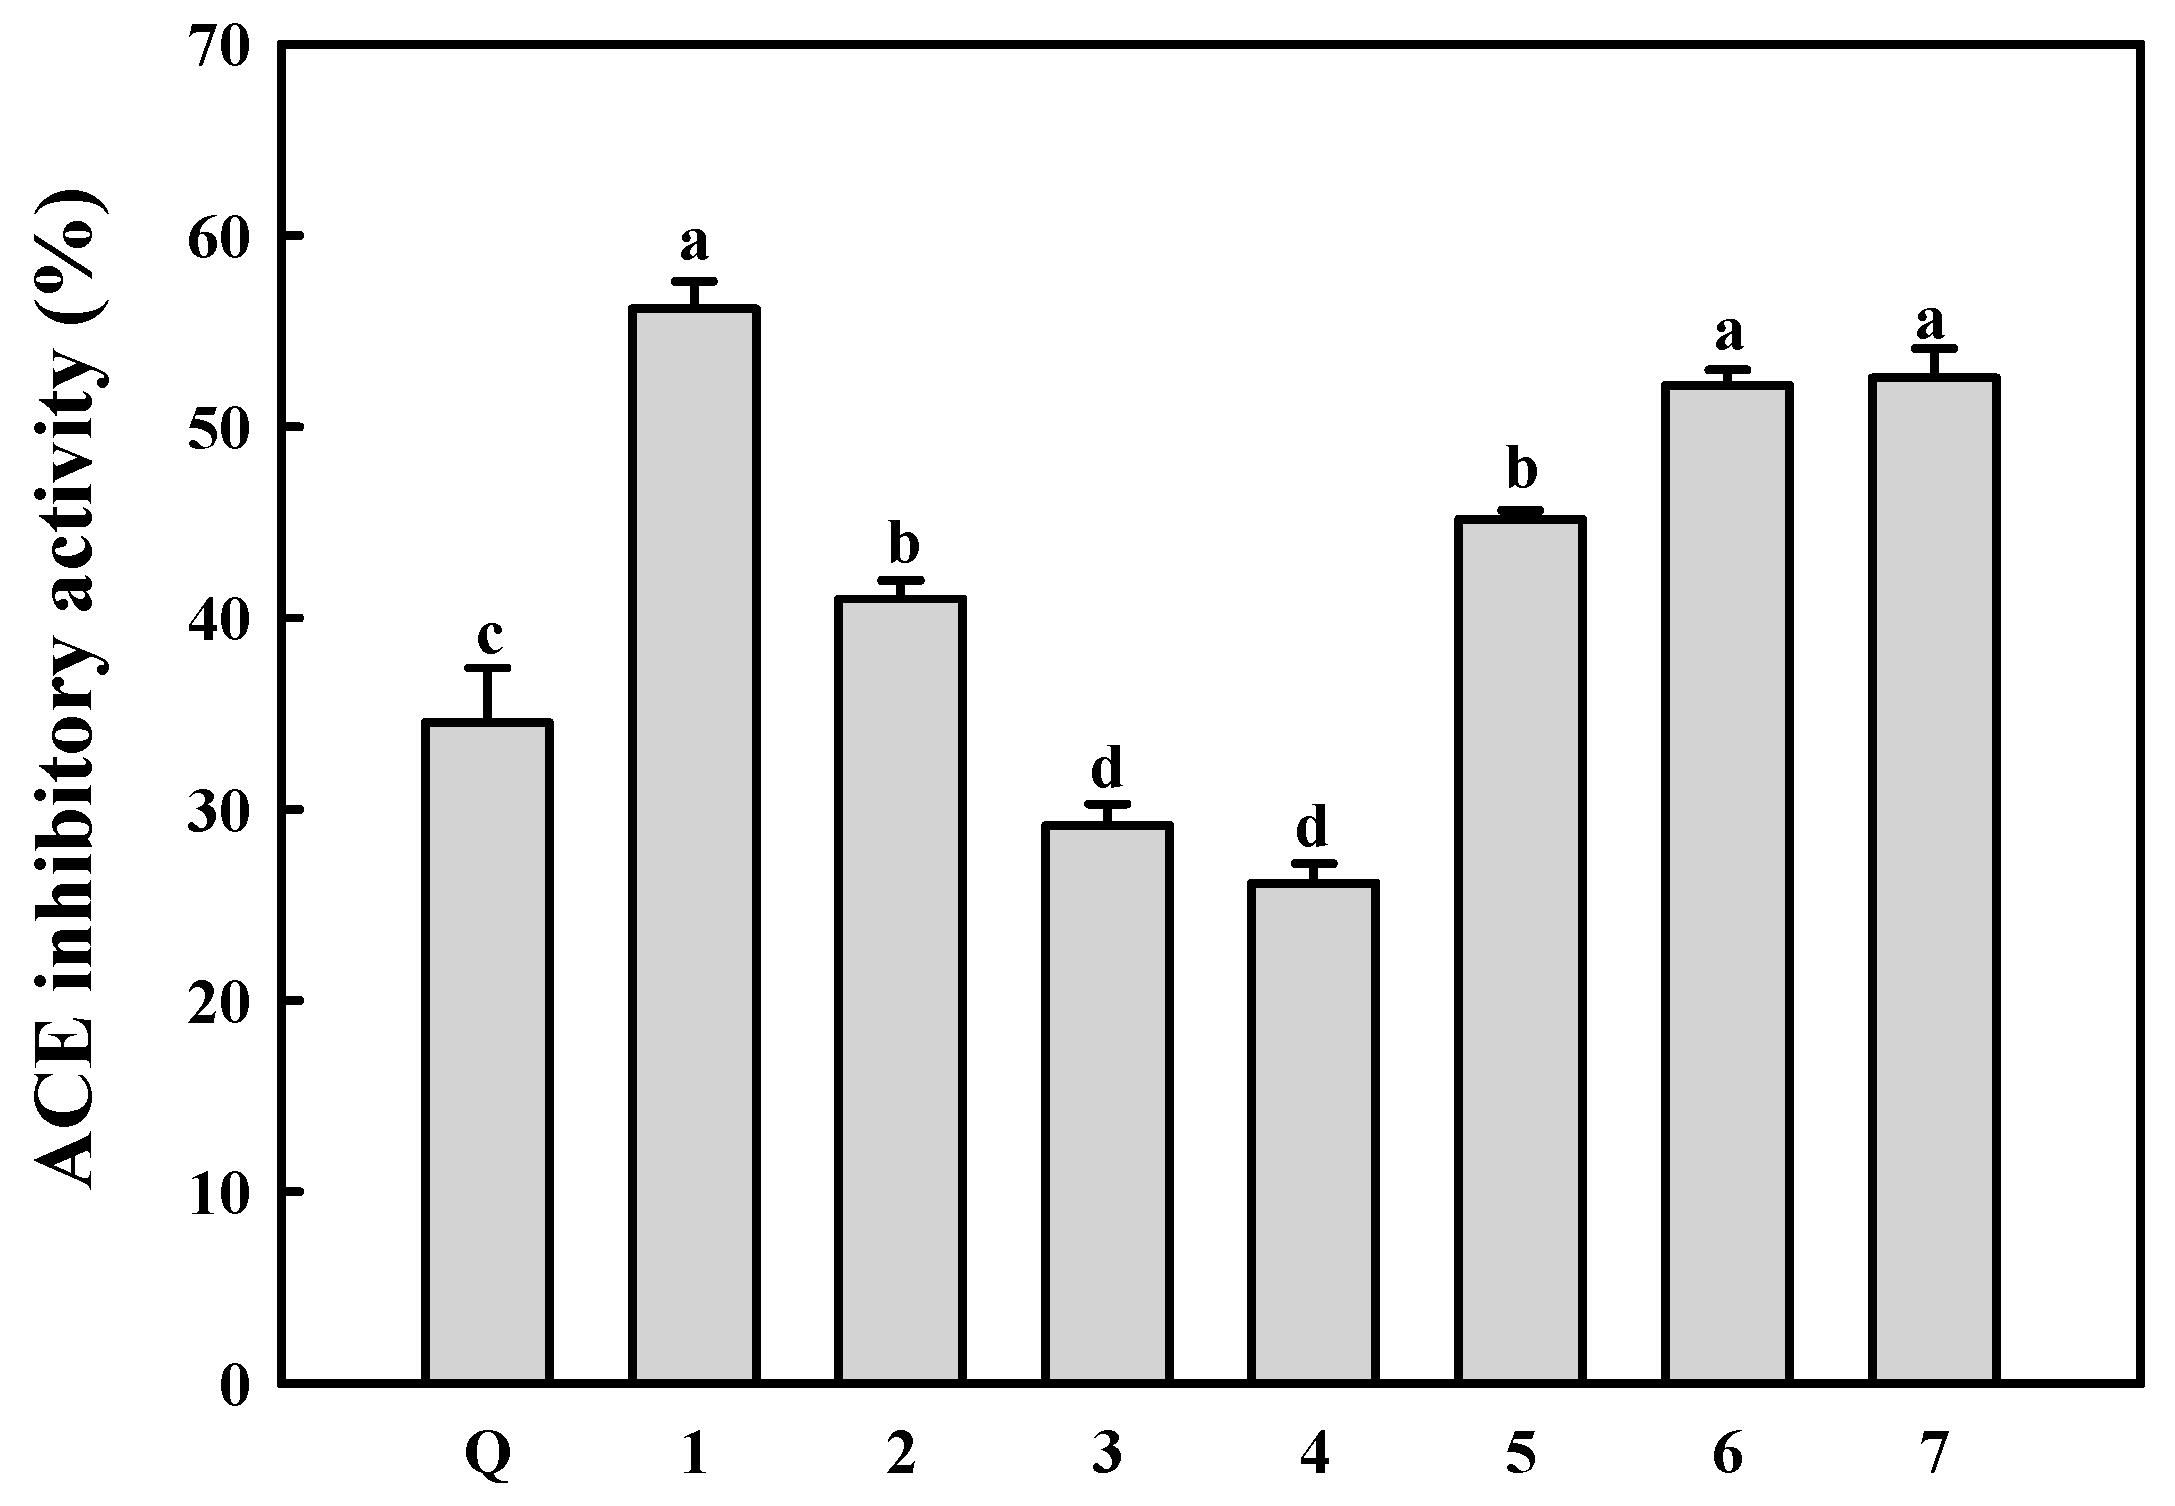
2.4. ACE Inhibitory Activity of the Isolated Compounds

The ACE inhibitory activities of the identified compounds 17 at the same concentration (1 mM) were evaluated using ACE crude extract from rabbit lung. Quercetin (Q), which is widely distributed in nature and has ACE inhibitory activity [55,56], was used as a positive control. The ACE inhibitory activities of the identified compounds 17 are shown in Figure 6. As expected, these compounds exhibited ACE inhibitory activities (28.3% ± 1.46%–55.8% ± 1.54%), although their activities were very low in comparison to that (49.3% ± 2.6%) of captopril (1 nM), which is used as a drug. However, the ACE inhibitory activities of the isolated compounds 17 were higher and similar when compared to that of Q. Compounds 1, 6, and 7 had higher ACE inhibitory activity than other compounds. In addition, the new compound 2 had relatively high ACE inhibitory activity at the same concentration (1 mM) under the reaction conditions used. Several phenolic compounds 57 identified in this study have been reported to show ACE inhibitory activity [54,56,57,58]. These observations indicated that the phenolic compounds identified have in vitro ACE inhibitory activities. In addition, phenolic compounds, which are widely distributed in various plants, have been reported to show anti-oxidative and anti-inflammatory activities [59,60]. Therefore, the phenolic compounds identified in this study may be responsible for anti-oxidative activity of AS.
Figure 6. ACE inhibitory activities of ACE inhibitors isolated (17). Q (quercetin) was used as positive control. The isolated compounds were assayed at the concentration of 1 mM. Values are expressed as mean ± SD (n = 3). a–d Results with a different letter differ significantly (p < 0.05).
Molecules 20 19657 g006

3. Experimental Section

3.1. General Experimental Procedures

Nuclear magnetic resonance (NMR) spectra were obtained with unityINOVA 600 and 500 spectrometers (Varian, Walnut Creek, CA, USA). Methanol-d4 containing tetramethylsilane (TMS) was used as solvent. All mass spectra were acquired on a hybrid ion-trap time-of-flight mass spectrometer (SYNAPT G2, Waters, Cambridge, UK) equipped with an electrospray ionization (ESI) source (ESI-MS). Thin-layer chromatography (TLC) was carried out by using silica gel TLC plates (silica gel 60 F254, 0.25 mm thickness, Merck, Darmstadt, Germany) and developed by using a mixture of CHCl3/MeOH = 7:3 (v/v). The fractions were visualized by UV and 1% cerium IV sulfate ethanol solution spray. Silica gel (Kiesel gel 60, 70–230 mesh; Merck, Darmstadt, Germany) and Sephadex LH-20 (25–100 mesh; GE Healthcare Bio-Sciences AB, Uppsala, Sweden) were used for column chromatographies. The fractions obtained from column chromatographies were purified by high performance liquid chromatography (HPLC, Waters, Milford, MA, USA) using a Spherisorb S5 ODS2 column (10 mm × 250 mm). Flow rate was 3.0 mL/min, and eluents were monitored at 220 nm.

3.2. Chemicals

The following chemicals were obtained from Sigma Chemical Co. (St. Louis, MO, USA): thiobarbituric acid (TBA), MDA, NADPH, glutathione reductase, l-gluthathione reduced, hydroxylamine hydrochloride, 5,5′-dithiobis(2-nitrobenzoic acid) (DTNB), guanidine hydrochloride, N-hippuryl-l-histidyl-l-leucine, hippuric acid, quercetin (Q), and lung acetone powder of rabbit. Rabbit anti-GAPDH polyclonal antibody and anti-β-actin were purchased from Ab Frontier (Seoul, Korea). Horseradish peroxidase (HRP)-conjugated goat anti-rabbit immunoglobin was obtained from Millipore Co. (Billerica, MA, USA). Antibodies against ACE, VEGF, and RhoA were obtained from Santa Cruz Biotechnology (Santa Cruz, CA, USA). Solvents used for analyses were of HPLC grade. All other chemicals were of reagent grade.

3.3. Materials

The aerial parts of AS were collected May, 2013 in Shinan County, South Korea. They were washed with water, immediately steamed for 2 min, and dried at 45 °C for 2 days. The dried samples were stored at −20 °C until used in the experiments. Garlic was collected June, 2013 in Shinan County, South Korea. Voucher samples (AS, MNU AS 20130601; garlic, MNU G 20130602) were deposited in the herbarium of the laboratory. The dried AS aerial parts (4 kg) were extracted with distilled water (40 L) at 121 °C for 30 min. After filtration with No. 2 filter paper (Whatman, Maidenstone, UK), the residues were repeatedly extracted with distilled water (20 L), as described above, and then filtered (No. 2 filter paper) again. The extracted solutions were combined and were freeze-dried to obtain AS water extract powder. Additionally, to obtain the water extract powder of AS and garlic mixture, the dried AS aerial part and fresh garlic (ASG) were mixed in the proportion of 3.6:0.4 (w/w). Extraction, filtration, and freeze-drying of the ASG mixture were performed by the same extraction procedures as described in the preparation of AS powder.

3.4. Animal Studies

Male SHR rats (80 ± 10 g, 4 week-old) were obtained from Central Lab. Animal Ltd. (Seoul, Korea). All rats were housed in room temperature (25 ± 1 °C) with humidity (55% ± 5%) and light cycle (12 h: 6:00 to 18:00). Food and water were available ad libitum. All rats were fed the standard rodent diet (Harlan Rodent diet, 2018S) for 3 weeks. All experimental procedures were approved by the Ethics Committee of Mokpo National University (no. MNU IACUC-2014-011). The rats used in animal studies were randomly divided into three groups: control group that was fed AIN-93G diet; AS group that was fed the diet containing 2% (w/w) AS water extract; ASG group that was fed the diet containing 2% (w/w) ASG water extract. The AS and ASG diets were prepared from 2% (w/w) AS and ASG water extracts, respectively, based on manufacture protocol of AIN-93G purified diet for rodents. The rats were fed these experimental diets for 6 weeks. Food and water intake were recorded during the AS and ASG diets.

3.5. Blood Pressure Measurement

The systolic and diastolic blood pressure levels of rats during the special diets were measured by tail-cuff method using Heater Scanner LE 5650/6 and Storage Pressure Meter LE 5002 (Panlab, S.L., Barcelona, Spain). The rats were placed on a chamber preheated at 37 °C. A clamp type transducers and cuff were set up on the tails of rats. Systolic and diastolic blood pressures of the rats were measured at 37 °C for 10 min. The rats were trained in an acrylic restrainer every day for one week before measuring blood pressure. Systolic and diastolic blood pressures were measured when rats were still unperturbed in the chamber during the inflation-deflation cycles.

3.6. Determination of Plasma ACE Activity

ACE activity in serum was measured by using HHL as a substrate [61]. The serum samples (50 μL) were mixed with 0.1 M sodium borate buffer (pH 8.3, 100 μL) containing 300 mM NaCl and 5 mM HHL (50 μL). The mixture was incubated at 37 °C for 45 min, and then the enzymatic reaction was stopped with the addition of 2 N HCl solution (200 μL). The reaction mixture was separated with ethyl acetate (2.0 mL). The upper layer (ethyl acetate layer, 1.5 mL) was concentrated and dissolved with 1 M NaCl solution (1 mL). The absorbance was measured at 228 nm and the hippuric acid content in the serum was calculated using calibration curve of hippuric acid standard.

3.7. Determination of Serum Angiotensin II content

Angiotensin II content in serum was determined by using Rat angiotensin II EIA kit (RayBiotech, Inc., Norcross, GA, USA).

3.8. Determination of NO Content in Plasma

The NO content in plasma was measured according to Griess assay [62]. The plasma samples (0.1 mL) were mixed with zinc sulfate (50 μL, final concentration 15 mg/mL) and then centrifuged at 1000× g for 10 min. The supernatant (100 μL) was mixed with vanadium (III) chloride (100 μL, final concentration 8 mg/mL) and added to 2% sulfanilamide in 5% H3PO4 solution (50 μL) and 0.1% N-(1-naphthyl)ethylenediamine (50 μL). After incubation at 37 °C for 30 min, the absorbance was measured at 540 nm. The NO content in the plasma was calculated using standard curve of sodium nitrite.

3.9. Western Blotting

The tissues (0.2 g) were mixed with a lysis buffer containing 1% Triton X-100, 50 mM HEPES (pH 7.4), 100 mM sodium pyrophosphate, 10 mM NF, 10 mM EDTA, 2 mM phenylmethylsulfonyl fluoride, pepstatin (1 μg/mL), leupeptin (1 μg/mL), 10 mM Na3VO4, and aprotinin (0.1 mg/mL). After protein extraction at 4 °C for 2 h, the homogenate was centrifuged (15,000× g, 4 °C) for 40 min. The protein content in the supernatant was determined by using Bradford protein assay [63]. The protein solution (0.1 mL) combined with 0.1 mL of tricine buffer (BioRad, Hercules, CA, USA) was denatured for 5 min at 95 °C. The denatured proteins were analyzed by sodium dodecyl sulfate polyacrylamide gel electrophoresis. The proteins were transferred electrophoretically to polyvinylidene fluoride membranes (Pall Corporation, Pensacola, FL, USA). After blocked with a blocking buffer containing 3% bovine serum albumin (BSA) for 1 h, the membrane was incubated with primary antibodies (VEGF, RhoA, NF-κB p65) overnight at room temperature. After washing, the membrane was incubated with HRP-conjugated goat anti-rabbit immunoglobin G for 1 h and then the bands were visualized by chemiluminescence (ECL) reagent. Visualized protein bands were photographed and their intensities were analyzed by ImageJ software (NIH, Bethesda, MD, USA).

3.10. Determination of Thiobarbituric Acid Reactive Substances (TBARS)

The plasma (0.1 mL) was mixed with 0.6 M HCl solution (0.5 mL) containing 20% TCA and 1 M NaOH solution (0.3 mL) containing 0.67% TBA. The mixture was boiled for 20 min, cooled, and then separated with water-saturated n-butanol (800 μL). The absorbance of the upper layer (n-butanol layer) was measured at 532 nm and TBARS levels in the plasma were calculated using standard curve of MDA [64].

3.11. Determination of Protein Carbonyl Content

The protein extract (2.0 mg) obtained from liver tissue was mixed with 0.1 mL of 2.0 M HCl solution containing 10 mM DNPH. The mixture was incubated for 1 h in a dark place at room temperature and heavily shaken at 15 min intervals. The reaction mixture was added to 1.0 mL of a cooled 10% (w/v) trichloroacetic acid solution and centrifuged at 3000× g for 10 min. The protein pellet was washed three times with 2.0 mL of ethanol/ethyl acetate = 1:1 (v/v). The pellets were then dissolved in 1.5 mL of 6 M guanidine hydrochloride (pH 2.3). After incubation for 10 min at 37 °C, the absorbance was measured at 370 nm. The PCO content was calculated in nmol of carbonyls groups per mg of protein, using the extinction coefficient of 2.2 × 10⁴/M·mL [65].

3.12. Measurement of Glutathione (GSH) Content

The liver tissue (0.1 g) was homogenized in 0.05 sodium phosphate buffer (1 mL, pH 7.4) containing 0.14 M KCl and 0.02 M EDTA. The homogenate was mixed with 10% TCA solution (1 mL) and then centrifuged (8000× g, 10 min) at 4 °C. The supernatant (0.1 mL) was mixed with 0.1 mL of 0.1 M potassium phosphate buffer containing 5 mM EDTA disodium salt (pH 7.5), 1.68 mM 5,5′-dithiobisnitrobenzoic acid (0.06 mL), glutathione reductase (0.06 mL, 3.33 U/mL), and 0.94 M β-NADPH (0.06 mL). After incubation for 2 min, the absorbance was measured at 412 nm by a spectrophotometer. The GSH content in the liver tissue was determined by a calibration curve prepared with GSH, as a standard [66].

3.13. Determination of TNF-α Level in Plasma

The levels of TNF-α in the plasma was measured using an ELISA kit (Koma Biotech Inc., Seoul, Korea) according to manufacturer’s instructions. Briefly, the plasma (0.1 mL) was added in an ELISA kit and incubated for 2 h. After washing with phosphate saline buffer containing 0.0005% Tween-20 (PBST, 4 times), the plate was added to anti-Rat TNF-α (100 μL), incubated for 4 h, and washed with PBST (4 times). The plate was incubated with the addition of streptavidin-HRP conjugate (100 μL) for 30 min followed by treatment of TMB substrate solution (100 μL) for 10 min. After stopping the reaction with 2 M H2SO4 solution (100 μL), the absorbance of each plate well was measured at 450 nm by ELISA reader (μQuant, Bio-Tek Instruments, Inc., Winooski, VT, USA). The levels of TNF-α in the plasma were quantified from a calibration curve of the standard (47–3000 pg/mL).

3.14. Purification and Isolation of ACE Inhibitor in AS Water Extract

The hot water extracts of the dried AS aerial part (1.6 kg dry wt) were suspended in 3.0 L of H2O and successively partitioned with n-hexane (32 L, three times), CHCl3 (32 L, three times), EtOAc (32 L, three times), and BuOH (32 L, three times). Each layer was evaporated in vacuo at 38 °C. The combined CHCl3 and EtOAc layer (36.4 g) were fractionated on a silica gel column (800 g, 6.0 mm × 30 cm) and eluted with solvent mixtures of CHCl3/MeOH (9:1, 7:3, 5:5, 3:7, 0:10, v/v, each 8 L) to give 11 active fractions (A–K). Fraction C (CHCl3/MeOH = 9:1, v/v, 2.1 g) was refractionated by silica gel column chromatography (60 g, 2.5 × 25 cm) eluting with a series of solvent mixtures of CHCl3/methanol (95:5 and 90:10, v/v, each 600 mL) to give 11 subfractions C1–C11. Subfraction C10 (eluted with CHCl3/MeOH = 90:10, v/v, 61.1 mg) was subjected to semi-preparative ODS-HPLC using an isocratic system of 20% MeCN to yield fraction C10a (tR 5.5 min, 8.7 mg), 1 (tR 8.2 min, 2.3 mg), 2 (tR 10.5 min, 1.1 mg), 3 (tR 12.3 min, 2.5 mg), and four unknown compounds (tR 13.3–18.4 min, 8.3 mg).
Fraction D (CHCl3/MeOH = 7:3, v/v, 2.0 g) was refractionated by silica gel column chromatography (40 g, 3.0 × 18 cm) eluting with a series of solvent mixtures of n-hexane/EtOAc/methanol (4:8:1, 2:10:1, and 0:12:1, v/v, each 400 mL) to obtain 11 subfractions (D1–D11). Subfraction D3 (n-hexane/EtOAc/methanol = 4:8:1, v/v, 352.7 mg) was purified by Sephadex LH-20 column chromatography (1.5 mm × 85 cm) eluting with 100% MeOH to afford 4 [elution volume/total volume (Ve/Vt) = 1.01–1.08, 22.5 mg], 5 (Ve/Vt = 1.09–1.16, 55.1 mg), and 6 (Ve/Vt = 1.17–1.32, 200.6 mg). Subfraction D9 (n-hexane/EtOAc/methanol = 0:12:1, v/v, 9.5 mg) was subjected to semi-preparative ODS-HPLC using an isocratic system of 15% MeCN to isolate 7 (tR 11.5 min, 1.2 mg).

3.15. 4′-O-β-d-Glucopyranoyl (E)-4-hydroxy-3-methylbut-2-enyl benzoate (2)

White amorphous powder. 1H- and 13C-NMR data shown in Table 1; HRESI-MS (positive) m/z 391.1365 [M + Na]+ (calculated for C18H24O8Na, m/z 391.1369, −0.4 mDa).

3.16. Assay for ACE Inhibitory Activity

The ACE inhibitory activities of the fractions and the isolated compounds were measured according to the methods described by Cushman et al. [48], with slight modification. The samples (20 μL) were mixed with 0.1 M sodium borate buffer (pH 8.3, 130 μL) containing 300 mM NaCl and 5 mM HHL (50 μL). The mixture was then preincubated at 37 °C for 10 min. After preincubation, the mixture was added to 100 μL of ACE extract from lung acetone powder of rabbit. The mixture was incubated at 37 °C for 90 min and then the enzymatic reaction was stopped by the addition of 2 N HCl solution (200 μL). The reaction mixture was separated with ethyl acetate (2 mL). The upper layer (ethyl acetate layer, 1.5 mL) was concentrated and the hippuric acid fraction was dissolved with 1 M NaCl solution (1 mL). The absorbance (A) was measured at 228 nm. Q was used as a positive control. The absorbance (B) of Q and the samples was measured by the same procedure as described above except for ACE extract. The ACE inhibitory activities of the samples were determined as the percentage decrease in absorbance compared to that of a control test. The dose-response curve of each compound at the concentration of ≤1 mM was a linear for ACE inhibitory activity. The isolated compounds were assayed at the concentration of 1 mM.
ACE inhibitory activity (%) = [(control − (A − B)/control] × 100

3.17. Statistical Analysis

Data are expressed as mean ± standard deviation (SD) using the SPSS, (IBM, Armonk, NY, USA) 19.0 package program. Statistical differences were measured by one-way analysis of variance followed by Tukey’s multiple test. A p < 0.05 was considered significant.

4. Conclusions

AS attenuated an increment of blood pressure in SHR via the enhancement of VEGF expression and the suppression of RhoA expression by reduced ACE activity and angiotensin II production. However, in this study, we could not see significant synergistic effects of garlic with AS in lowering blood pressure. Possible explanations are as follows: (1) not enough garlic was added to AS; (2) sulfur compounds having antihypertensive activity are volatile and lipophilic. They might not be extracted when garlic and AS were extracted with water in autoclave; (3) garlic may not be synergistic with AS although we do not understand the mechanism. Further studies are required. Reduced ACE activity and angiotensin II content in the plasma of the rats fed AS must have been probably or at least partially due to the ACE inhibitors present in AS. These results led to isolation and identification of ACE inhibitors present in AS for the utilization of this plant as a food and medicinal herb. Seven ACE inhibitors, including one new phenolic glycoside, were isolated and identified from the aerial parts of AS with guided purification of ACE inhibitory assay. Further studies on how much these ACE inhibitors contribute to the antihypertensive effects of AS and how they are absorbed in the body remain to be investigated.

Supplementary Materials

Supplementary materials can be accessed at: https://www.mdpi.com/1420-3049/20/11/19657/s1.

Acknowledgments

This study was carried out with the support of “Cooperative Research Program for Agricultural Science & Technology Development (Project No. PJ009366022013)”, Rural Development Administration, Republic of Korea. LC-ESI-MS and NMR spectral data were obtained from the Korea Basic Science Institute, Ochang and Gwangju.

Author Contributions

J.-Y.C., K.-H.P., and K.-S.H., designed research; J.-Y.C., K.-H.P., D.Y.H, S.C., L.J., and S.-Y.P., performed research; J.Y.C., Y.-K.P., S.-Y.K., H.-R.K, J.-H.M., and K.-S.H., analyzed data; J.-Y.C., K.-H.P., L.J., and K.-S.H., wrote the paper.

Conflicts of Interest

The authors declare no conflict of interests.

References

  1. Drazner, M.H. The progression of hypertensive heart disease. Circulation 2011, 123, 327–334. [Google Scholar] [CrossRef] [PubMed]
  2. Player, M.S.; Peterson, L.E. Anxiety disorders, hypertension, and cardiovascular risk: A review. Int. J. Psychiatry Med. 2011, 41, 365–377. [Google Scholar] [CrossRef] [PubMed]
  3. Boeing, H.; Bechthold, A.; Bub, A.; Ellinger, S.; Haller, D.; Kroke, A.; Leschik-Bonner, E.; Muller, M.; Oberritter, H.; Achulze, M.; et al. Critical review: Vegetables and fruit in the prevention of chronic diseases. Eur. J. Nutr. 2012, 51, 637–663. [Google Scholar] [CrossRef] [PubMed]
  4. Wang, L.; Manson, J.E.; Gaziano, J.M.; Buring, J.E.; Sesso, H.D. Fruit and vegetable intake and the risk of hypertension in middle-aged and older women. Am. J. Hypertens. 2012, 25, 180–189. [Google Scholar] [CrossRef] [PubMed]
  5. McCall, D.O.; McGartland, C.P.; McKinley, M.C.; Patterson, C.C.; Sharpe, P.; McCance, D.R.; Young, I.S.; Woodsice, J.V. Dietary intake of fruits and vegetables improves microvascular function in hypertensive subjects in a dose-dependent manner. Circulation 2009, 119, 2153–2160. [Google Scholar] [CrossRef] [PubMed]
  6. Ksouri, R.; Ksouri, W.M.; Jallali, I.; Debez, A.; Magne, C.; Hiroko, I.; Abdelly, C. Medicinal halophytes: Potent source of health promoting biomolecules with medical, nutraceutical and food applications. Crit. Rev. Biotechnol. 2012, 32, 289–326. [Google Scholar] [CrossRef] [PubMed]
  7. Rhee, M.H.; Park, H.J.; Cho, J.Y. Salicornia herbacea: Botanical, chemical and pharmacological review of halophyte marsh plant. J. Med. Plants Res. 2009, 3, 548–555. [Google Scholar]
  8. Priyashree, S.; Pattanayak, S.P. A review on Cressa cretica Linn.: A halophytic plant. Pharmacogn. Rev. 2010, 4, 161–166. [Google Scholar] [CrossRef] [PubMed]
  9. Oueslati, S.; Ksouri, R.; Falleh, H.; Pichette, A.; Abdelly, C.; Legualt, J. Phenolic content, antioxidant, anti-inflammatory and anticancer activities of the edible halophyte Suaeda fruticosa Forssk. Food Chem. 2012, 132, 943–947. [Google Scholar] [CrossRef]
  10. Joseph, D.; Chakraborty, K.; Subin, C.S.; Vijayan, K.K. Halophytes of Chenopodiaceae and Aizoaceae from south-east coast of India as potential sources of essential nutrients and antioxidants. J. Food Nutr. Res. 2013, 1, 97–107. [Google Scholar]
  11. Yang, C.; Zheng, S.; Huang, H.; Liu, Z.; Zheng, W.; Liu, B.; Shi, D. Comparison of osmatic adjustment and ion balance strategies in nineteen alkali-tolerant halophyte species during adaptation to salt-alkalinized habitats in northeast China. Aust. J. Crop Sci. 2012, 6, 141–148. [Google Scholar]
  12. Kim, J.Y.; Cho, J.Y.; Ma, Y.K.; Park, K.Y.; Lee, S.H.; Ham, K.S.; Lee, H.J.; Park, K.H.; Moon, J.H. Dicaffeoylquinic acid derivatives and flavonoid glucosides from glasswort (Salicornia herbacea L.) and their antioxidative activity. Food Chem. 2011, 125, 55–62. [Google Scholar] [CrossRef]
  13. Glenn, E.P.; Brown, J.J. Salt tolerance and crop potential of halophytes. Crit. Rev. Plant Sci. 1999, 18, 227–255. [Google Scholar] [CrossRef]
  14. Parida, A.K.; Das, A.B. Salt tolerance and salinity effects on plants. Ecotoxicol. Environ. Saf. 2005, 60, 324–349. [Google Scholar] [CrossRef] [PubMed]
  15. Cho, J.Y.; Yang, X.; Lily, J.; Feng, L.; Ham, K.S. Screening on chemical constituent and biological activities of various halophytes. Food Sci. Biotechnol. 2015. to be submitted. [Google Scholar]
  16. Singh, H.P.; Kaur, S.; Mittal, S.; Batish, D.R.; Kohli, R.K. In vitro screening of essential oil from young and mature leaves of Artemisia scoparia compared to its major constituents for free radical scavenging activity. Food Chem. Toxicol. 2010, 48, 1040–1044. [Google Scholar] [CrossRef] [PubMed]
  17. Cha, J.D.; Jeong, M.R.; Jeong, S.I.; Moon, S.E.; Kim, J.Y.; Kil, B.S.; Song, Y.H. Chemical composition and antimicrobial activity of the essential oils of Artemisia scoparia and A. capillaris. Planta Med. 2005, 71, 186–190. [Google Scholar] [CrossRef] [PubMed]
  18. Lee, Y.M.; Hsiao, G.; Chang, J.W.; Sheu, J.R.; Yen, M.H. Scoparone inhibits tissue factor expression in lipopolysaccharide-activated human umbilical vein endothelial cells. Biomed. Sci. 2003, 10, 518–525. [Google Scholar] [CrossRef]
  19. Pan, S.L.; Huang, Y.W.; Guh, J.H.; Chang, Y.L.; Peng, C.Y.; Teng, C.M. Esculetin inhibits ras-mediated cell proliferation and attenuates vascular restenosis following angioplasty in rats. Biochem. Pharmacol. 2003, 65, 1897–1905. [Google Scholar] [CrossRef]
  20. Chen, Y.L.; Huang, H.C.; Weng, Y.I.; Yu, Y.J.; Lee, Y.T. Morphological evidence for the antiatherogenic effect of scoparone in hyperlipidemic diabetic rabbit. Cardiavasc. Res. 1994, 28, 1679–1685. [Google Scholar] [CrossRef]
  21. Wang, Z.Q.; Zhang, X.H.; Yu, Y.; Tipton, R.C.; Raskin, I.; Ribnicky, D.; Johnson, W.; Cefalu, W.T. Artemisia scoparia extract attenuates non-alcoholic fatty liver disease in diet-induced obesity mice by enhancing hepatic insulin and AMPK signaling independently of FGF21 pathway. Metabolism 2013, 62, 1239–1249. [Google Scholar] [CrossRef] [PubMed]
  22. Yahagi, T.; Yakura, N.; Matsuzaki, K.; Kitanaka, S. Inhibitory effect of chemical constituents from Artemisia scoparia Waldst. et Kit. on triglyceride accumulation in 3T3-L1 cells and nitric oxide production in Raw 264.7 cells. J. Nat. Med. 2014, 68, 414–420. [Google Scholar] [CrossRef] [PubMed]
  23. Iciek, M.; Kwiecień, I.; Wlodek, L. Biological properties of garlic and garlic-derived organosulfur compounds. Environ. Mol. Mutagen. 2009, 50, 247–265. [Google Scholar] [CrossRef] [PubMed]
  24. Shouk, R.; Abdou, A.; Shetty, K.; Sarkar, D.; Eid, A.H. Mechanisms underlying the antihypertensive effects of garlic bioactives. Nutr. Res. 2014, 34, 106–115. [Google Scholar] [CrossRef] [PubMed]
  25. Bayan, L.; Koulivand, P.H.; Gorji, A. Garlic: A review of potential therapeutic effects. Avicenna J. Phytomed. 2014, 4, 414–420. [Google Scholar]
  26. Ku, D.D.; Abdel-Razek, T.T.; Dai, J.; Kim-Park, S.; Fallon, M.B.; Abrams, G.A. Garlic and its active metabolite allicin produce endothelium- and nitric oxide-dependent relaxation in rat pulmonary arteries. Clin. Exp. Pharmacol. Physiol. 2002, 29, 84–91. [Google Scholar] [CrossRef] [PubMed]
  27. Benavides, G.; Squadrito, G.; Mills, R.W.; Patel, H.D.; Isbell, T.S.; Patel, R.P.; Doeller, J.E.; Darley-Usmar, V.M.; Kraus, D.W. Hydrogen sulfide mediates the vasoactivity of garlic. Proc. Natl. Acad. Sci. USA 2013, 204, 17977–17982. [Google Scholar] [CrossRef] [PubMed]
  28. Ried, K.; Frank, O.R.; Stocks, N.P.; Sullivan, T. Effect of garlic on blood pressure: A systematic review and meta-analysis. BMC Cardiovasc. Disord. 2008, 8. [Google Scholar] [CrossRef] [PubMed]
  29. Dornas, W.A.; Silva, M.E. Animal models for the study of arterial hypertension. J. Biosci. 2011, 36, 731–737. [Google Scholar] [CrossRef] [PubMed]
  30. Ryu, W.S.; Kim, S.W.; Kim, C.J. Overview of the renin-angiotensin system. Korean Circ. J. 2007, 37, 91–96. [Google Scholar] [CrossRef]
  31. Sridevi, P.; Prashanth, K.S.; Bhagavan Raju, M. Angiotensin converting enzyme: A target for anti-hypertensive drugs. Int. J. Res. Pharm. Biomed. Sci. 2011, 2, 63–72. [Google Scholar]
  32. Kim, S.; Iwao, H. Molecular and cellular mechanisms of angiotensin II-mediated cardiovascular and renal diseases. Pharmacol. Rev. 2011, 52, 12–30. [Google Scholar]
  33. Benigni, A.; Cassis, P.; Remuzzi, G. Angiotensin II revisited: New roles in inflammation, immunology and aging. EMBO Mol. Med. 2010, 2, 247–257. [Google Scholar] [CrossRef] [PubMed]
  34. Hermann, M.; Flammer, A.; Lüuscher, T.F. Nitric oxide in hypertension. J. Clin. Hypertens. 2006, 8 (Suppl. 4), 17–29. [Google Scholar] [CrossRef]
  35. Facemire, C.S.; Nixon, A.B.; Griffiths, R.; Hurwits, H.; Coffman, T.M. Vascular endothelial growth factor receptor 2 controls blood pressure by regulating nitric oxide synthase expression. Hypertension 2009, 54, 652–658. [Google Scholar] [CrossRef] [PubMed]
  36. Francis, S.H.; Busch, J.L.; Corbin, J.D. cGMP-dependent protein kinases and cGMP phosphodiesterases in nitric oxide and cGMP action. Pharmacol. Rev. 2010, 62, 525–563. [Google Scholar] [CrossRef] [PubMed]
  37. Duong-Quy, S.; Bei, Y.; Liu, Z.; Dinh-Xuan, A.T. Role of Rho-kinase and its inhibitors in pulmonary hypertension. Pharmacol. Ther. 2013, 137, 352–364. [Google Scholar] [CrossRef] [PubMed]
  38. Pupilli, C.; Lasagni, L.; Romagnai, P.; Bellini, F.; Mannelli, M.; Misciglia, N.; Mavila, C.; Vellei, U.; Villari, D.; Serio, M. Angiotensin II stimulates the synthesis and secretion of vascular permeability factor/vascular endothelial growth factor in human mesangial cells. J. Am. Soc. Nephrol. 1999, 10, 245–255. [Google Scholar] [PubMed]
  39. Bregeon, J.; Loirand, G.; Pacaud, P.; Rolli-Derkinderen, M. Angiotensin II induces RhoA activation through SHP2-dependent dephosphorylation of the RhoGAP p190A in vascular smooth muscle cells. Am. J. Physiol. Cell Physiol. 2009, 297, C1062–C1070. [Google Scholar] [CrossRef] [PubMed]
  40. Knox, A.J.; Corbertt, L.; Stocks, J.; Holiand, E.; Zhu, Y.M.; Pang, L. Human airway smooth muscle cells secrete vascular endothelial growth factor: Up-regulation by bradykinin via a protein kinase C and prostanoid-dependent mechanism. FASEB J. 2001, 15, 2480–2488. [Google Scholar] [CrossRef] [PubMed]
  41. Schäfer, S.C.; Pellegrin, M.; Wyss, C.; Abert, J.F.; Nussberger, J.; Hayoz, D.; Lehr, H.A; Mazzolai, L. Intravital microscopy reveals endothelial dysfunction in resistance arterioles in angiotensin II-induced hypertension. Hypertens. Res. 2012, 35, 855–861. [Google Scholar] [CrossRef] [PubMed]
  42. Touyz, R.M. Reactive oxygen species, vascular oxidative stress, and redox signaling in hypertension: What is the clinical significance? Hypertension 2004, 44, 248–252. [Google Scholar] [CrossRef] [PubMed]
  43. Adibhatla, R.M.; Hatcher, J.F. Lipid oxidation and peroxidation in CNS health and disease: From molecular mechanisms to therapeutic opportunities. Antioxid. Redox Signal. 2010, 12, 125–169. [Google Scholar] [CrossRef] [PubMed]
  44. Traverso, N.; Menini, S.; Maineri, E.P.; Patriarca, S.; Odetti, P.; Cottalasso, D.; Marinari, U.M.; Pronzato, M.A. Malondialdehyde, a lipoperoxidation-derived aldehyde, can bring about secondary oxidative damage to proteins. J. Gerontol. A Biol. Sci. Med. Sci. 2004, 59, 890–895. [Google Scholar] [CrossRef]
  45. Vaziri, N.D. Causal link between oxidative stress, inflammation, and hypertension. Iran J. Kidney Dis. 2008, 2, 1–10. [Google Scholar] [PubMed]
  46. Ide, N.; Lau, B.H. Garlic compounds minimize intracellular oxidative stress and inhibit nuclear factor-κB activation. J. Nutr. 2001, 131, 1020S–1026S. [Google Scholar] [PubMed]
  47. Fu, M.; Zhou, J.; Sun, A.; Zhang, S.; Zhang, C.; Zou, Y.; Fu, M.; Ge, J. Efficacy of ACE inhibitors in chronic heart failure with preserved ejection fraction—A meta analysis of 7 prospective clinical studies. Int. J. Cardiol. 2012, 155, 33–38. [Google Scholar] [CrossRef] [PubMed]
  48. Zuanetti, G.; Latini, R.; Maggioni, P.; Franzosi, M.; Santoro, L.; Tognoni, G. Effect of the ACE inhibitor lisinopril on mortality in diabetic patients with acute myocardial infraction. Circulation 1997, 96, 4239–4245. [Google Scholar] [CrossRef] [PubMed]
  49. Amann, B.; Tinzmann, R.; Angelkort, B. ACE inhibitors improve diabetic nephropathy through suppression of renal MCP-1. Diabetes Care 2003, 26, 2421–2425. [Google Scholar] [CrossRef] [PubMed]
  50. Sala, A.; Recio, M.C.; Giner, R.M.M.; Máñez, S.; Ríos, J.L. New acetophenone glucosides isolated from extracts of Helichrysum italicum with antiinflammatory activity. J. Nat. Prod. 2001, 64, 1360–1362. [Google Scholar] [CrossRef] [PubMed]
  51. Banday, J.A.; Mir, F.A.; Farooq, S.; Qurishi, M.A.; Koul, S.; Razdan, T.K. Salicylic acid and methyl gallate from the roots of Conyza canedensis. Int. J. Chem. Anal. Sci. 2012, 3, 1305–1308. [Google Scholar]
  52. Chung, J.H.; Shin, H.C.; Cho, J.Y.; Kang, S.K.; Lee, H.J.; Shin, S.C.; Park, K.H.; Moon, J.H. Isolation and structural determination of free radical scavenging compounds from Korean fermented red pepper past (kochujang). Food Sci. Biotechnol. 2009, 18, 463–470. [Google Scholar]
  53. Wang, X.Y.; Xu, M.; Yang, C.R.; Zhang, Y.J. Phenylpropanoid glycosides from the seeds of Michelia hedyosperma. Food Chem. 2011, 126, 1039–1043. [Google Scholar] [CrossRef]
  54. Simaratanamongkol, A.; Umehara, K.; Noguchi, H.; Panichayupakaranant, P. Identification of a new angiotensin-converting enzyme (ACE) inhibitor from Thai edible plants. Food Chem. 2014, 165, 92–97. [Google Scholar] [CrossRef] [PubMed]
  55. Guerrero, L.; Castillo, J.; Quiñones, M.; Garcia-Vallvé, S.; Arola, L.; Pujadas, G.; Muguerza, B. Inhibition of angiotensin-converting enzyme activity by flavonoids: Structure-activity relationship studies. PLoS ONE 2012, 7, e49493. [Google Scholar] [CrossRef] [PubMed]
  56. Balasuriya, B.W.N.; Rupasinghe, H.P.V. Plant flavonoids as angiotensin converting enzyme inhibitors in regulation of hypertension. Funct. Foods Health Dis. 2011, 5, 172–188. [Google Scholar]
  57. Actis-Goretta, L.; Ottaviani, J.I.; Fraga, C.G. Inhibition of angiotensin converting enzyme activity by flavonol-rich foods. J. Agric. Food Chem. 2006, 11, 229–234. [Google Scholar] [CrossRef] [PubMed]
  58. Kakkar, S.; Bais, S. A review on protocatechuic acid and its pharmacological potential. ISRN Pharmacol. 2014. [Google Scholar] [CrossRef] [PubMed]
  59. Seifried, H.E.; Anderson, D.E.; Fisher, E.I.; Milner, J.A. A review of the interaction among dietary antioxidants and reactive oxygen species. J. Nutr. Biochem. 2007, 11, 567–579. [Google Scholar] [CrossRef] [PubMed]
  60. Gonzáleza, R.; Ballesterc, I.; López-Posadasa, R.; Suárezb, M.D.; Martínez-Augustinb, O.; Zarzuelob, A.; Sánchez de Medinaa, F. Effects of flavonoids and other polyphenols on inflammation. Crit. Rev. Food Sci. Nutr. 2011, 51, 331–362. [Google Scholar] [CrossRef] [PubMed]
  61. Cushman, D.W.; Cheung, H.S. Spectrophotometric assay and properties of the angiotensin-converting enzyme of rabbit lung. Biochem. Pharmacol. 1971, 20, 1637–1648. [Google Scholar] [CrossRef]
  62. Moshage, H.; Kok, B.; Huizenga, J.R.; Jansen, P.L.M. Nitrite and Nitrate determinations in plasma: A critical evaluation. Chin. Chem. 1995, 41, 892–896. [Google Scholar]
  63. Bradford, M.M. A rapid and sensitive method for the quantitation of microgram quantities of protein utilizing the principle of protein-dye binding. Anal. Biochem. 1976, 72, 248–254. [Google Scholar] [CrossRef]
  64. Ledwozyw, A.; Michalak, J.; Stepian, A.; Kadziolka, A. The relationship between plasma TG, cholesterol, total lipid peroxidation product during human atherosclerosis. Clin. Chim. Acta 1986, 155, 272–284. [Google Scholar]
  65. Reznick, A.Z.; Packer, L. Oxidative damage to proteins: Spectrophotometric method for carbonyl assay. Meth. Enzymol. 1994, 233, 357–363. [Google Scholar] [PubMed]
  66. Rahman, I.; Kode, A.; Biswas, S.K. Assay for quantitative determination of glutathione and glutathione disulfide levels using enzymatic recycling method. Nat. Protoc. 2006, 1, 3159–3165. [Google Scholar] [CrossRef] [PubMed]
  • Sample Availability: Samples of the compounds are available from the authors.

