2.1. Isolation of Compounds
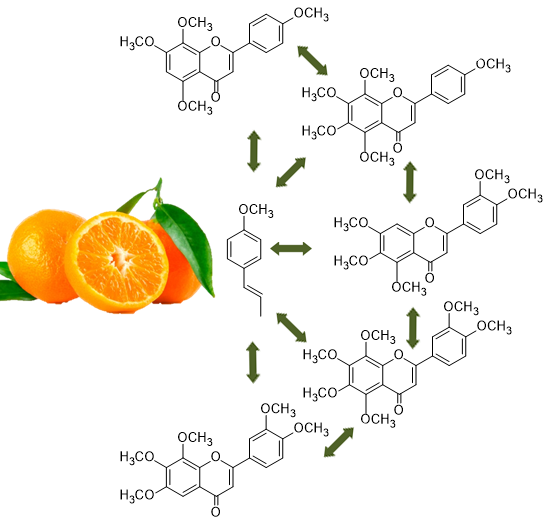
The raw material was the residue from the production of citrus juice from Citrus sinensis, variety Valencia Late, supplied by the Company Lara (Laranjo Do Algarbe-LDA, Silves, Portugal), which is located in Southern Portugal. The fruit was obtained during the 2003 and 2004 campaigns. The techniques used to obtain the extracts from citrus waste were steam distillation and maceration in dichloromethane and acetone on a semi-industrial scale at the EVESA S.A. installations (La Línea de la Concepción, Cádiz, Spain). Raw samples were defatted with hexane prior to maceration in dichloromethane and acetone. The extracts were subsequently fractionated by column chromatography on silica gel using as eluent hexane/ethyl acetate (0%–100%) and 100% acetone in increasing polarity. The resulting fractions were concentrated, with cooling in an ice bath in the case of the essential oils extract. The essential oils extract (10 g) provided four fractions: A (volatile compounds, 8.9 g), B (611 mg), C (340 mg) and D (54 mg). The dichloromethane extract (15 g) provided nine fractions: A′ (1 g), B′ (4.3 g), C′ (697 mg), D′ (462 mg), E′ (507 mg), F′ (805 mg), G′ (1.4 g), H′ (1.3 g) and I′ (1.2 g). The acetone extract (5 g) provided five fractions: A′′ (1.7 g), B′′ (2.1 g), C′′ (93 mg), D′′ (620 mg) and E′′ (448 mg).
Figure 1.
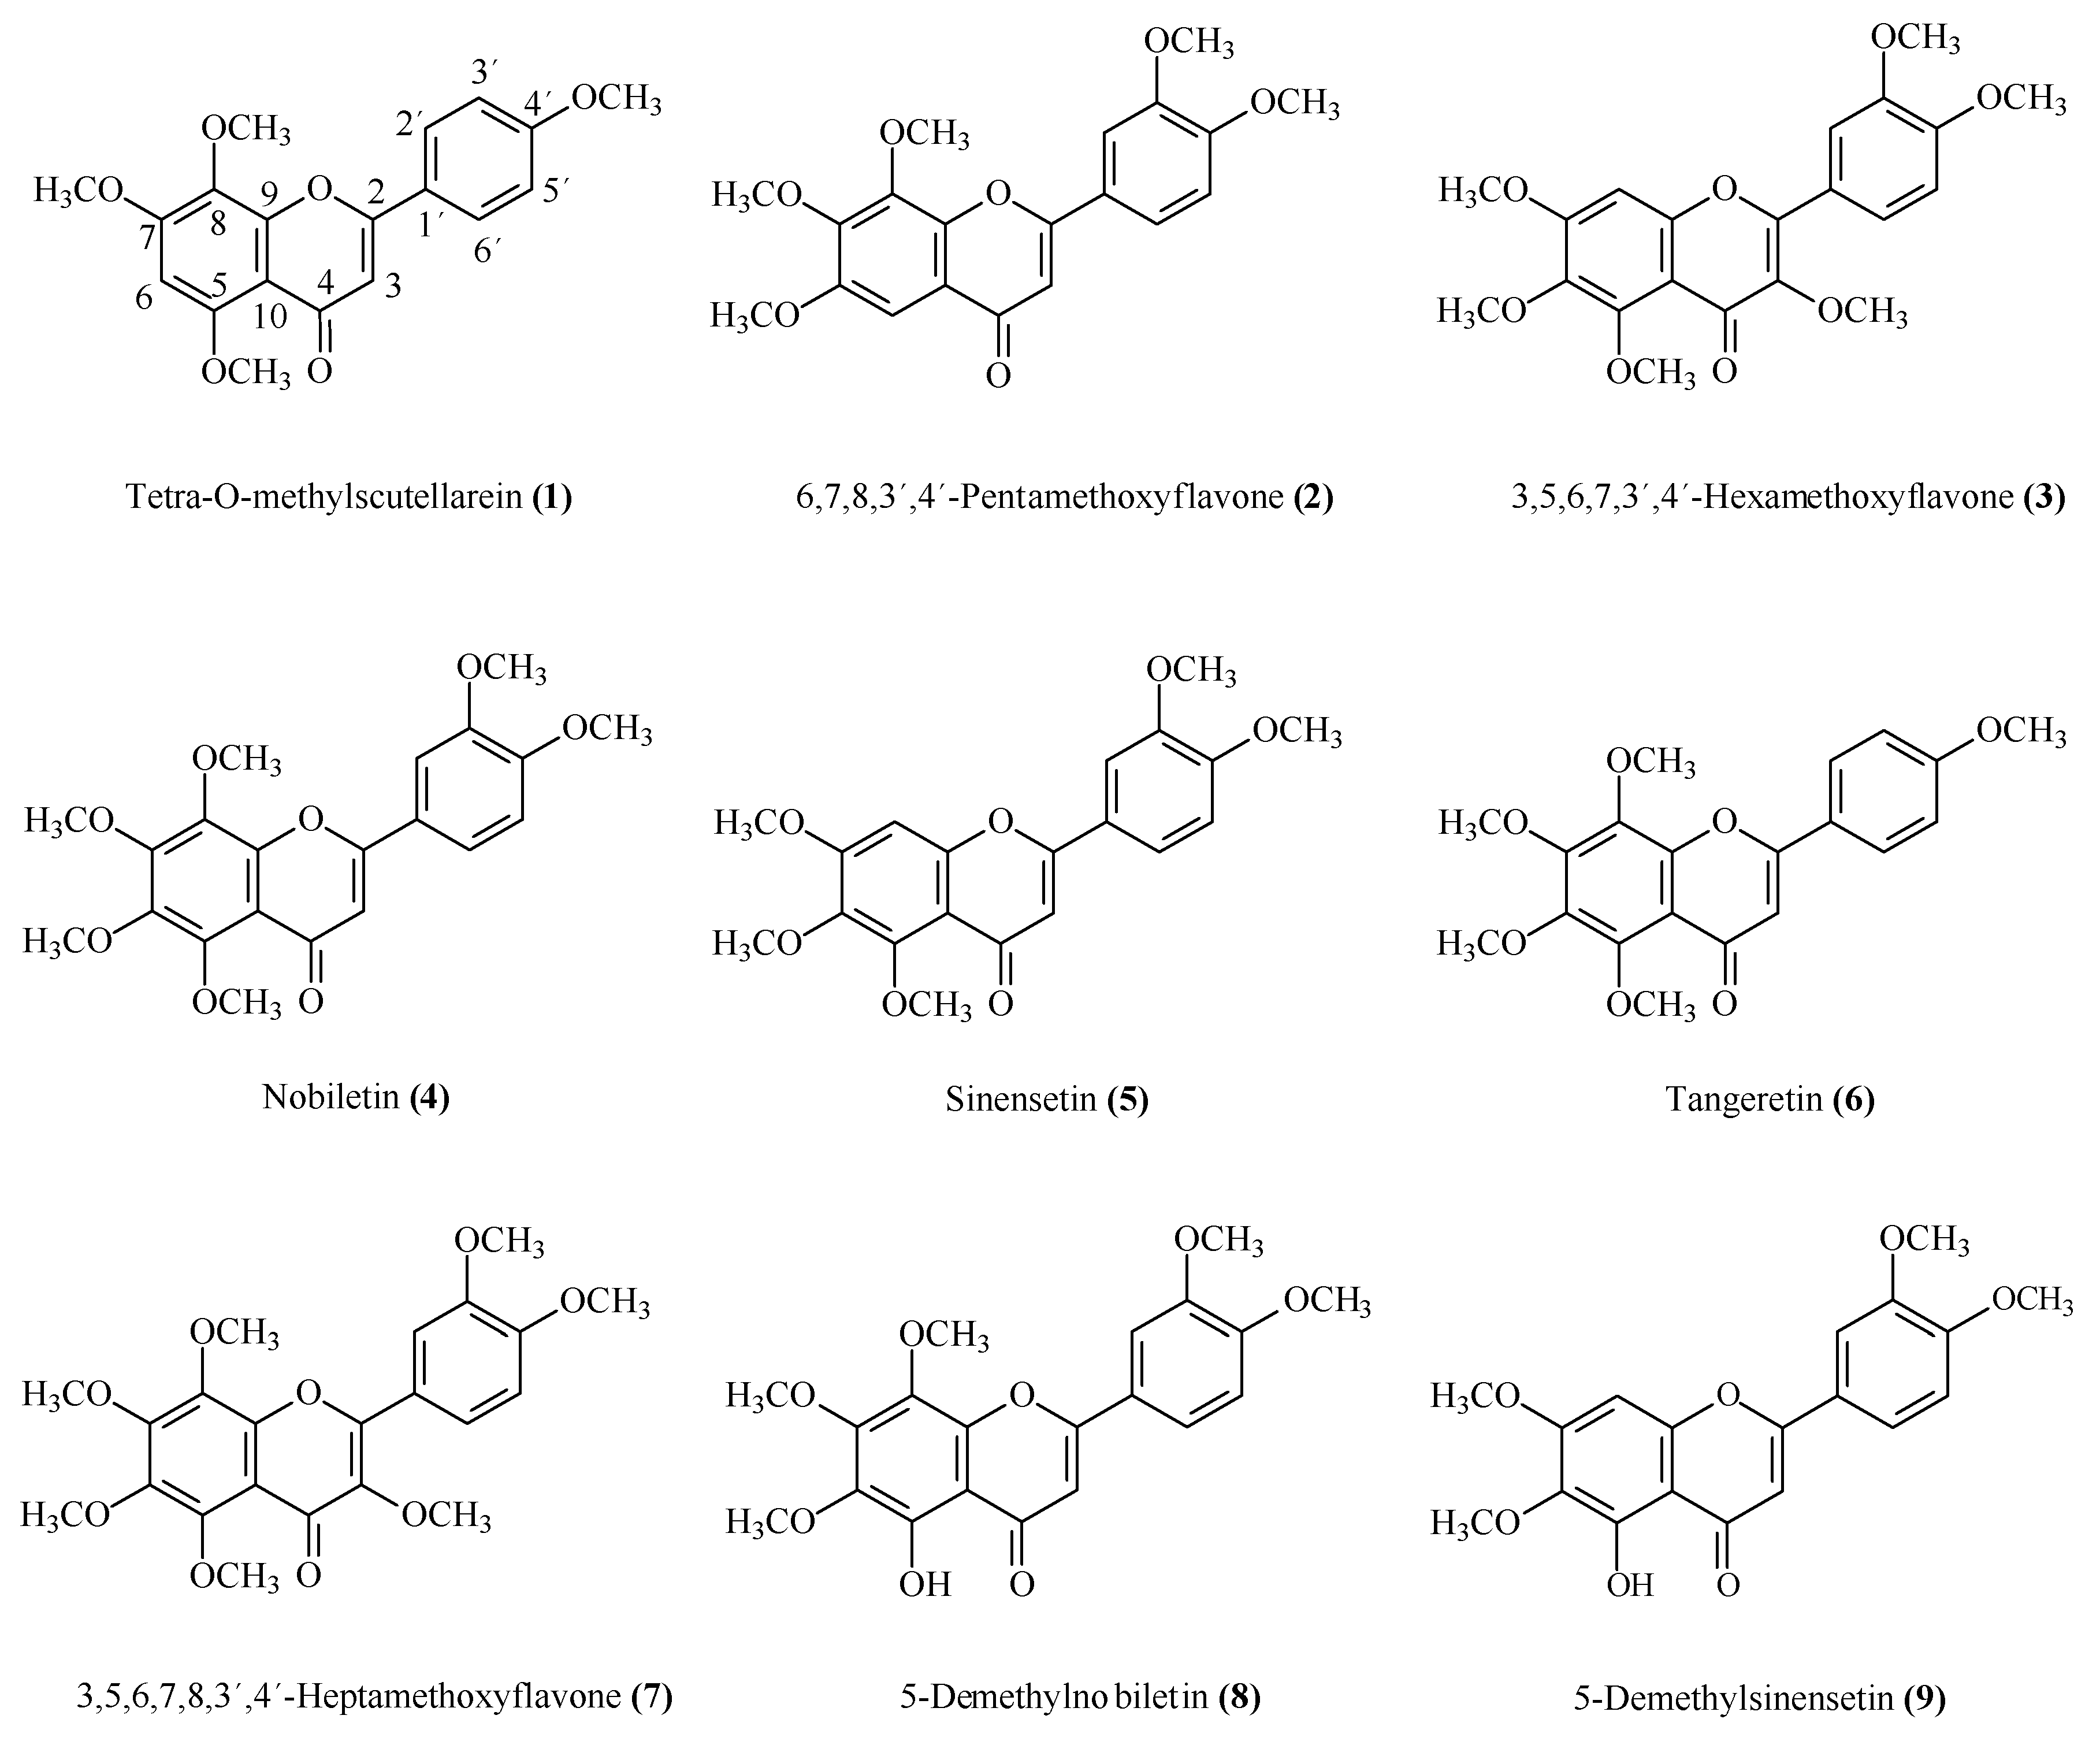
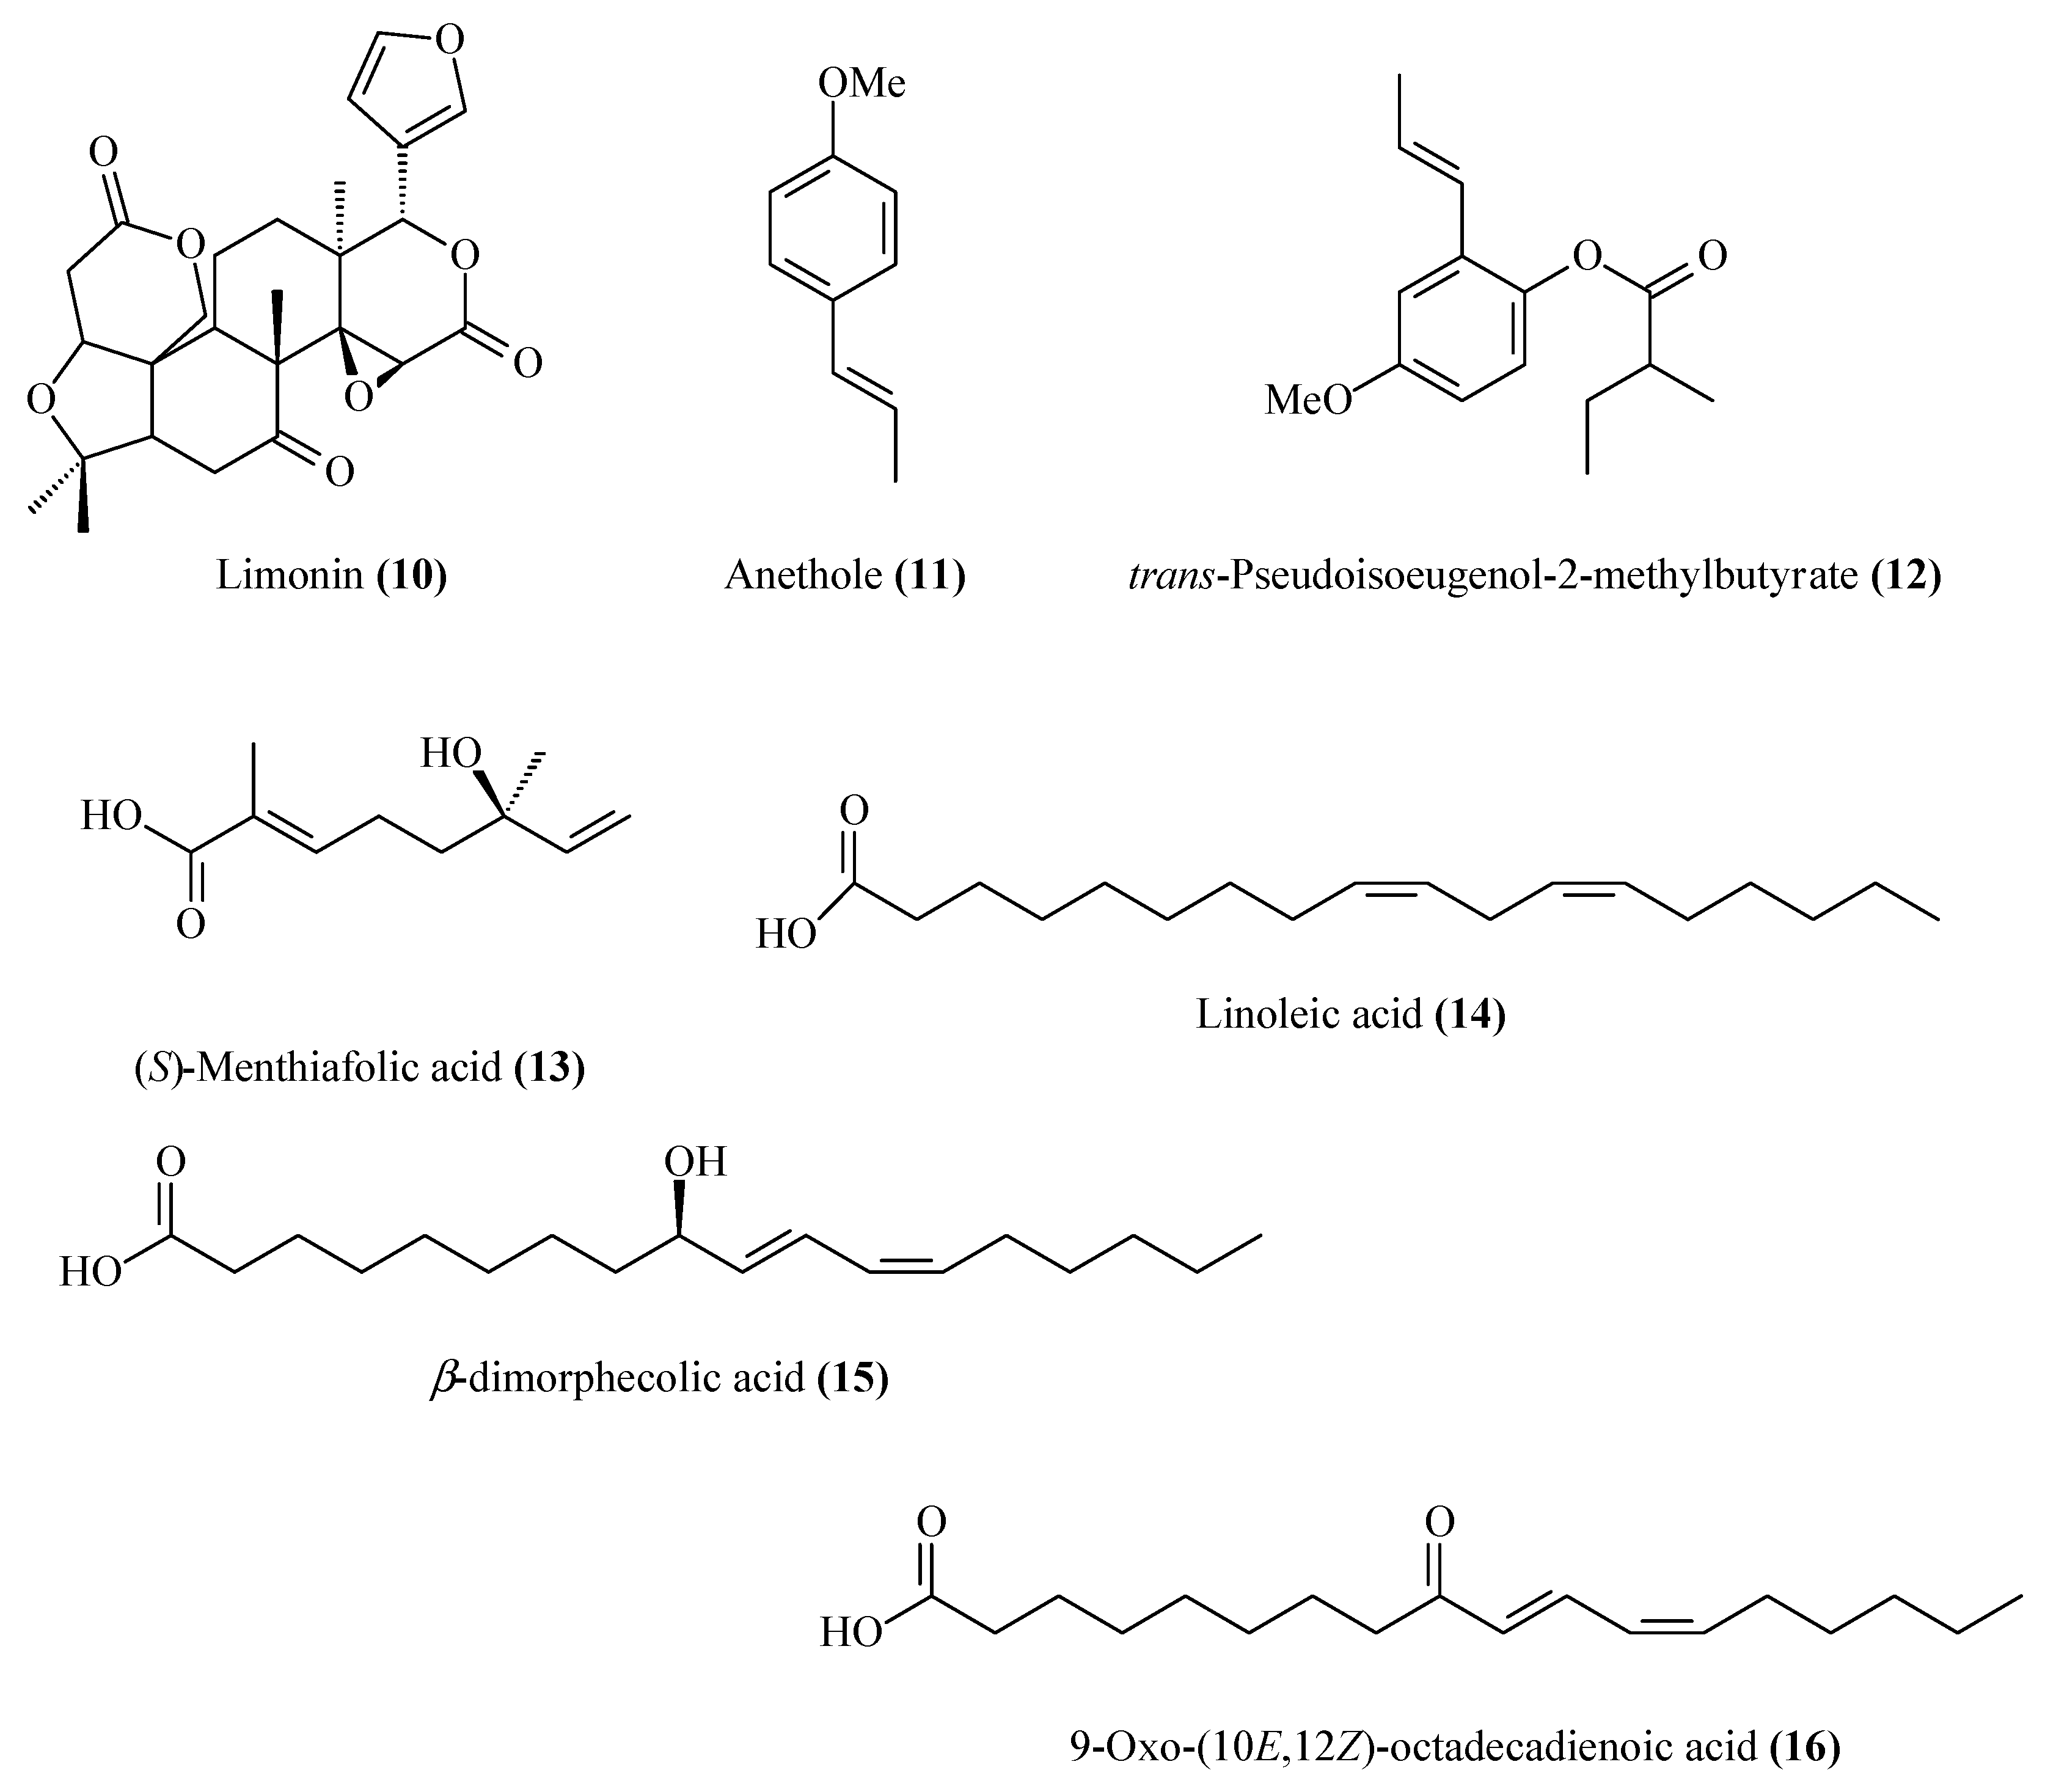
Structures of the flavonoids 1–9 isolated from citrus waste of Citrus sinensis.
Figure 1.
Structures of the flavonoids 1–9 isolated from citrus waste of Citrus sinensis.
A total of 16 compounds were isolated from the most active fractions (
Figure 1 and
Figure 2) in successive purifications by HPLC with different eluent mixtures (hexane/acetone; hexane/EtOAc). These compounds were identified from their spectroscopic data (
1H-NMR,
13C-NMR, IR, and MS) by comparison with the data reported in the literature for tetra-
O-methylscutellarein (
1) [
38], 6,7,8,3′,4′-pentamethoxyflavone (
2) [
39], 3,5,6,7,3′,4′-hexamethoxyflavone (
3) [
38], nobiletin (
4) [
39], sinensetin (
5) [
39], tangeretin (
6) [
39], 3,5,6,7,8,3′,4′-heptamethoxyflavone (
7) [
39], 5-demethylnobiletin (
8) [
39], 5-demethylsinensetin (
9) [
40], limonin (
10) [
41], anethole (
11) [
42],
trans-pseudoisoeugenol-2-methylbutyrate (
12) [
43], (
S)-menthiafolic acid (
13) [
44], linoleic acid (
14) [
45], β-dimorphecolic acid (
15) [
46] and 9-oxo-(10
E,12
Z)-octadeca-10,12-dienoic acid (
16) [
47] (
Figure 1 and
Figure 2).
Figure 2.
Structures of limonoid 10, phenylpropanoids 11 and 12, and acids 13–16 isolated from the citrus waste of Citrus sinensis.
Figure 2.
Structures of limonoid 10, phenylpropanoids 11 and 12, and acids 13–16 isolated from the citrus waste of Citrus sinensis.
Several of the isolated compounds
1–
16 have been described previously from citrus fruit. The flavonoids
1,
2,
3,
4,
5,
6,
7 and
8 have been identified in peel, leaves and stems of
Citrus spp. [
38,
39] and [
48,
49]; the limonoid
10 was identified in the seeds of
Citrus spp. [
50,
51]; the phenylpropanoid
11 is present in the leaves of mandarin and bergamot [
52] and the fatty acid
14 in citrus fruit [
53].
The remaining compounds are reported for the first time from citrus fruit although they have been identified previously in others plants. The flavonoid
9 was found in the aerial parts of
Cetaurea napifolia L. [
40], the phenylpropanoid
12 in the genus
Pimpinella [
54,
55], the monoterpene acid
13 in the fruit of
Euterpe oleracea [
56], and fatty acids derivatives
15 in
Dimorphotecha aurantiaca [
57] and
16 in
Pisum sativum [
58].
2.2. Coleoptile Bioassay Results from Extracts, Fractions and Isolated Compounds
The essential oils, dichloromethane and acetone extracts were subjected to a bioassay-guided isolation using the etiolated wheat coleoptile bioassay to obtain active fractions and for the isolation of the main bioactive compounds from the citrus waste of Citrus sinensis. The bioassays were carried out at concentrations of 1.0, 0.5, 0.25, 0.125 and 0.075 mg·mL−1 for extracts and fractions, and at 1.0, 0.3, 0.1, 0.03 and 0.01 mM for pure compounds.
The etiolated wheat coleoptile bioassay was used as an initial approach to evaluate the bioactivity of the extracts, fractions and pure compounds The wheat coleoptile bioassay is a rapid test (24 h) that is sensitive to a wide range of bioactive substances, including plant growth regulators, herbicides, antimicrobials, mycotoxins and assorted pharmaceuticals [
35,
36,
37]. The results of these bioassays are represented in
Figure 3,
Figure 4,
Figure 5 and
Figure 6, where negative values signify inhibition, positive values denote activation and zero represents the control.
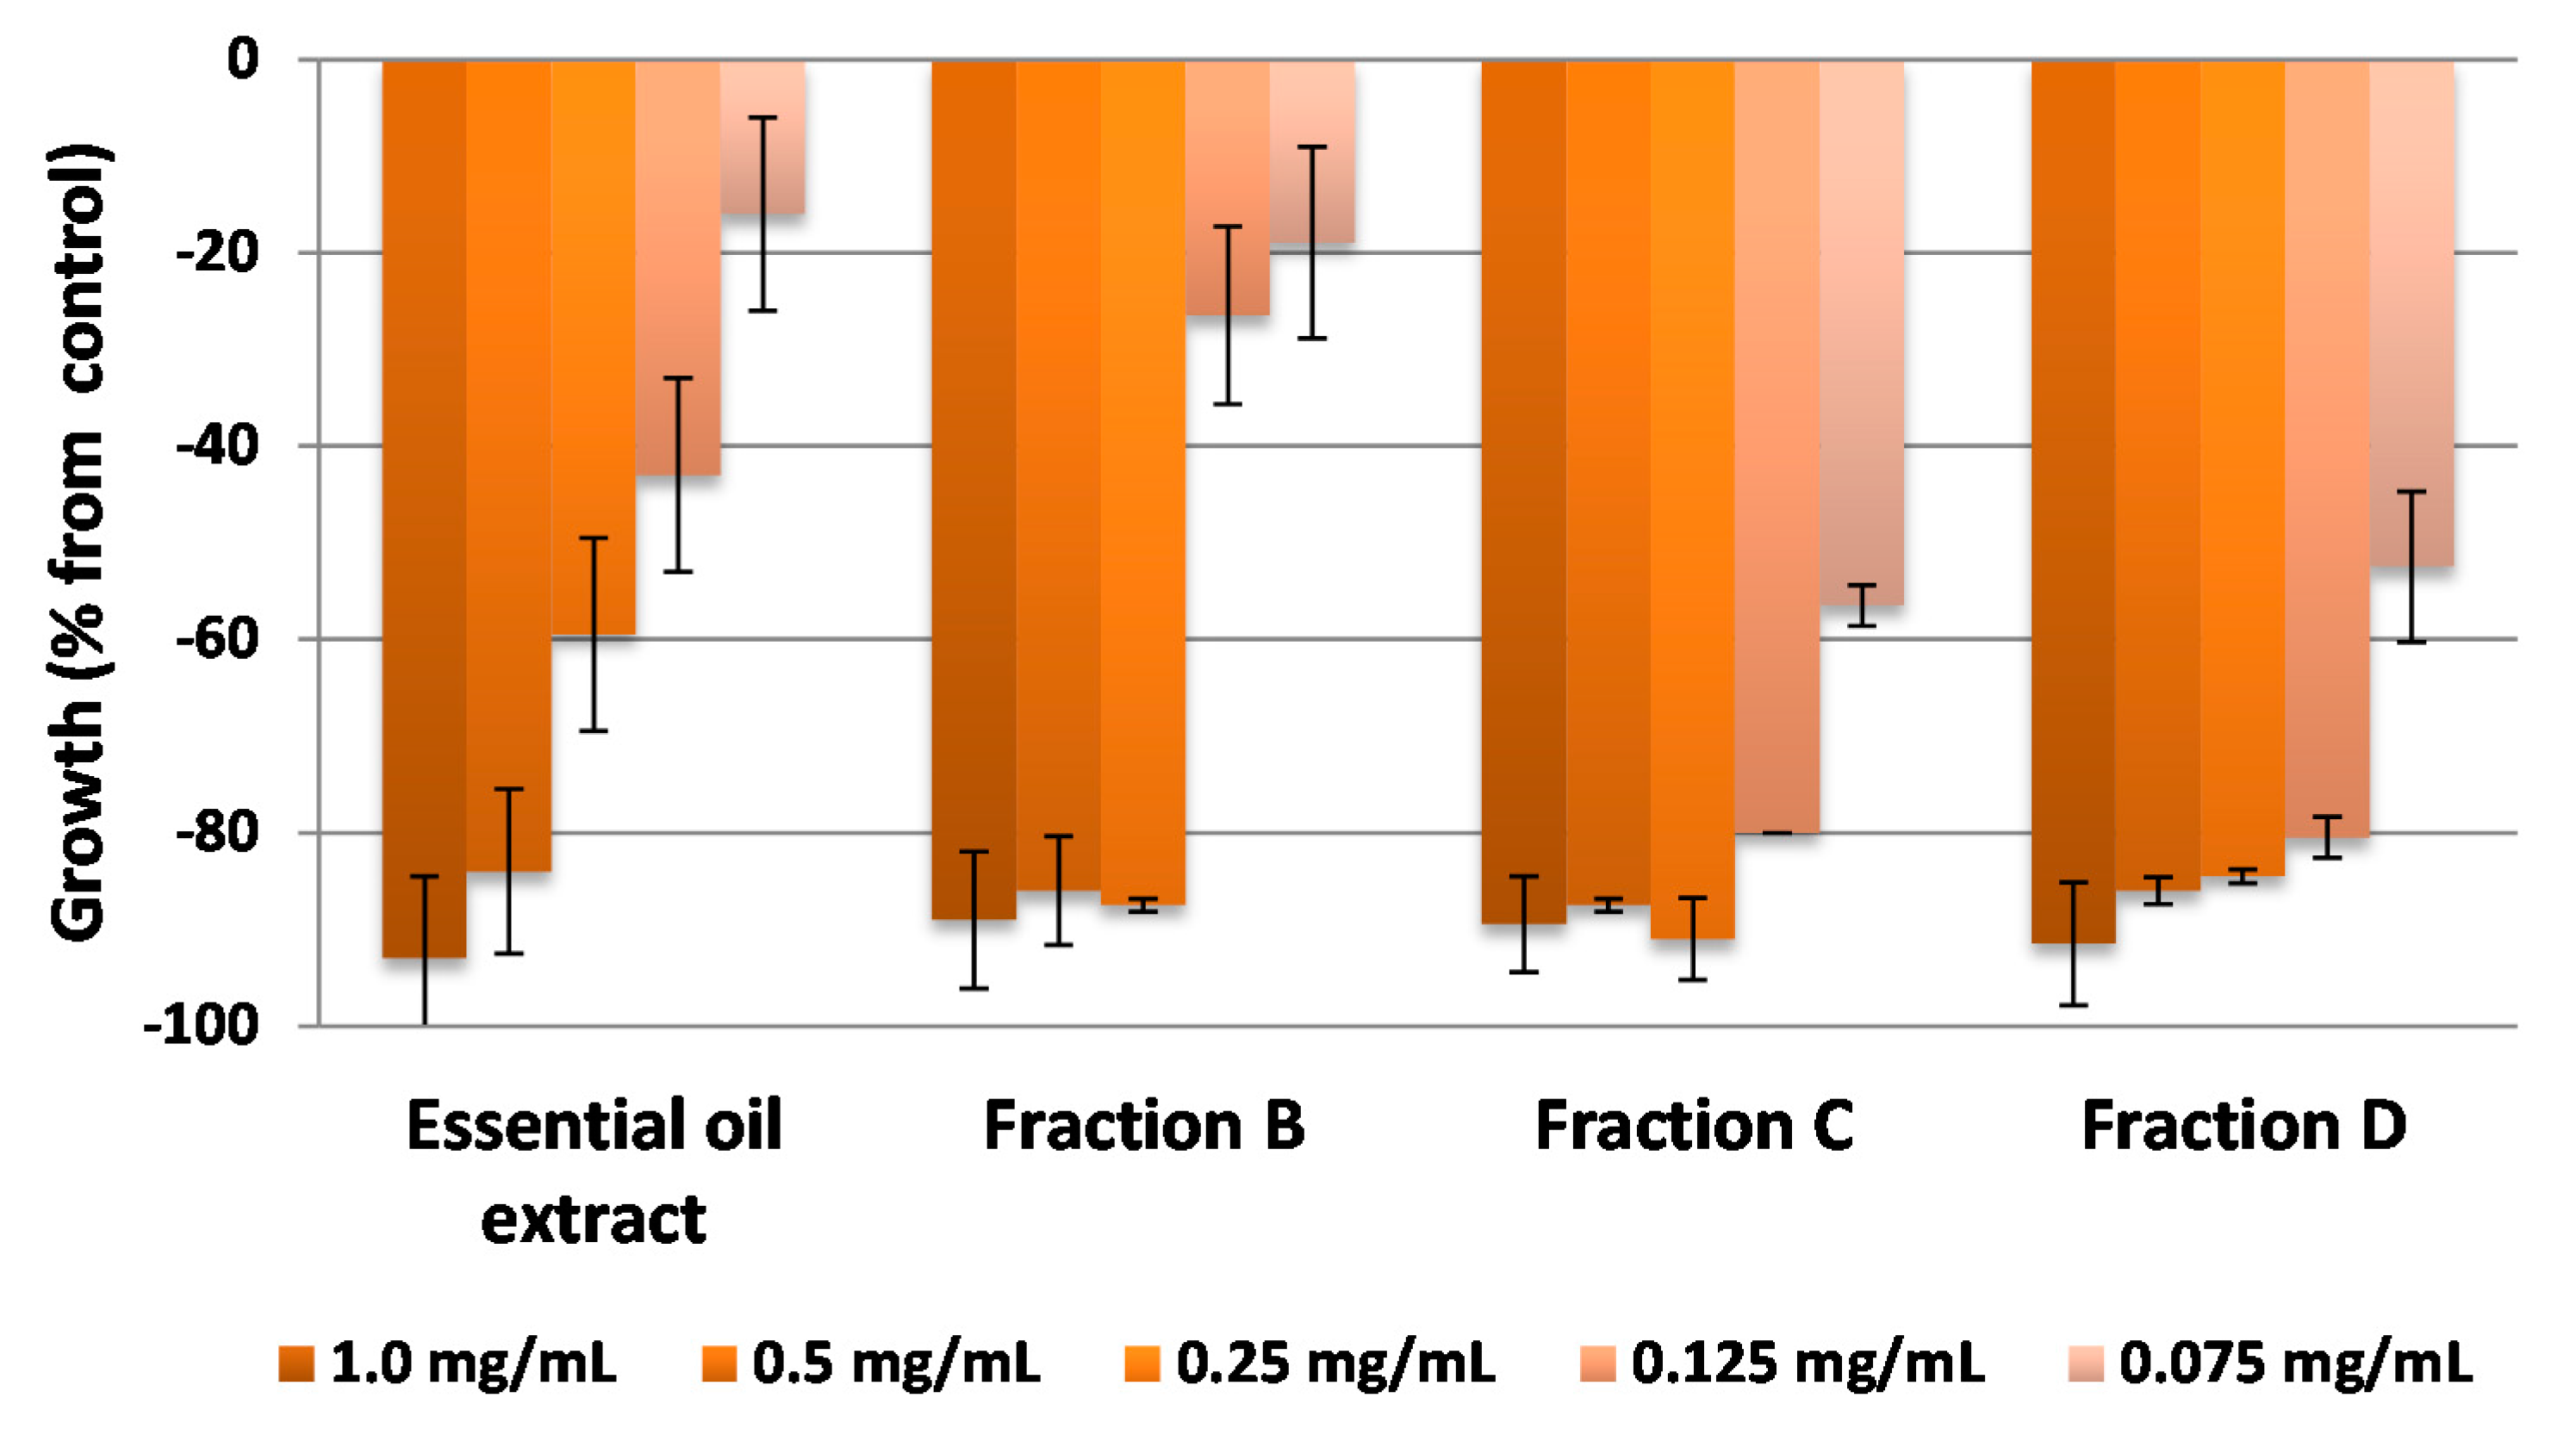
The essential oils extract showed the highest inhibition, with a value of 93.0% obtained at 1.0 mg·mL
−1, and its activity profile decreased uniformly with dilution to give a reasonably high value (60% inhibition) at 0.25 mg·mL
−1 (
Figure 3). Fractions B, C and D generally showed better inhibition activity profiles than the initial extract as the activity was retained upon dilution. The three fractions exceeded 80% inhibition at the first three dilutions (1.0, 0.5, 0.25 mg·mL
−1) and for fractions C and D this activity was even maintained at the fourth dilution (0.125 mg·mL
−1).
Figure 3.
Bioactivities obtained in the etiolated wheat coleoptile bioassay for the essential oils extract and the fractions obtained by chromatography from citrus waste from Citrus sinensis. Values are expressed as percentage difference from control.
Figure 3.
Bioactivities obtained in the etiolated wheat coleoptile bioassay for the essential oils extract and the fractions obtained by chromatography from citrus waste from Citrus sinensis. Values are expressed as percentage difference from control.
Purification of fractions B and C gave two major phenylpropanoids 11 (from B, 179.2 mg) and 12 (from C, 98 mg). Purification of fraction D gave the following polymethoxyflavones: 1 (13.9 mg), 3 (1.9 mg), 4 (18 mg), 5 (5.4 mg), 6 (9.5 mg) and 7 (1.8 mg).
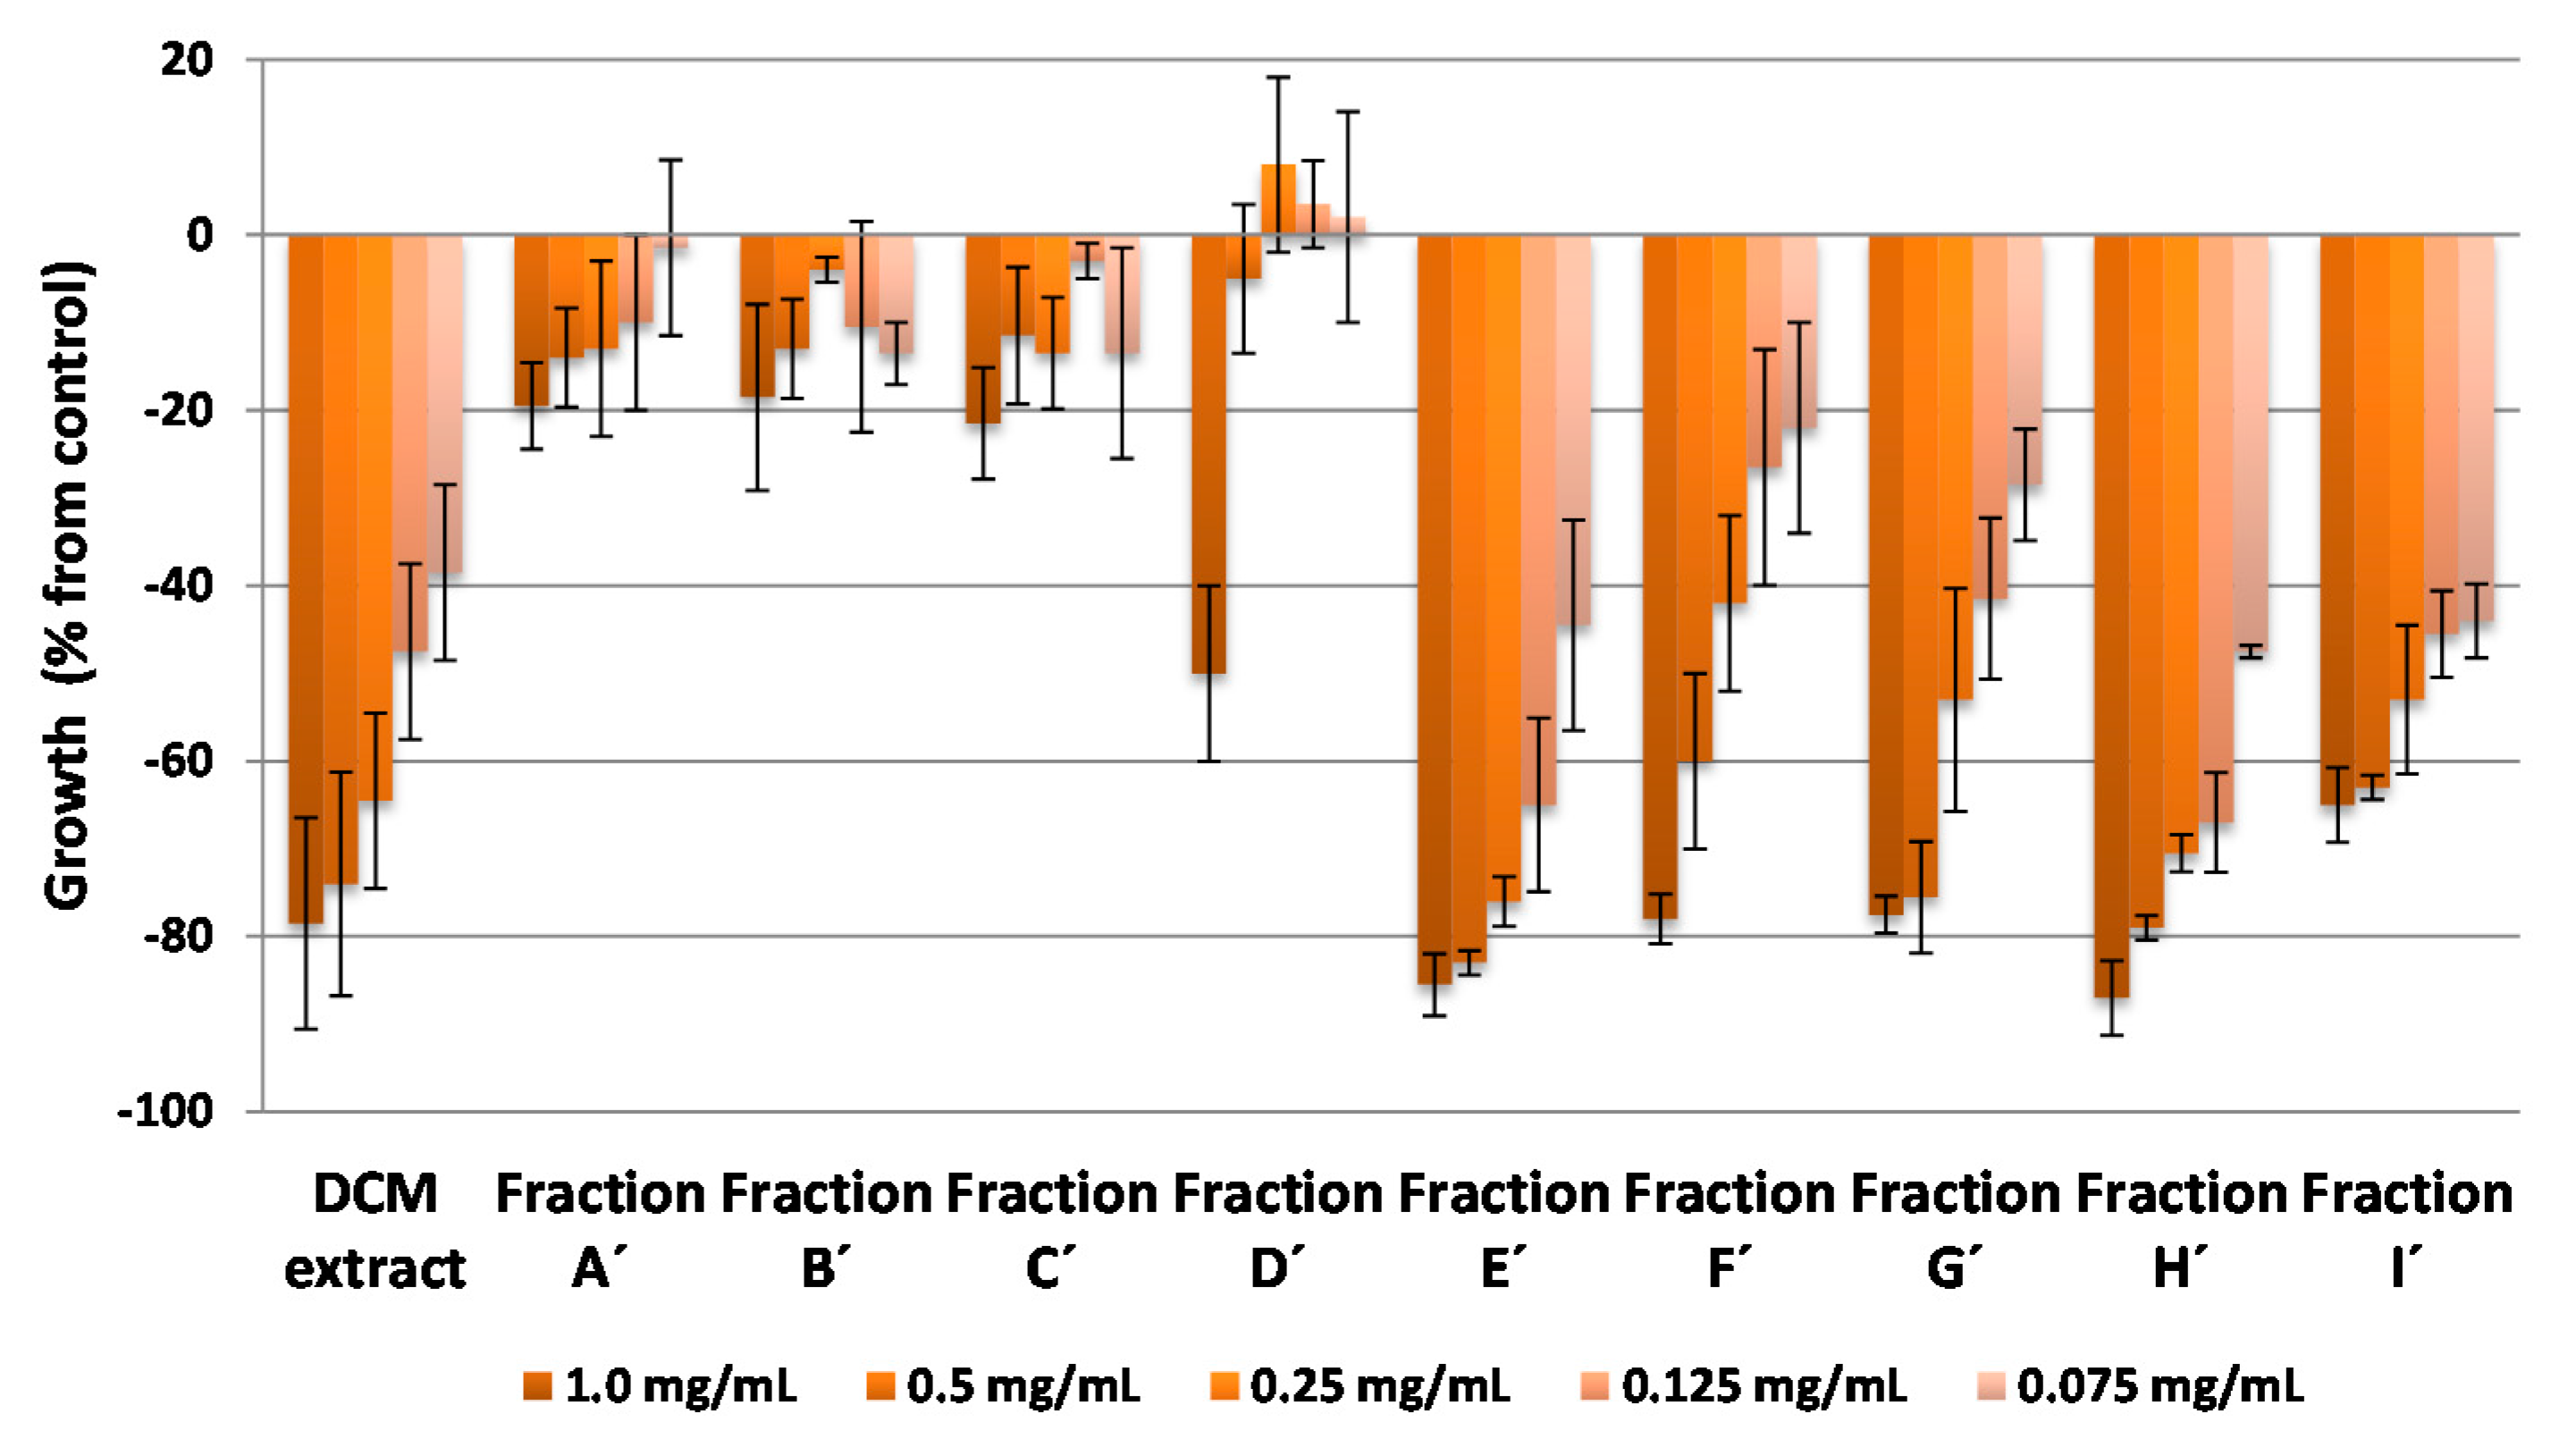
The activity profiles of the dichloromethane (DCM) extract and the fractions obtained from it (A′–I′) are shown in
Figure 4. The DCM extract showed a high inhibitory activity, close to 80% at 1.0 mg·mL
−1, and a good activity profile with dilution—even better than that of the essential oils extract. A value close to 40% inhibition was obtained at 0.075 mg·mL
−1. The activity of this extract is reflected in the activities shown by fractions E′, F′, G′, H′ and I′ (the inhibition values for fractions E′ to H′ at 1.0 mg·mL
−1 were around 80%). Fractions E′ and Hʹ showed higher activity levels,
i.e., above 80% inhibition at the highest concentration (1.0 mg·mL
−1), and this high activity was retained at lower concentrations (around 60% for the fourth dilution, 0.125 mg·mL
−1).
The purified compounds from the most active fractions (E′–I′) and their distributions are shown in
Table 1. It is noteworthy that one of the most active fractions (E′) contains only three major compounds,
i.e., polymethoxyflavone
8 and fatty acids
15 and
16, while the next most active fraction (H′) contains appreciable amounts of seven polymethoxyflavones (
1,
3,
4,
5,
6,
7,
9) and limonin (
10).
Figure 4.
Bioactivities obtained in the etiolated wheat coleoptile bioassay for the dichloromethane extract and the fractions obtained by chromatography of the citrus waste from Citrus sinensis. Values are expressed as percentage difference from control.
Figure 4.
Bioactivities obtained in the etiolated wheat coleoptile bioassay for the dichloromethane extract and the fractions obtained by chromatography of the citrus waste from Citrus sinensis. Values are expressed as percentage difference from control.
Table 1.
Amounts of compounds isolated from the most active fractions of the dichloromethane extract.
Table 1.
Amounts of compounds isolated from the most active fractions of the dichloromethane extract.
| Fraction | Compounds (mg) |
|---|
| 1 | 2 | 3 | 4 | 5 | 6 | 7 | 8 | 9 | 10 | 13 | 15 | 16 |
|---|
| E′ | - | - | - | - | - | - | - | 2.0 | - | - | - | 12.4 | 9.2 |
| F′ | - | - | - | - | - | 7.9 | 9.6 | - | 2.8 | 14.1 | 4.8 | - | - |
| G′ | 56.1 | - | 10.8 | 49.2 | - | 33.1 | 12.3 | 1.4 | 6.4 | 43 | - | - | - |
| H′ | 43.6 | - | 31.8 | 309.9 | 111.6 | 3.6 | 10.5 | - | 4.9 | 2.4 | - | - | - |
| I′ | 3.1 | 80.3 | 5.1 | 22.7 | 33.4 | 1.0 | 1.4 | 1.2 | 1.4 | - | - | - | - |
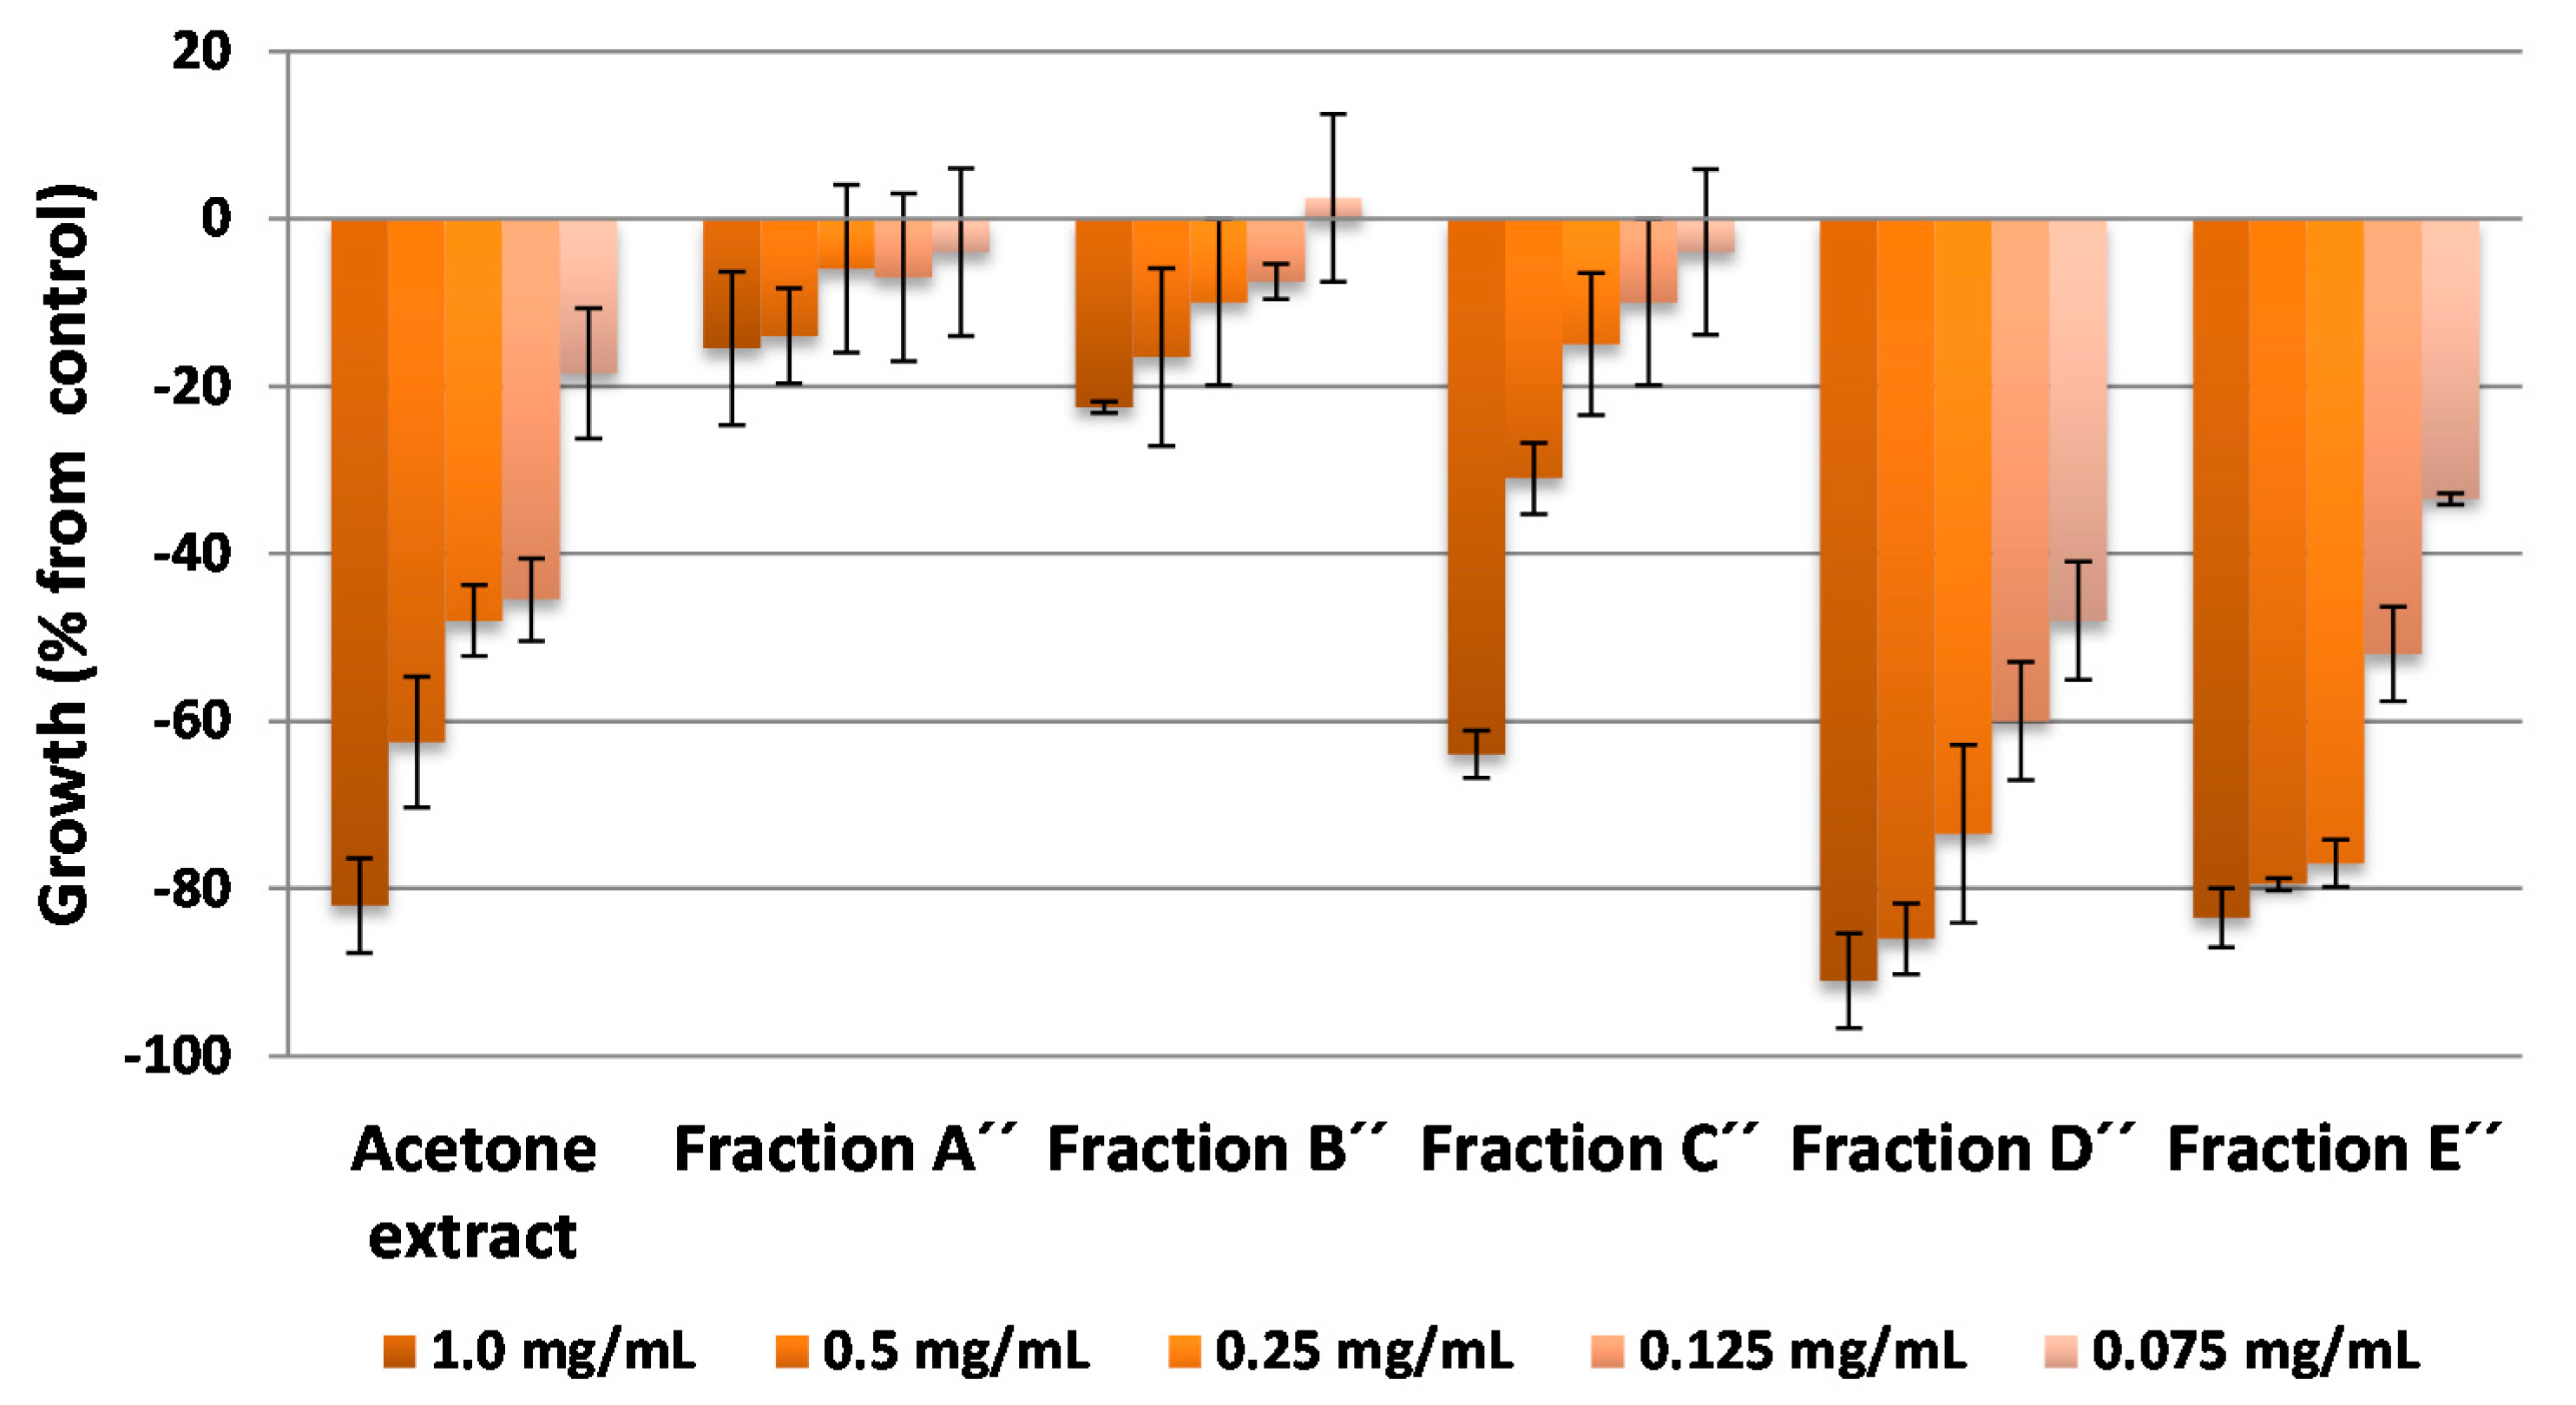
The acetone extract showed a high inhibitory activity on coleoptile elongation at 1.0 mg·mL
−1 (>80%) but, in comparison to the activity profile of the DCM extract, the activity of the acetone extract decreased more markedly with dilution (
Figure 5). However, the active fractions (D′′ and E′′) showed better activity profiles than the initial extract. For example, the inhibition levels for these fractions at 1.0, 0.5 and 0.25 mg·mL
−1 were 91.0, 86.0 and 73.5%, respectively, for fraction D′′ and 83.5%, 79.5% and 77.0%, respectively, for fraction E′′.
Figure 5.
Bioactivities obtained in the etiolated wheat coleoptile bioassay for the acetone extract and the fractions obtained by chromatography from citrus waste of Citrus sinensis. Values are expressed as percentage difference from control.
Figure 5.
Bioactivities obtained in the etiolated wheat coleoptile bioassay for the acetone extract and the fractions obtained by chromatography from citrus waste of Citrus sinensis. Values are expressed as percentage difference from control.
The amounts of purified compounds obtained from the most active fractions D′′ and E′′ are shown in
Table 2. In this case there is little variability in the compositions of the products in the two fractions and the only difference concerns the relative amounts in each fraction, with the prevalence of polymethoxyflavones
1–
9.
Table 2.
Amounts of compounds isolated from the most active fractions of the acetone extract.
Table 2.
Amounts of compounds isolated from the most active fractions of the acetone extract.
| Fraction | Compound (mg) |
|---|
| 1 | 3 | 4 | 5 | 6 | 7 | 8 | 9 | 14 |
|---|
| D′′ | 1.9 | - | 2.4 | - | 1.6 | 11.8 | 1.8 | 1.9 | 5.0 |
| E′′ | 6.8 | 3.9 | 70.1 | 16.6 | 2.6 | 3.6 | - | - | - |
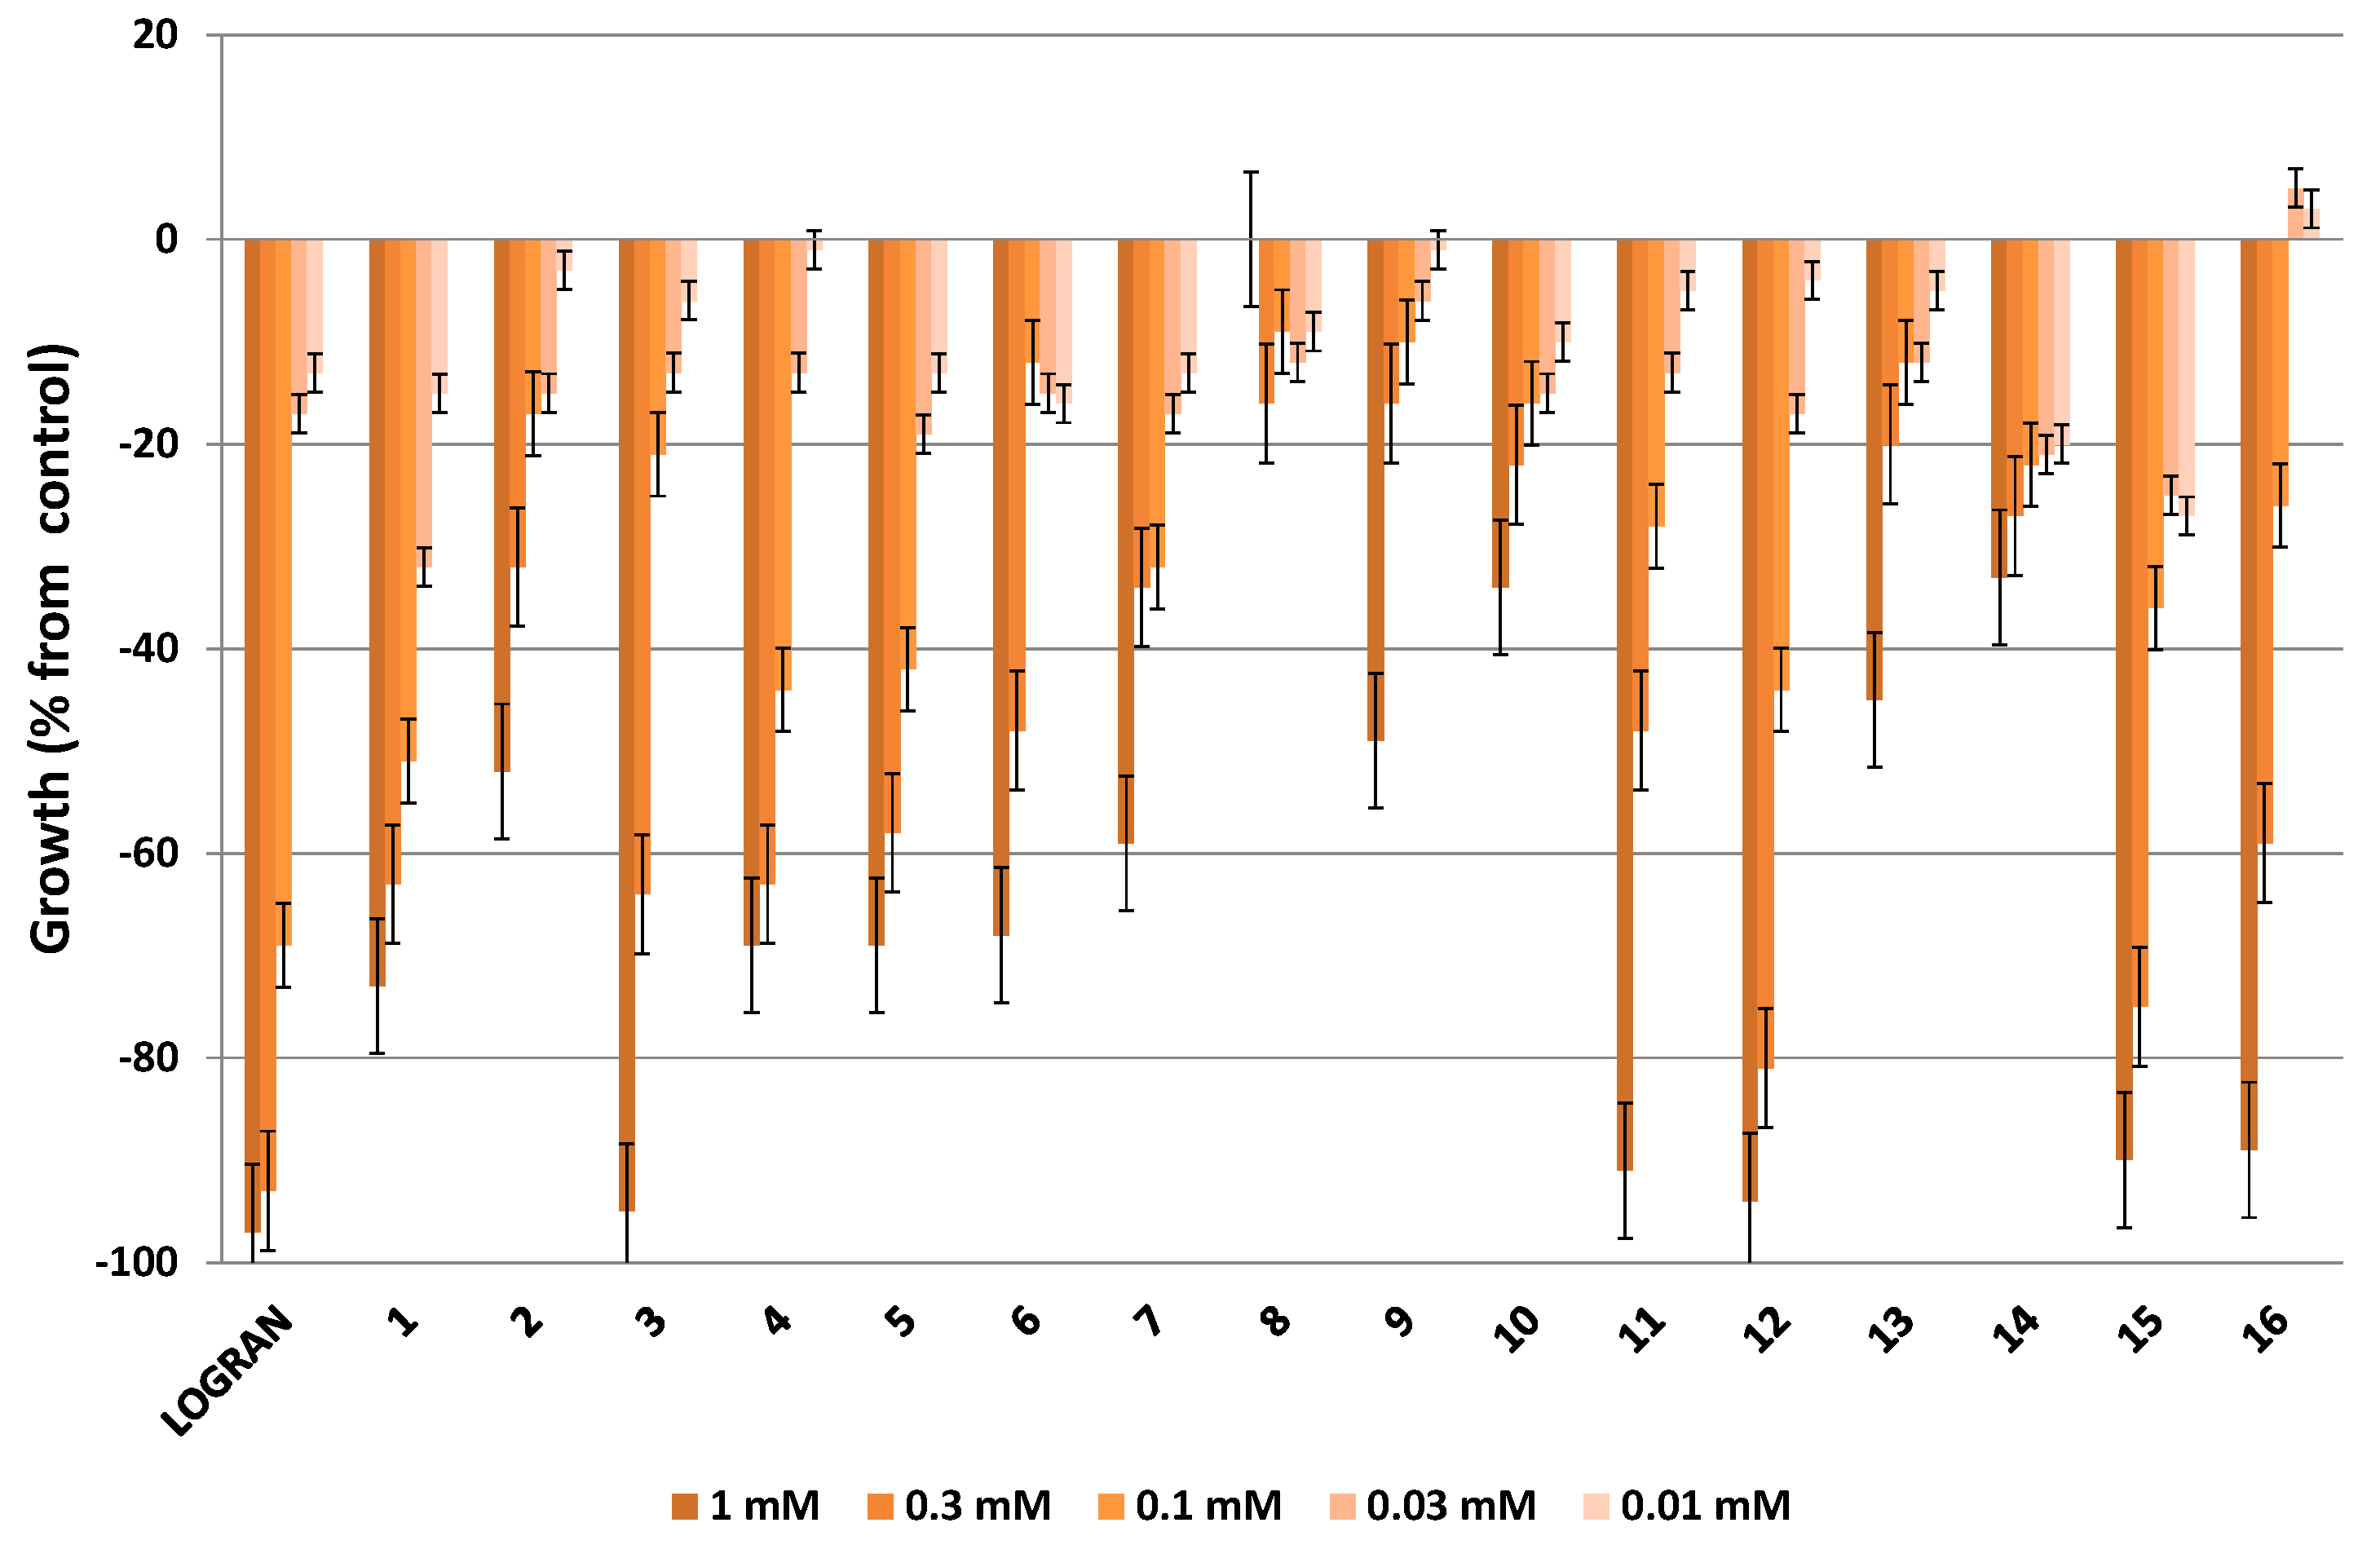
The effects of compounds
1–
16, which were isolated from the bioactive fractions of the different extracts of
Citrus sinensis, on the elongation of etiolated wheat coleoptiles at dilutions in the range 1.0 to 0.01 mM are represented in
Figure 6. The commercial herbicide Logran was used as an internal reference [
59]. All of the compounds showed inhibitory activity and more than half of them gave activity results that are of interest.
Figure 6.
Effect of compounds 1–16 from the bioactive fractions of the different extracts of Citrus sinensis on the elongation of etiolated wheat coleoptiles. Values are expressed as percentage difference from control.
Figure 6.
Effect of compounds 1–16 from the bioactive fractions of the different extracts of Citrus sinensis on the elongation of etiolated wheat coleoptiles. Values are expressed as percentage difference from control.
Of all the isolated compounds, polymethoxyflavone
3, two phenylpropanoids (
11 and
12) and two fatty acids (
15 and
16) showed the highest inhibitory activity on coleoptile elongation, with almost 90% activity at 1 mM. However, this activity decreased significantly with dilution for all of these compounds with the exception of compound
12, which was even active at the second concentration tested (at 0.3 mM with 81.0%). The activity values for these compounds at 1 mM were similar to that of the commercial herbicide Logran. The phenylpropanoids
11 and
12 have proven to have diverse biological activities, such as antioxidant, bactericidal, fungicidal and anti-inflammatory activities [
60,
61]. The hydroxydienoic (
15) and cetodienoic (
16) acids are the most common by-products of lipid peroxidation derivatives from linoleic acid. These acids play an important role in biological systems and have been isolated from both plants and animals. Several studies have been carried out on the biological activities of compounds
15 and
16, including the study of quimiotax, hyperproliferative effects, regulation of phospholipase activity, regulation of cell adhesion, and their incorporation into phospholipids and thus their involvement in the biological regulation membranes [
62].
Five polymethoxyflavones (
1,
4,
5,
6 and
7) can be placed in a second group that showed around 60% inhibitions or higher at the same concentration. In the introduction it was stated that polymethoxyflavones are the major constituents of citrus peel and these compounds have attracted considerable attention because of the wide spectrum of their biological activities, which include anticancer, anti-inflammatory, antioxidant, antimutagenic and antimicrobial activities [
5,
6,
7,
8,
9,
10,
11,
12,
13,
14,
15,
16,
17,
18,
19,
20].
The most active compounds isolated from citrus wastes belong to different chemical classes and these were mainly six polymethoxyflavones (compounds 1, 3–7), two phenylpropanoids 11, 12 and two fatty acids 15, 16. It is clear that the inhibitory activity exhibited by these isolated compounds compared to that shown by the fractions and extracts from which they were obtained is not a simple phenomenon to explain. In some cases it can be assumed that a major single compound, such as phenylpropanoids 11 and 12 (179.2 mg and 98 mg from fractions B and C, respectively) from the essential oil extract, is responsible for the observed behavior, so it is also possible that a small number of such compounds could exert the effect. The activity of compounds found in the citrus waste fractions makes it conceivable that they are involved in some types of interaction. Activity caused by synergistic or additive interactions is usually not comparable to the activity of a single active compound, unless such a compound already participates in the combination. The specific structural factors that determine the activity of a particular combination of compounds remains unclear. The same holds true for the combined effect because the nature of such an effect cannot be predicted on the basis of an individual compound acting in isolation. In some cases, a non-inhibitory concentration of a specific compound inhibits growth when this compound acts additively or synergistically with other compounds that are present and such joint action is the most common situation. One of the aims of the study presented here was to clarify these interaction effects by carrying out etiolated wheat coleoptile bioassays on binary mixtures of compounds and fractions.
2.3. DPPH Radical Scavenging Assay with Extracts, Fractions and Compounds
Antioxidant compounds in samples react with the DPPH radical, which is a nitrogen-centered radical, and convert it to 1,1-diphenyl-2-picryl hydrazine at a very rapid rate due to its hydrogen-donating ability. The 2,2-diphenyl-1-picrylhydrazyl radical (DPPH·) is a commercially available stable organic nitrogen radical that has a deep-purple color. The radical scavenging activity (RSA) assay measures the reducing capacity of antioxidants towards DPPH·. Upon reduction, the color of the DPPH· solution fades and this color change is conveniently monitored spectrophotometrically at 517 nm. When a solution of DPPH is mixed with a substance that can donate a hydrogen atom, the reduced form of the radical is generated and this change is accompanied by loss of color. The antioxidant activity index (AAI) allows the antioxidant capacity of extracts and pure compounds to be compared regardless of the concentration of DPPH· and the solvent used by setting ranges of values that can classify the antioxidant activity of the sample.
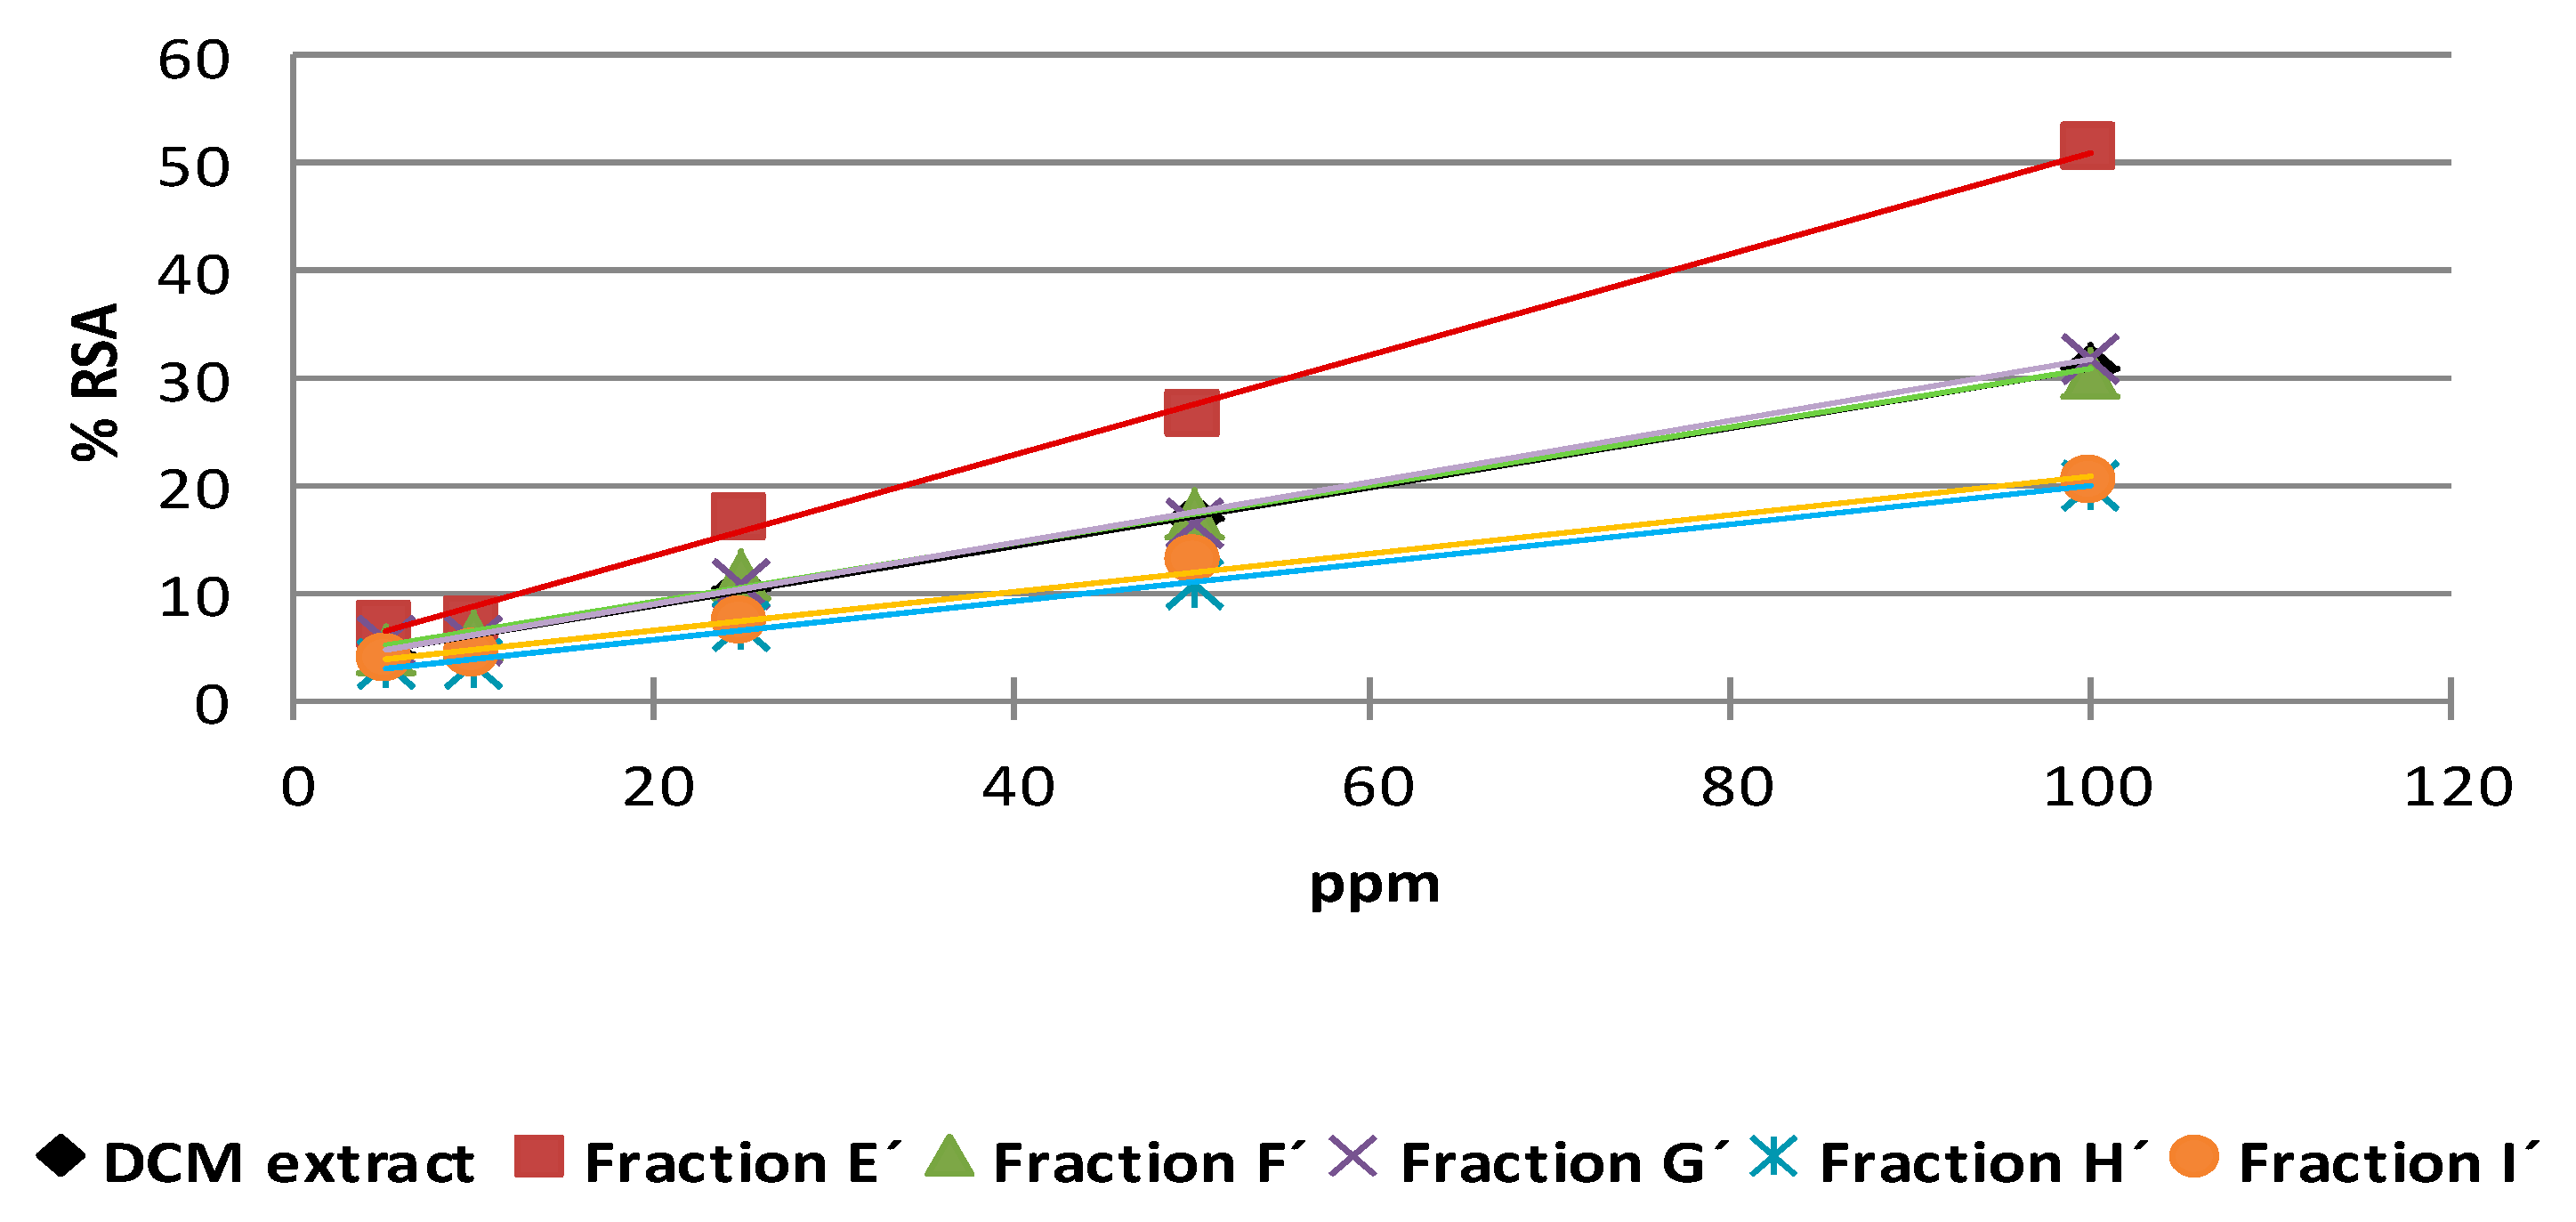
The DPPH radical scavenging potentials of different concentrations of acetone and dichloromethane extracts and the different bioactive fractions obtained from them are depicted in
Figure 7 and
Figure 8. The samples showed a dose-dependent activity on DPPH radical scavenging. The antioxidant activity of a sample is attributed to its hydrogen-donating ability.
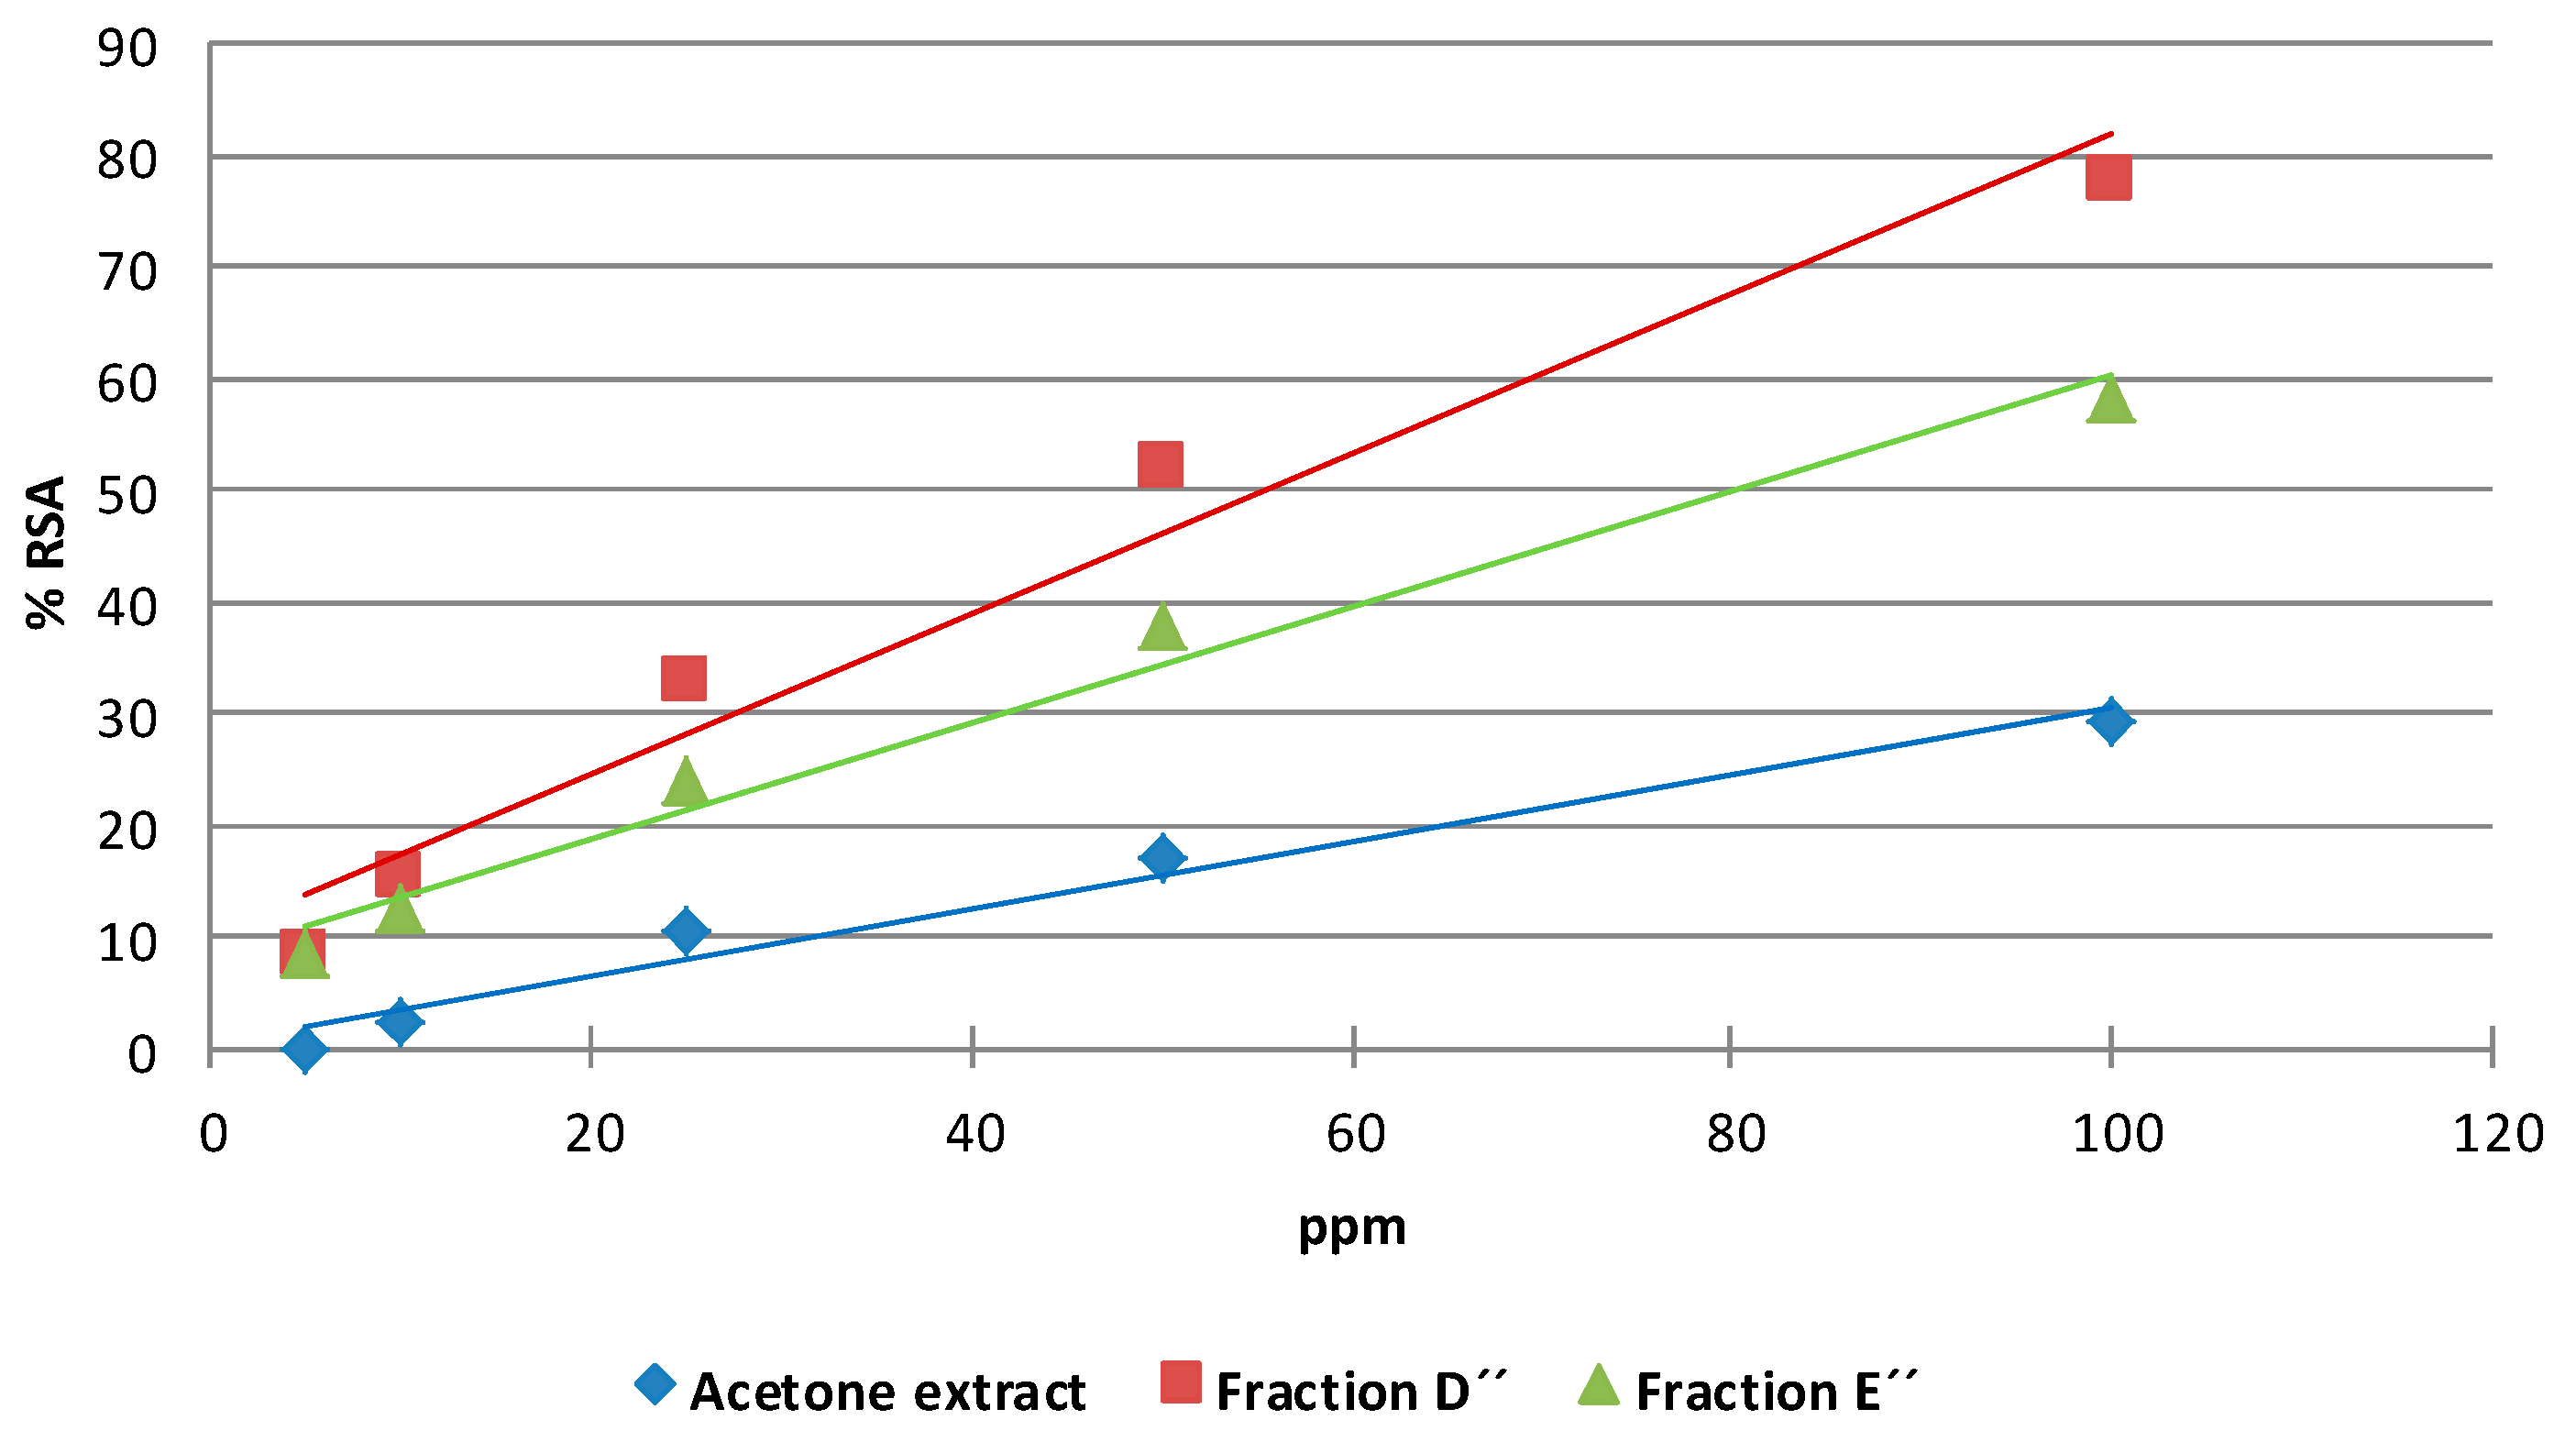
The results show that the extracts and different fractions exhibited dose-dependent antioxidant activity. The fractions from the acetone extract showed % RSA values higher than 50% at 100 ppm. The antioxidant activity index (AAI) values for the fractions from the acetone extract classify them as having strong antioxidant activity (
Table 3).
Table 3.
Antioxidant activity index (AAI) values for fractions of the acetone extract from citrus by-products.
Table 3.
Antioxidant activity index (AAI) values for fractions of the acetone extract from citrus by-products.
| Fraction | IC50 (µg/mL) | AAI | Antioxidant Activity |
|---|
| Fraction D′′ | 58.01 | 1.43 (±0.04) | Strong |
| Fraction E′′ | 78.31 | 1.10 (±0.06) | Strong |
Figure 7.
DPPH radical scavenging activity of the dichloromethane extract and its fractions from citrus by-products: Fraction E′ showed the highest scavenging activity; Fractions F′ and G′ showed the same antioxidant activity as the DCM extract; Fractions H′ and I′ showed the lowest scavenging activity.
Figure 8.
DPPH radical scavenging activity of the acetone extract and its fractions from citrus by-products. Fraction D′′ showed the highest scavenging activity. Fraction E′′ showed medium activity antioxidant. The acetone extract showed the lowest scavenging activity.
Figure 8.
DPPH radical scavenging activity of the acetone extract and its fractions from citrus by-products. Fraction D′′ showed the highest scavenging activity. Fraction E′′ showed medium activity antioxidant. The acetone extract showed the lowest scavenging activity.
These results are consistent with those published previously [
63], where the differences observed between fractions and the original extract reflect the variation of the phytochemical composition of the samples, a trend that is mentioned in various publications on citrus antioxidants [
64,
65]. The changes in the concentrations of the compounds and their proportions in fractions can lead to the appearance of synergistic effects, which have been observed in several cases [
66,
67].
The DPPH free radical scavenging potentials were tested for the major compounds from the different fractions, namely the polymethoxyflavones
1–
9 at a concentration of 25 µM (
Figure 9). Gallic acid was used as a positive control and this showed the highest activity (94.91% RSA; AAI = 27 (very strong antioxidant activity)) [
68]. The radical scavenging polymethoxyflavones showed very low activities, with 5-demehylsinenstin (
9) showing the highest % RSA (11.44) of the series.
The data obtained are consistent with the typical radical scavenging potentials of flavonoids. It is generally accepted that the antioxidant activity of flavonoids is mainly caused by the presence of the 2,3-double bond in conjugation with a 4-oxo function, the
o-dihydroxy structure at positions 3′,4′, and the presence of two hydroxyl groups in positions 3 and 5 [
69]. The flavonoids tested here do not contain hydroxyl groups at these positions and only 8 and 9 bear a hydroxyl group at all, in these cases in position 5. Therefore, the antioxidant activities of the acetone fractions may be due to the presence of unidentified compounds or possible synergistic effects between them.
Figure 9.
DPPH radical scavenging activity of polymethoxyflavones (1–9) at 25 µM.
Figure 9.
DPPH radical scavenging activity of polymethoxyflavones (1–9) at 25 µM.
2.4. Isobolographic Analysis of Chemical Interaction in Coleoptile Bioassay
Studies on binary-mixture are often conducted with the aim of elucidating the effect of one specific chemical on the biological action of another. The results can be interpreted in relation to reference models by the use of isobolograms. However, the amount of data needed for these analyses is large and such experiments are therefore rarely repeated. The joint effect of the majority of chemical mixtures can be predicted using the reference model named “Independent Similar Action by Bliss” [
70]. The approach becomes challenging, however, when the mixtures include chemicals that synergize or antagonize the effects of other components [
71].
The study described here involved an investigation into the reproducibility of isobolograms for binary mixtures in the elongation of the etiolated wheat coleoptile in terms of deviation from the reference model, dose-level dependence, combinations of different proportions and isobole asymmetry. The data employed were obtained from different binary mixtures of compounds isolated from by-products of Citrus sinensis tested in the coleoptile bioassay, as well as complex mixtures made from active fractions and an active compound.
The isobole method is independent of the mechanism of action and applies under most conditions. It also makes no assumptions as to the behavior of each agent and is therefore applicable to multiple component mixtures. An isobole is an “iso-effect” curve, in which a combination of constituents (da, db) is represented on a graph, the axes of which are the dose-axes of the individual agents (Da and Db). If the agents do not interact, the isobole (the line joining the points that represent the individual doses with the same effect as the combination) will be a straight line (line of additivity). If synergy is occurring, i.e., the effect of the combination is greater than expected from their individual dose-response curves, the dose of the combination needed to produce the same effect will be less than for the sum of the individual components and the point is located below the line of additivity. The opposite applies for antagonism, in which the dose of the combination is greater than expected and is located above the line of additivity.
Isobolographic analysis was performed to evaluate the interactions between the compounds [
72]. The type of interaction is evaluated from the values of the interaction index (λ); values close to
1 correspond to an additive interaction, values higher than
1 imply an antagonistic interaction, and values less than 1 indicate a synergistic interaction. The difference between the interaction index and a value of one represents the intensity or magnitude of the synergistic or antagonistic effect.
After examining interactions of 44 binary mixtures with the isolated compounds from
Citrus sinensis on the etiolated wheat coleoptile bioassay, and applying Student’s
t test with a confidence level of 90%, 32 additive interactions, 7 synergistic interactions and 5 antagonistic interactions were detected (see
Table 4).
Table 4.
Types of interactions with Student’s t test (α = 0.1) and interaction index (λ) between the different combinations of binary mixtures of isolated compounds from Citrus sinensis in the etiolated wheat coleoptile bioassay (Add.: additive; Syn.: synergistic; Ant.: antagonistic).
Table 4.
Types of interactions with Student’s t test (α = 0.1) and interaction index (λ) between the different combinations of binary mixtures of isolated compounds from Citrus sinensis in the etiolated wheat coleoptile bioassay (Add.: additive; Syn.: synergistic; Ant.: antagonistic).
| Binary Mixture of Compound | Combination Ratio |
|---|
| 9:1 | 4:1 | 3:1 | 2:1 | 1:1 | 1:2 | 1:3 | 1:4 | 1:9 |
|---|
| ED25 | λ | ED25 | λ | ED25 | λ | ED25 | λ | ED25 | λ | ED25 | λ | ED25 | λ | ED25 | λ | ED25 | λ |
|---|
| 4:5 | Add. | 1.6 | - | - | Add. | 1.1 | - | - | Syn. | 0.3 | - | - | Syn. | 0.2 | - | - | Syn. | 0.4 |
| 4:2 | - | - | - | - | - | - | - | - | Add. | 1.2 | Ant. | 2.3 | - | - | Ant. | 5.3 | Ant. | 1.9 |
| 4:1 | Add. | 0.7 | Add. | 0.6 | - | - | Add. | 0.6 | - | - | Add. | 1.1 | - | - | - | - | - | - |
| 1:2 | - | - | - | - | Add | 1.2 | - | - | Syn. | 0.5 | - | - | - | - | - | - | Ant. | 1.8 |
| 1:5 | - | - | - | - | Add. | 1.6 | - | - | Add. | 2.9 | - | - | - | - | - | - | - | - |
| 5:10 | - | - | - | - | Syn. | 0.0 | - | - | Syn. | 0.2 | - | - | Syn. | 0.1 | - | - | - | - |
| 4:10 | - | - | - | - | Add. | 1 | - | - | Add. | 0.8 | - | - | Add. | 0.7 | - | - | - | - |
| 1:10 | - | - | - | - | Add. | 1 | - | - | Add. | 1.2 | - | - | Add | 1.6 | - | - | - | - |
| | ED50 | λ | ED50 | λ | ED50 | λ | ED50 | λ | ED50 | λ | ED50 | λ | ED50 | λ | ED50 | λ | ED50 | λ |
| 11:6 | - | - | - | - | Add. | 1.1 | - | - | Add. | 0.9 | - | - | Ant. | 2.9 | - | - | - | - |
| 11:1 | - | - | - | - | Add. | 0.8 | - | - | Add. | 0.8 | - | - | Add. | 0.6 | - | - | - | - |
| 11:4 | - | - | - | - | Add. | 1.1 | - | - | Add. | 0.7 | - | - | Add. | 0.7 | - | - | - | - |
| 11:7 | - | - | - | - | Add. | 2.4 | - | - | Add. | 1.5 | - | - | - | - | - | - | - | - |
| 11:9 | - | - | - | - | Add. | 0.9 | - | - | Add. | 0.9 | - | - | Add. | 1.4 | - | - | - | - |
| 11:16 | - | - | - | - | Add. | 1.1 | - | - | Add. | 0.9 | - | - | Add. | 1.2 | - | - | - | - |
Among all the combinations of binary mixtures tested on the elongation of the etiolated wheat coleoptile, the polymethoxyflavones tetra-
O-methylscutellarein (
1), nobiletin (
4) and sinensetin (
5) showed synergistic effects. Moreover, 6,7,8,3′,4′-pentamethoxyflavone (
2) and tangeretin (
6) are involved in the antagonistic effects detected in this general activity bioassay. Normalized isobolograms of binary mixtures for some of these polymethoxyflavones in different proportions are shown in
Figure 10,
Figure 11 and
Figure 12. The effects of interactions between two polymethoxyflavones
5 and
6 with other isolated structures from
Citrus sinensis were also tested. The normalized isobolograms of binary mixtures of
5 with a limonoid, namely limonin (
10), and
6 with a phenylpropanoid, namely anethole (
11), are shown in
Figure 13 and
Figure 14, respectively.
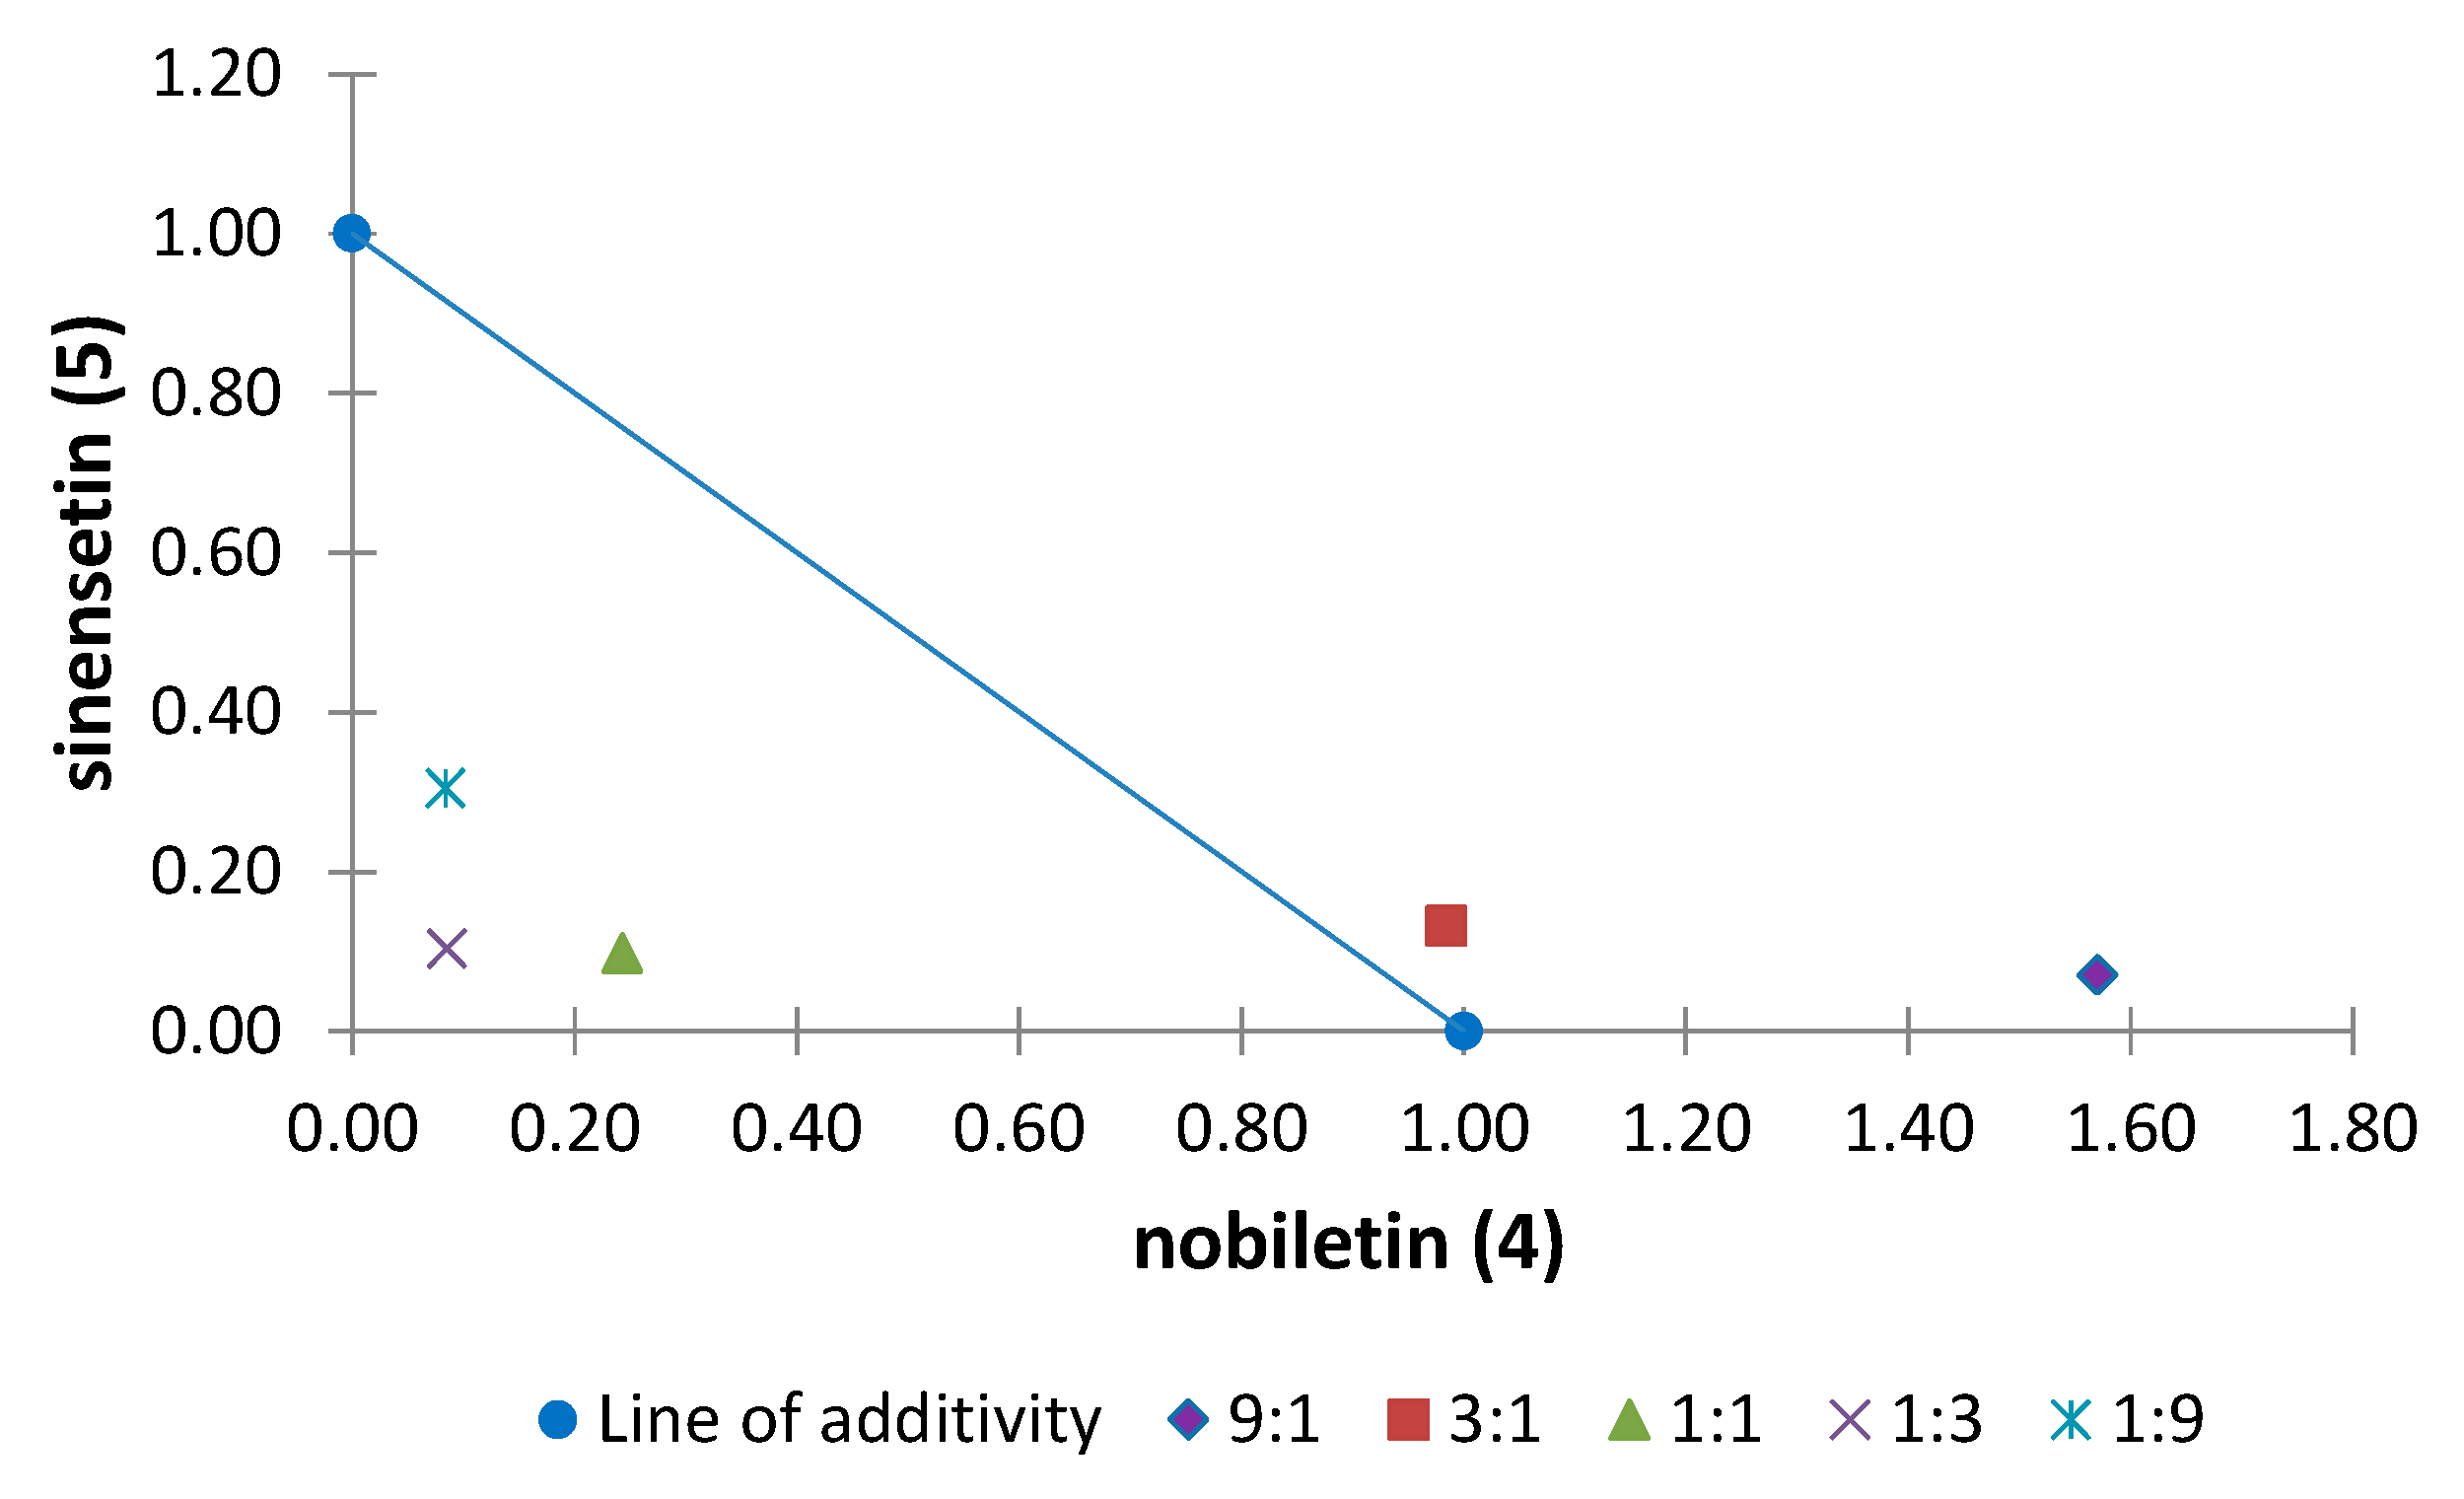
The results for the binary mixture of nobiletin (
4)/sinensetin (
5) show that a synergistic effect is obtained when both compounds are in the same proportion, or
5 is present in a higher proportion. The most notable result was obtained for the combination
4/
5 (1:3) by virtue of the lowest value for the interaction index (0.2). In contrast, when
4 was present in a higher proportion an additive effect was observed (
Figure 10).
Figure 10.
Normalized isobologram (ED25) for the binary mixture nobiletin (4)/sinensetin (5) in the etiolated wheat coleoptile bioassay. (Combination ratios 9:1; 3:1; 1:1; 1:3; 1:9). The combination ratios 9:1 and 3:1 were not significantly different when Student’s t test was applied and therefore an additive effect was not evident. The proportions 1:1, 1:3 and 1:9 are located below the line of additivity and a significant difference was observed on applying Student’s t test, thus showing a synergistic effect.
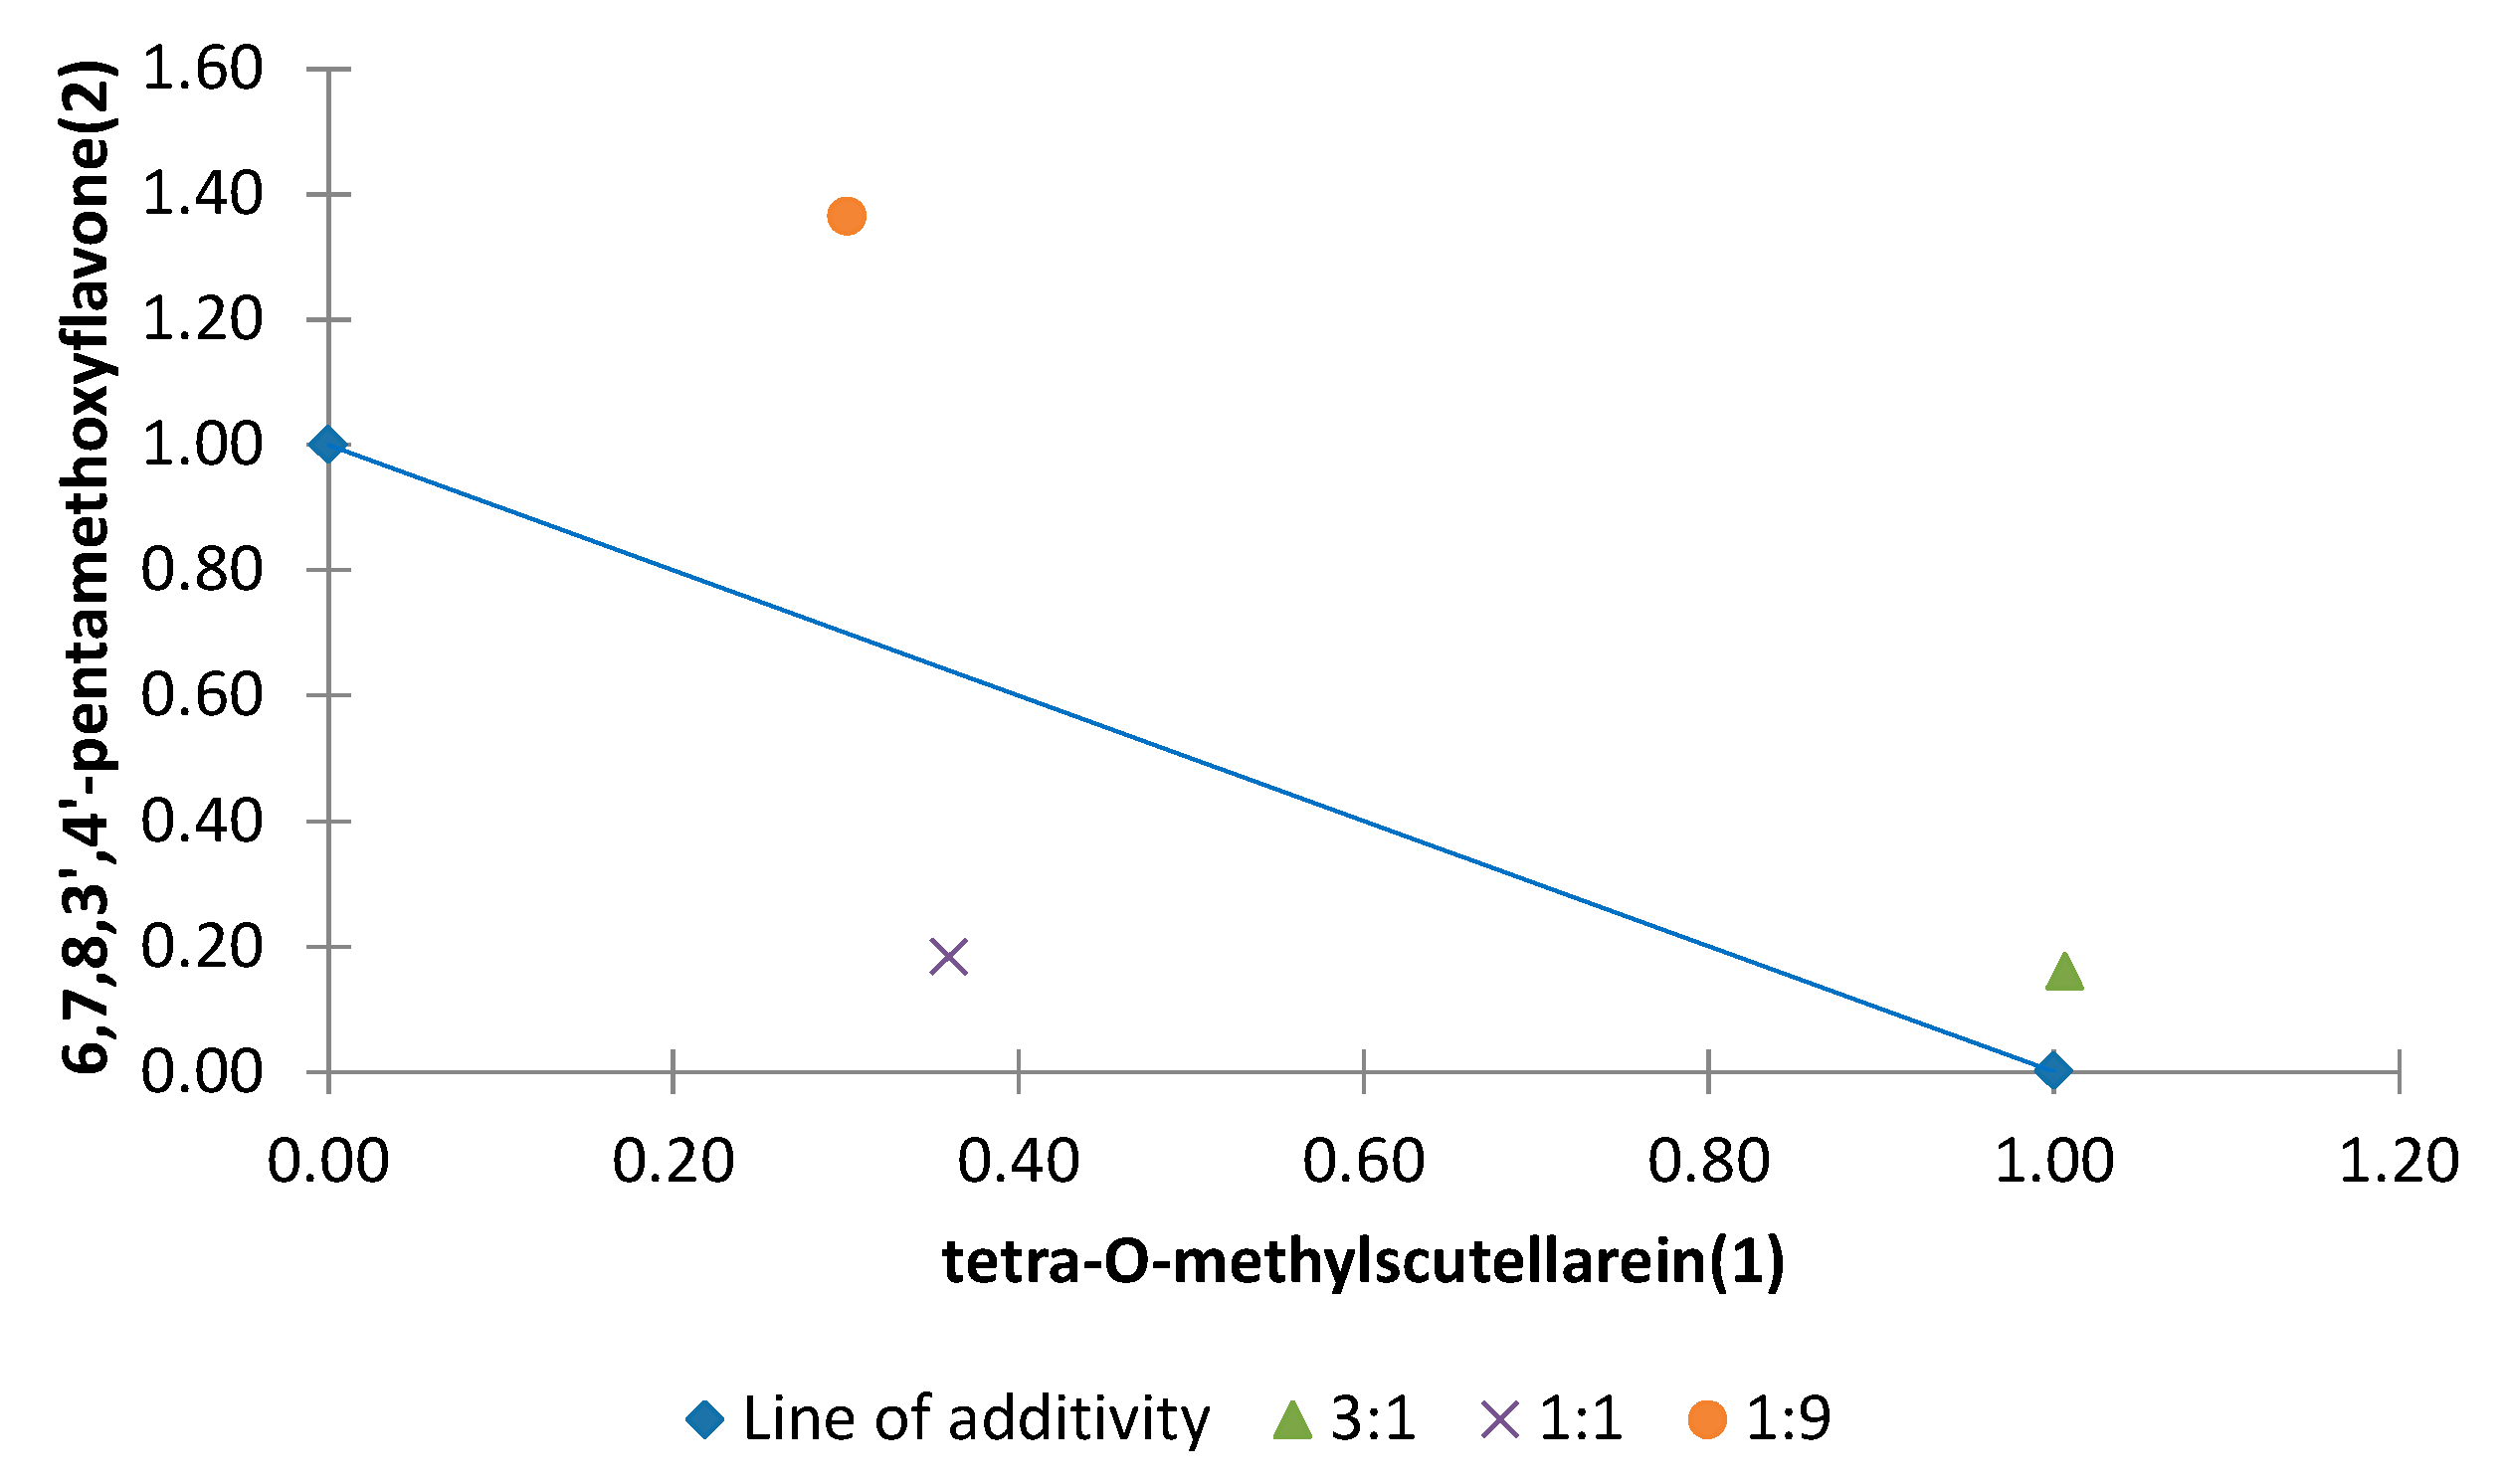
The binary mixture that contained tetra-
O-methylscutallarein (1)/6,7,8,3′,4′-pentamethoxyflavone (
2) showed different interactions. When both compounds are present in the same proportion a synergistic interaction was detected. However, when
1 was present in a higher proportion there was an additive effect. In contrast, when
2 was present in a higher proportion an antagonistic effect was observed (
Figure 11).
Figure 11.
Normalized isobologram (ED25) for the binary mixture tetra-O-methylscutallarein (1)/6,7,8,3′,4′-pentamethoxyflavone (2) in the etiolated wheat coleoptile bioassay. (Combination ratios 3:1; 1:1; 1:9). The combination ratio 3:1 did not show a significant difference on applying Student’s t test, thus showing an additive effect. The 1:1 ratio is located below the line of additivity and a significant difference was observed on applying Student’s t test, thus showing a synergistic effect. The 1:9 ratio is located above the line of additivity and a significant difference was evident on applying Student’s t test, thus showing an antagonistic effect.
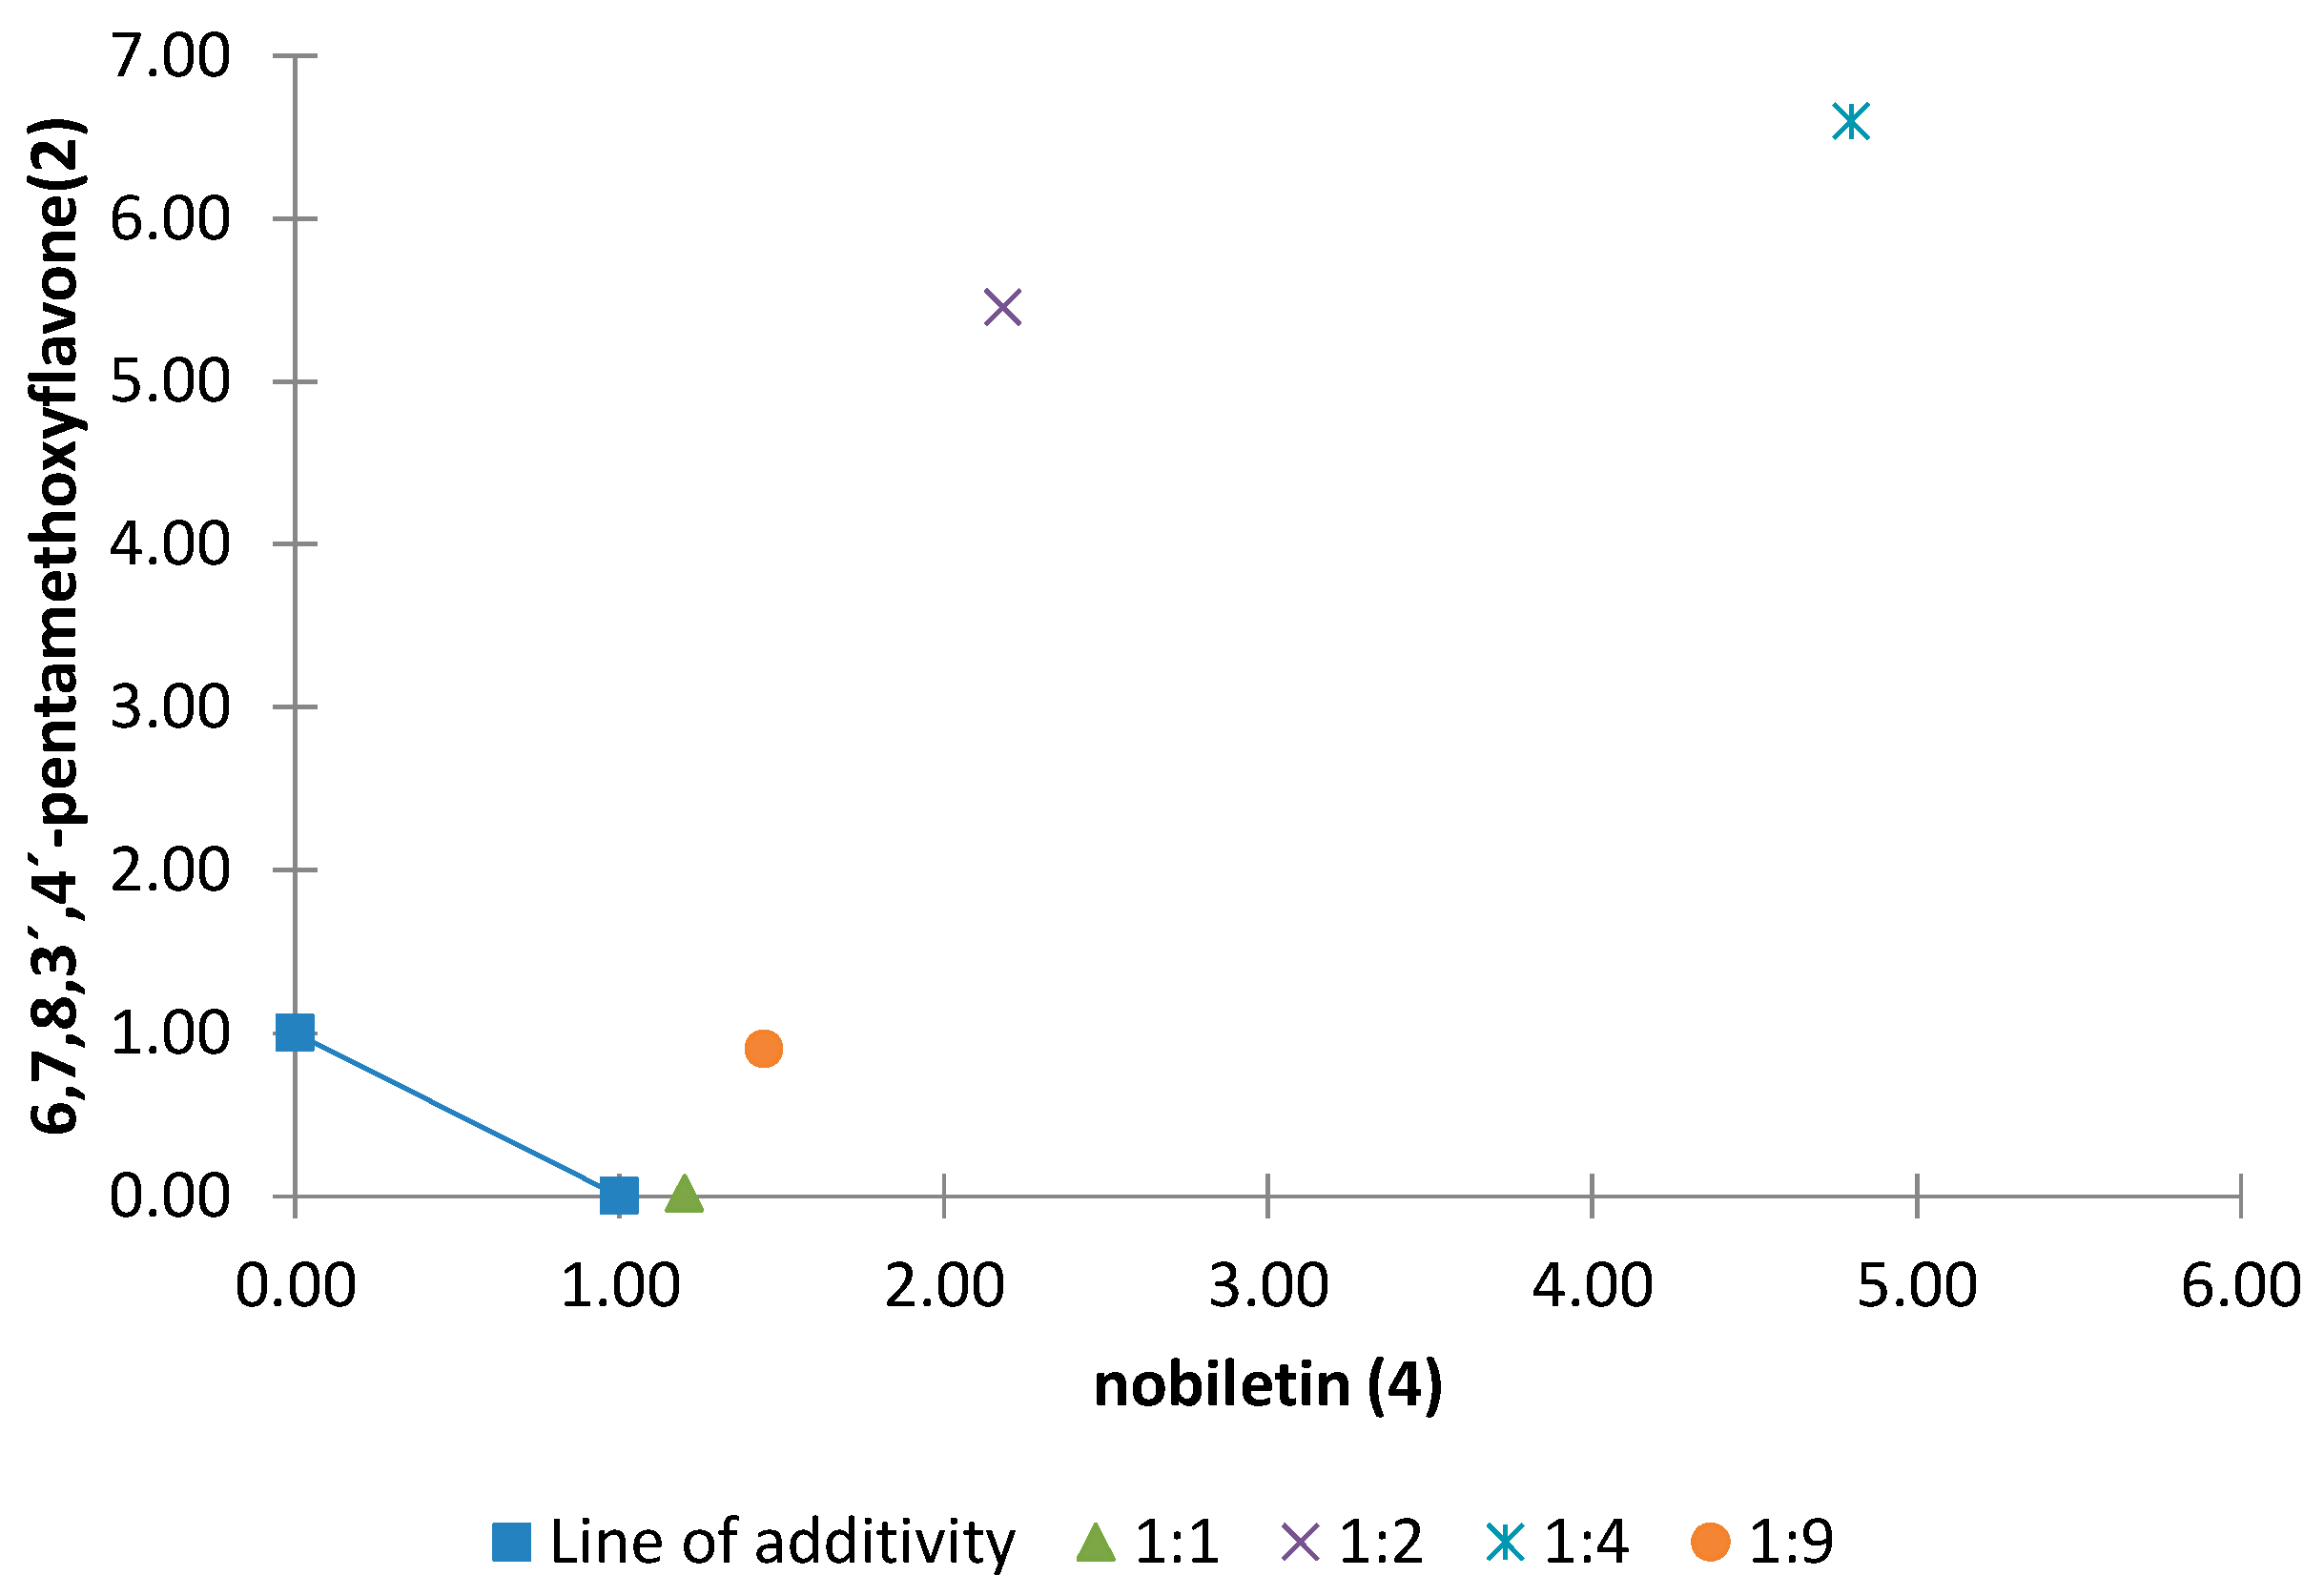
The normalized isobologram for the nobiletin (
4)/6,7,8,3′,4′-pentamethoxyflavone (
2) binary mixtures in different proportions is shown in
Figure 12. The results show that there is an additive effect when the two compounds are present in the same proportion. In contrast, when
2 is present in a higher proportion an antagonistic effect is observed. The most prominent effect was observed for the combination 4/2 (1:4) by virtue of the highest value of the interaction index (λ = 5.3,
Table 4).
Figure 12.
Normalized isobologram (ED25) for the binary mixture nobiletine (4)/6,7,8,3′,4′-pentamethoxyflavone (2) in the etiolated wheat coleoptile bioassay. (Combination ratios 1:1; 1:2; 1:4; 1:9). The ratio of 1:1 did not show any significant difference on applying Student’s t test and therefore an additive effect was not found. The 1:2, 1:4 and 1:9 ratios are located above the line of additivity and significant differences were observed on applying Student’s t test, thus showing an antagonistic effect.
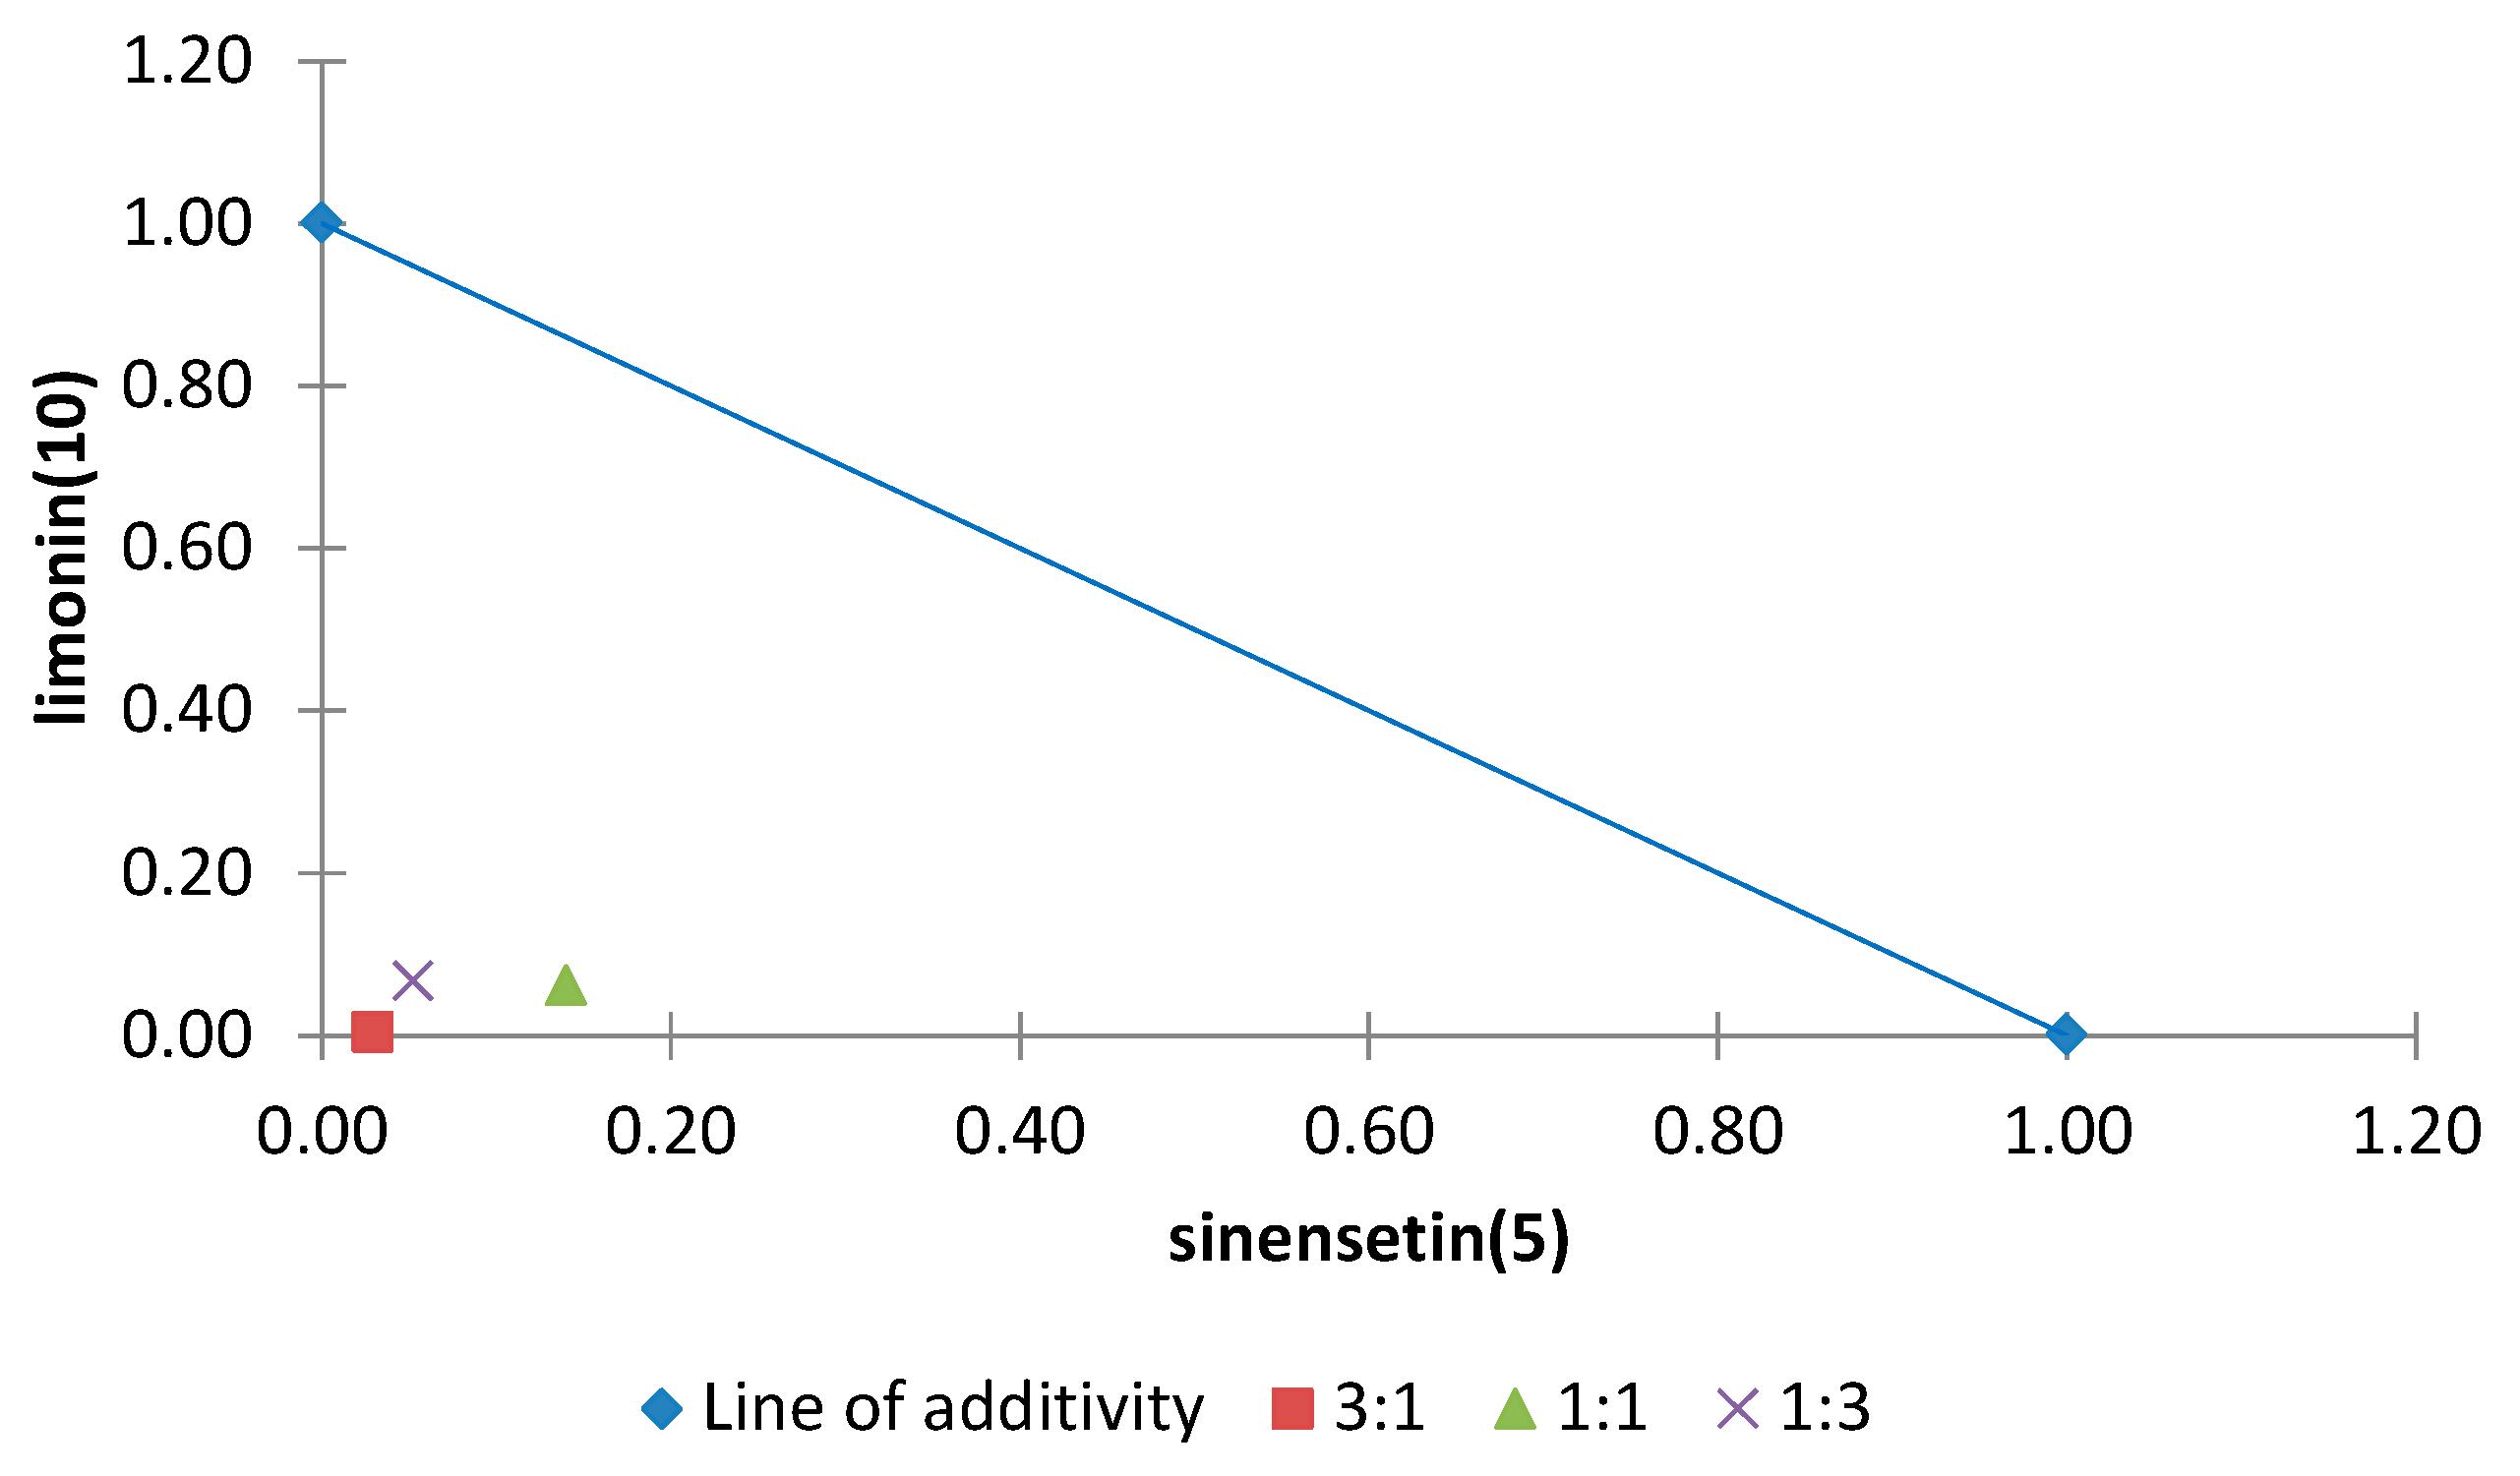
The normalized isobolograms for binary mixtures between two polymethoxyflavones (
5 and
6) and two other compounds with different skeletons, also isolated from
Citrus sinensis (limonoid (
10) and a phenylpropanoid (
11)) are shown in
Figure 13 and
Figure 14. The binary mixture limonin (
10)/sinensetin (
5) showed a synergistic effect in all proportions and the most notable effect was observed for the combination
10/
5 (3:1) by virtue of the lowest interaction index (0.03) (
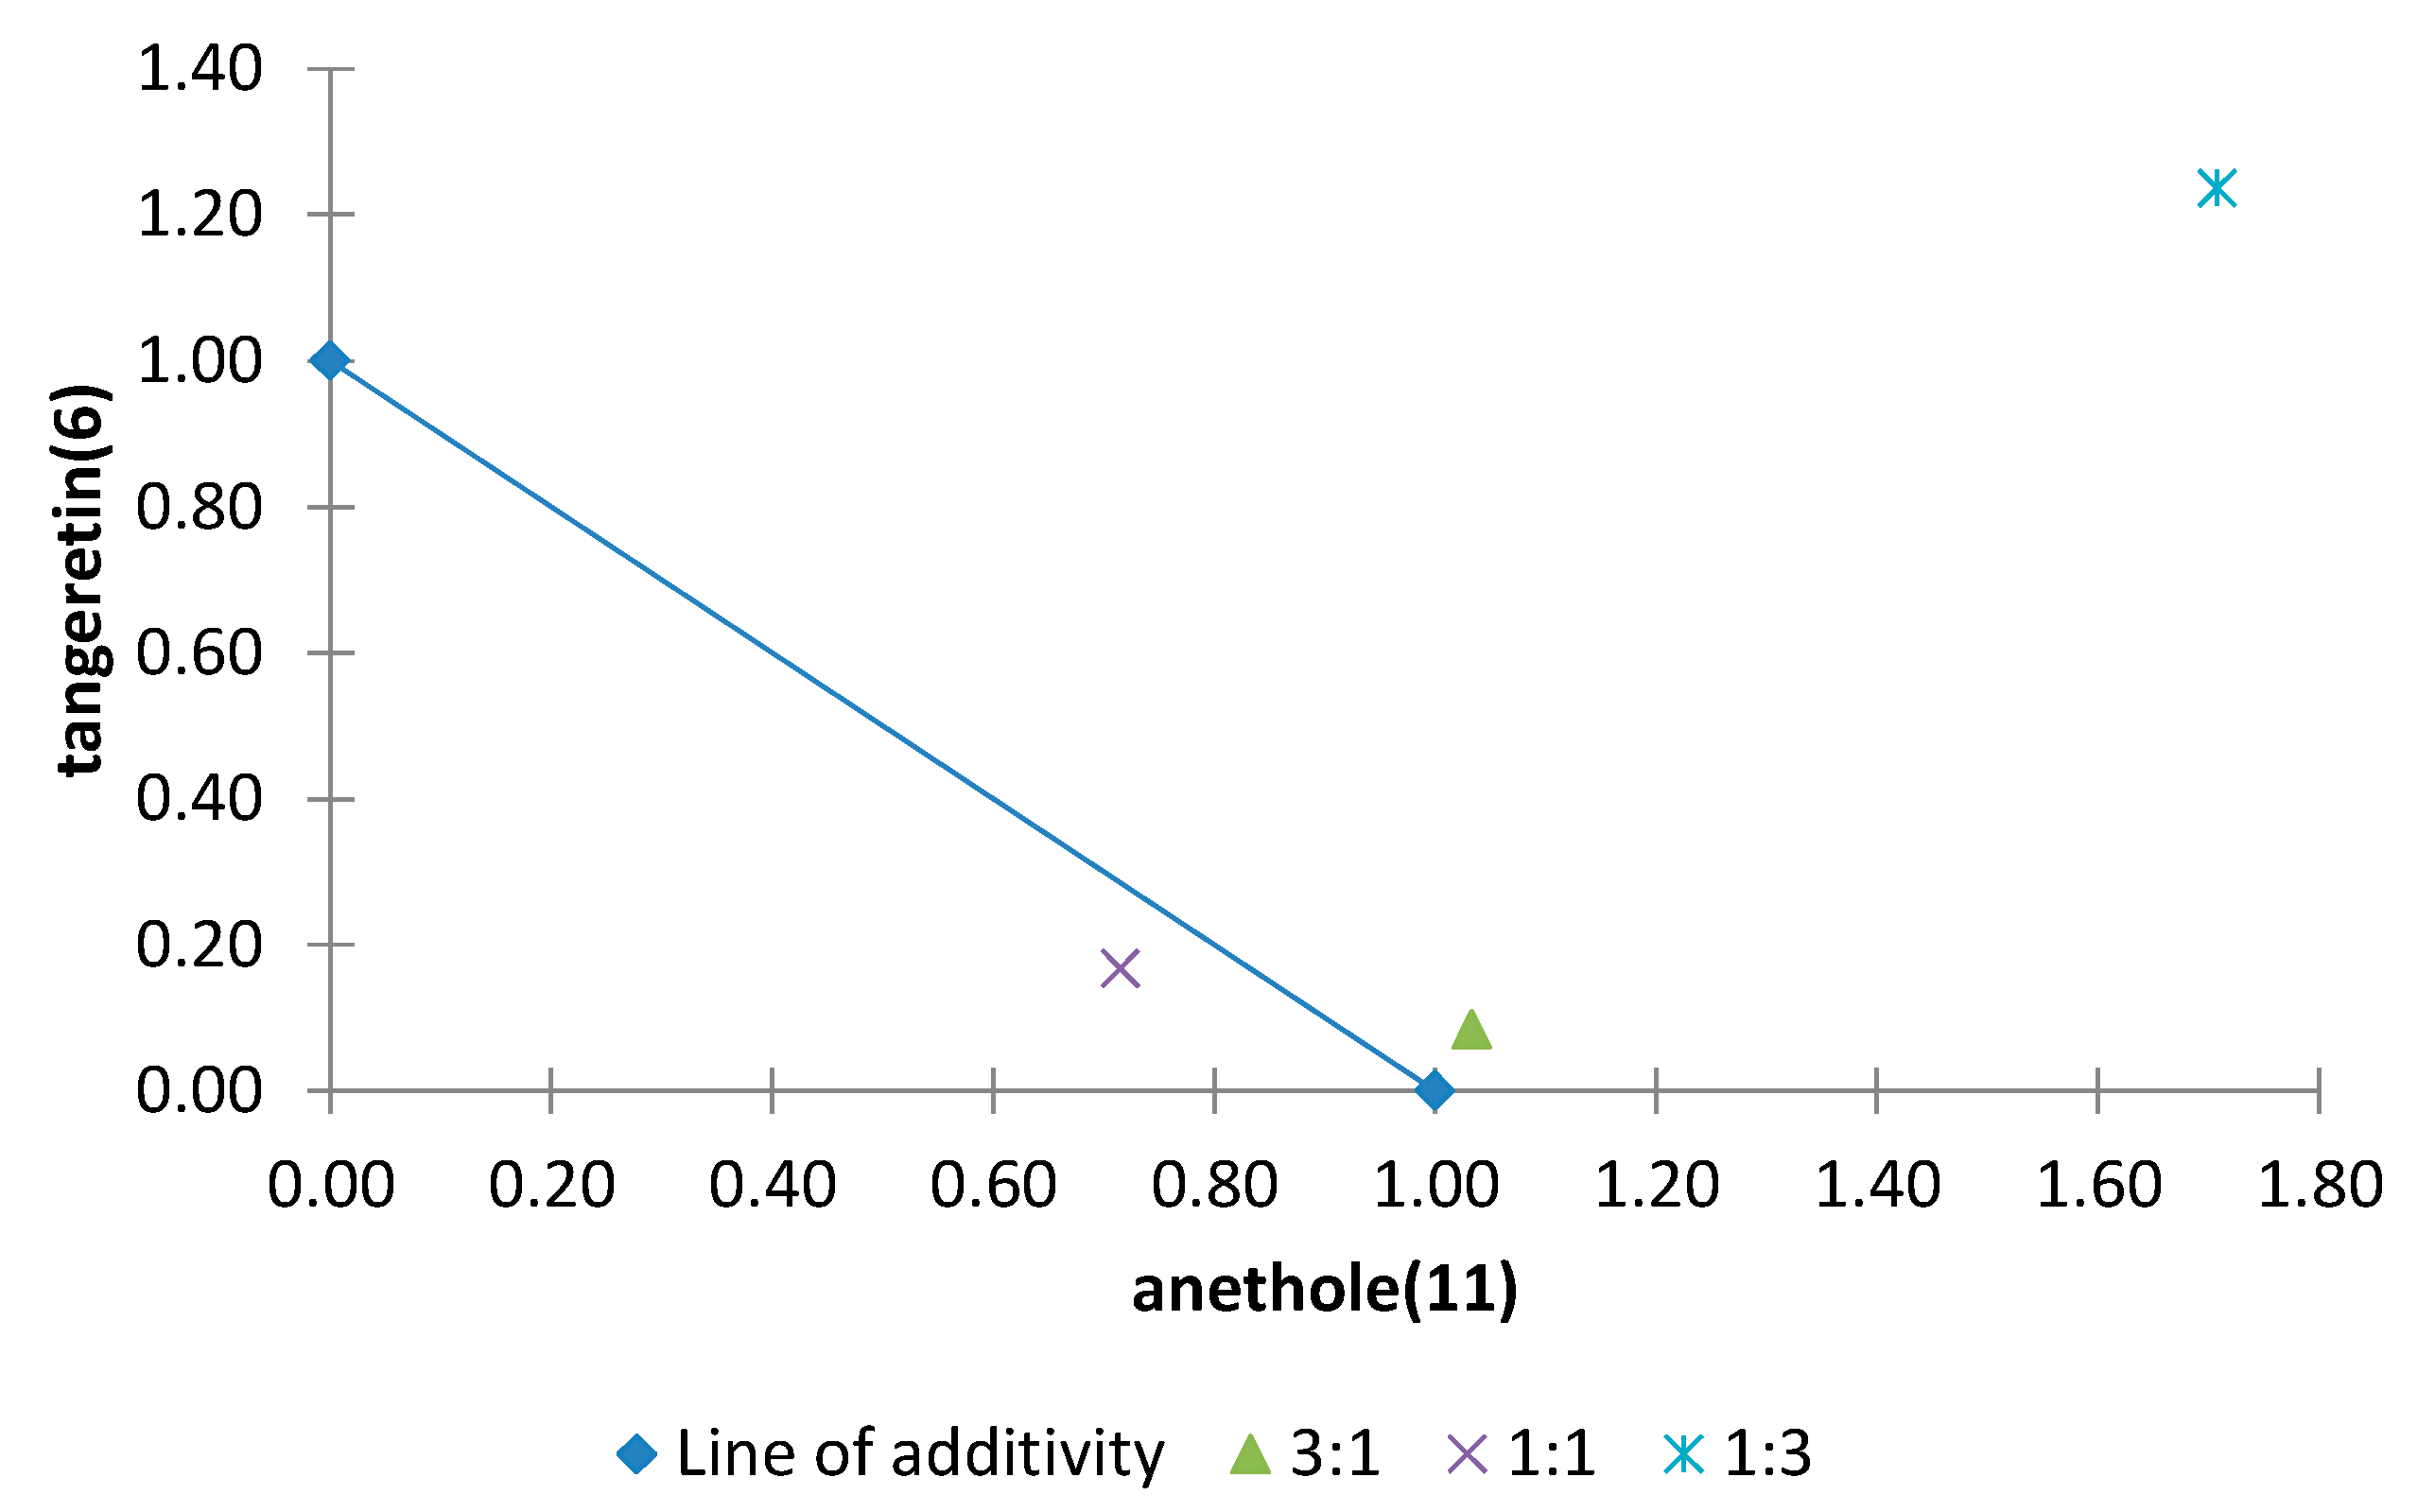
Figure 13). For the binary mixture anethole (
11)/tangeretin (
6) an additive effect was found when both compounds were present in the same proportion or
11 was in a higher proportion, whereas when
6 was present in a higher proportion an antagonistic effect was found (
Figure 14).
Figure 13.
Normalized isobologram (ED25) for the binary mixture sinensetin (5)/limonin (10) in the etiolated wheat coleoptile bioassay. (Combination ratios 3:1; 1:1; 1:3). All ratios are located below the line of additivity and significant differences were observed on applying Student’s t test, thus showing a synergistic effect.
Figure 14.
Normalized isobologram (ED25) for binary mixtures of anethole (11)/tangeretin (6) in the etiolated wheat coleoptile bioassay. (Combination ratios 3:1; 1:1; 1:3). The combination ratios 3:1 and 1:1 did not show significant differences on applying Student’s t test, thus showing an additive effect. The 1:3 ratio is located above the line of additivity and a significant difference was observed on applying Student’s t test, thus showing an antagonistic effect.
The results obtained with all of the combinations of binary mixtures for these compounds are consistent with the proposal of Caccioni, which considers a holistic approach to explain, for example, the antimicrobial capabilities of citrus essential oils, the activities of which could be the result of a quantitative balance of various components [
73] where some of them may act synergistically [
74]. Thus, a holistic approach may explain the antimicrobial activities of essential oils, the performance of which may be the result of a quantitative assessment of various compounds where the synergistic and additive effects outweigh the antagonistic effects.
Moreover, a study of the interactions in the elongation of the etiolated wheat coleoptile was carried out in which an active compound (in this case anethole,
11) was added to a complex mixture (active fractions obtained from dichloromethane and acetone extracts of citrus waste). In this test the activity of the fraction is considered as if it were a single compound. The results obtained are shown in
Table 5.
Table 5.
Types of interactions with Student’s t test (α = 0.1) and interaction index (λ) between the different combinations of anethole (11) and active fractions (D′′ and E′′) from the acetone extract and (E′–I′) from the DCM extract. (Add.: additive; Syn.: synergistic; Ant.: antagonistic).
Table 5.
Types of interactions with Student’s t test (α = 0.1) and interaction index (λ) between the different combinations of anethole (11) and active fractions (D′′ and E′′) from the acetone extract and (E′–I′) from the DCM extract. (Add.: additive; Syn.: synergistic; Ant.: antagonistic).
| Combination Ratio | Mixture of Compounds |
|---|
| 11:Dʹʹ | 11:Eʹʹ | 11:Eʹ | 11:Fʹ | 11:Gʹ | 11:Hʹ | 11:Iʹ |
|---|
| ED50 | λ | ED50 | λ | ED50 | λ | ED50 | λ | ED50 | λ | ED50 | λ | ED50 | λ |
|---|
| 1:1 | Add. | 0.8 | - | - | Add. | 0.8 | - | - | - | - | Add. | 1.4 | - | - |
| 1:2 | - | - | Add. | 1.4 | - | - | - | - | Add. | 1 | - | - | Add. | 1.4 |
| 1:3 | Syn. | 0.4 | - | - | Add. | 1.4 | - | - | - | - | Add. | 0.7 | - | - |
| 1:4 | - | - | - | - | - | - | Add. | 1.3 | - | - | - | - | - | - |
| 1:6 | - | - | - | - | - | - | - | - | Add. | 0.9 | - | - | Add. | 2.1 |
| 1:7 | - | - | Add. | 1.5 | - | - | - | - | - | - | - | - | - | - |
| 1:9 | Syn. | 0.3 | - | - | Add. | 0.7 | - | - | - | - | Add. | 0.7 | - | - |
| 1:13 | - | - | - | - | - | - | Add. | 0.8 | - | - | - | - | - | - |
| 1:19 | - | - | - | - | - | - | - | - | Add. | 0.9 | - | - | Add. | 1.6 |
| 1:24 | - | - | Ant. | 2.5 | - | - | - | - | - | - | - | - | - | - |
| 1:32 | - | - | - | - | - | - | Add. | 0.7 | - | - | - | - | - | - |
Of the 21 combinations tested, 19 showed an additive effect, two showed a synergistic effect and one showed an antagonistic effect. Normalized isobolograms for combinations that exhibited synergistic and antagonistic effects are shown in
Figure 15 and
Figure 16.
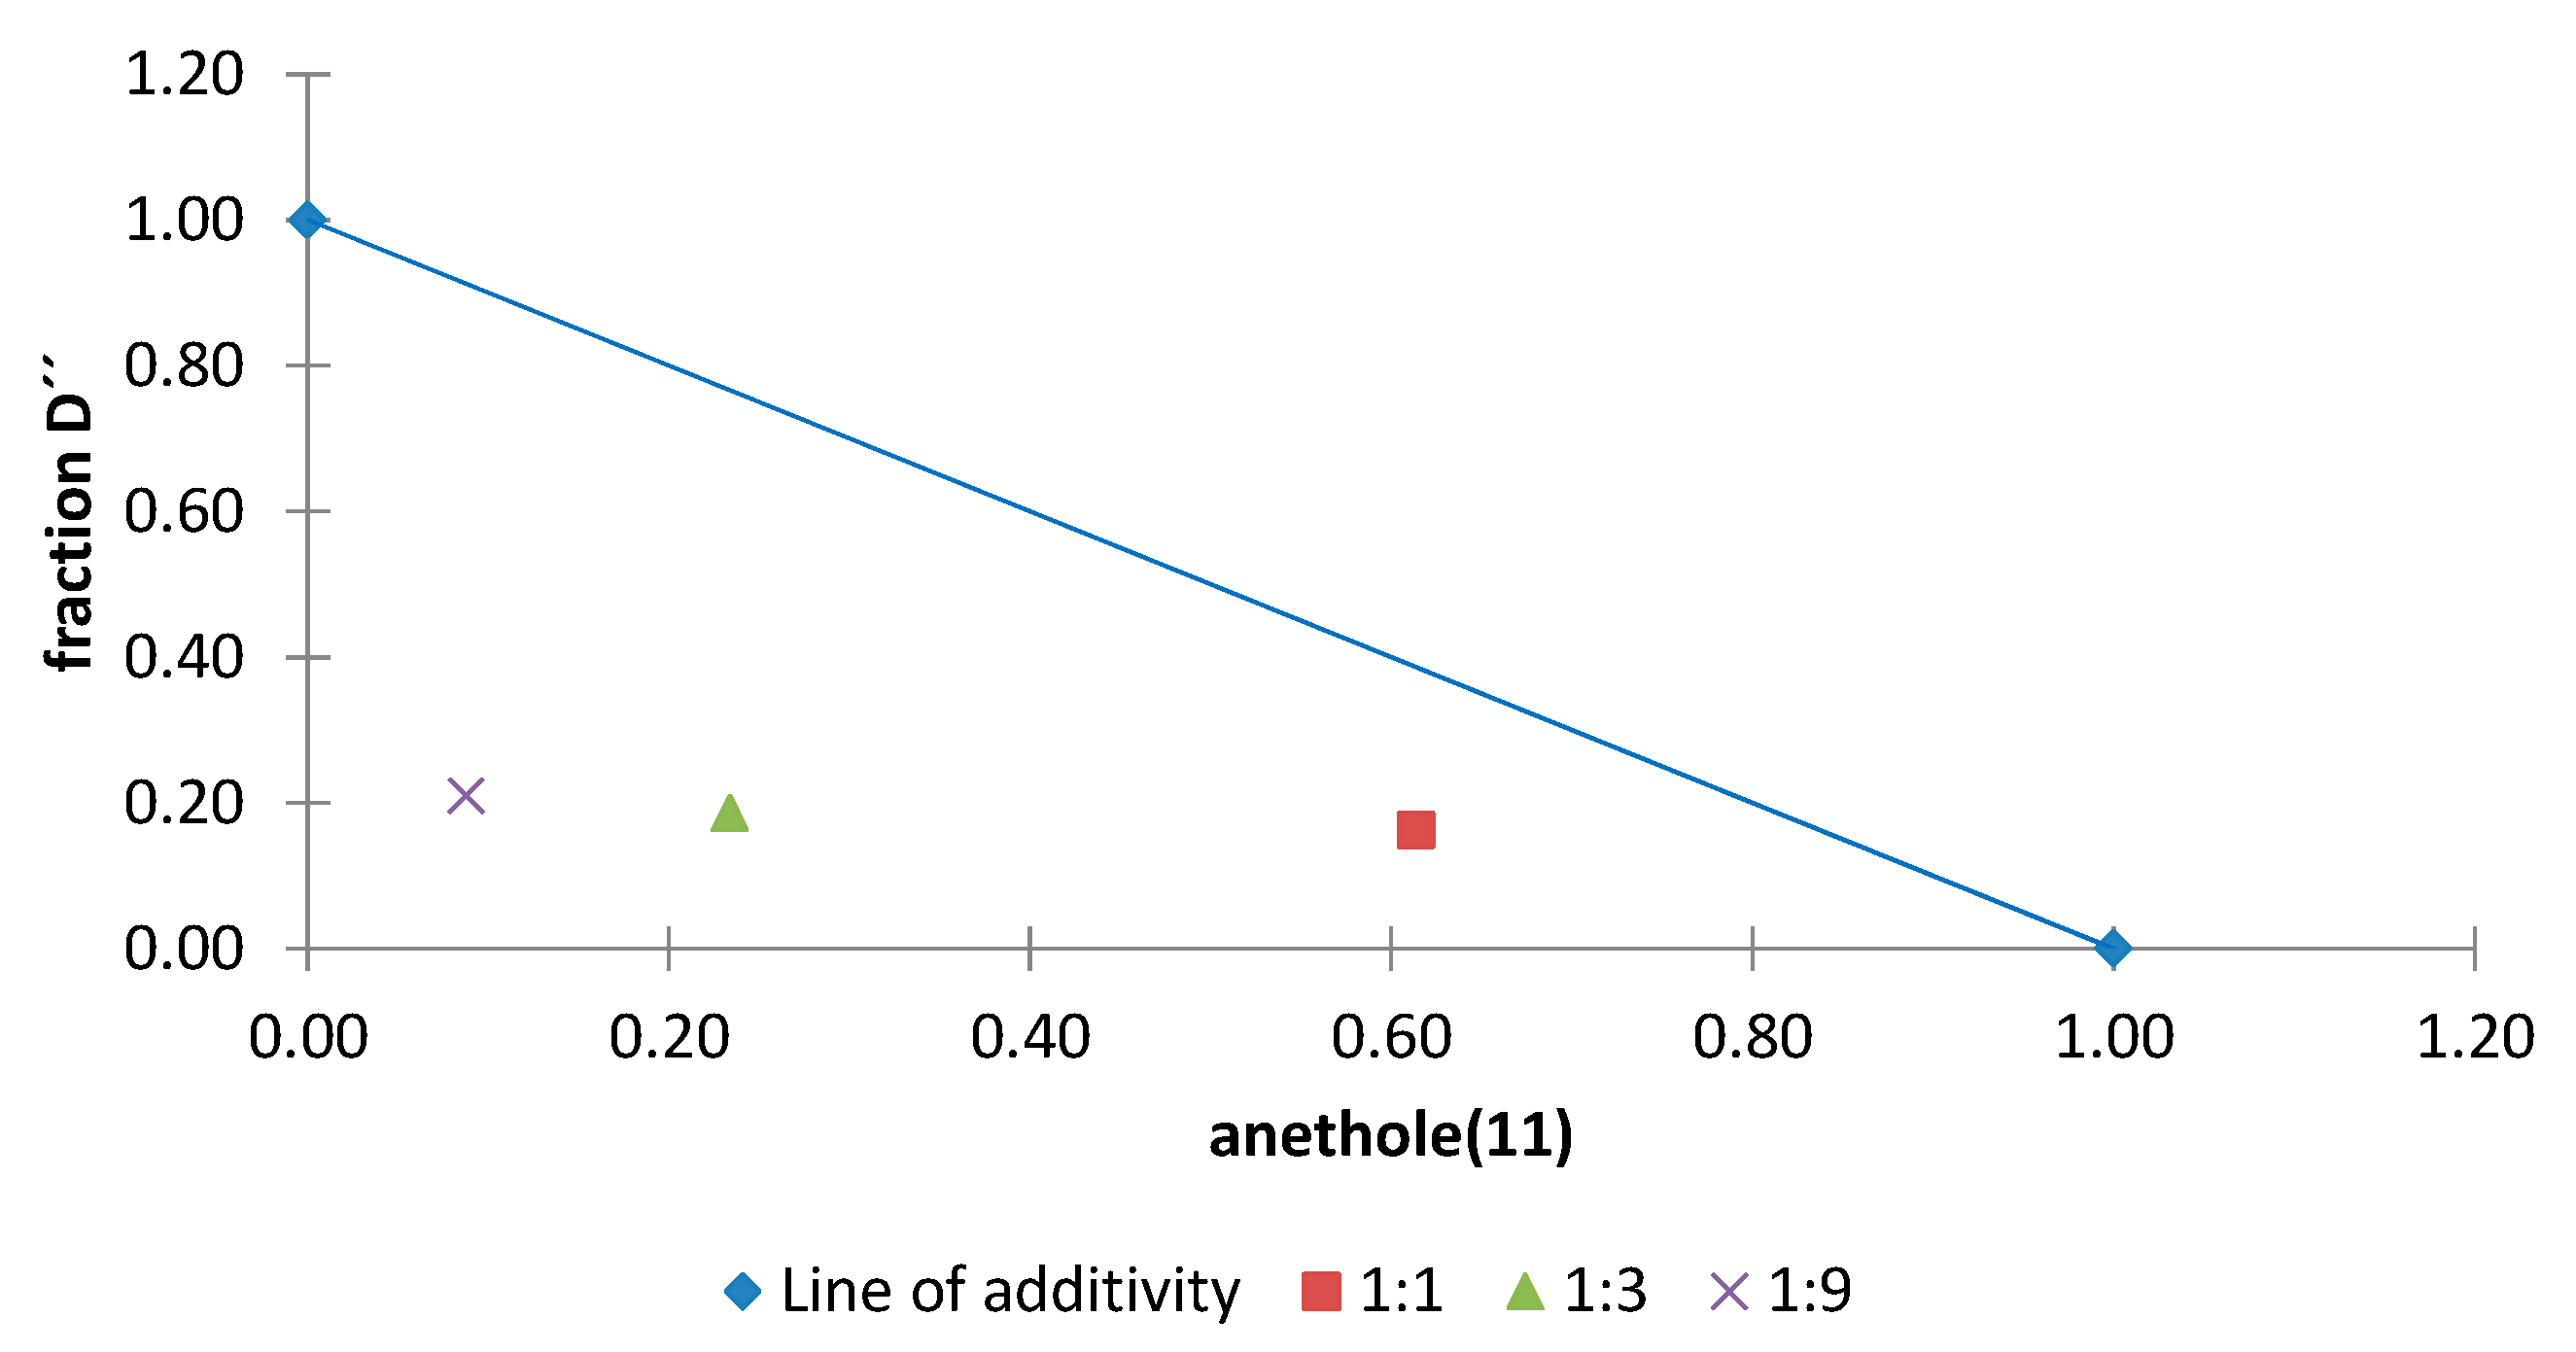
The normalized isobologram for the combination of anethole (
11) with fraction D′′ from the acetone extract in different proportions is shown in
Figure 15. The results indicate that a synergistic effect occurs when
11 is present in a lower proportion than fraction D′′ and this is more pronounced for the 1:9 ratio, which has an interaction index of 0.3 (
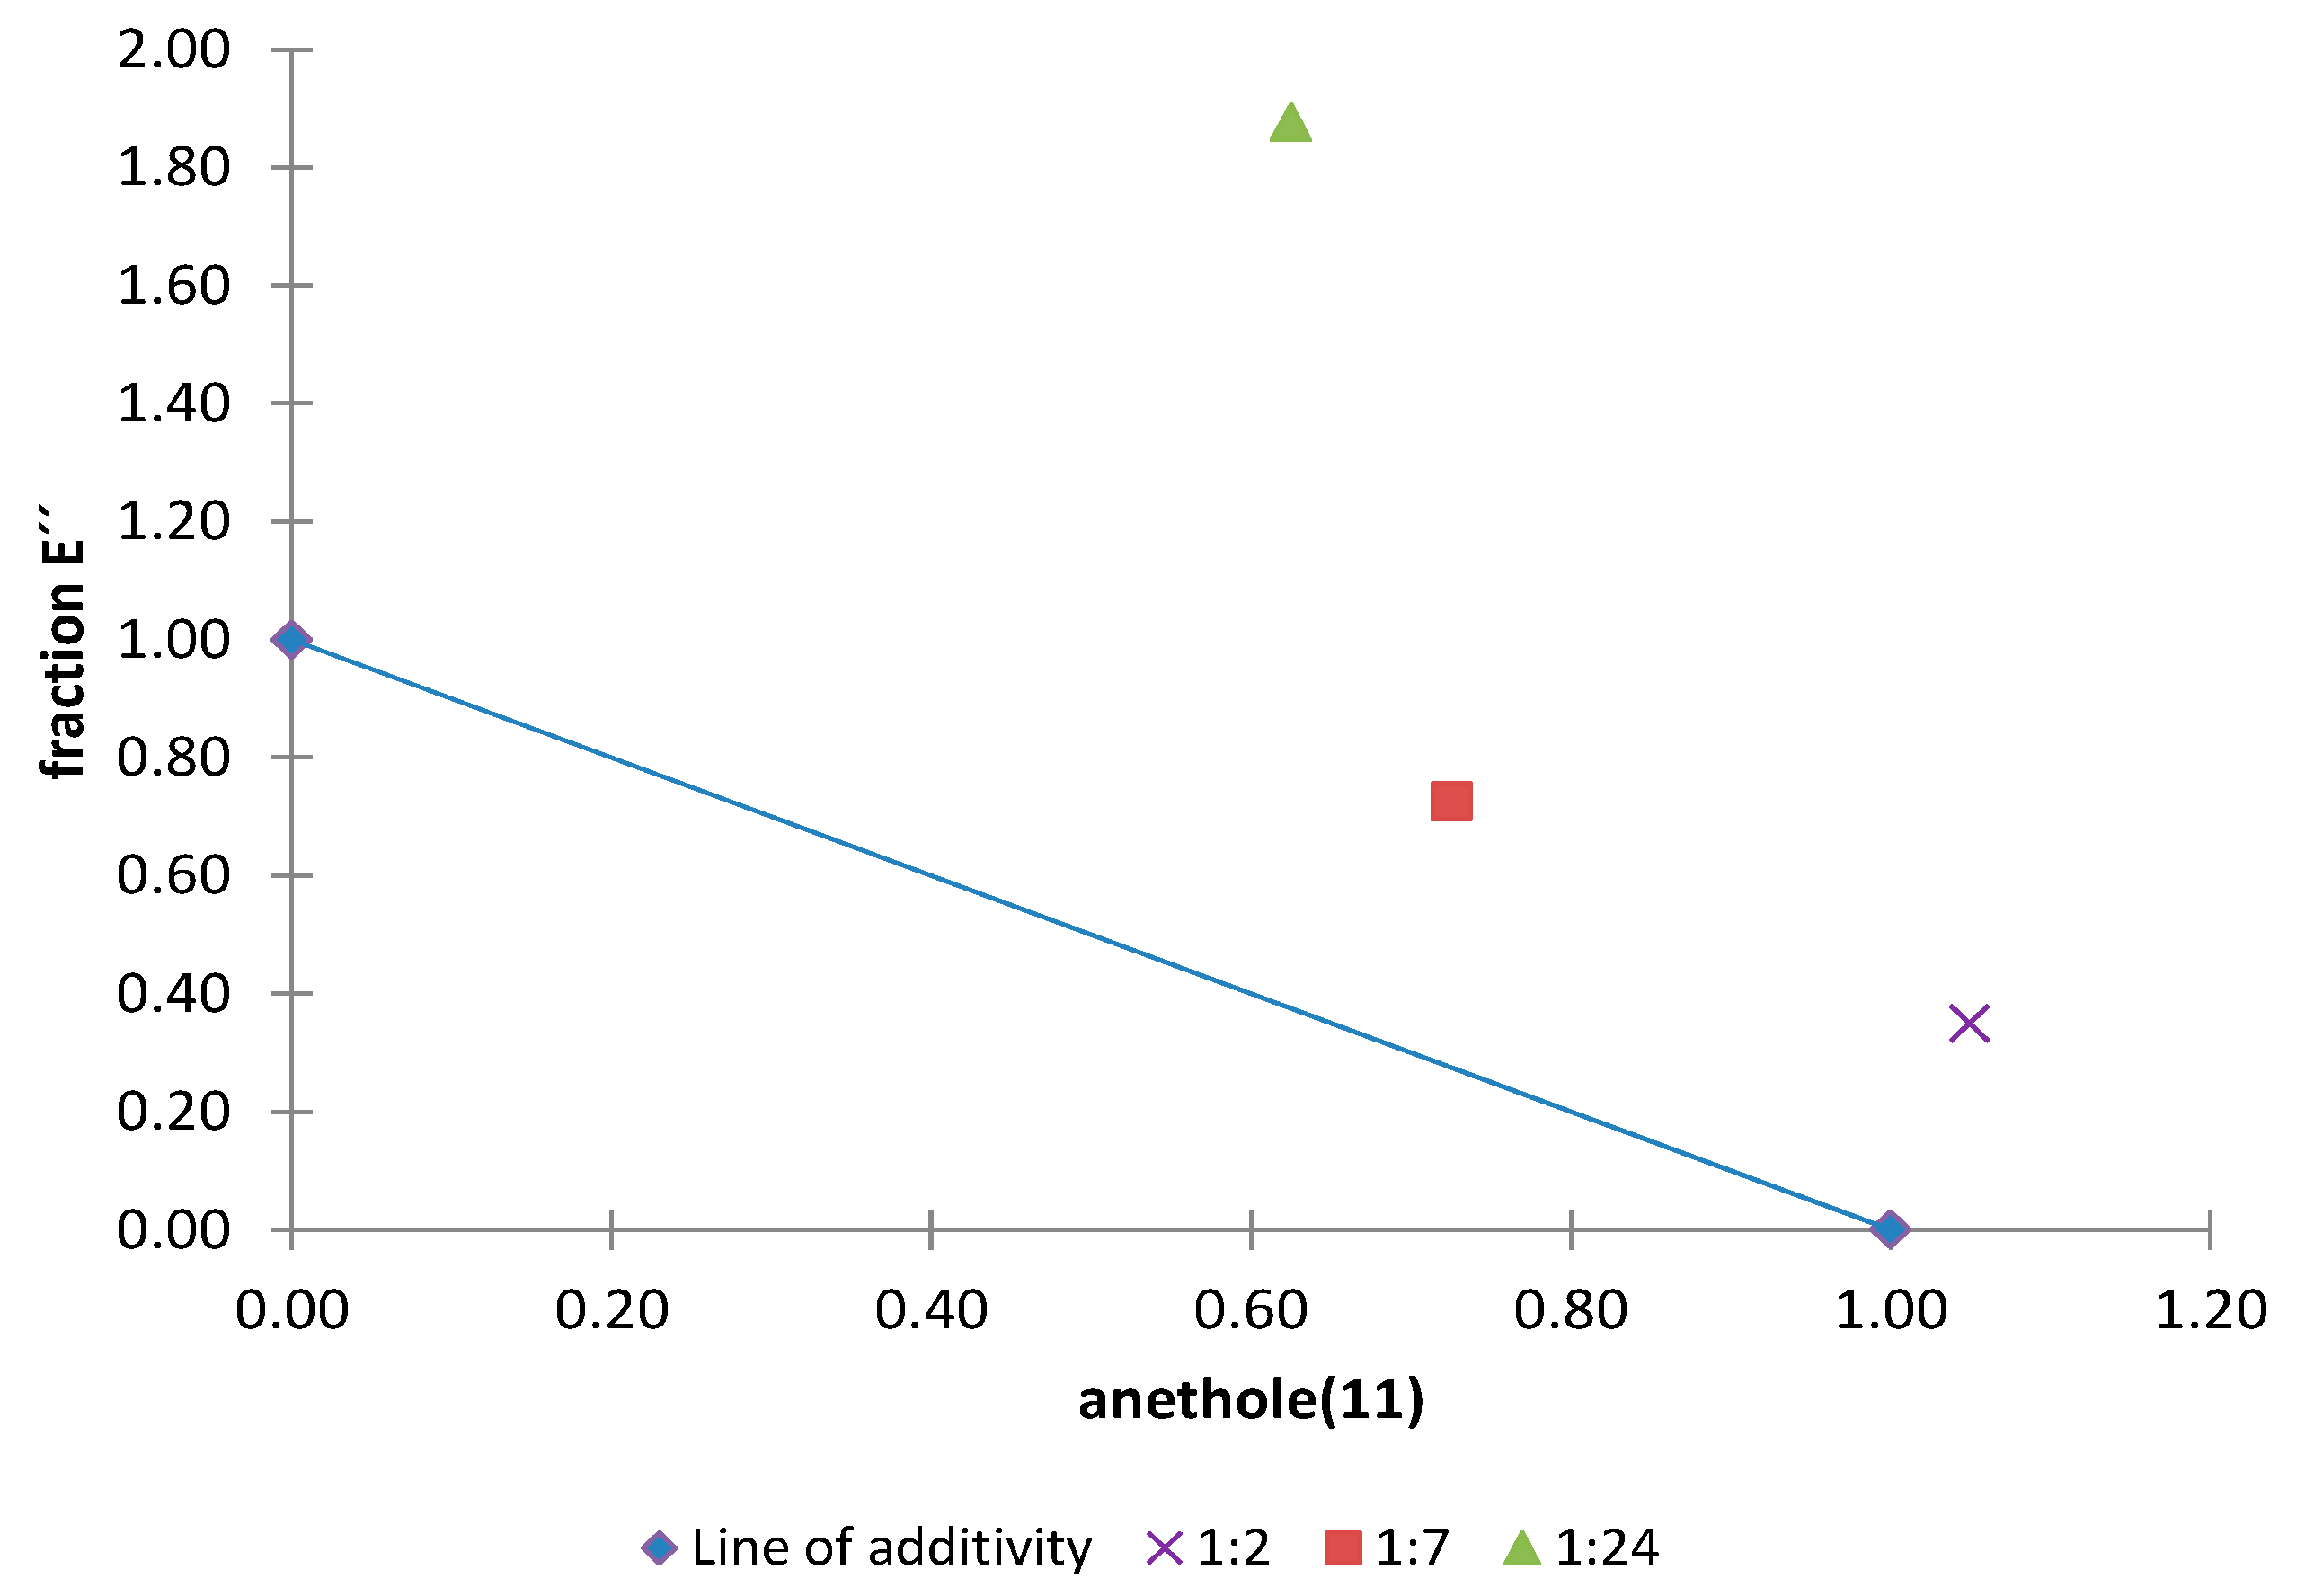
Table 5). Furthermore, the normalized isobologram for the combination of anethole (
11) with fraction E′′ from the acetone extract is shown in in
Figure 16 and an antagonistic effect is observed for the 1:24 ratio.
Figure 15.
Normalized isobologram (ED50) for the complex mixture anethole (11)/fraction D′′ (from the acetone extract) in the etiolated wheat coleoptile bioassay. (Combination ratios 1:1; 1:3; 1:9). The mixture with a 1:1 ratio did not show a significant difference on applying Student’s t test and this indicates an additive effect. The 1:3 and 1:9 ratios are located below the line of additivity and significant differences were observed on applying Student’s t test, thus indicating a synergistic effect.
Figure 16.
Normalized isobologram (ED50) for the complex mixture anethole (11)/fraction E′′ (from the acetone extract) in the etiolated wheat coleoptile bioassay. (Combination ratios 1:2; 1:7; 1:24). The 1:2 and 1:7 ratios did not show significant differences on applying Student’s t test, thus indicating an additive effect. The 1:24 ratio is located above the line of additivity and a significant difference was observed on applying Student’s t test, thus indicating an antagonistic effect.
It is noteworthy that these complex mixtures (with fractions D′′ and E′′), for which synergistic and antagonistic effects were detected, are the same as those that showed strong antioxidant activity in tests with DPPH (
Table 3). It can therefore be established that the antioxidant properties due to fractions or compounds present in these mixtures play a role in the interactions between the compounds. Studies have been published in which it is reported that the antioxidant properties of some compounds may act to protect unstable active compounds [
23].
On considering the results obtained in this study into interactions, both as binary mixtures or complex mixtures (a total of 65 combinations), it is apparent that most of them showed additive effects (50 combinations) followed by synergistic effects (nine combinations) and, to a lesser extent, antagonism (six combinations). The mixtures investigated were mainly composed of polymethoxy-flavones and, of all the possible interactions, additive and synergistic effects were more prevalent than antagonistic effects, with complex mixtures (with fractions) found to be more active than binary mixtures of pure compounds. These results are also consistent with the proposal by Caccioni concerning the activities of a citrus essential oils extract, which were possibly due to the prevalence of additive and synergistic effects over antagonistic effects [
73].
In the analysis of the synergistic and antagonistic interactions detected when anethole (
11) was added to the active fractions (D′′, E′′) from the acetone extract, the synergistic effect cannot be explained based on the results obtained in the binary combinations performed with 11 and the other compounds present in these fractions (
Table 4), since all are effects are additive except for those of the 1:3 anethole (
11)/tangeretin (
6) combination, which showed antagonism when
11 was present in a lower proportion than 6, as happens the same in the complex mixture (
11)/fraction E′′ in a 1:24 ratio (also an antagonistic effect).
This absence of a clear trend based on the binary interactions may be due to the following: (1) the compound in the mixture that produces a synergistic effect with anethole (
11) has not been identified. (In the case of antagonism in the 1:3 binary mixture (
11)/(
6) this could have an influence on the overall effect detected in the complex mixture (
11)/fraction E′′ in a 1:24 ratio). (2) Interactions with the fractions are not exclusively due to only two compounds and three or more compounds may be involved. In this respect, a more systematic study of the compounds involved in interactions with complex mixtures will be carried out and this will include a fractionation-directed synergistic approach, as proposed by some authors to detect the cause of synergistic effects within complex mixtures [
21].
2.5. Combination Analysis: Comparing the Additive and Experimental Regression Lines
The isobologram involves the use of sets of equally effective dose combinations for a single effect and it is therefore limited to that specific effect level. In contrast, a more general isobolar analysis that examines combinations of compounds over a range of effects would provide more complete information. Thus, a classification of synergism, antagonism or additivity depends not only on the compound and the effects measured, but also on the fixed ratio combination and the total dose in the combination.
In order to achieve the goal outlined above, a comparison between the theoretical additive curve, constructed from curves of individual compounds for each fixed ratio, and the experimental curve can be performed. The additive regression line and the line obtained from experimental results should be compared in order to assess whether a given interaction type (synergism, additivity or antagonism) is found at some mid-range effect and whether this extends to other dose levels. The F-distribution with a confidence limit of 95% provides a convenient statistic to distinguish whether the two lines differ significantly. The results are shown in
Table 6 and
Table 7.
Table 6.
Comparison of the additive and experimental regression lines for binary mixtures of compounds with the F-distribution (α = 0.05) to distinguish two regression lines (if Fcal > F there is a significant difference).
Table 6.
Comparison of the additive and experimental regression lines for binary mixtures of compounds with the F-distribution (α = 0.05) to distinguish two regression lines (if Fcal > F there is a significant difference).
| Binary Mixture of Compounds | Combination Ratio |
|---|
| 9:1 | 4:1 | 3:1 | 2:1 | 1:1 | 1:2 | 1:3 | 1:4 | 1:9 |
|---|
| Fcal | F (95%) | Fcal | F (95%) | Fcal | F (95%) | Fcal | F (95%) | Fcal | F (95%) | Fcal | F (95%) | Fcal | F (95%) | Fcal | F (95%) | Fcal | F (95%) |
|---|
| 4:5 | 0.6 | 4.82 | - | - | 1.9 | 4.82 | - | - | 74 | 4.82 | - | - | 0.1 | 4.82 | - | - | 4.0 | 4.82 |
| 4:2 | - | - | - | - | - | - | - | - | 0.2 | 4.82 | 0.1 | 4.82 | - | - | 0.1 | 4.82 | 0.2 | 4.82 |
| 4:1 | 3.3 | 4.82 | 0.8 | 4.82 | - | - | 1.9 | 4.82 | - | - | 0.3 | 4.82 | - | - | - | - | - | - |
| 1:2 | - | - | - | - | 6.6 | 8.84 | - | - | 123 | 6.04 | - | - | - | - | - | - | 16.9 | 8.84 |
| 1:5 | - | - | - | - | 1.8 | 4.82 | - | - | 0.1 | 6.04 | - | - | - | - | - | - | - | - |
| 5:10 | - | - | - | - | 3.8 | 4.82 | - | - | 3.6 | 6.04 | - | - | 5.0 | 6.16 | - | - | - | - |
| 4:10 | - | - | - | - | 0.1 | 4.82 | - | - | 0.3 | 4.82 | - | - | 2.8 | 4.82 | - | - | - | - |
| 1:10 | - | - | - | - | 0.1 | 6.04 | - | - | 1.5 | 4.82 | - | - | 2.3 | 4.82 | - | - | - | - |
| 11:6 | - | - | - | - | 0.1 | 4.82 | - | - | 0.0 | 4.82 | - | - | 0.7 | 4.82 | - | - | - | - |
| 11:1 | - | - | - | - | 0.1 | 4.82 | - | - | 0.1 | 4.82 | - | - | 0.1 | 4.82 | - | - | - | - |
| 11:4 | - | - | - | - | 1.3 | 4.82 | - | - | 0.9 | 4.82 | - | - | 0.4 | 4.82 | - | - | - | - |
| 11:7 | - | - | - | - | 0.1 | 4.82 | - | - | 0.4 | 4.82 | - | - | - | - | - | - | - | - |
| 11:9 | - | - | - | - | 0.6 | 6.04 | - | - | 0.4 | 6.04 | - | - | 0.1 | 6.04 | - | - | - | - |
| 11:16 | - | - | - | - | 0.1 | 4.82 | - | - | 0.0 | 4.82 | - | - | 0.5 | 4.82 | - | - | - | - |
Table 7.
Comparison of the additive and experimental regression lines for complex mixtures of compounds with the F-distribution (α = 0.05) to distinguish two regression lines (if Fcal > F there is a significant difference).
Table 7.
Comparison of the additive and experimental regression lines for complex mixtures of compounds with the F-distribution (α = 0.05) to distinguish two regression lines (if Fcal > F there is a significant difference).
| Combination Ratio | Mixture of Compound |
|---|
| 11:Dʹʹ | 11:Eʹʹ | 11:Eʹ | 11:Fʹ | 11:Gʹ | 11:Hʹ | 11:Iʹ |
|---|
| Fcal | F (95%) | Fcal | F (95%) | Fcal | F (95%) | Fcal | F (95%) | Fcal | F (95%) | Fcal | F (95%) | Fcal | F (95%) |
|---|
| 1:1 | 0.1 | 4.82 | - | - | 1.3 | 6.04 | - | - | - | - | 0.0 | 4.82 | - | - |
| 1:2 | - | - | 0.1 | 4.82 | - | - | - | - | 0.1 | 4.82 | - | - | 0.1 | 4.82 |
| 1:3 | 0.1 | 4.82 | - | - | 4.4 | 4.82 | - | - | - | - | 0.36 | 4.82 | - | - |
| 1:4 | - | - | - | - | - | - | 0.8 | 8.84 | - | - | - | - | - | - |
| 1:6 | - | - | - | - | - | - | - | - | 0.1 | 4.82 | - | - | 0.1 | 4.82 |
| 1:7 | - | - | 0.1 | 4.82 | - | - | - | - | - | - | - | - | - | - |
| 1:9 | 0.1 | 4.82 | - | - | 0.9 | 6.04 | - | - | - | - | 0.1 | 4.82 | - | - |
| 1:13 | - | - | - | - | - | - | 0.4 | 4.82 | - | - | - | - | - | - |
| 1:19 | - | - | - | - | - | - | - | - | 0.0 | 4.82 | - | - | 0.8 | 4.82 |
| 1:24 | - | - | 0.5 | 4.82 | - | - | - | - | - | - | - | - | - | - |
| 1:32 | - | - | - | - | - | - | 0.4 | 4.82 | - | - | - | - | - | - |
For all of the combinations tested, the types of interaction in the isobolograms (ED
50 or ED
25) remain constant over different ranges of measured effects. Exceptions to this behavior are the combinations nobiletin (
4)/sinensetin (
5) in a 1:1 ratio and the combination tetra-
O-methylscutellarein (
1)/6,7,8,3′,4′-pentamethoxyflavone (
2) in the ratios 1:1 and 1:9, where these interactions were not constant for different ranges of measured effects in the isobolograms (ED
50 or ED
25) (
Table 4). The additive and experimental regression lines for these binary mixtures in the aforementioned ratios are shown in
Figure 17,
Figure 18 and
Figure 19.
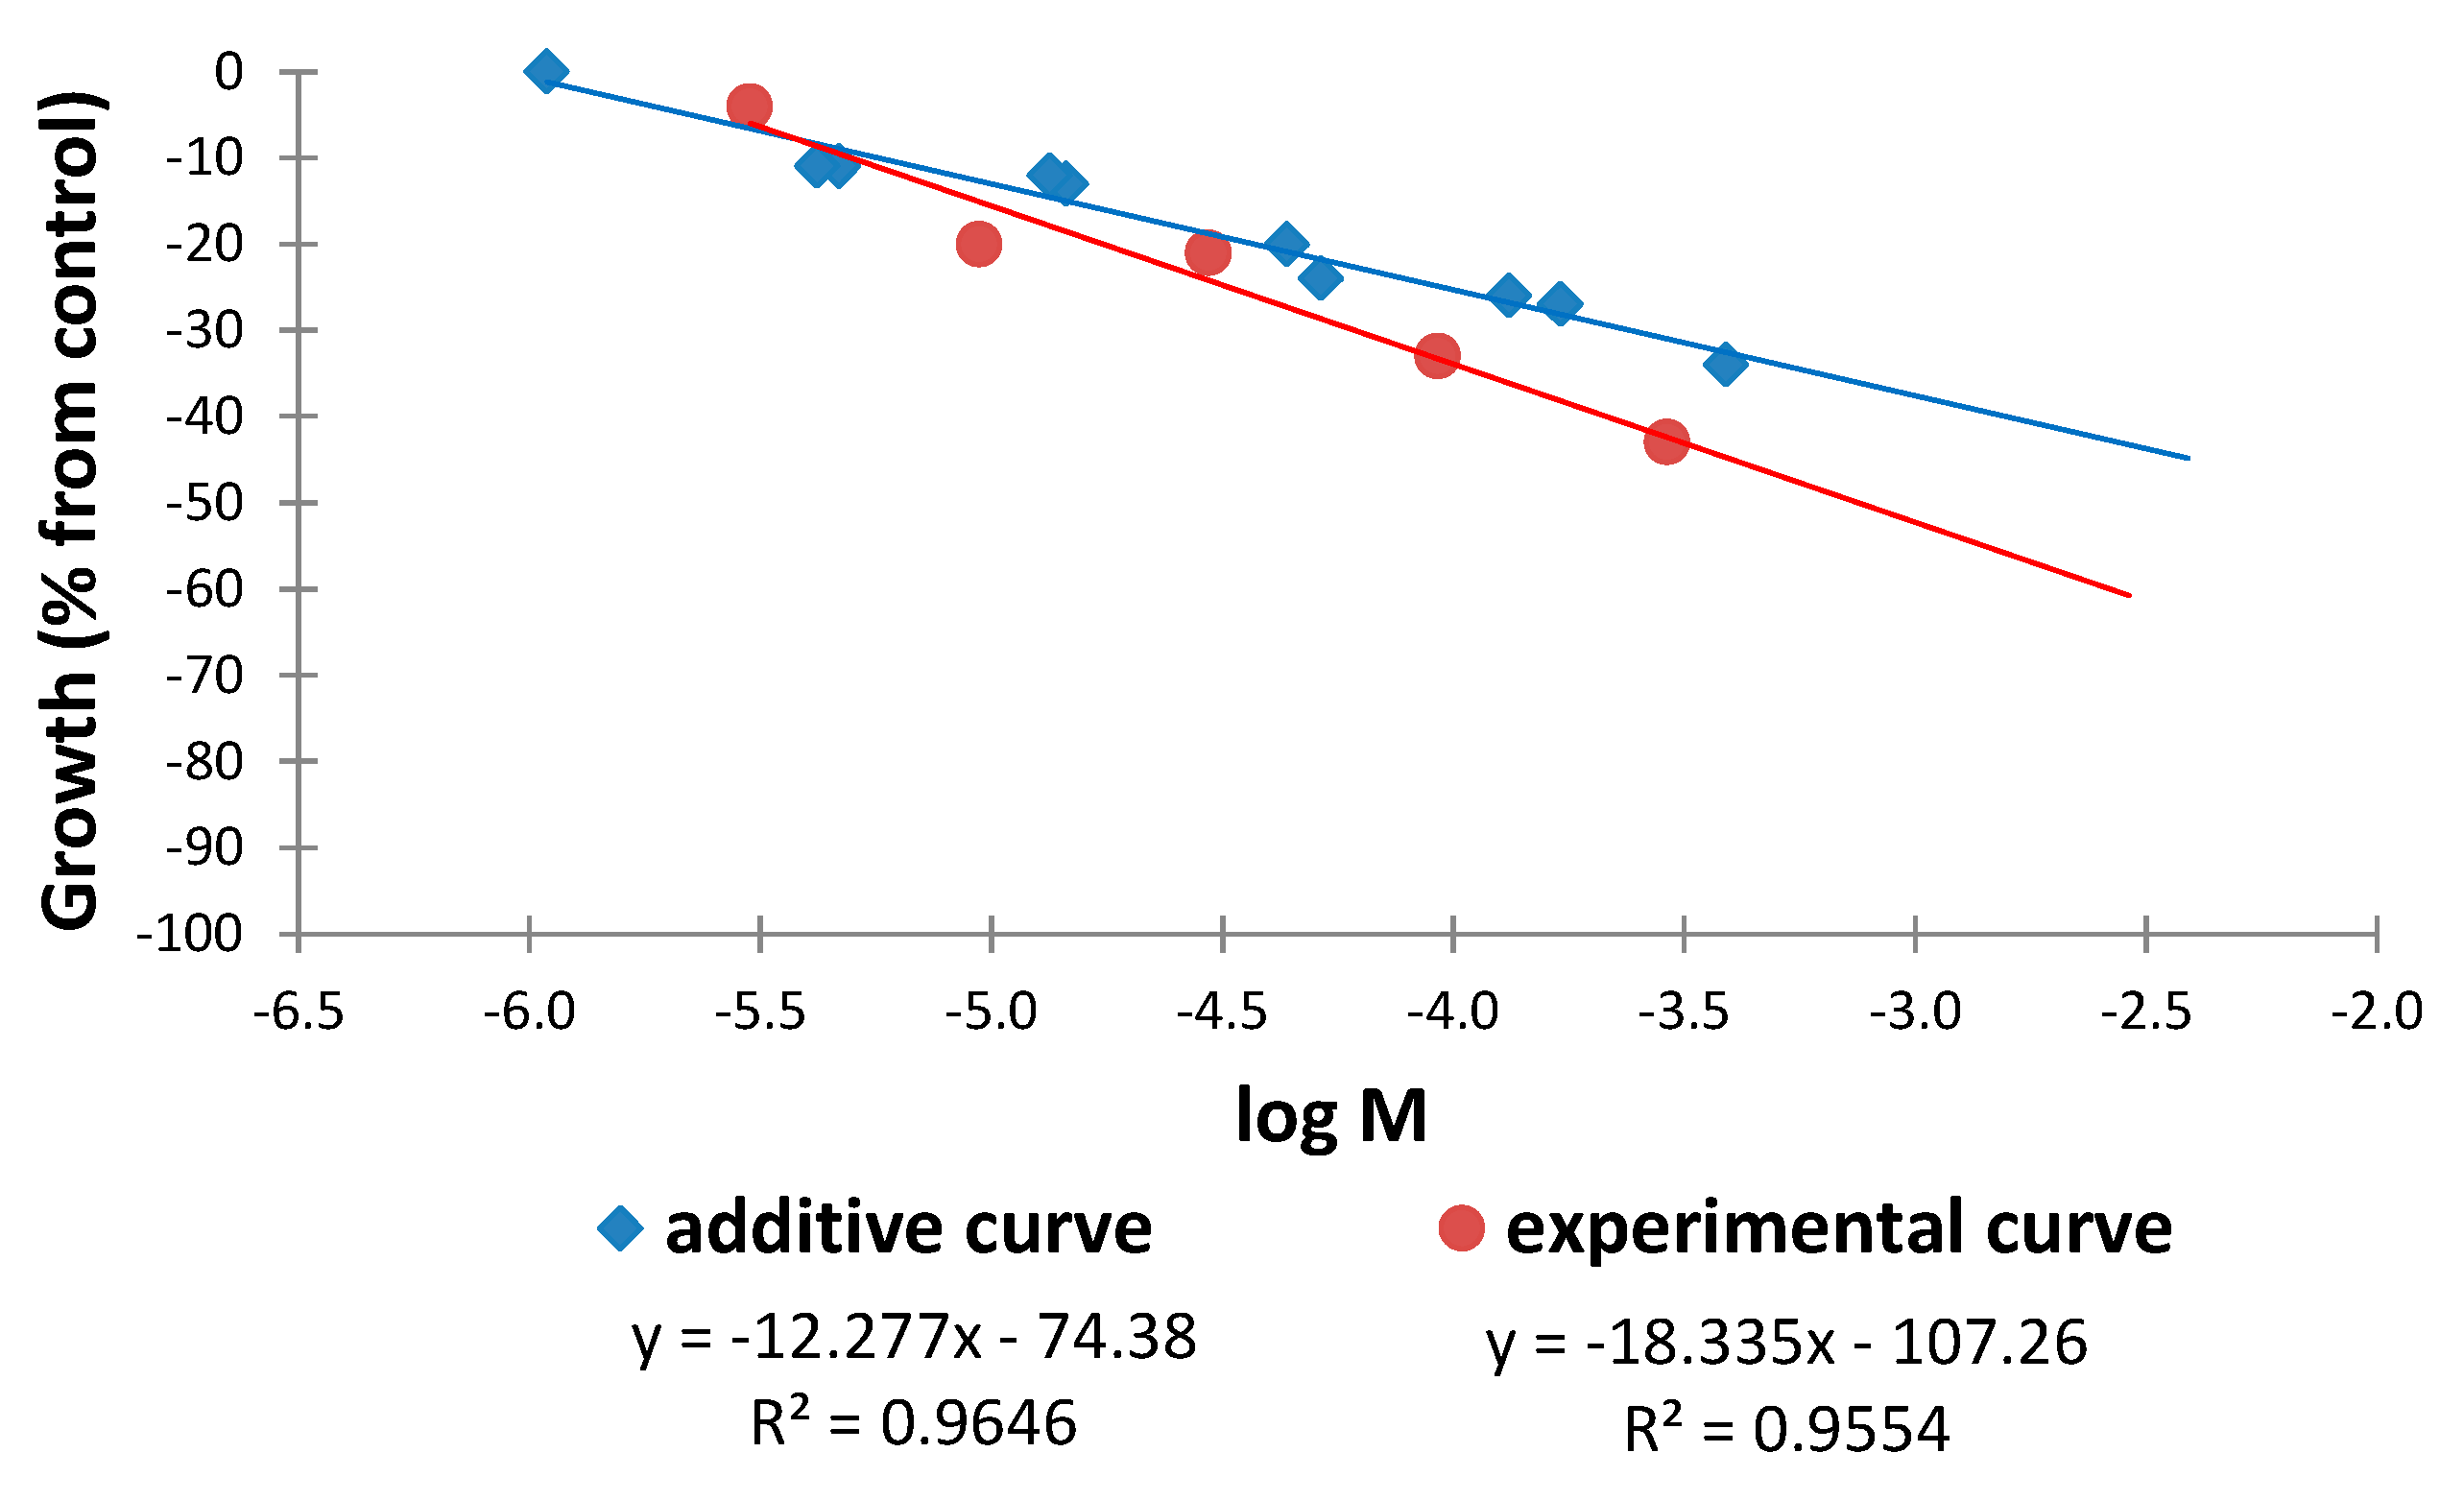
The additive and experimental regression lines for the combination nobiletin (
4)/sinensetin (
5) in a 1:1 ratio is shown in
Figure 17. It can be observed that with increasing doses of the combination, for the same effect level, the experimental curve shows a smaller dose than the additive curve and that the distance between these lines increases at higher doses. This divergence indicates that a synergistic interaction was detected for this combination in the isobologram (ED
25) and it is accentuated at higher doses.
Figure 17.
Comparison of the additive and experimental regression lines for the combination nobiletin (4)/sinensetin (5) in a 1:1 ratio.
Figure 17.
Comparison of the additive and experimental regression lines for the combination nobiletin (4)/sinensetin (5) in a 1:1 ratio.
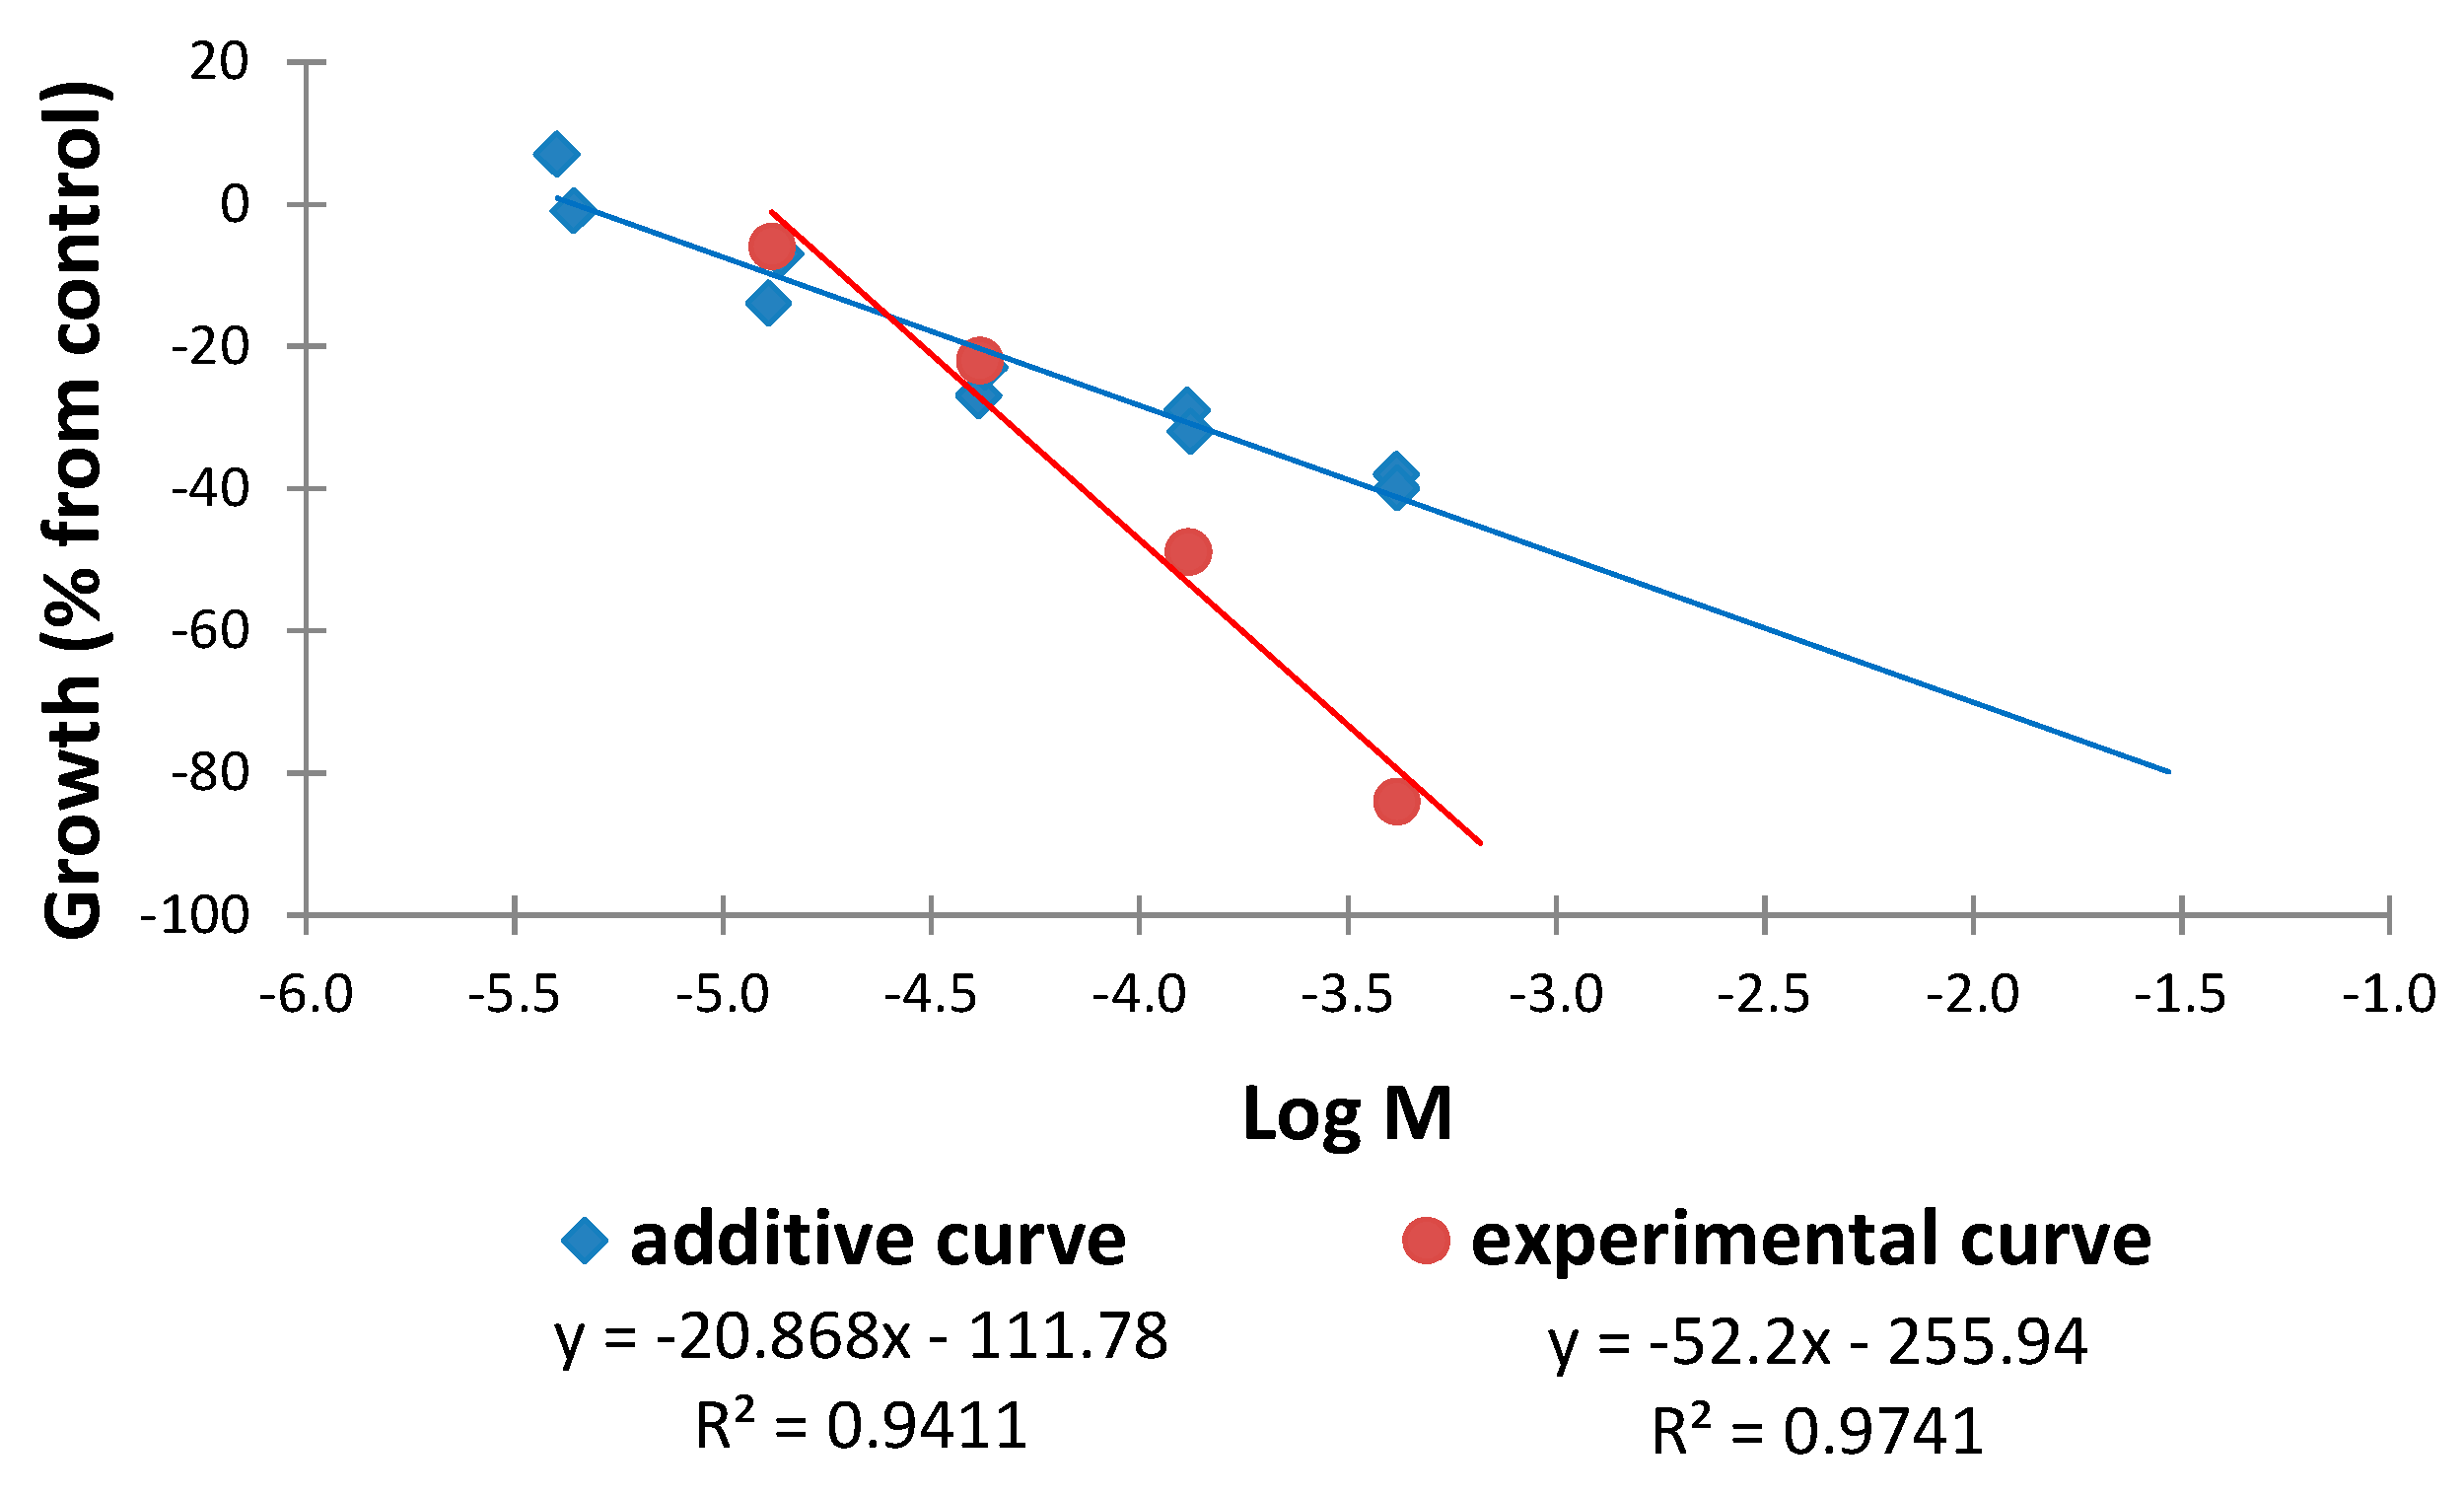
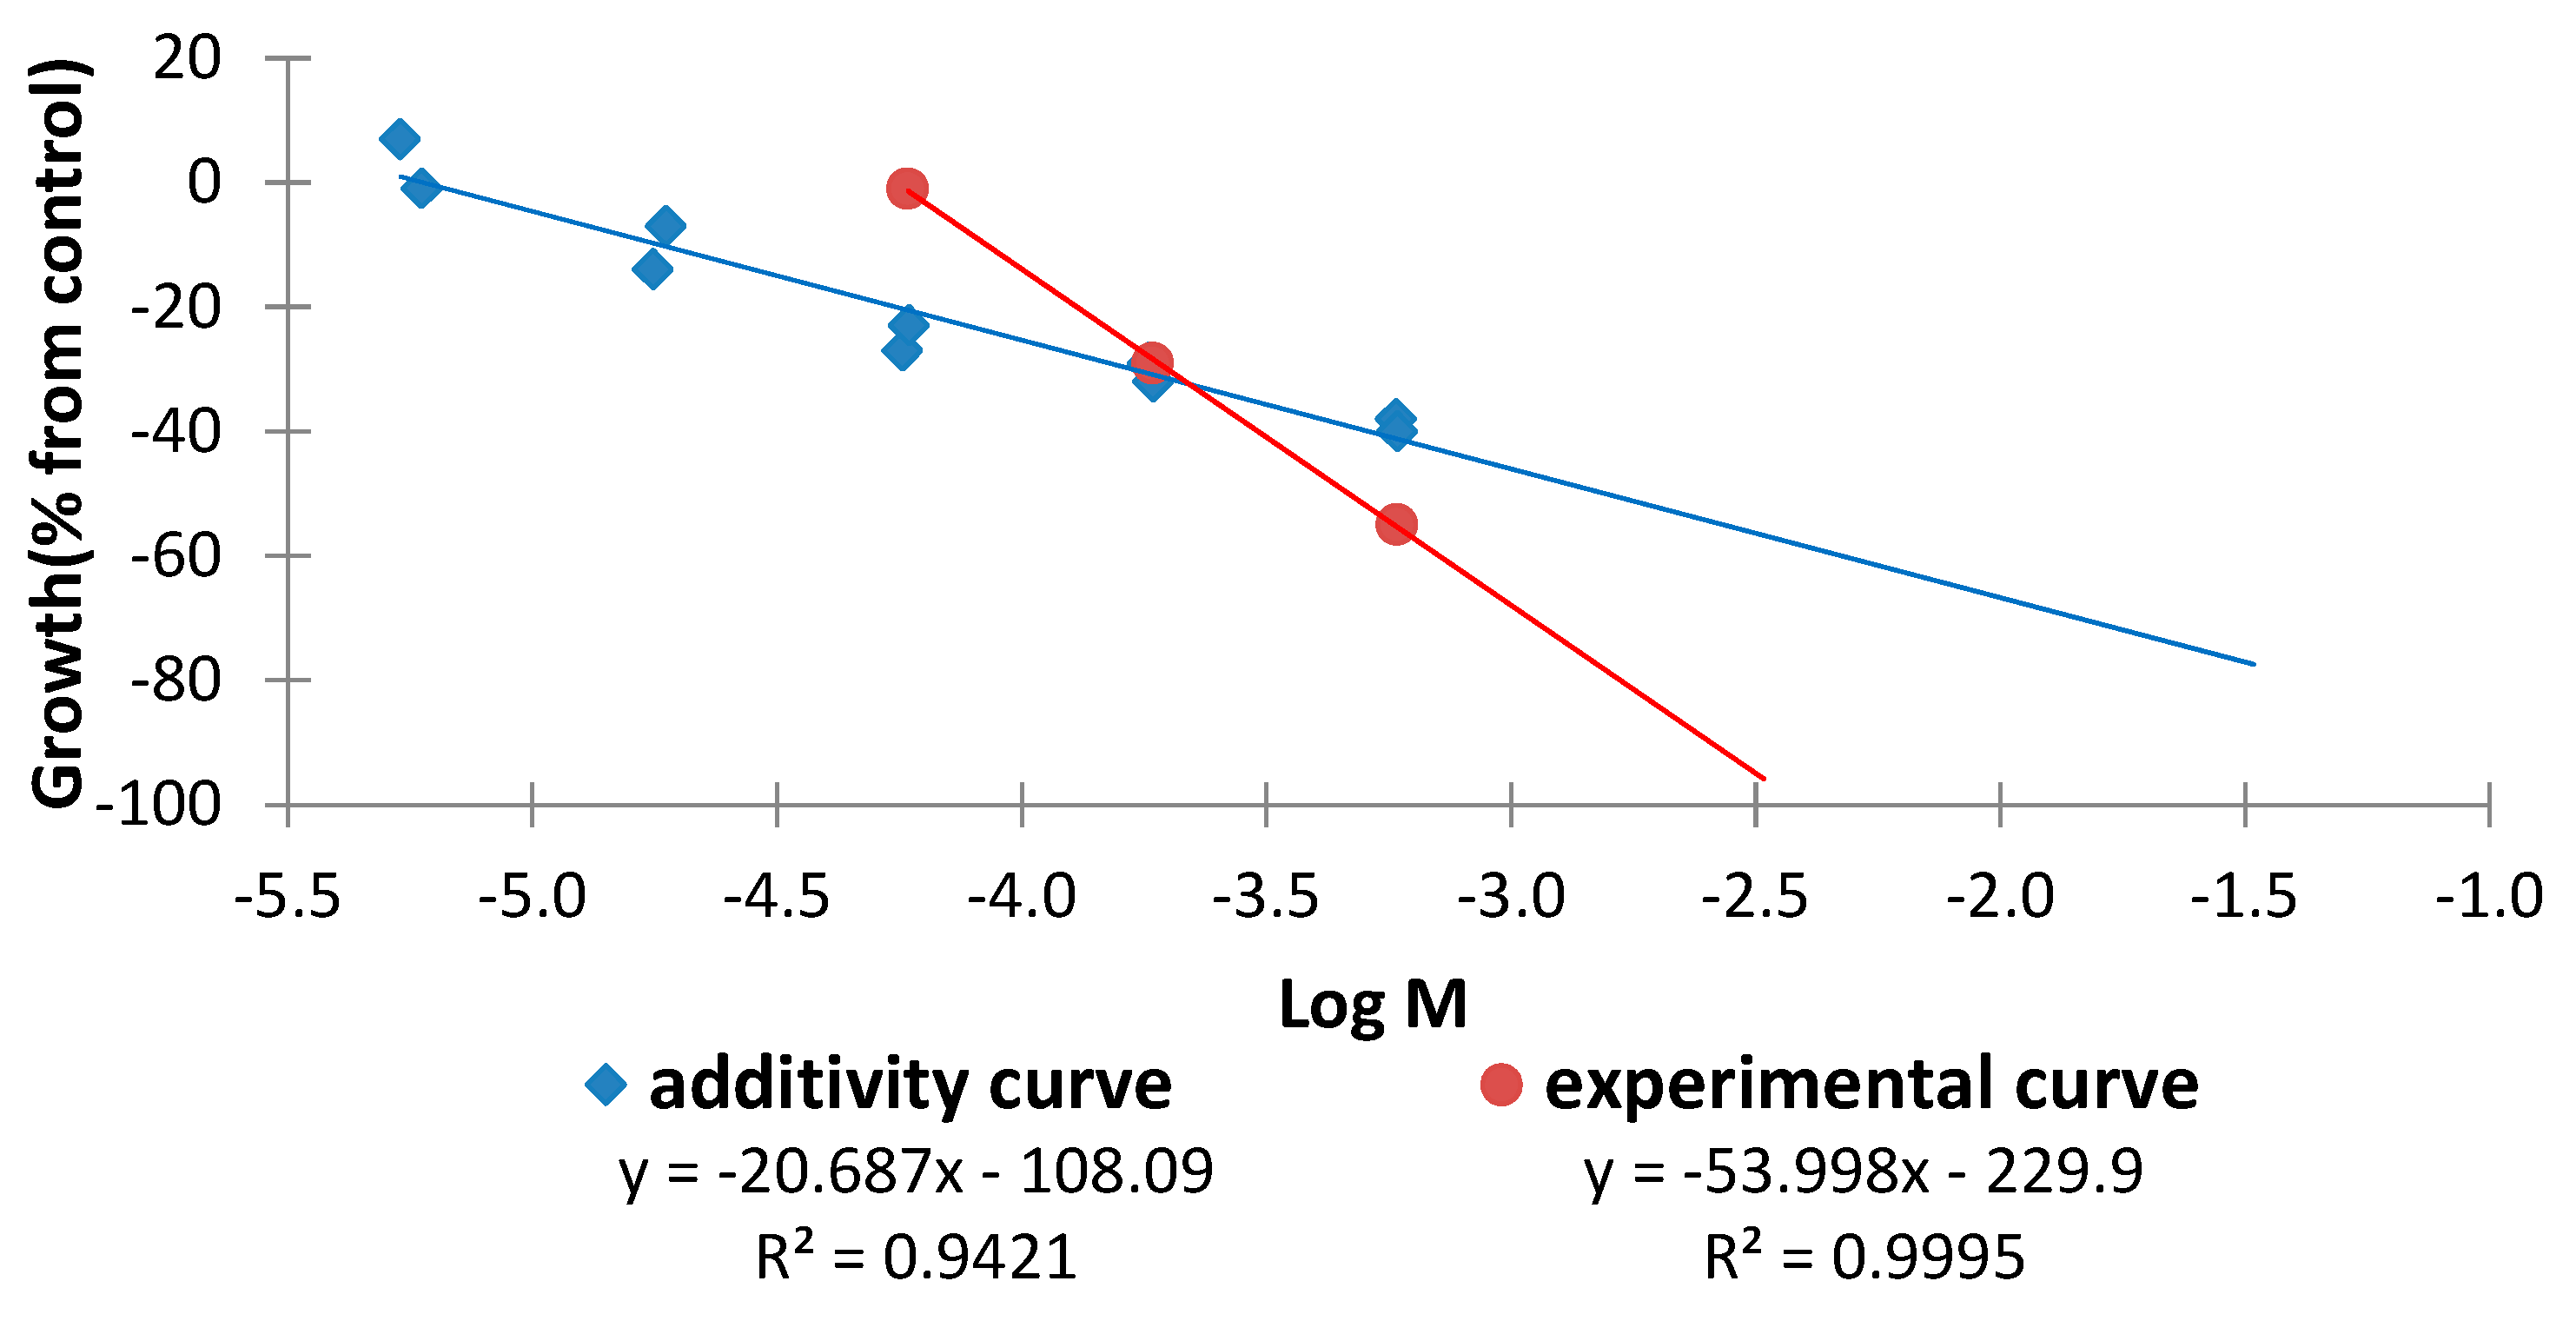
Similarly, the results for the combinations tetra-
O-methylscutellarein (
1)/6,7,8,3′,4′-pentamethoxyflavone (
2) in 1:1 and 1:9 ratios are represented in
Figure 18 and
Figure 19. It can be observed for the 1:1 ratio that increasing doses of the combination, for the same effect level, lead to a smaller dose for the experimental curve than for the additive curve and the distance between the curves increases at higher doses. This finding indicates that a synergistic effect is in operation and at higher doses the difference is more marked. It is noteworthy that for the 1:9 ratio an antagonist interaction is detected in the sobologram (ED
25) but this changes to a synergistic effect at higher doses. Once again, this interaction is more pronounced at higher doses (
Figure 19).
Figure 18.
Comparison of the additive and experimental regression lines for the combination tetra-O-methylscutellarein (1)/6,7,8,3′,4′-pentamethoxyflavone (2) in a 1:1 ratio.
Figure 18.
Comparison of the additive and experimental regression lines for the combination tetra-O-methylscutellarein (1)/6,7,8,3′,4′-pentamethoxyflavone (2) in a 1:1 ratio.
Figure 19.
Comparison of the additive and experimental regression lines for the combination tetra-O-methylscutellarein (1)/6,7,8,3′,4′-pentamethoxyflavone (2) in a 1:9 ratio.
Figure 19.
Comparison of the additive and experimental regression lines for the combination tetra-O-methylscutellarein (1)/6,7,8,3′,4′-pentamethoxyflavone (2) in a 1:9 ratio.
In the three cases where there are differences between the theoretical and the experimental curves, the type of effect observed at higher doses is synergistic and this increases in magnitude with increasing dose. This phenomenon, together with other additive and synergistic effects, is maintained at high doses in different binary combinations of compounds (
Table 4) and these are higher than the cases in which antagonism is observed at high doses. These findings may contribute to explain the slight variations observed at higher doses in the activity profiles in the wheat coleoptile bioassays, which highlighted the most bioactive fractions (D, E′, G′, H′, D′′ and E′′) obtained from the different extracts of by-products from
Citrus sinensis (
Figure 3,
Figure 4 and
Figure 5).


