
Characterization of Amorphous and Co-Amorphous Simvastatin Formulations Prepared by Spray Drying

 , , and
Abstract
:
1. Introduction

2. Results and Discussion
2.1. SVS Solubility in Water in the Presence of Solubilizers

| Solubilizer (%, m/V) | Soluplus | Tween 20 | SLS | Pluronic | PVP |
|---|---|---|---|---|---|
| 0 | 1.74 ± 0.19 | 1.74 ± 0.19 | 1.74 ± 0.19 | 1.74 ± 0.19 | 1.74 ± 0.19 |
| 0.5 | 27.3 ± 2.5 | 221.4 ± 33.6 | 2102 ± 571 | 2.40 ± 0.39 | 2.36 ± 0.24 |
| 1 | 53.0 ± 5.6 | 447 ± 114 | 5179 ± 2052 | 2.37 ± 0.45 | 1.99 ± 0.22 |
| 2 | 112 ± 7 | 779 ± 4 | 13599 ± 1351 | 5.39 ± 0.87 | 3.93 ± 1.10 |
| 5 | 260 ± 34 | 2198 ± 641 | 24338 ± 864 | 5.57 ± 1.16 | 4.52 ± 0.83 |
2.2. Preparation of Co-Amorphous Materials by Spray Drying
| Spray Drying Conditions | ||||||
|---|---|---|---|---|---|---|
| Formulation | Exact Amount of Every Component | Weight Ratios in Final Product | Tinlet (°C) | Toutlet (°C) | Pump rate (mL/min) | Yield |
| SVS-LYS from 5% Tween20 | 370.6 mg SVS 129.4 mg LYS 200 mL 5% Tween | NA | 110 | 50 | 4.3-4.7 | None |
| SVS-LYS from 5% SLS | 370.6 mg SVS 129.4 mg LYS 20 mL 5% SLS | 28.51 % SVS 9.95% LYS 61.54% SLS | 150 | 65 | 4.7 | Very low |
| SVS-LYS from 5% SLS | 370.6 mg SVS 129.4 mg LYS 20 mL 5% SLS | 24.71 % SVS 8.63% LYS 66.67% SLS | 110 | 50 | 4.3-4.7 | Low (12%) |
| SVS-LYS from 5% SLS | 370.6 mg SVS 129.4 mg LYS 16 mL 5% SLS | 28.51 % SVS 9.95% LYS 61.54% SLS | 100 | 45 | 3.9 | Satisfactory (24%) |
| SVS-LYS from 0.5% SLS | 370.6 mg SVS 129.4 mg LYS 200 mL 0.5% SLS | NA | 110 | 50 | 4.3-4.7 | Satisfactory (23%) |
| SVS from 5% SLS | 370.6 mg SVS 129.4 mg LYS 20 mL 5% SLS | 31.70 % SVS 68.30% SLS | 100 | 45 | 3.9 | Low (15%) |
2.3. Characterization of the Spray-Dried Materials
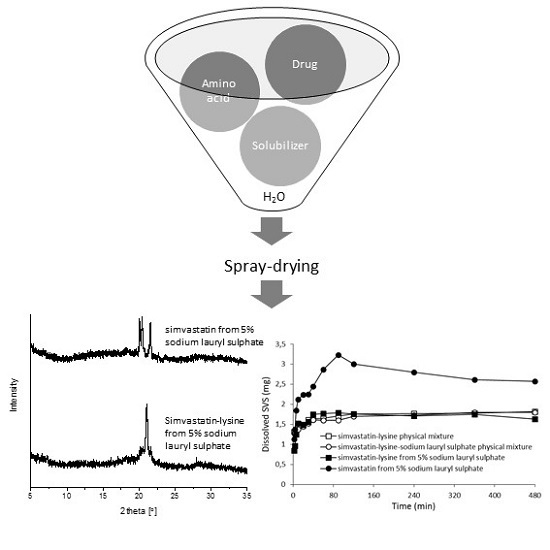
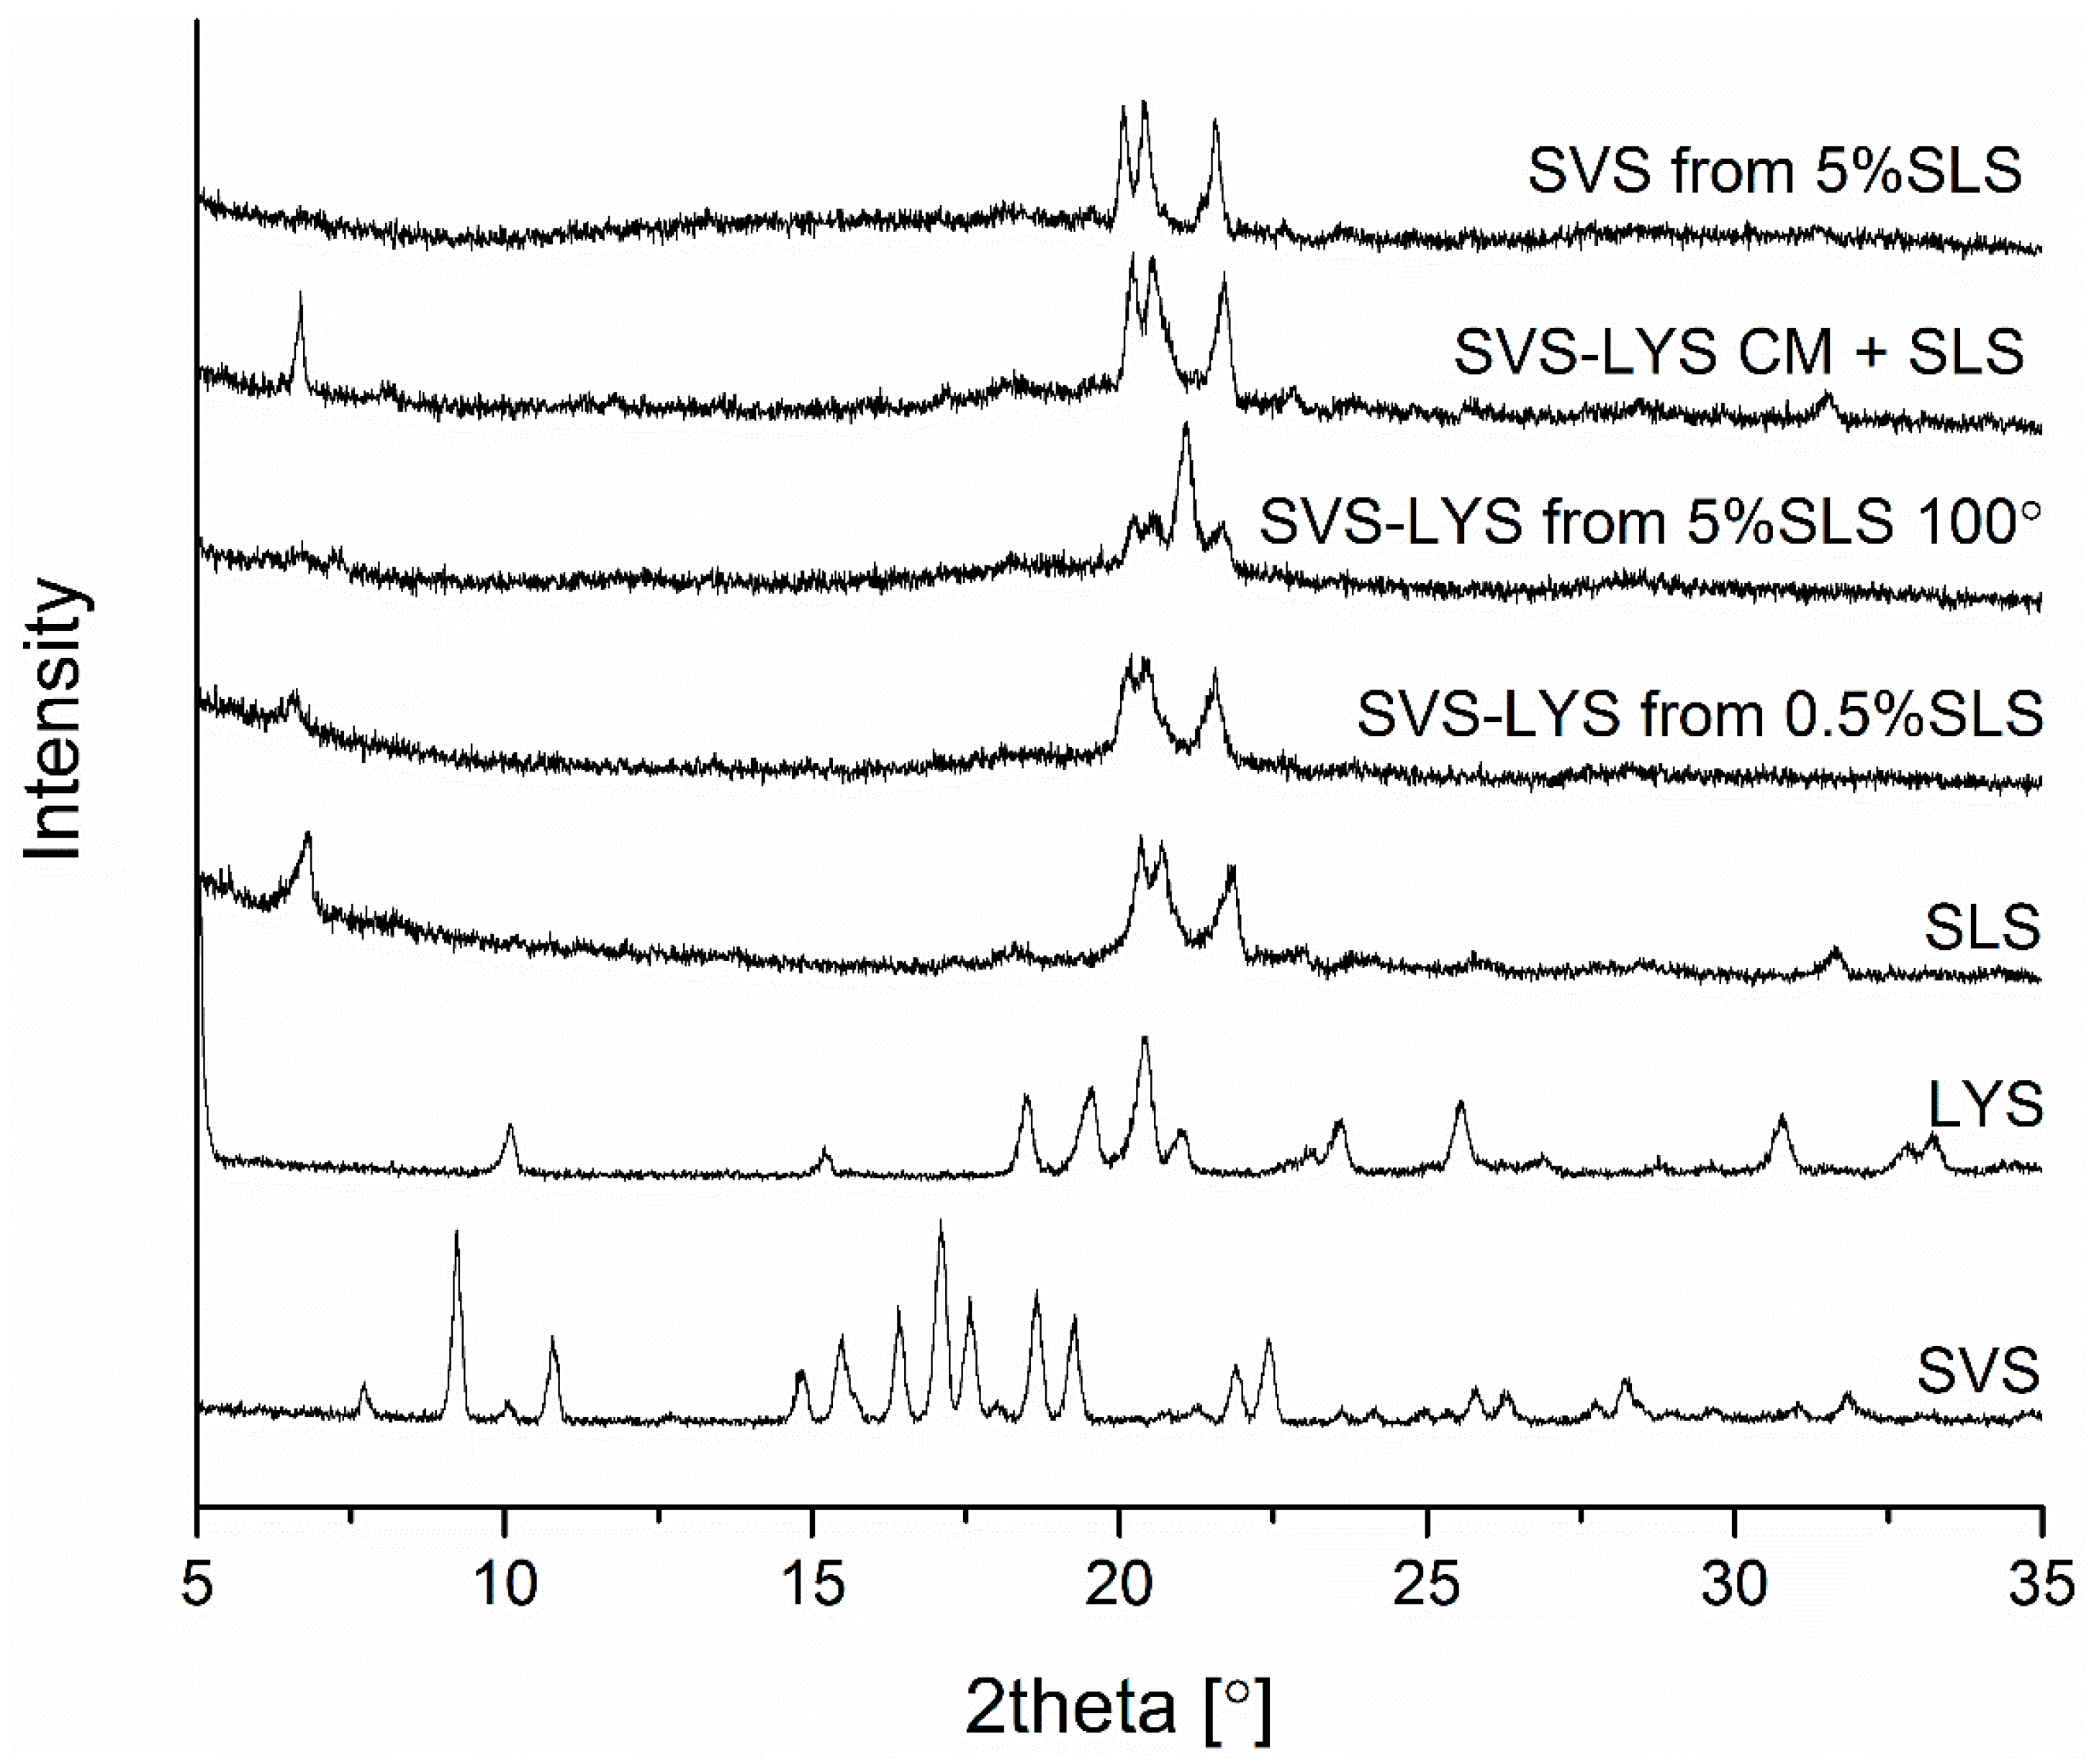
2.3.1. X-ray Powder Diffraction (XRPD)

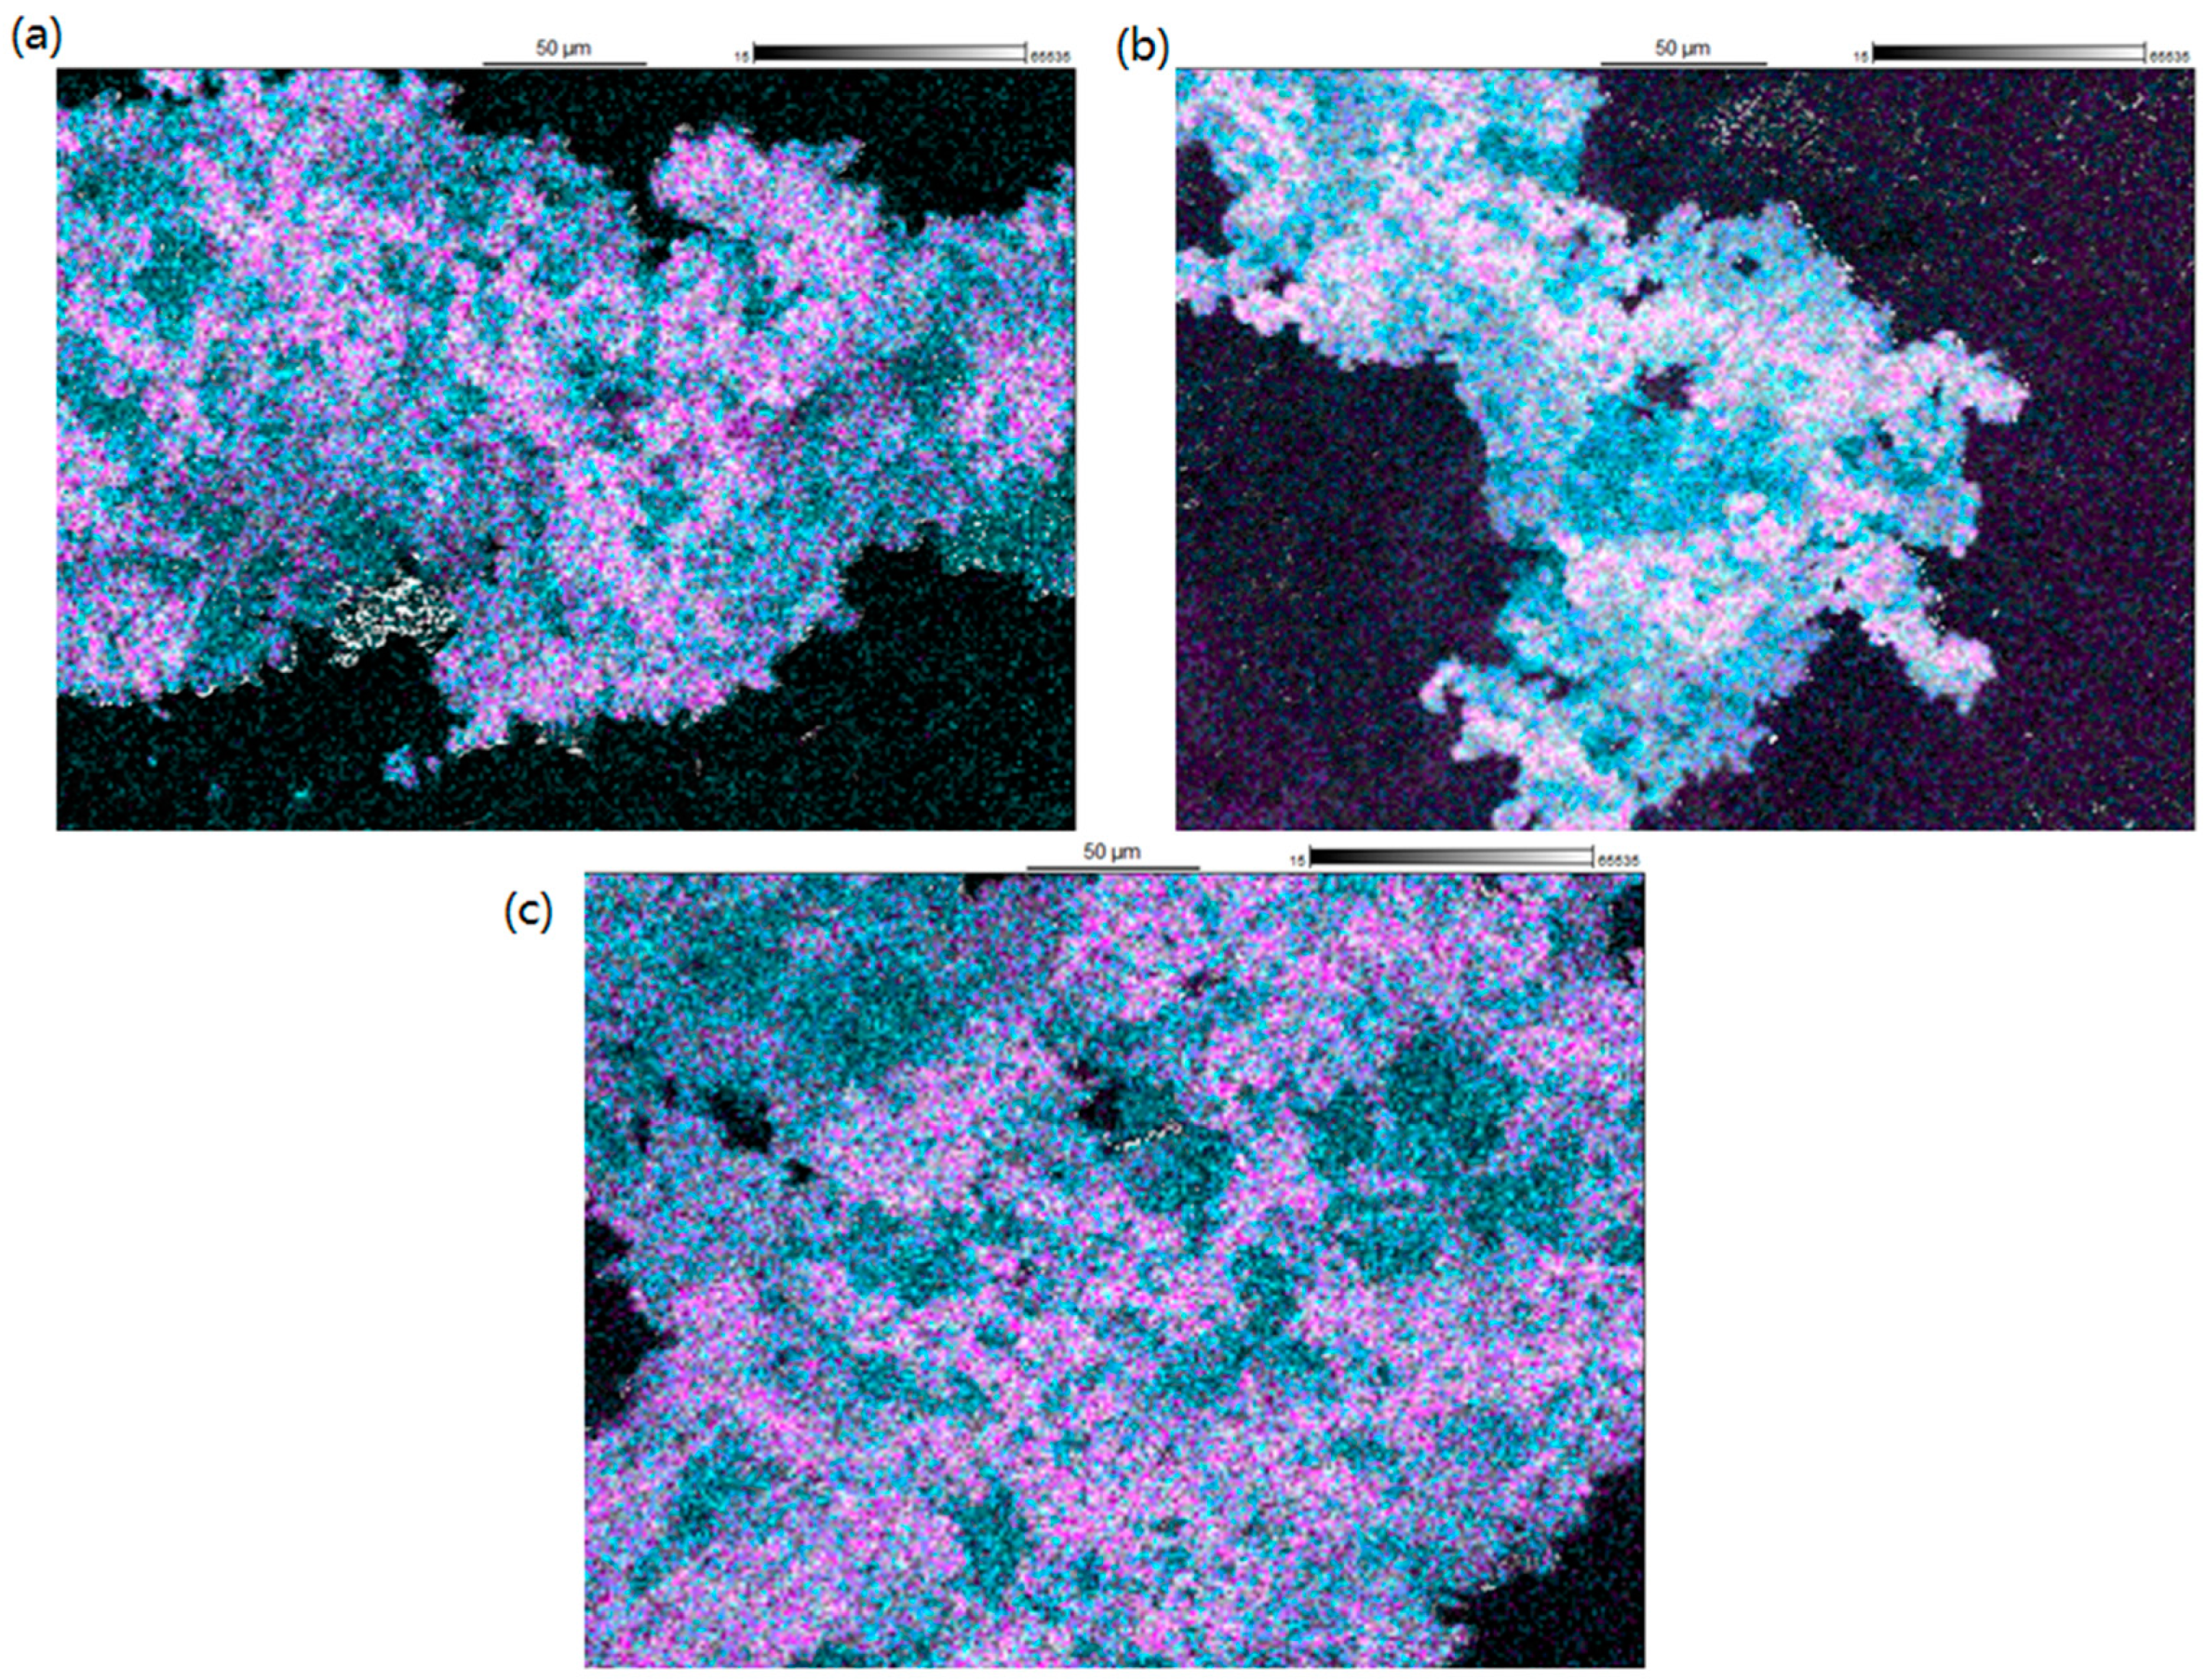
2.3.2. Particle Surface Characteristics
2.3.3. Differential Scanning Calorimetry (DSC)

| Material | Tg (°C) | Trc (°C) | Tm SVS (°C) | Tm LYS (°C) | Tm SLS (°C) |
|---|---|---|---|---|---|
| SVS a | 29.0 ± 0.6 | NA | 139.9 ± 0.2 | NA | NA |
| LYS a | 68 b | NA | NA | 212.4 ± 0.5 a | NA |
| SLS | ND | NA | NA | NA | 194.3 ± 0.5 c |
| SVS-LYS CM a | 33.2 ± 0.9 | 107.0 ± 1.2 | 134.1 ± 0.1 | 199.9 ± 3.2 | NA |
| SVS-LYS from 0.5% SLS | 23.6 ± 5.7 | 73.1 ± 0.8 | 143.7 ± 0.2 | ND | 162.9 ± 0.4 |
| SVS-LYS from 5% SLS | 26.2 ± 3.8 | 68.6 ± 9.6 | 140.6 ±1.0 | ND | 157.6 ± 0.4 |
| SVS from 5% SLS | 13.7 ± 0.6 | ND | ND | NA | 182.7 ± 0.6 |
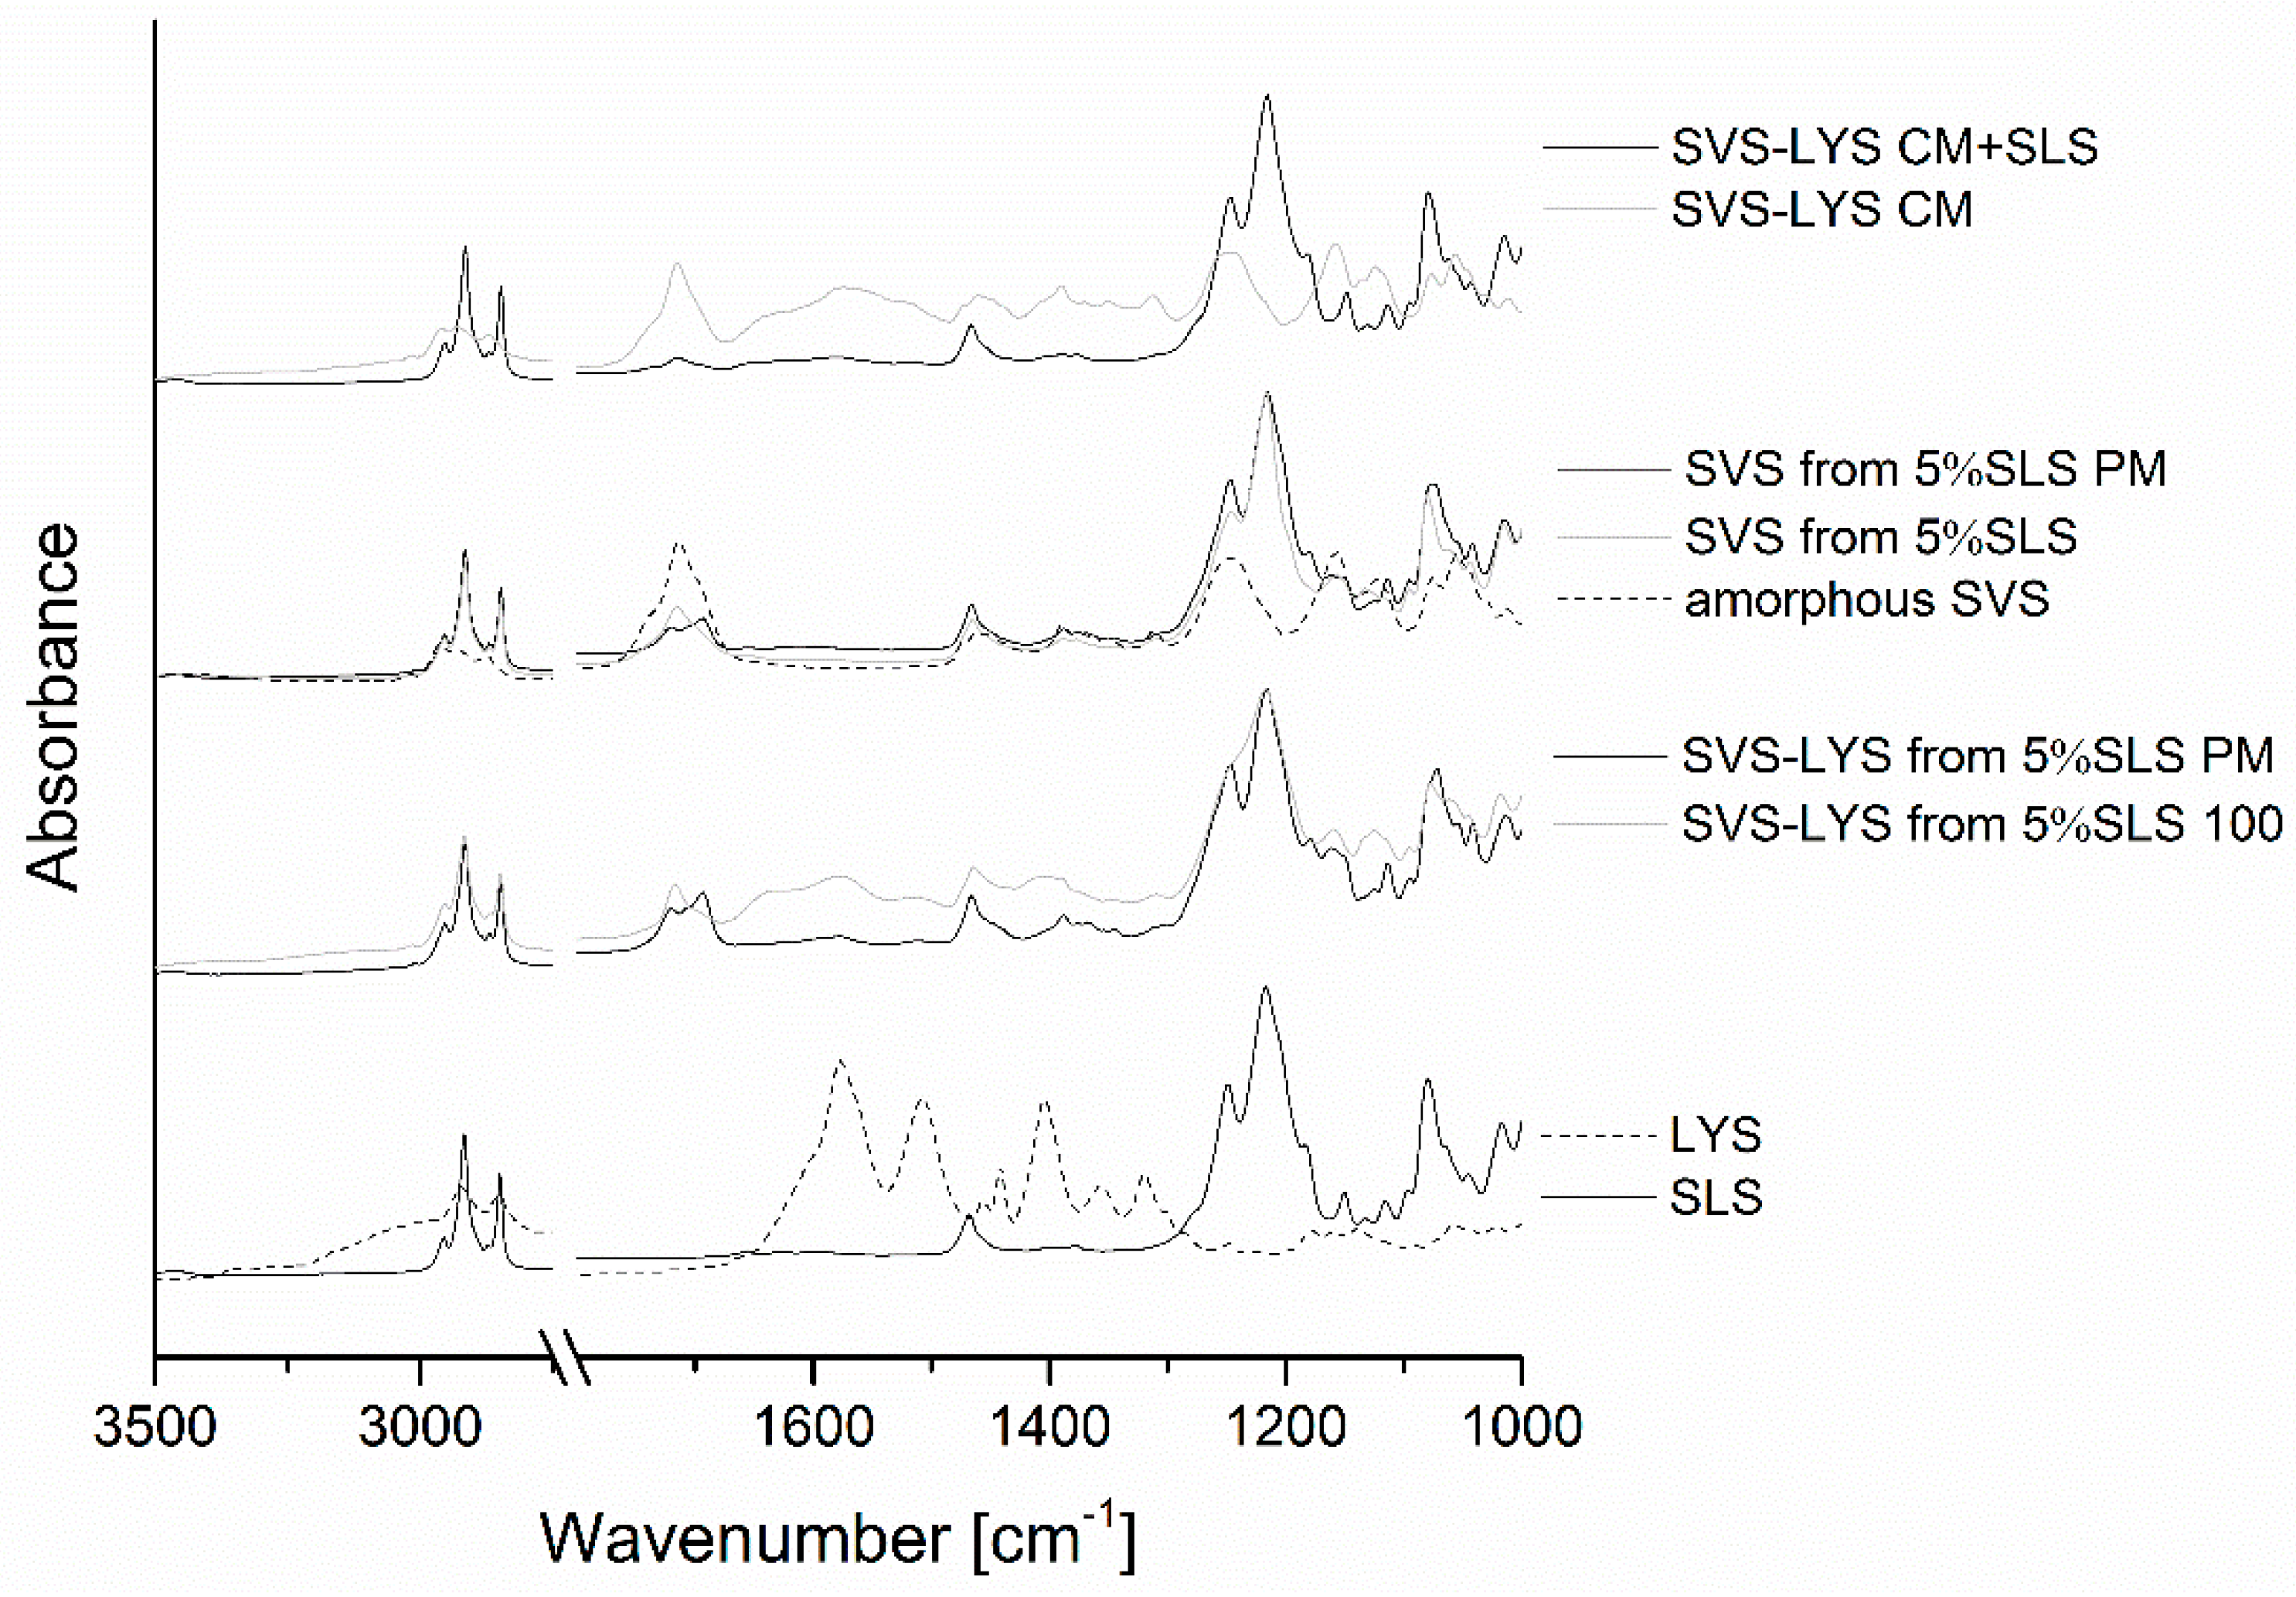
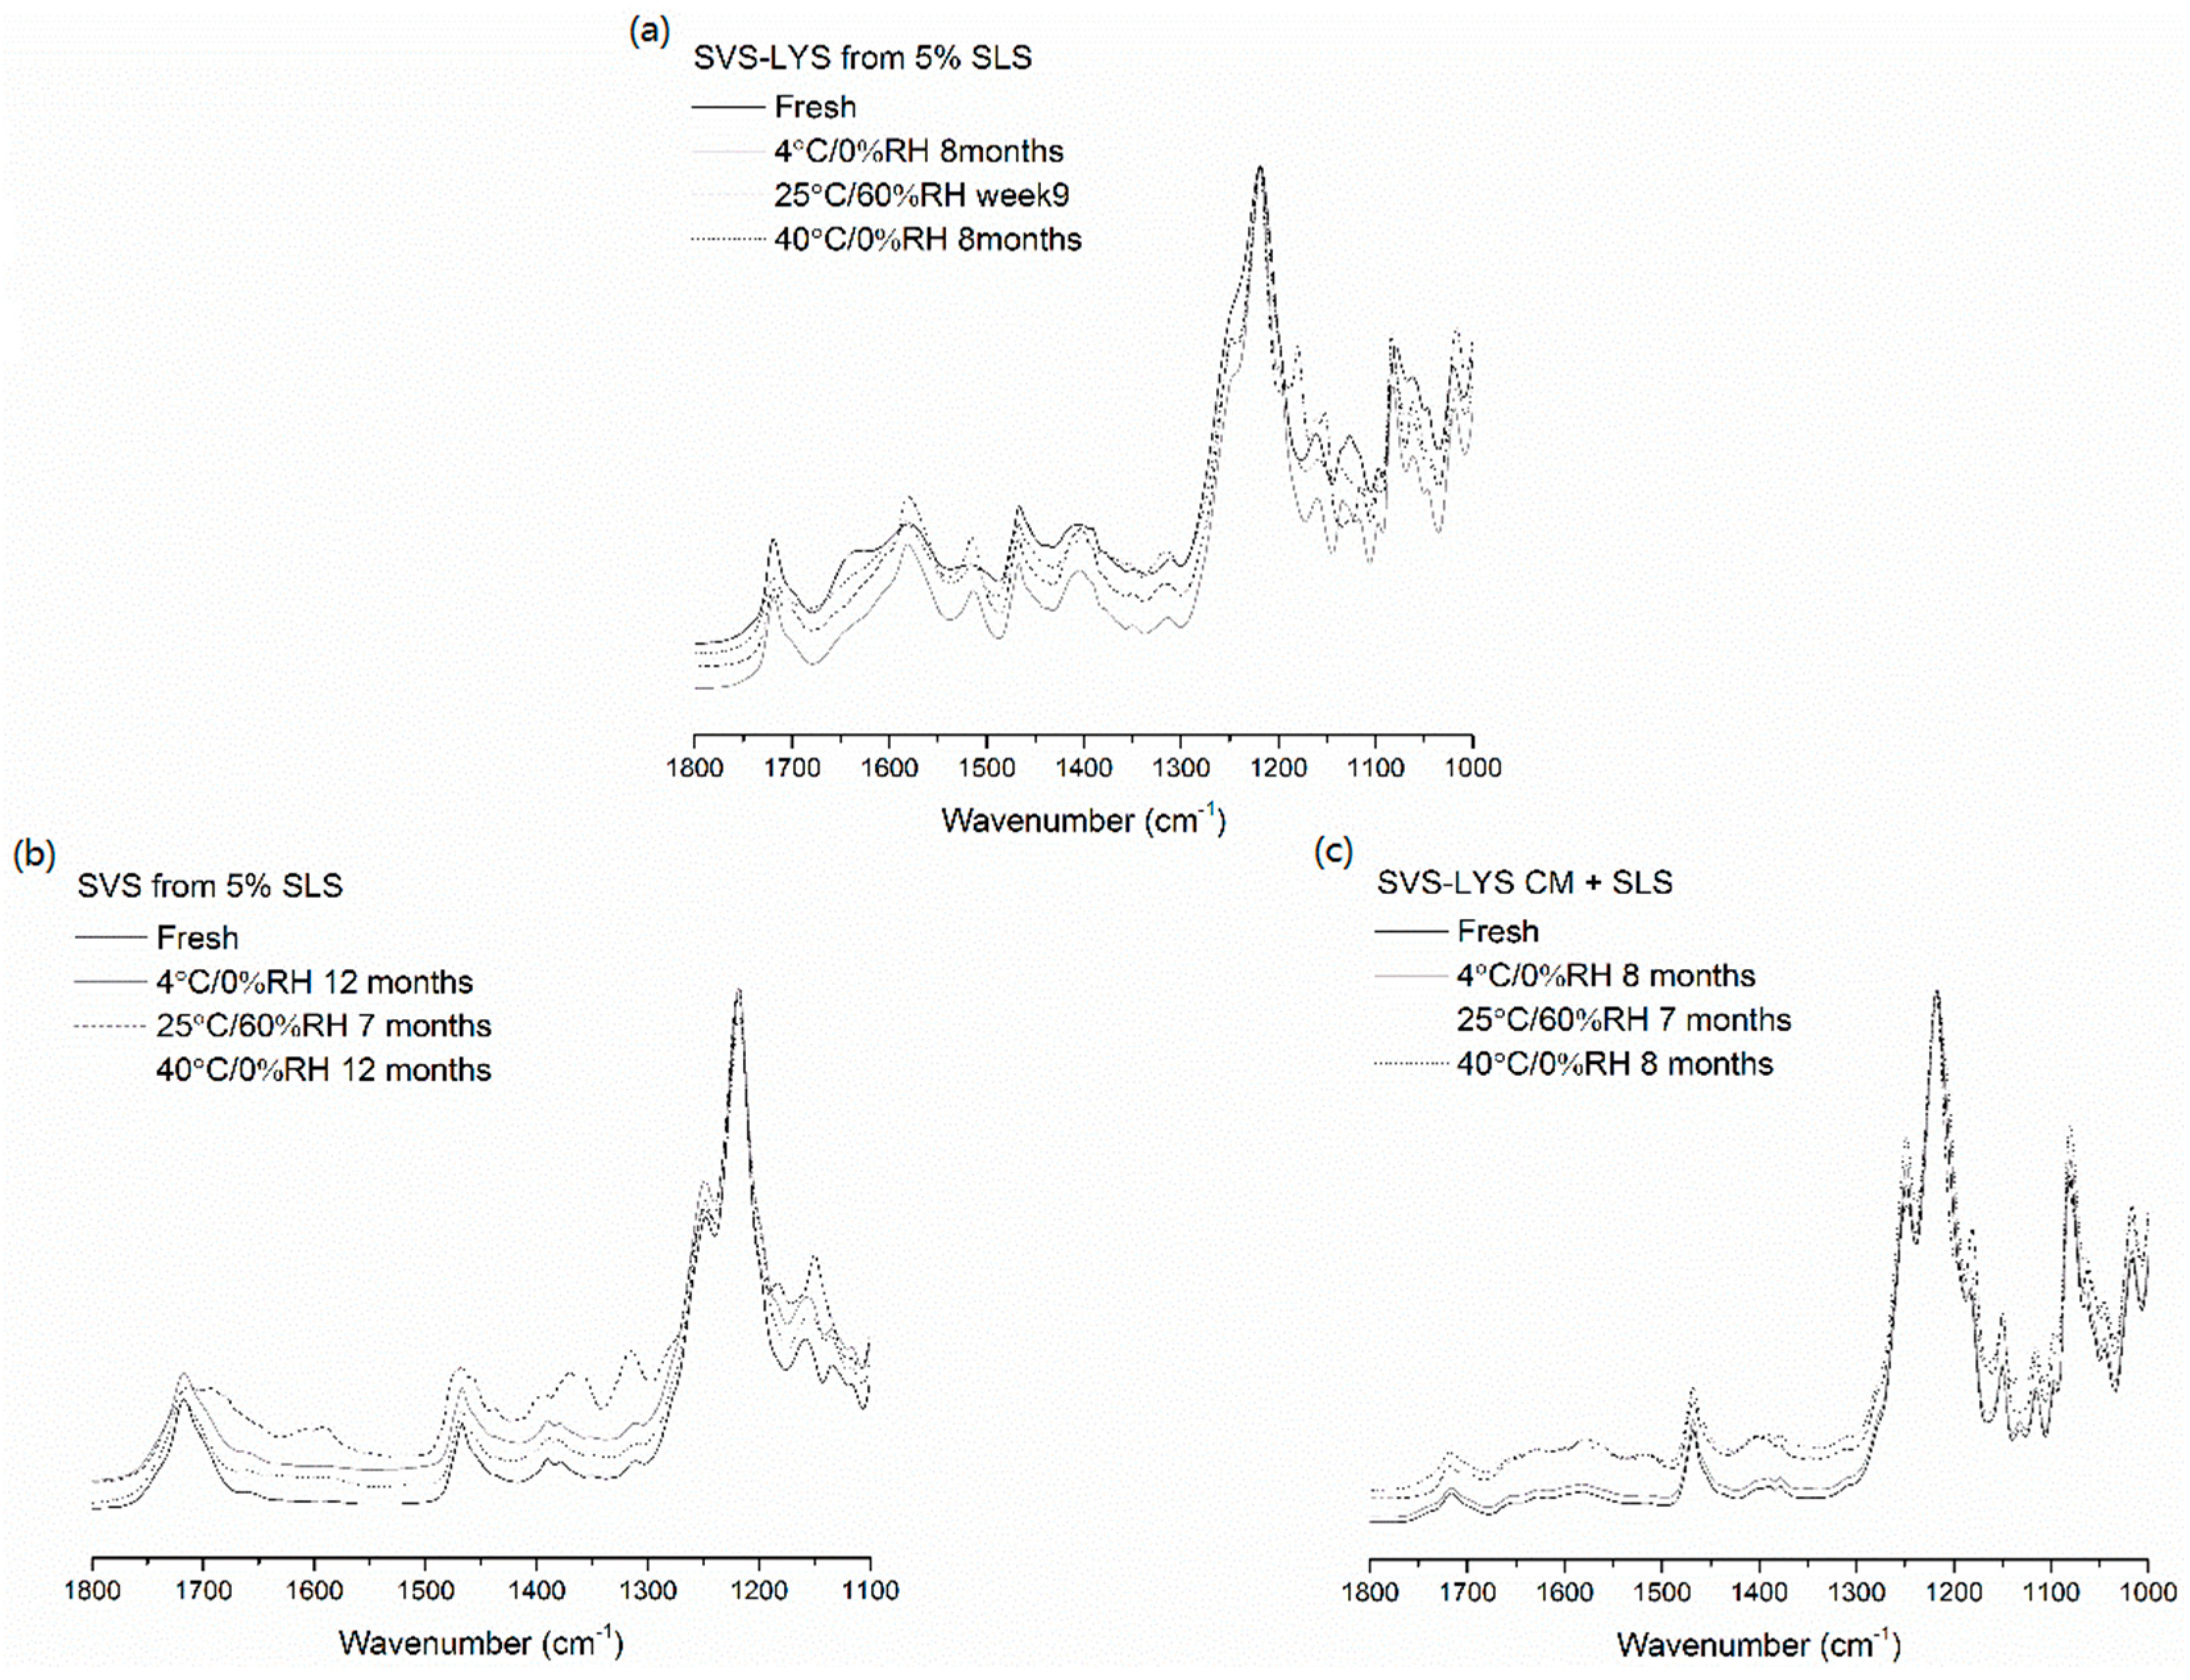
2.3.4. FTIR
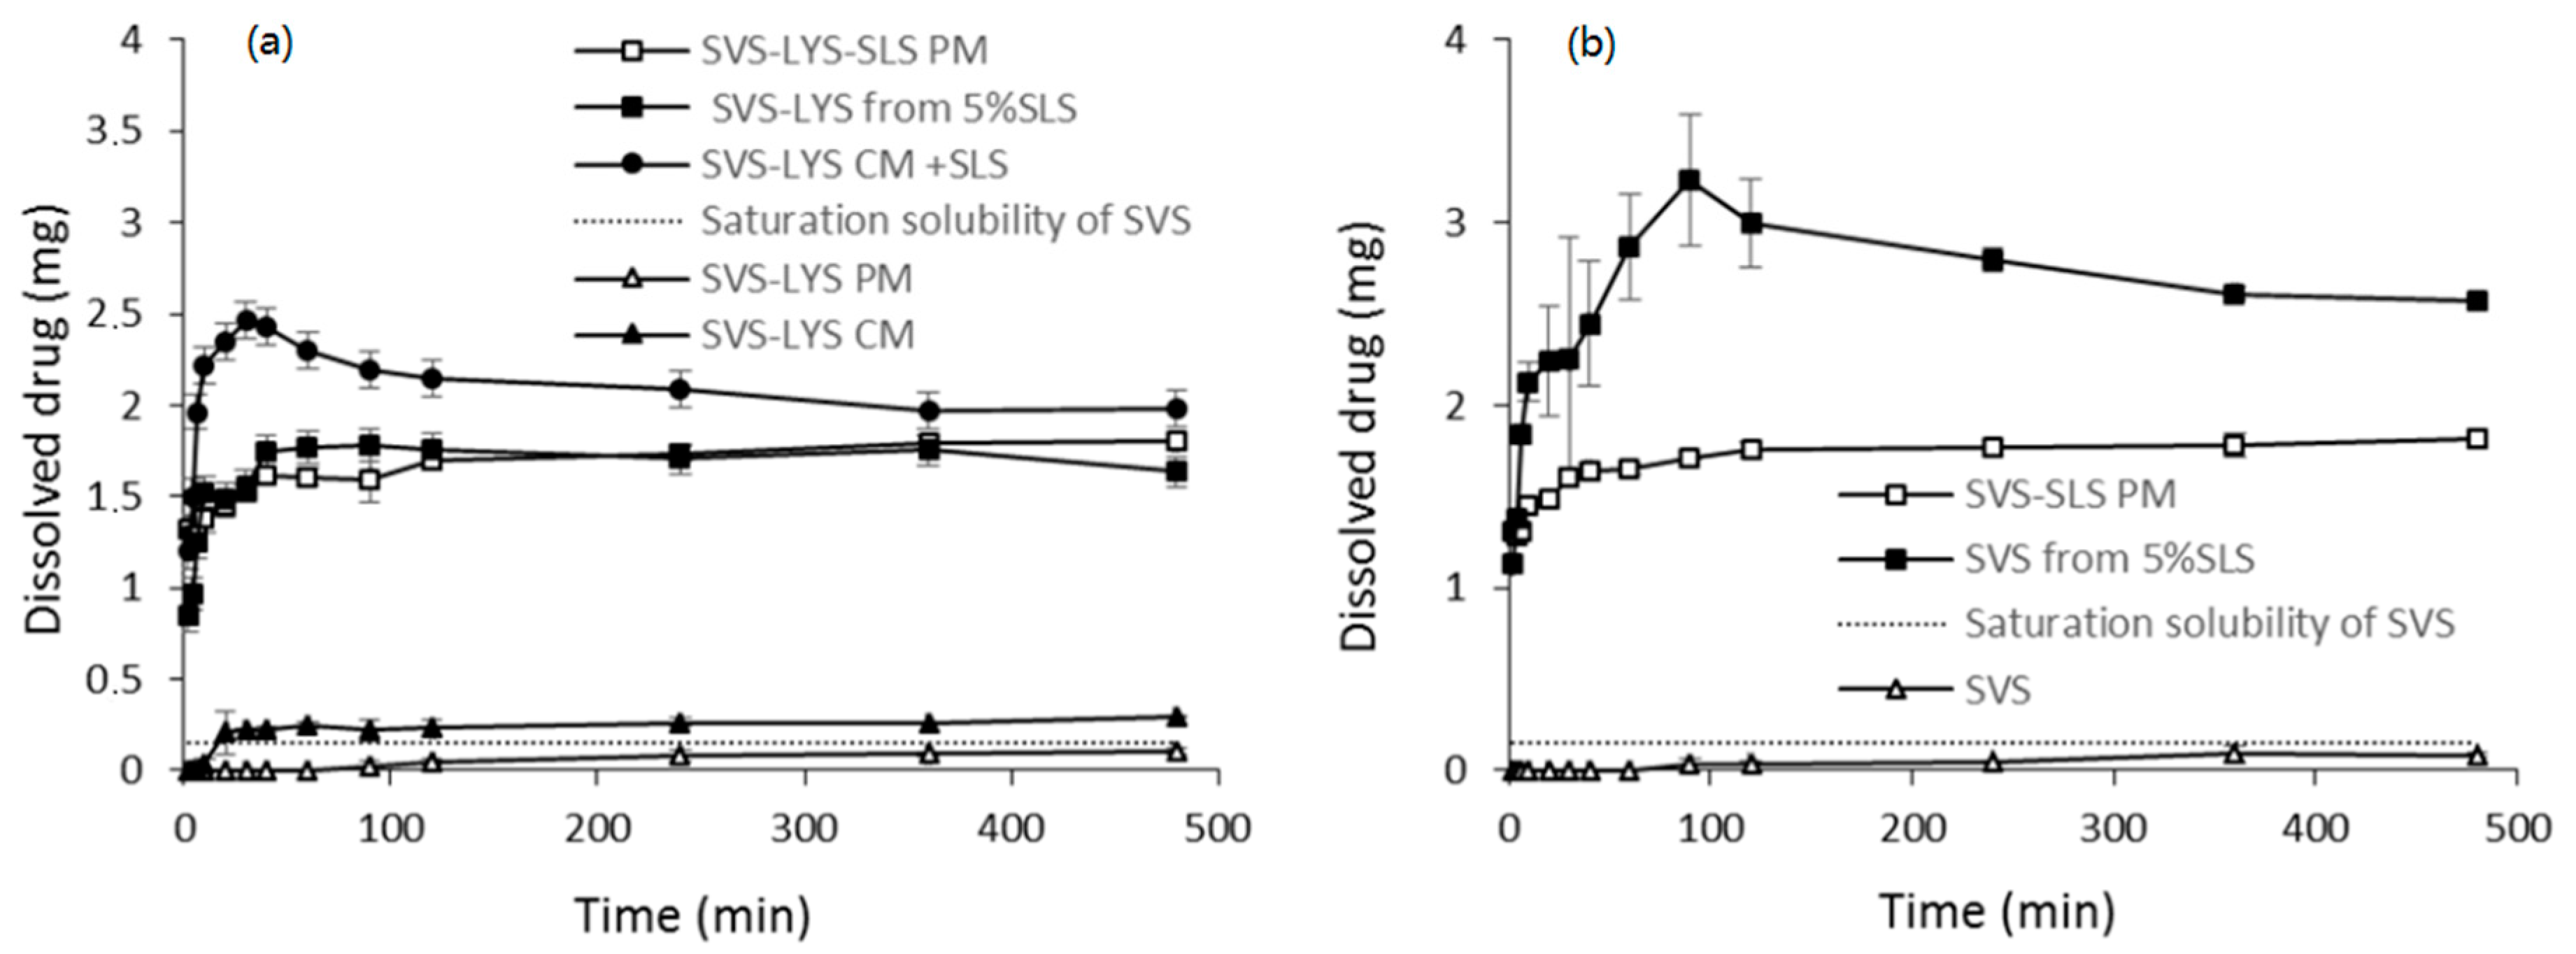
2.3.5. Dissolution Properties


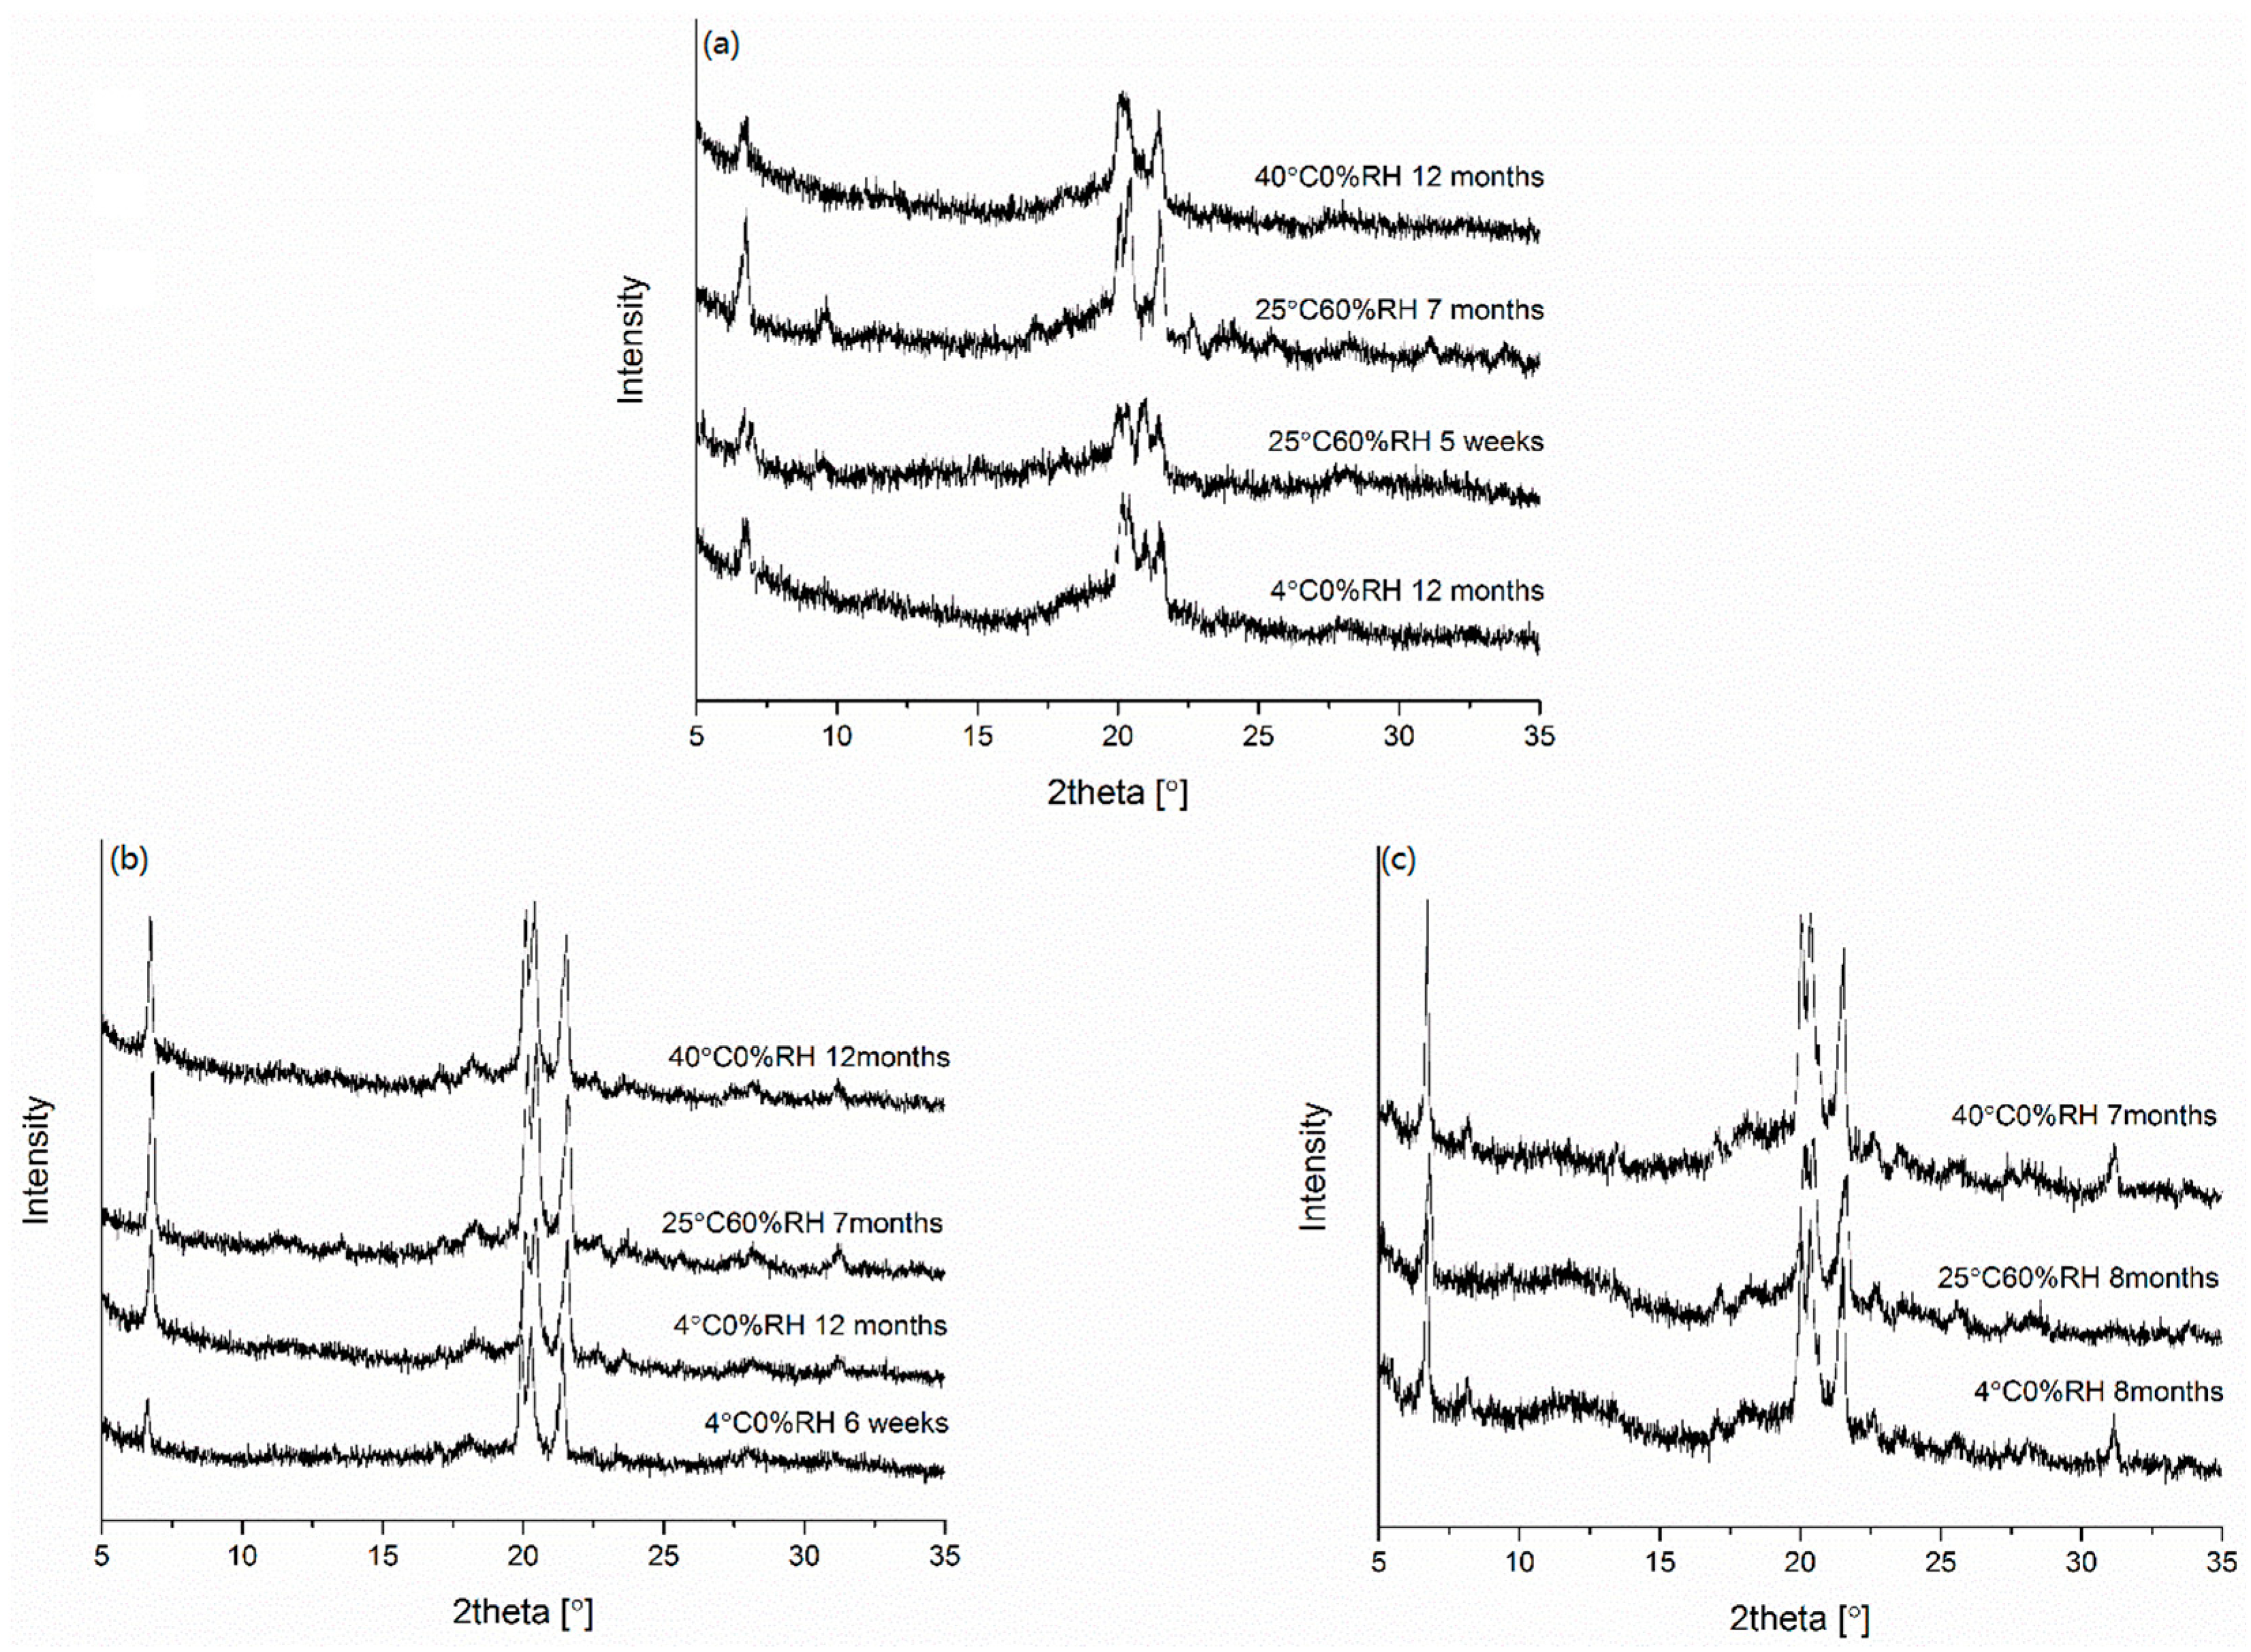
2.3.6. Physical Stability


3. Experimental Section
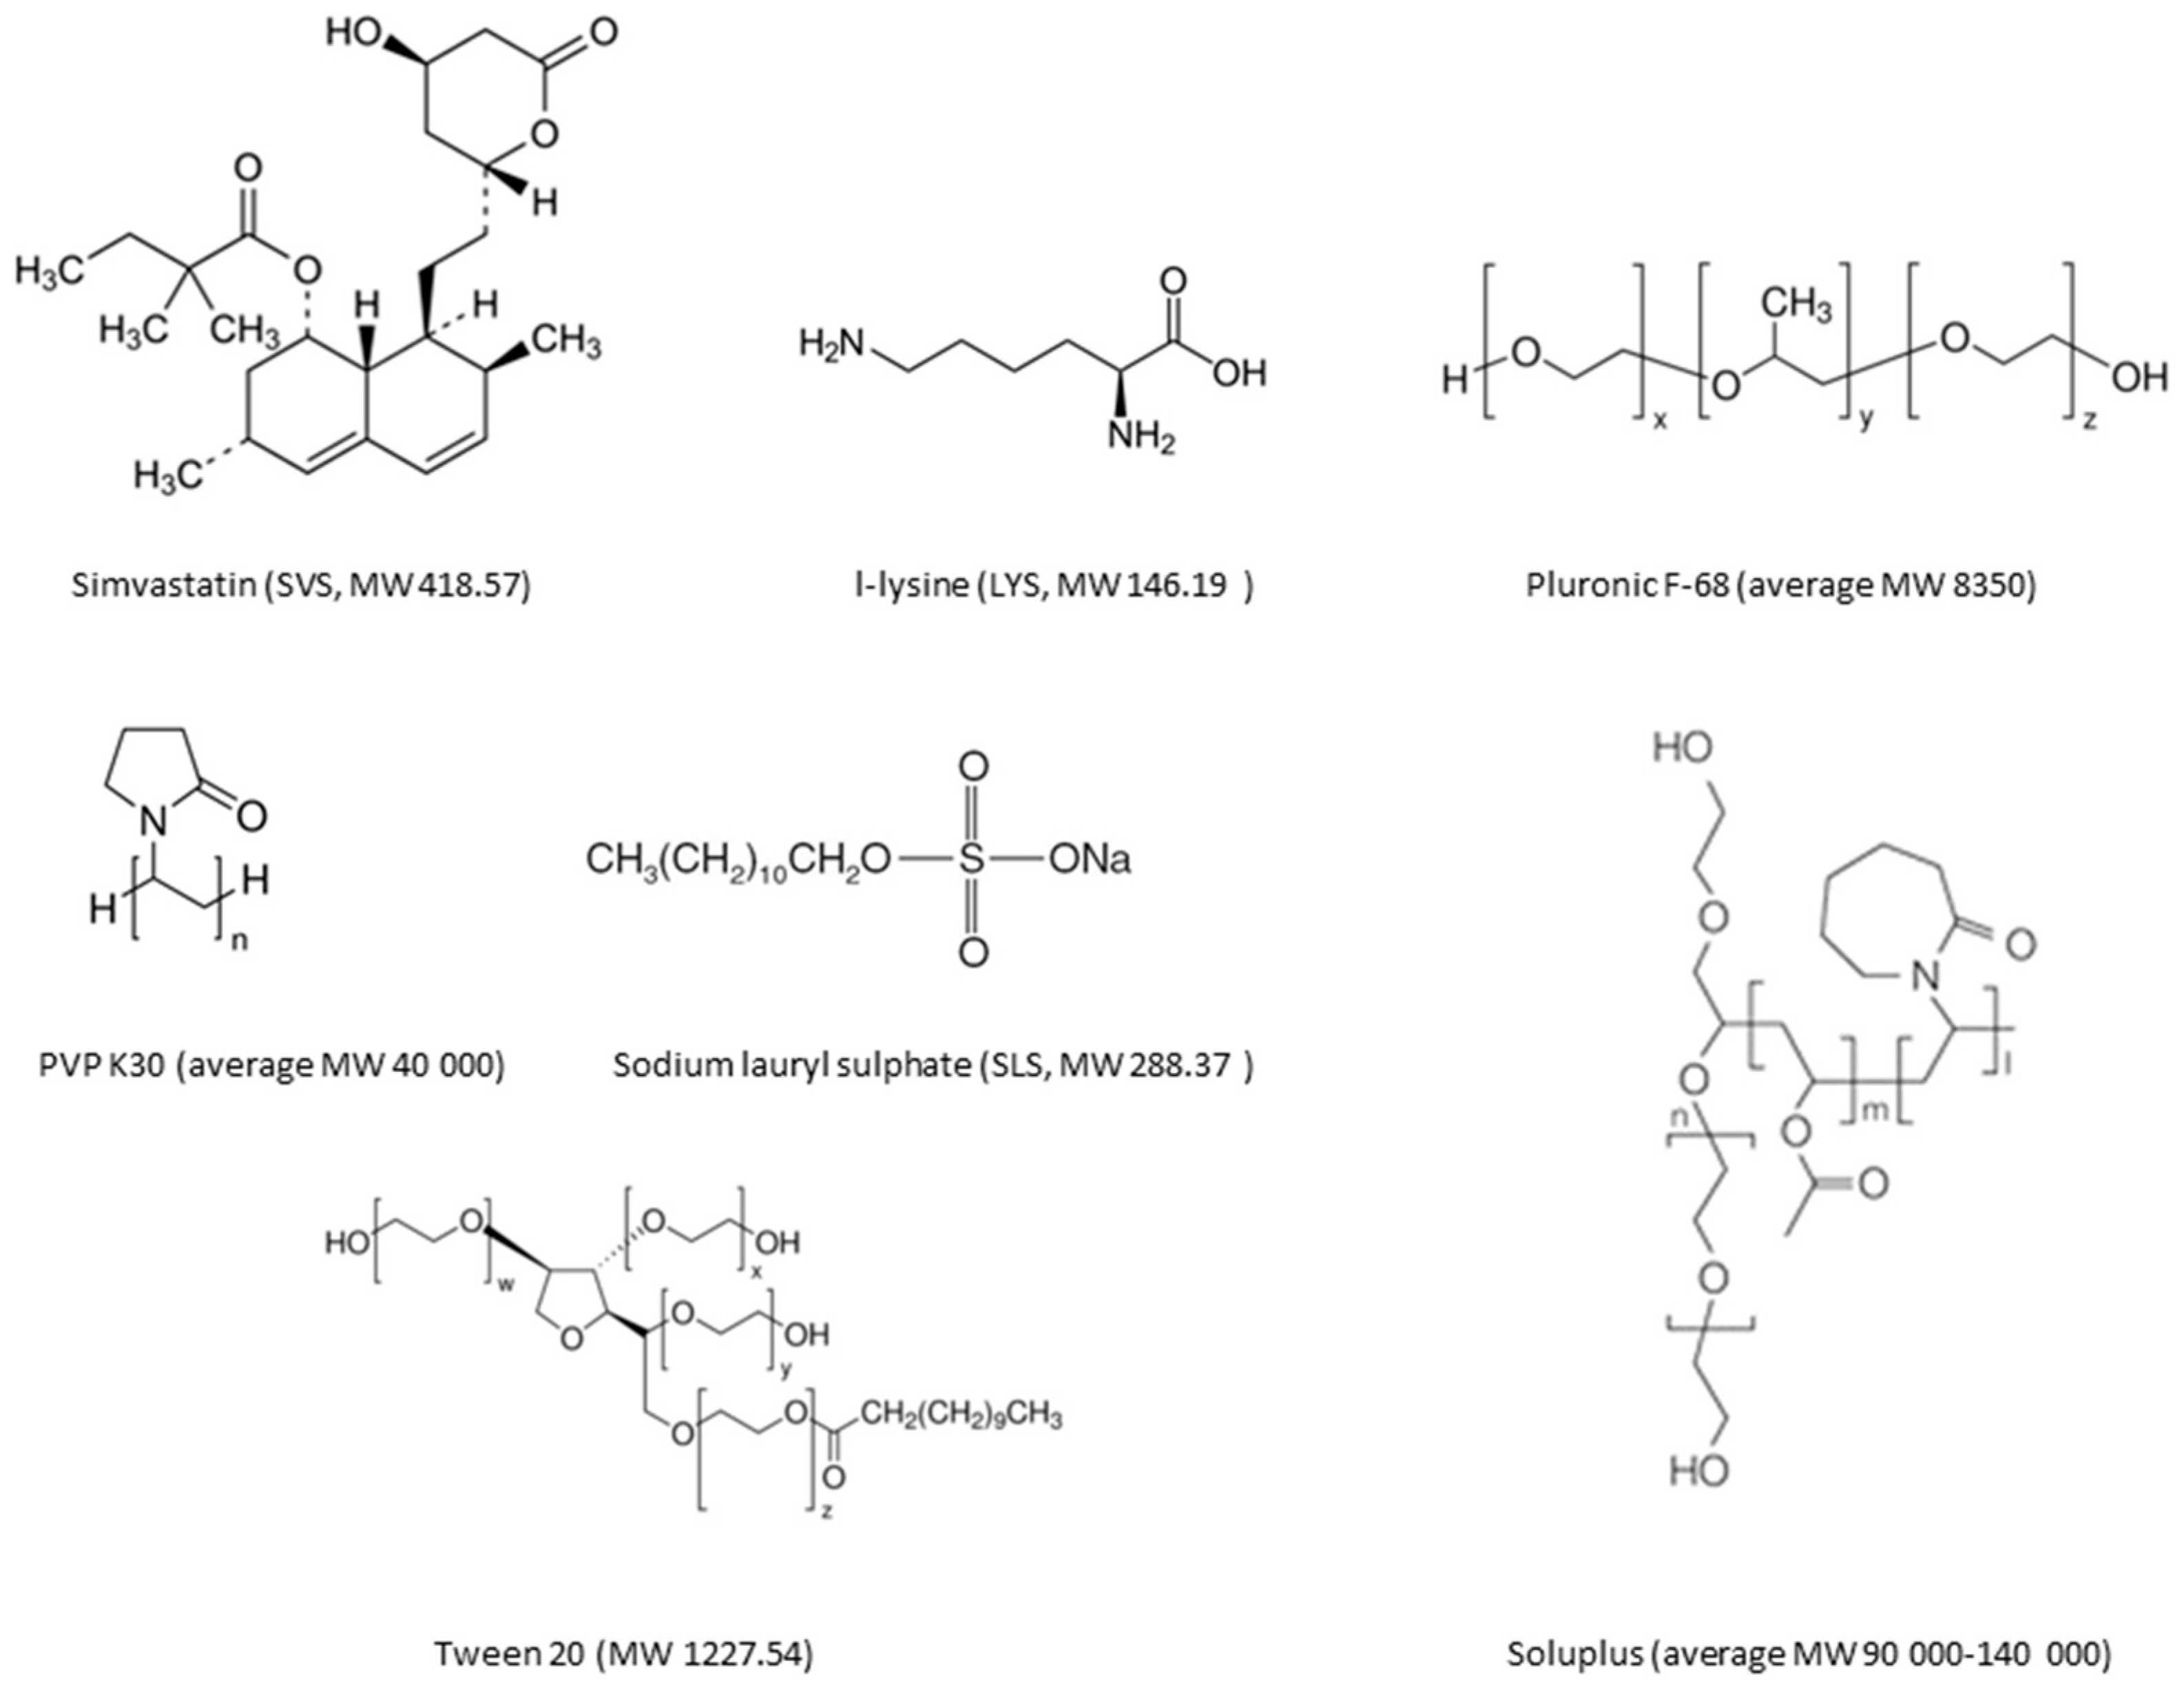
3.1. Materials
3.2. Solubility Test
3.3. Preparation of the Materials
3.4. X-ray Powder Diffraction (XRPD)
3.5. Elemental Analysis of Spray-Dried Particle Surfaces
3.6. Differential Scanning Calorimetry (DSC)
3.7. Fourier-Transform Infrared Spectroscopy (FTIR)
3.8. Dissolution Testing
3.9. High-Performance Liquid Chromatography (HPLC)
3.10. Stability Study
4. Conclusions
Acknowledgments
Author Contributions
Conflicts of Interest
References
- Williams, H.D.; Trevaskis, N.L.; Charman, S.A.; Shanker, R.M.; Charman, W.N.; Pouton, C.W.; Porter, C.J.H. Strategies to address low drug solubility in discovery and development. Pharmacol. Rev. 2013, 65, 315–499. [Google Scholar] [CrossRef] [PubMed]
- Brough, C.; Williams, R.O., III. Amorphous solid dispersions and nano-crystal technologies for poorly water-soluble drug delivery. Int. J. Pharm. 2013, 453, 157–166. [Google Scholar] [CrossRef] [PubMed]
- Vo, C.L.; Park, C.; Lee, B. Current trends and future perspectives of solid dispersions containing poorly water-soluble drugs. Eur. J. Pharm. Biopharm. 2013, 85, 799–813. [Google Scholar] [CrossRef] [PubMed]
- Zheng, E.; Jain, A.; Papoutsakis, D.; Dannenfelser, R.M.; Panicucci, R.; Garad, S. Selection of oral bioavailability enhancing formulations during drug discovery. Drug. Dev. Ind. Pharm. 2012, 38, 235–247. [Google Scholar] [CrossRef] [PubMed]
- Janssens, S.; van den Mooter, G. Review: physical chemistry of solid dispersions. J. Pharm. Pharmacol. 2009, 61, 1571–1586. [Google Scholar] [CrossRef] [PubMed]
- Srinarong, P.; de Waard, H.; Frijlink, H.W.; Hinrichs, W.L.J. Improved dissolution behavior of lipophilic drugs by solid dispersions: The production process as starting point for formulation considerations. Expert Opin. Drug Deliv. 2011, 8, 1121–1140. [Google Scholar] [CrossRef] [PubMed]
- Laitinen, R.; Löbmann, K.; Grohganz, H.; Strachan, C.; Rades, T. Amino acids as co-amorphous excipients for simvastatin and glibenclamide: Physical properties and stability. Mol. Pharm. 2014, 11, 2381–2389. [Google Scholar] [CrossRef] [PubMed]
- Löbmann, K.; Strachan, C.; Grohganz, H.; Rades, T.; Korhonen, O.; Laitinen, R. Co-amorphous simvastatin and glipizide combinations show improved physical stability without evidence of intermolecular interactions. Eur. J. Pharm. Biopharm. 2012, 81, 159–169. [Google Scholar] [CrossRef] [PubMed]
- Laitinen, R.; Löbmann, K.; Strachan, C.J.; Grohganz, H.; Rades, T. Emerging trends in the stabilization of amorphous drugs. Int. J. Pharm. 2013, 30, 65–79. [Google Scholar] [CrossRef] [PubMed]
- Löbmann, K.; Grohganz, H.; Laitinen, R.; Strachan, C.; Rades, T. Amino acids as co-amorphous stabilizers for poorly water soluble drugs-Part 1: Preparation, stability and dissolution enhancement. Eur. J. Pharm. Biopharm. 2013, 85, 873–881. [Google Scholar]
- Gao, Y.; Liao, J.; Qi, X.; Zhang, J. Coamorphous repaglinide-saccharin with enhanced dissolution. Int. J. Pharm. 2013, 450, 290–295. [Google Scholar] [CrossRef] [PubMed]
- Hu, Y.; Gniado, K.; Erxleben, A.; McArdle, P. Mechanochemical reaction of sulfathiazole with carboxylic acids: Formation of a cocrystal, a salt, and coamorphous colids. Cryst. Growth. Des. 2014, 14, 803–813. [Google Scholar] [CrossRef]
- Dengale, S.J.; Ranjan, O.P.; Hussen, S.S.; Krishna, B.S.M.; Musmade, P.B.; Shenoy, G.G.; Bhat, K. Preparation and characterization of co-amorphous ritonavir–indomethacin systems by solvent evaporation technique: Improved dissolution behavior and physical stability without evidence of intermolecular interactions. Eur. J. Pharm. Sci. 2014, 62, 57–64. [Google Scholar] [CrossRef] [PubMed]
- Shayanfar, A.; Jouyban, A. Drug-drug coamorphous systems: Characterization and physicochemical properties of coamorphous atorvastatin with carvedilol and glibenclamide. J. Pharm. Innov. 2013, 8, 218–228. [Google Scholar] [CrossRef]
- Martínez, L.M.; Videa, M.; López-Silva, G.A.; de los Reyes, C.A.; Cruz-Angeles, J.; González, N. Stabilization of amorphous paracetamol based systems using traditional and novel strategies. Int. J. Pharm. 2014, 477, 294–305. [Google Scholar] [CrossRef] [PubMed]
- Jensen, K.T.; Blaabjerg, L.I.; Lenz, E.; Bohr, A.; Grohganz, H.; Kleinebudde, P.; Rades, T.; Löbmann, K. Preparation and characterization of spray-dried co-amorphous drug–amino acid salts. J. Pharm. Pharmacol. 2015. [Google Scholar] [CrossRef] [PubMed]
- Démuth, B.; Nagy, Z.K.; Balogh, A.; Vigh, T.; Marosi, G.; Verreck, G.; van Assche, I.; Brewster, M.E. Downstream processing of polymer-based amorphous solid dispersions to generate tablet formulations. Int. J. Pharm. 2015, 486, 268–286. [Google Scholar] [CrossRef] [PubMed]
- Koltzenburg, S. Formulation of problem drugs –and they are all problem drugs. In Solubility Enhancement with BASF Pharma Polymers. Solubilizer Compendium; Reintjes, T., Ed.; BASF SE: Lampertheim, Germany, 2011; p. 22. [Google Scholar]
- Mukerjee, P.; Mysels, K.J. Critical micelle concentrations of aqueous surfactant systems. Nat. Stand. Ref. Data Ser. Nat. Bur. Stand. 1970. [Google Scholar] [CrossRef]
- Patist, A.; Bhagwat, S.S.; Penfield, K.W.; Aikens, P.; Shah, D.O. On the measurement of critical micelle concentrations of pure and technical-grade nonionic surfactants. J. Surfactants Deterg. 2000, 3, 53–58. [Google Scholar] [CrossRef]
- Available online: http://www4.mpbio.com/ecom/docs/proddata.nsf/03d5991c3a7e7f0d8525792e00243e31/b8dd4c6faf0859048525663c0070508e (accessed on 20 November 2015).
- Cadwallader, D.E.; Devendra, K.M. Effect of macromolecules on aqueous solubility of cholesterol and hormone drugs. J. Pharm. Sci. 1981, 70, 442–446. [Google Scholar] [CrossRef] [PubMed]
- Garekani, H.A.; Sadeghi, F.; Ghazi, A. Increasing the aqueous solubility of acetaminophen in the presence of polyvinylpyrrolidone and investigation of the mechanisms involved. Drug Dev. Ind. Pharm. 2003, 29, 173–179. [Google Scholar] [CrossRef] [PubMed]
- Ambike, A.A.; Mahadik, K.R.; Paradkar, A. Spray-dried amorphous solid dispersions of simvastatin, a low Tg drug: In vitro and in vivo evaluations. Pharm. Res. 2005, 22, 990–998. [Google Scholar] [CrossRef] [PubMed]
- Zhang, Y.; Liu, Y.; Luo, Y.; Yao, Q.; Zhong, Y.; Tian, B.; Tang, X. Extruded soluplus/SIM as an oral delivery system: Characterization, interactions, in vitro and in vivo evaluations. Drug Deliv. 2015. [Google Scholar] [CrossRef]
- Singla, N.; Gupta, G.D.; Kohli, K.; Singla, A.K. A discriminatory and biorelevant dissolution test method for simvastatin drug products. Dissol. Technol. 2009, 16, 11–13. [Google Scholar] [CrossRef]
- Takeuchi, H.; Nagira, S.; Yamamoto, H.; Kawashima, Y. Solid dispersion particles of tolbutamide with fine silica particles by the spray-drying method. Powder Technol. 2004, 195, 141–187. [Google Scholar] [CrossRef]
- Yu, D.G.; Zhu, L.M.; Branford-White, C.J.; Yang, J.H.; Wang, X.; Li, Y.; Qian, W. Solid dispersions in the form of electrospun core-sheath nanofibers. Int. J. Nanomed. 2012, 6, 3271–3280. [Google Scholar] [CrossRef] [PubMed]
- Roberts, M.; Ehtezazi, T.; Compernolle, A.; Amin, K. The effect of spray drying on the compaction properties of hypromellose acetate succinate. Drug Dev. Ind. Pharm. 2011, 37, 268–273. [Google Scholar] [CrossRef] [PubMed]
- Millqvist-Fureby, A.; Malmsten, M.; Bergenståhl, B. Spray-drying of trypsin—Surface characterisation and activity preservation. Int. J. Pham. 1999, 188, 243–253. [Google Scholar] [CrossRef]
- Sinko, P.J. Martin’s Physical Pharmacy and Pharmaceutical Sciences, 6th ed.; Lippincott Williams & Wilkins: Baltimore, MD, USA, 2011; p. 369. [Google Scholar]
- Mattern, M.; Winter, G.; Kohnert, U.; Lee, G. Formulation of proteins in vacuum-dried glasses. II. Process and storage stability in sugar-free amino acid systems. Pharm. Dev. Technol. 1999, 4, 199–208. [Google Scholar] [CrossRef] [PubMed]
- Dave, R.H.; Patel, A.D.; Donahue, E.; Patel, H.H. To evaluate the effect of addition of an anionic surfactant on solid dispersion using model drug indomethacin. Drug Dev. Ind. Pharm. 2012, 38, 930–939. [Google Scholar] [CrossRef] [PubMed]
- Nasr, H.E.; Gaffar, M.S.; Abdel-Kareem, O.; Abd El-Aziz, F. Morphological, rheological and ultrasonic characterizations of ECO-friendly microemulsion lattices based on acrylate monomers. J. Am. Sci. 2010, 6, 897–910. [Google Scholar]
- Da Costa, M.A.; Seiceira, R.C.; Rodrigues, C.R.; Hoffmeister, C.R.D.; Cabral, L.M.; Rocha, H.V.A. Efavirenz dissolution enhancement I: Co-micronization. Pharmaceutics 2013, 5, 1–22. [Google Scholar] [CrossRef] [PubMed]
- Bhise, S.B.; Mookkan, S. Formulation and evaluation of novel FDCs of antitubercular drugs. J. Pharm. Res. 2009, 2, 437–444. [Google Scholar]
- Kaminska, E.; Adrjanowicz, K.; Kaminski, K.; Wlodarczyk, P.; Hawelek, L.; Kolodziejczyk, K.; Tarmacka, M.; Zakowiecki, D.; Kacmarcyk-Sedlak, I.; Pilch, J.; et al. A new way of stabilization of furosemide upon cryogenic ginding by using acylated saccharides matrices. The role of hydrogen bonds in decomposition mechanism. Mol. Pharmacol. 2013, 10, 1824–1835. [Google Scholar] [CrossRef] [PubMed]
- Grzybowska, K.; Paluch, M.; Wlodarczyk, P.; Kaminski, K.; Hawelek, L. Enhancement of amorphous celecoxib stability by mixing it with octaacetylmaltose: the molecular dynamics study. Mol. Pharm. 2012, 9, 894–904. [Google Scholar] [CrossRef] [PubMed]
- Marsac, P.J.; Li, T.; Taylor, L.S. Estimation of drug-polymer miscibility and solubility in amorphous solid dispersions using experimentally determined interaction parameters. Pharm. Res. 2009, 26, 139–151. [Google Scholar] [CrossRef] [PubMed]
- Marsac, P.J.; Konno, H.; Taylor, L.S. A comparison of the physical stability of amorphous felodipine and nifedipine systems. Pharm. Res. 2006, 23, 2306–2316. [Google Scholar] [CrossRef] [PubMed]
- Mosquera-Giraldo, L.I.; Trasi, N.S.; Taylor, L.S. Impact of surfactants on the crystal growth of amorphous celecoxib. Int. J. Pharm. 2014, 461, 251–257. [Google Scholar] [CrossRef] [PubMed]
- Prosser, A.J.; Franses, E.I. Infrared reflection absorption spectroscopy (IRRAS) of aqueous nonsurfactant salts, ionic surfactants, and mixed ionic surfactants. Langmuir 2002, 18, 9234–9242. [Google Scholar] [CrossRef]
- Viana, R.B.; da Silva, A.B.F.; Pimentel, A.S. Infrared spectroscopy of anionic, cationic, and zwitterionic surfactants. Adv. Phys. Chem. 2012. [Google Scholar] [CrossRef]
- Kawai, T.; Umemura, J.; Takenaka, T. Fourier transform infrared study on the phase transitions of a sodium dodecyl sulfate-water system. Bull. Inst. Chem. Res. Kyoto Univ. 1983, 61, 314–323. [Google Scholar]
- Heikkinen, A.T.; DeClerck, L.; Löbmann, K.; Grohganz, H.; Rades, T.; Laitinen, R. Dissolution properties of co-amorphous drug-amino acid formulations in buffer and biorelevant media. Die Pharm. 2015, 70, 452–457. [Google Scholar]
- Augustijns, P.; Brewster, M.E. Supersaturating drug delivery systems: Fast is not necessarily good enough. J. Pharm. Sci. 2012, 101, 7–9. [Google Scholar] [CrossRef] [PubMed]
- Chen, J.; Ormes, J.D.; Higgins, J.D.; Taylor, L.S. Impact of surfactants on the crystallization of aqueous suspensions of celecoxib amorphous solid dispersion spray dried particles. Mol. Pharm. 2015, 12, 533–541. [Google Scholar] [CrossRef] [PubMed]
- Priemel, P.A.; Laitinen, R.; Barthold, S.; Grohganz, H.; Lehto, V.P.; Rades, T.; Strachan, C.J. Inhibition of surface crystallisation of amorphous indomethacin particles in physical drug-polymer mixtures. Int. J. Pharm. 2013, 456, 301–306. [Google Scholar] [CrossRef] [PubMed]
- Collier, J.W.; Shah, R.B.; Gupta, A.; Sayeed, V.; Habib, M.J.; Khan, M.A. Influence of formulation and processing factors on stability of levothyroxine sodium pentahydrate. AAPS PharmSciTech 2010, 11, 818–825. [Google Scholar] [CrossRef] [PubMed]
- Sample Availability: Samples of the compounds are not available from the authors.
© 2015 by the authors. Licensee MDPI, Basel, Switzerland. This article is an open access article distributed under the terms and conditions of the Creative Commons by Attribution (CC-BY) license ( http://creativecommons.org/licenses/by/4.0/).
Share and Cite
Craye, G.; Löbmann, K.; Grohganz, H.; Rades, T.; Laitinen, R. Characterization of Amorphous and Co-Amorphous Simvastatin Formulations Prepared by Spray Drying. Molecules 2015, 20, 21532-21548. https://doi.org/10.3390/molecules201219784
Craye G, Löbmann K, Grohganz H, Rades T, Laitinen R. Characterization of Amorphous and Co-Amorphous Simvastatin Formulations Prepared by Spray Drying. Molecules. 2015; 20(12):21532-21548. https://doi.org/10.3390/molecules201219784
Chicago/Turabian StyleCraye, Goedele, Korbinian Löbmann, Holger Grohganz, Thomas Rades, and Riikka Laitinen. 2015. "Characterization of Amorphous and Co-Amorphous Simvastatin Formulations Prepared by Spray Drying" Molecules 20, no. 12: 21532-21548. https://doi.org/10.3390/molecules201219784