
Role of Polymeric Excipients in the Stabilization of Olanzapine when Exposed to Aqueous Environments

Abstract
:
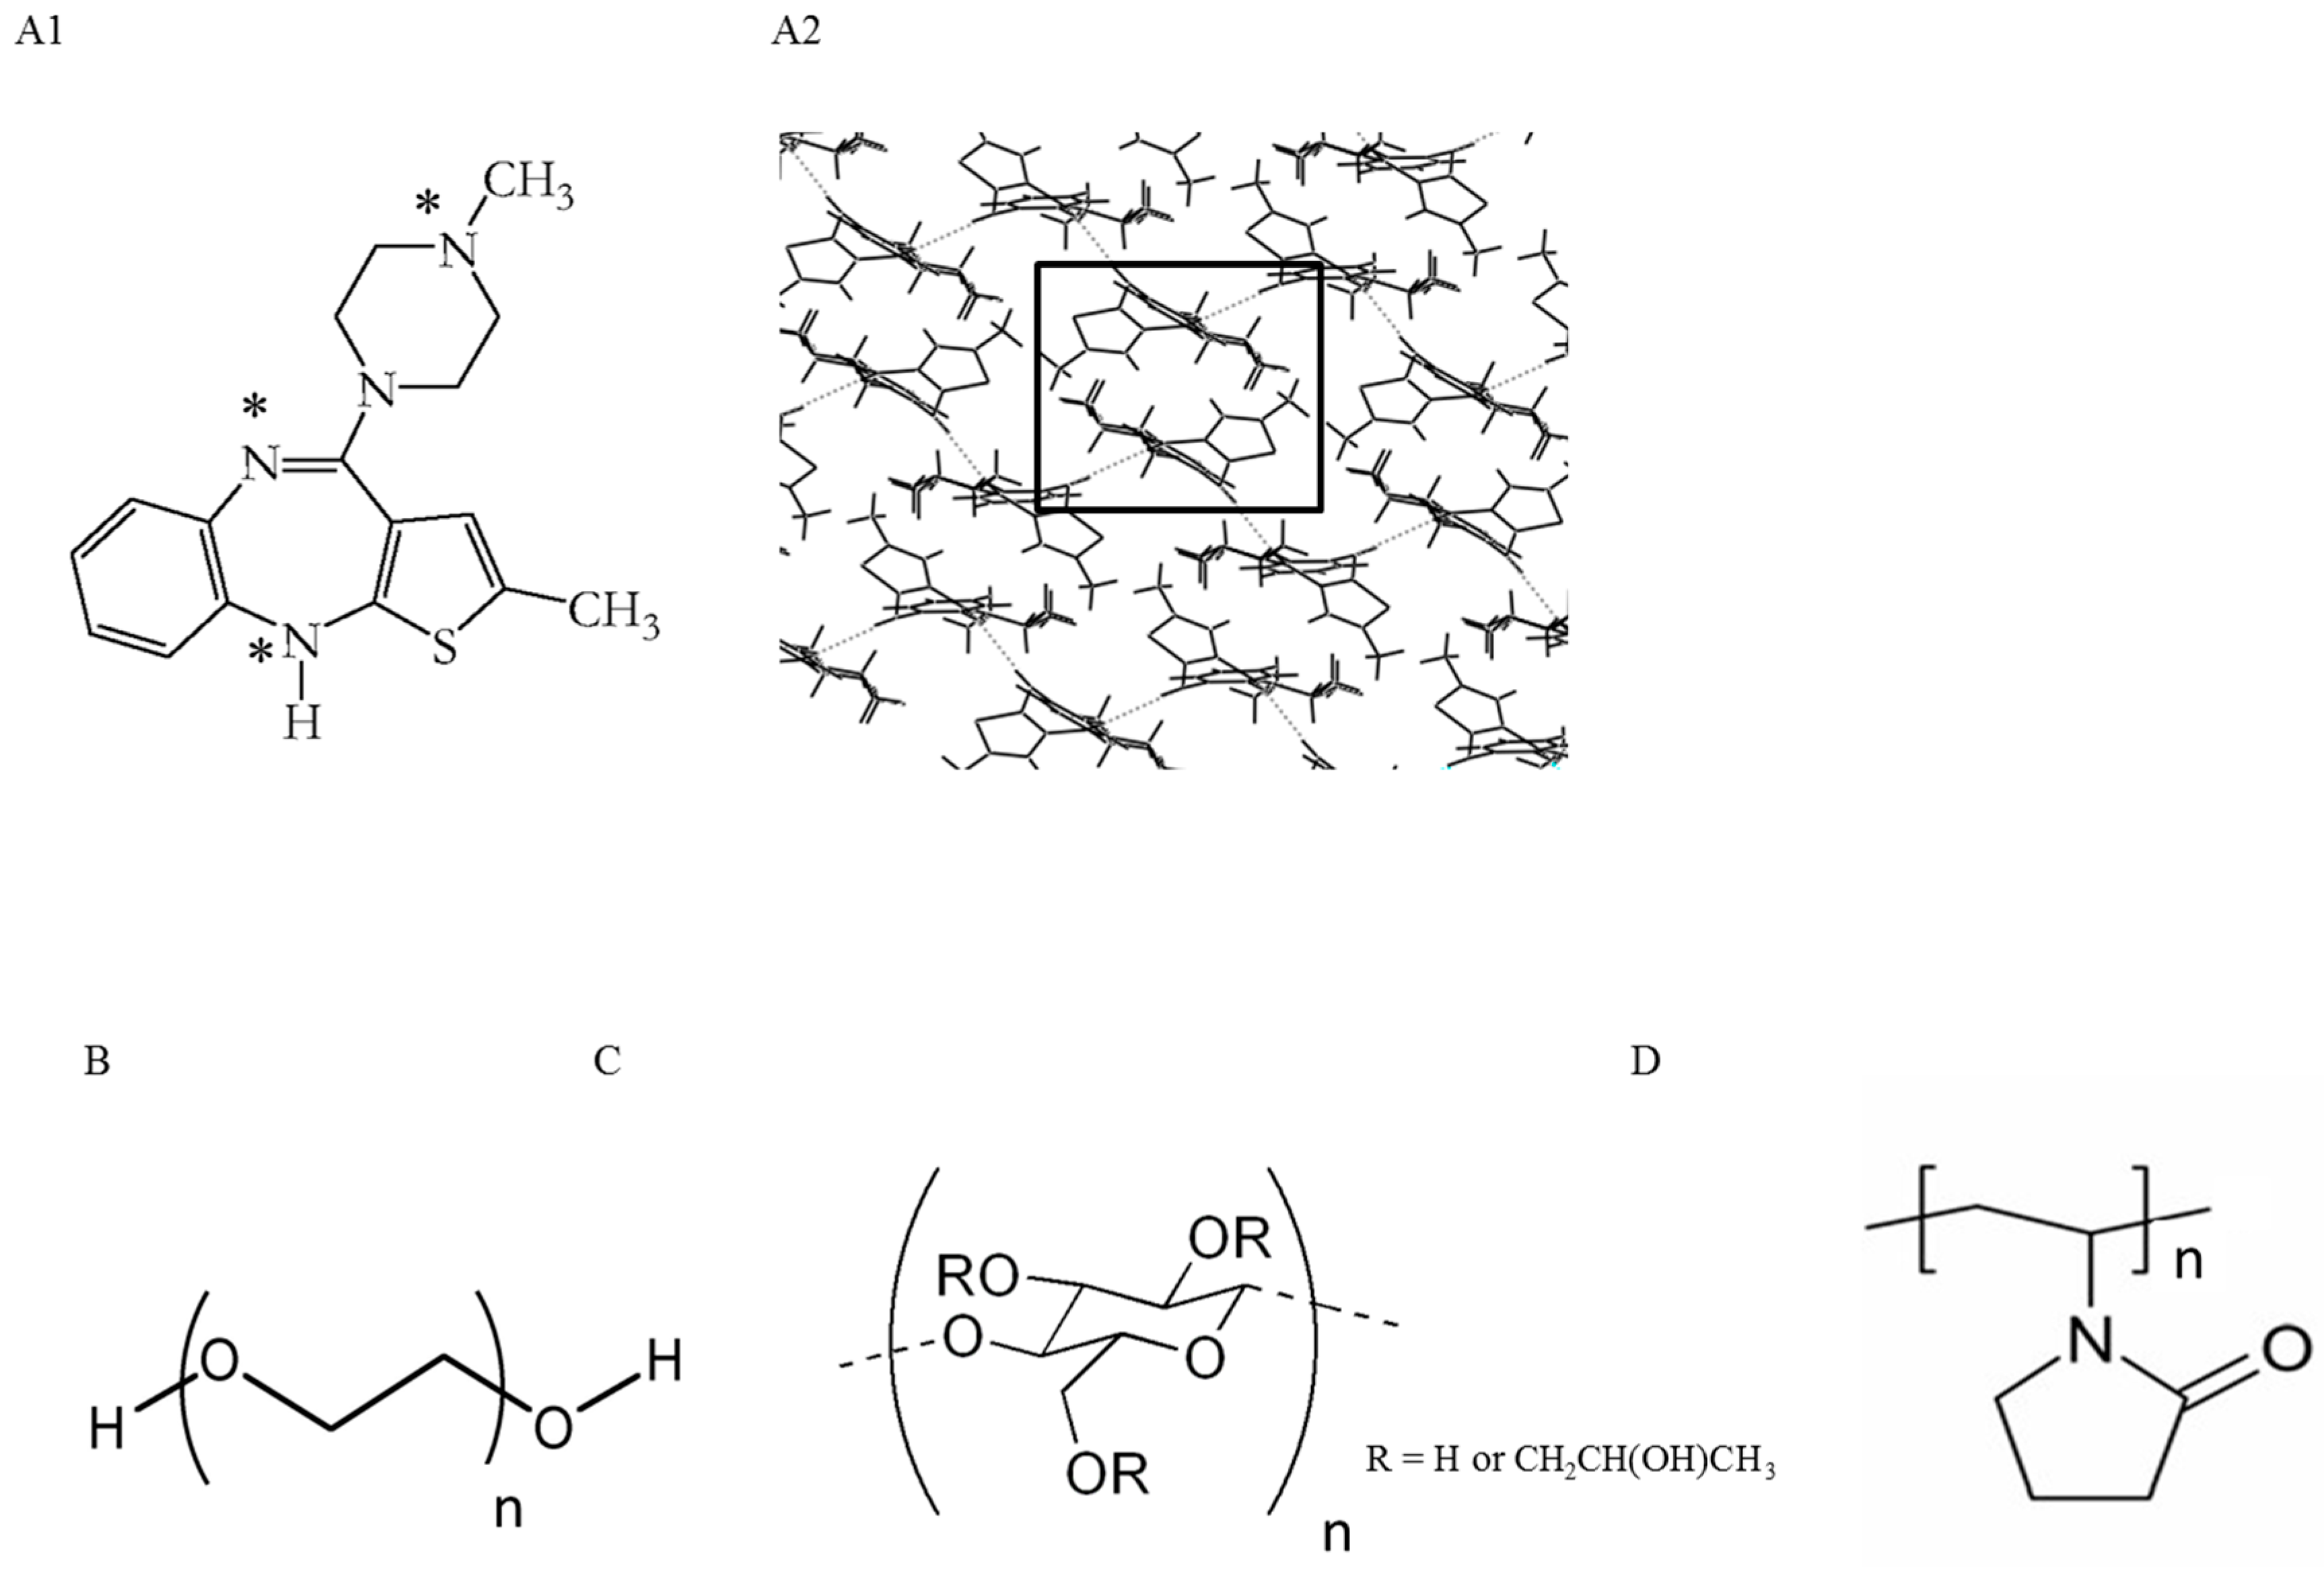
1. Introduction
2. Results
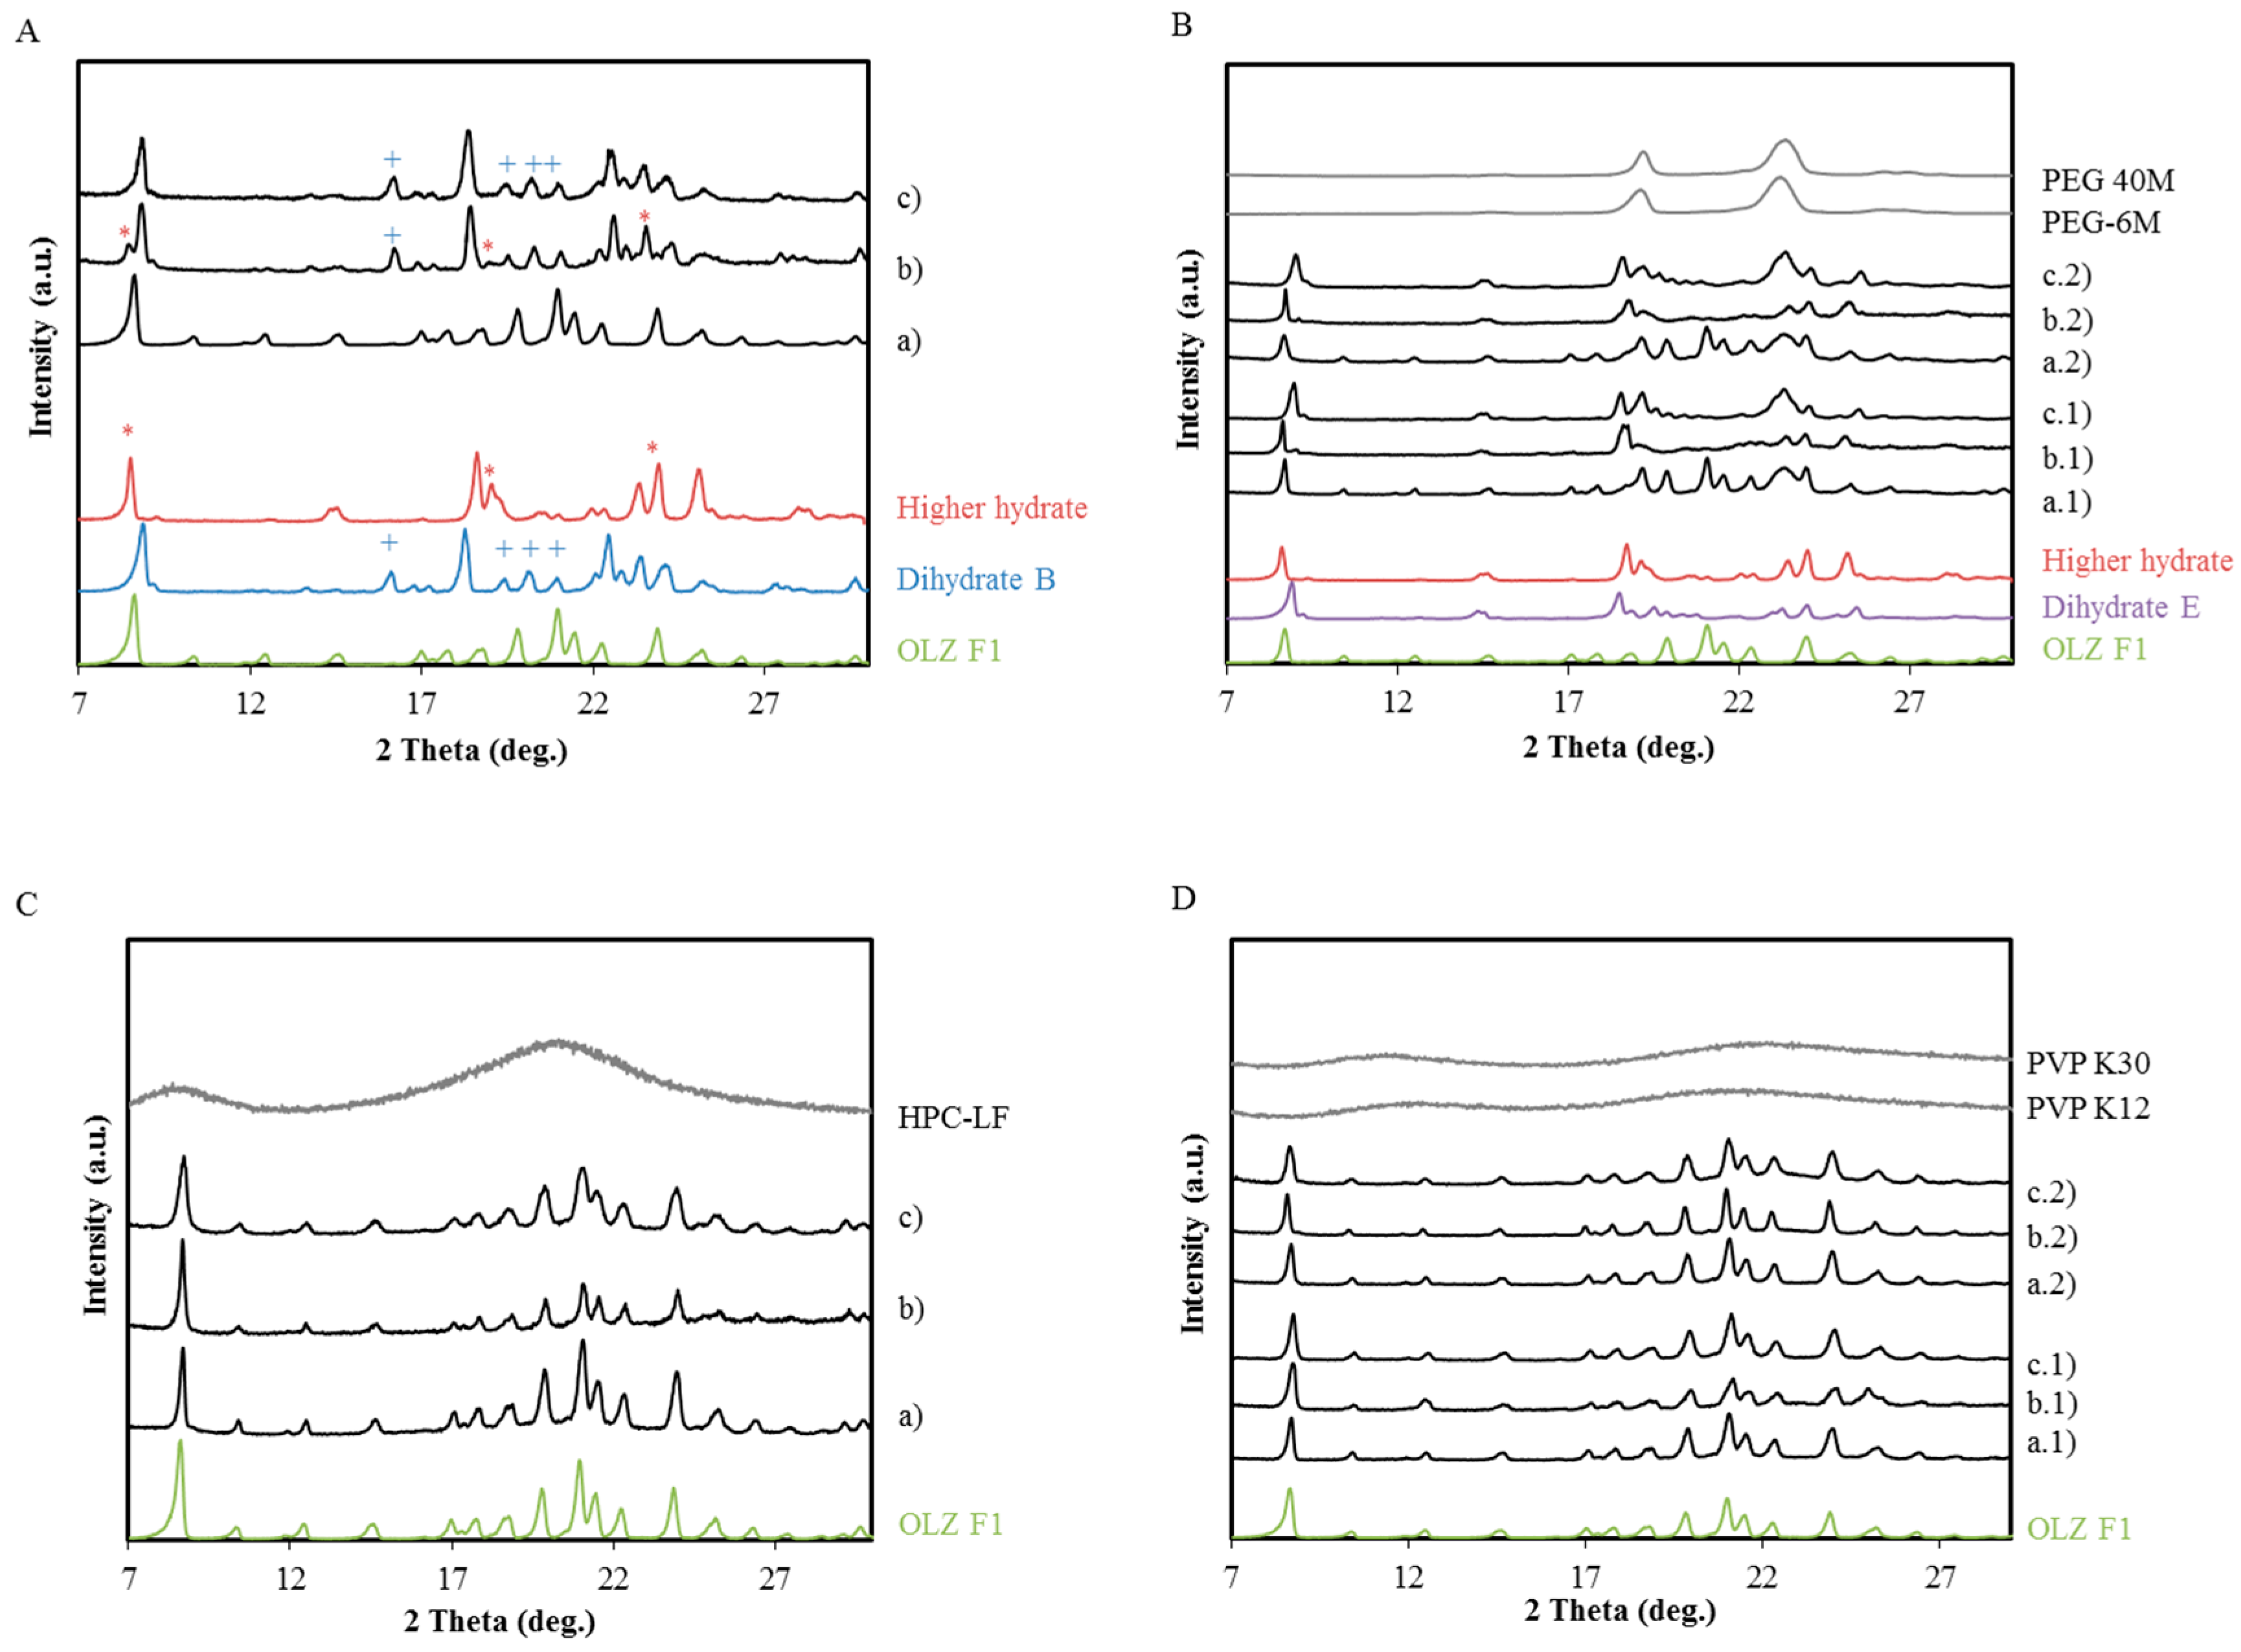
2.1. Polymer Screening Method to Identify Polymers that can Stabilize OLZ FI during Wet Massing


| γd 1 (mN/m) | γp 1 (mN/m) | γ 1 (mN/m) | Polarity (%) | Wc 2 (mJ/m2) | Wa 2 (mJ/m2) | Wa−Wc 3 (mJ/m2) | |
|---|---|---|---|---|---|---|---|
| OLZ | 41.31 | 1.19 | 42.50 | 3 | 85.00 | ||
| PEG 6000 | 35.71 | 14.62 | 50.33 | 29 | 100.66 | 81.01 | −19.65 |
| PEG 40,000 | 34.78 | 12.93 | 47.71 | 27 | 95.42 | 79.89 | −15.53 |
| PVP k12 | 43.22 | 7.48 | 50.71 | 15 | 101.42 | 88.59 | −12.83 |
| PVP k30 | 40.46 | 6.73 | 47.19 | 14 | 94.38 | 85.81 | −8.57 |
| HPC LF | 31.90 | 4.80 | 36.70 | 13 | 73.40 | 75.81 | 2.41 |
| Raw-Material | Contact Angle (θ/°) | Formulations after Massing | Contact angle (θ/°) |
|---|---|---|---|
| OLZ | 104.65 ± 0.64 | A | 104.87 ± 0.74 |
| PEG 6000 | 63.60 ± 2.05 | B1 | 81.24 ± 2.98 |
| PEG 40,000 | 64.30 ± 1.95 | B2 | 79.52 ± 1.07 |
| HPC-LF | 91.84 ± 0.47 | C | 87.41 ± 1.72 |
| PVP k12 | 56.46 ± 1.36 | D1 | 79.73 ± 1.54 |
| PVP K30 | 75.77 ± 2.17 | D2 | 89.14 ± 3.40 |
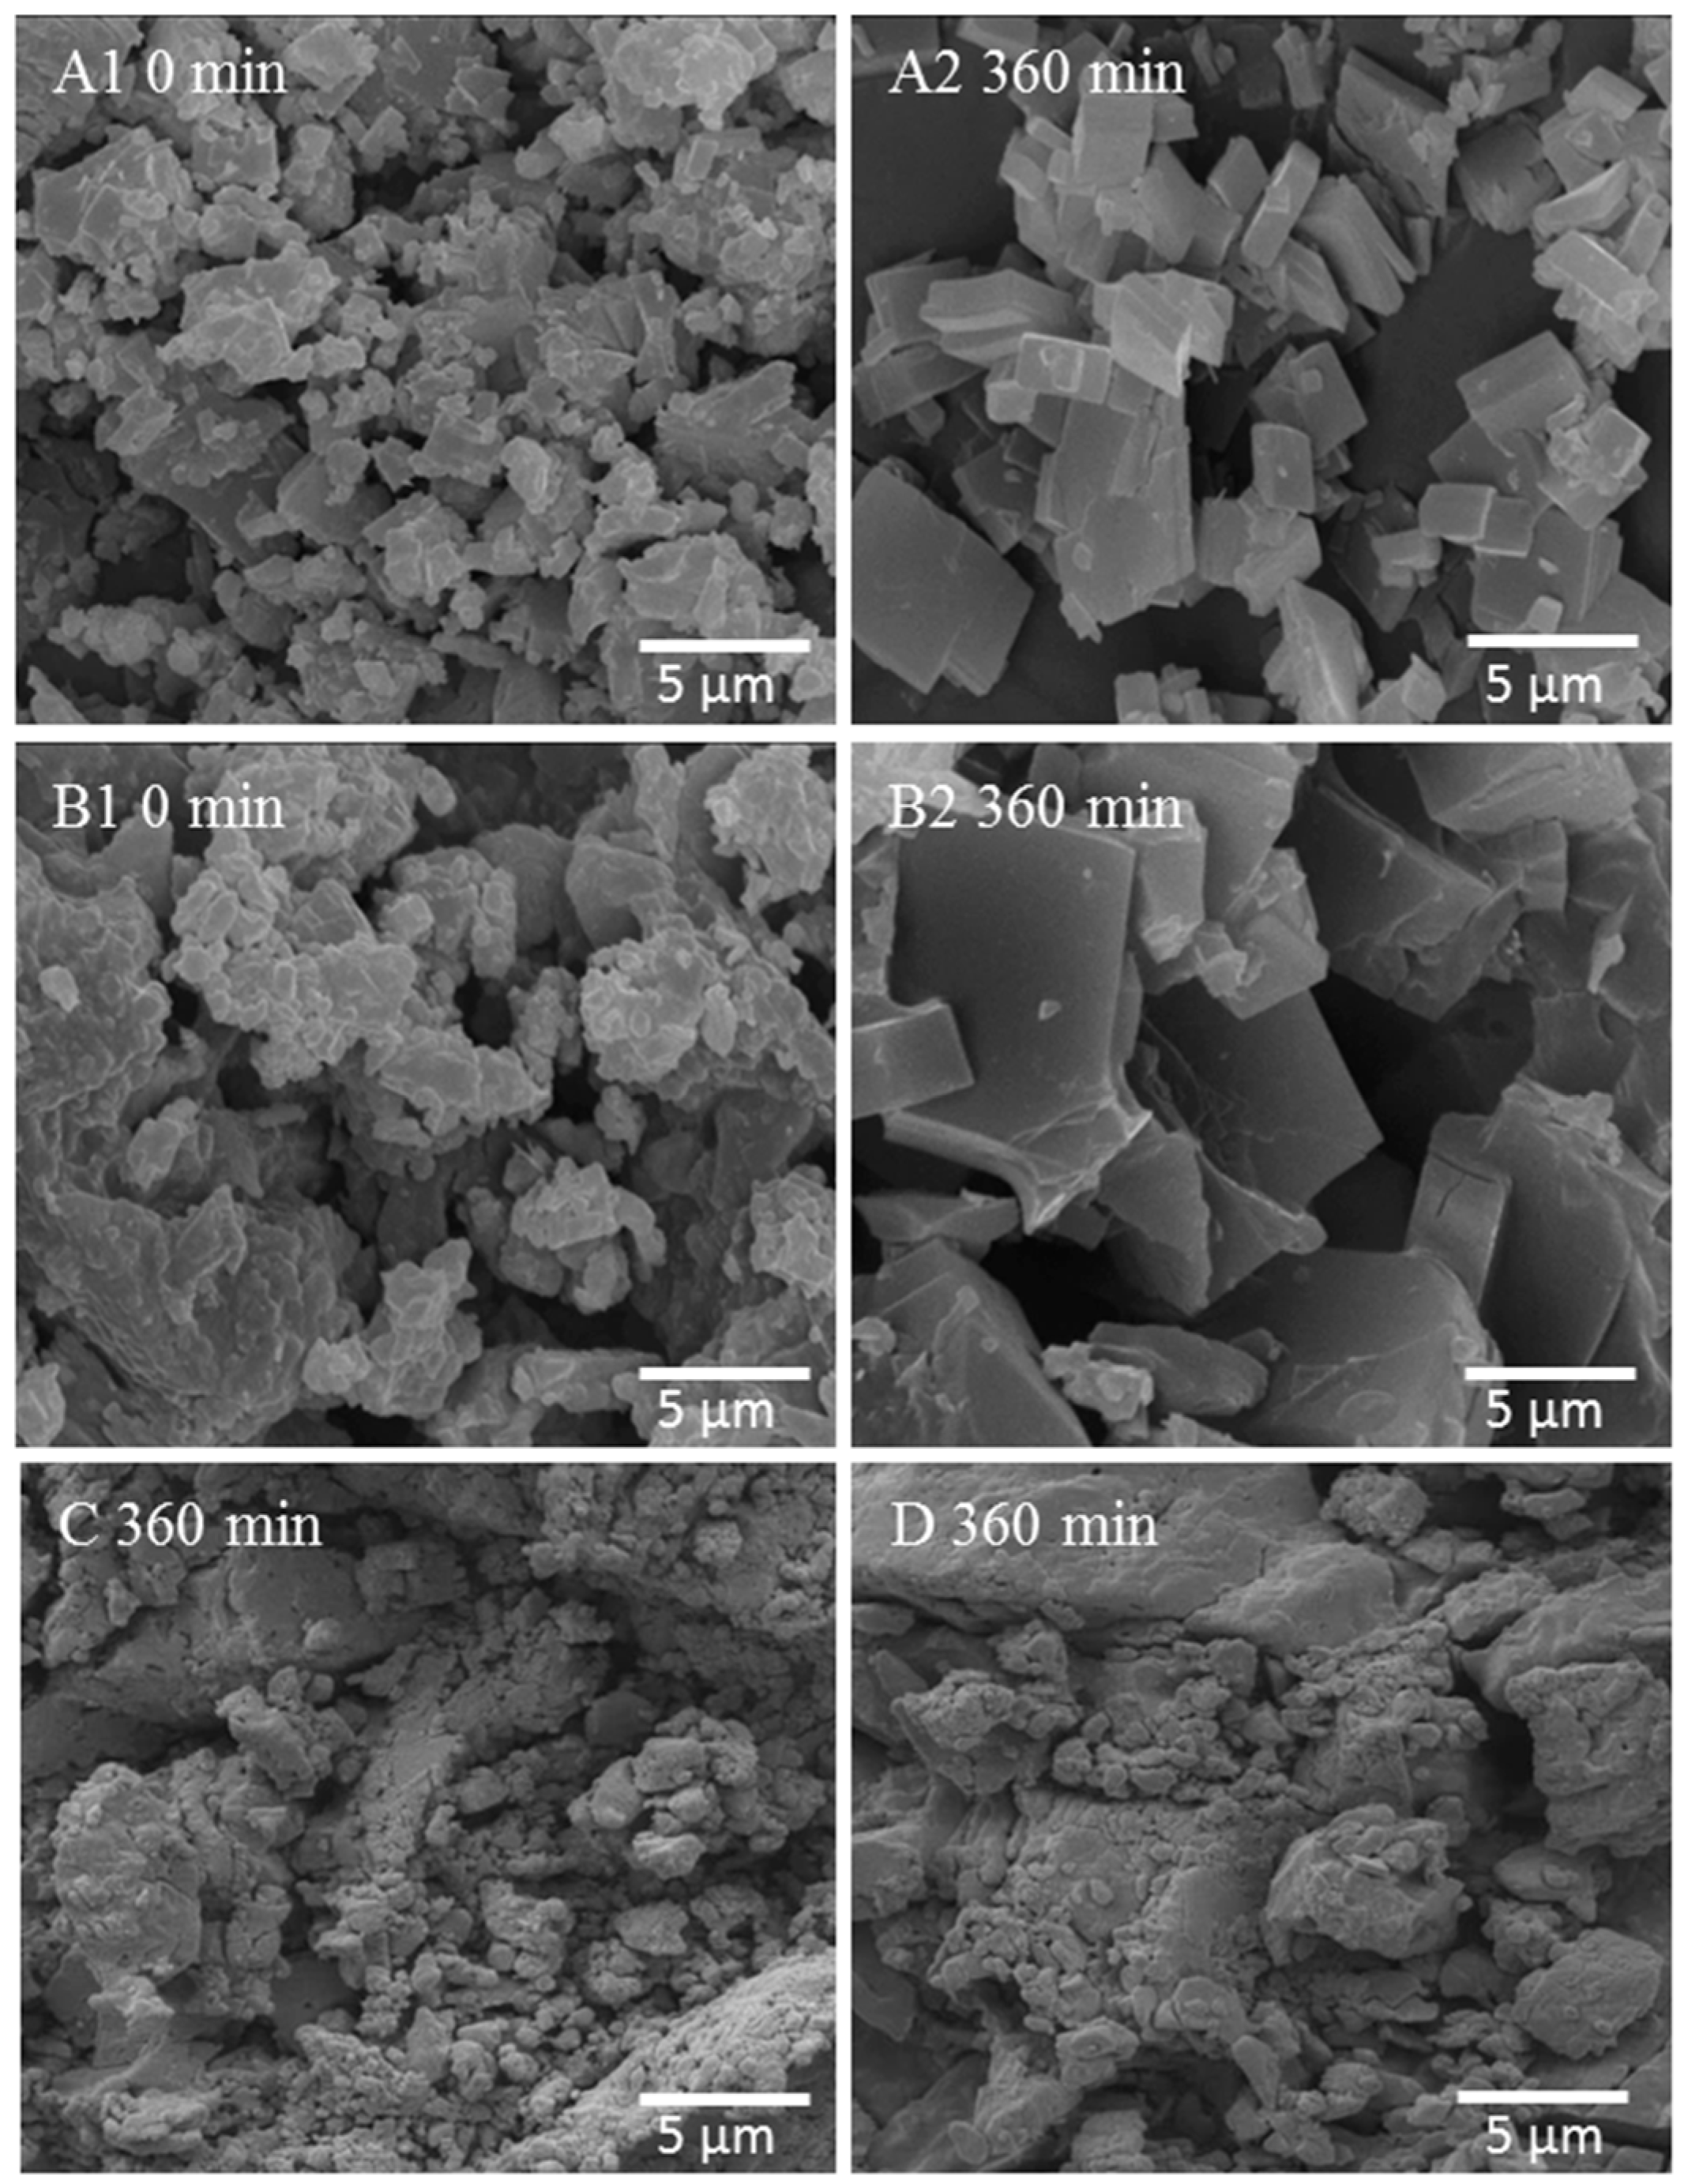
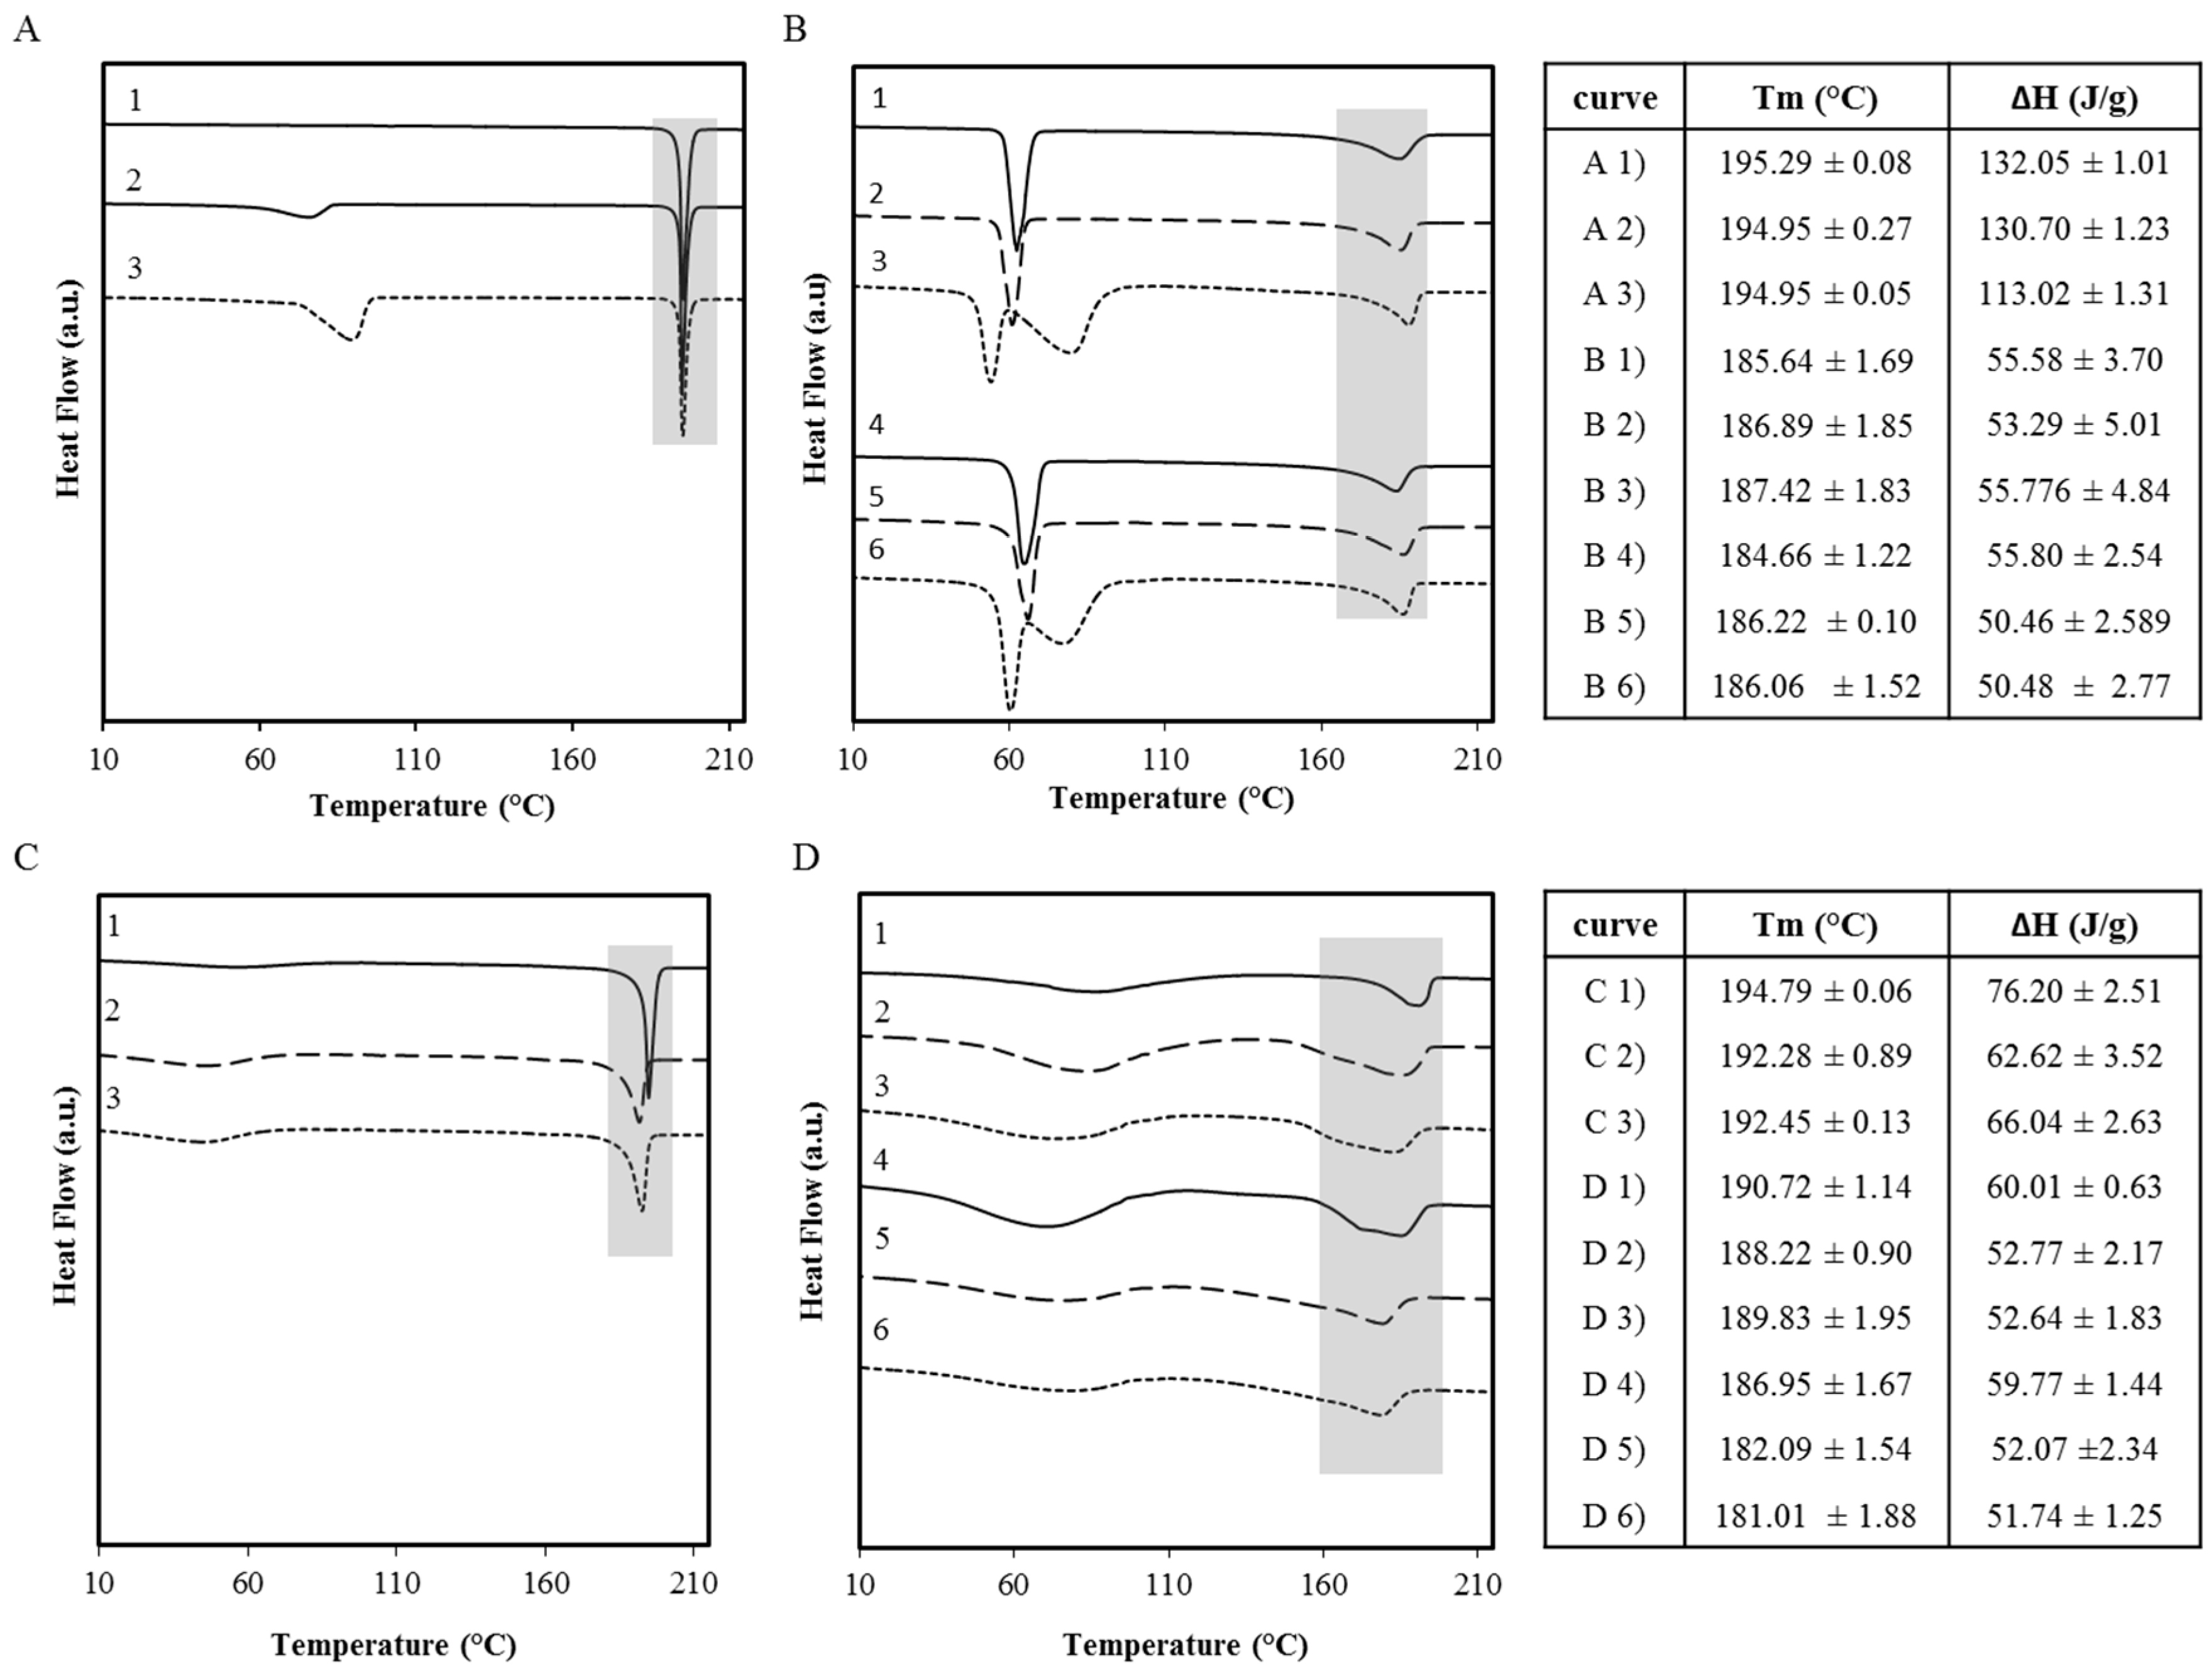
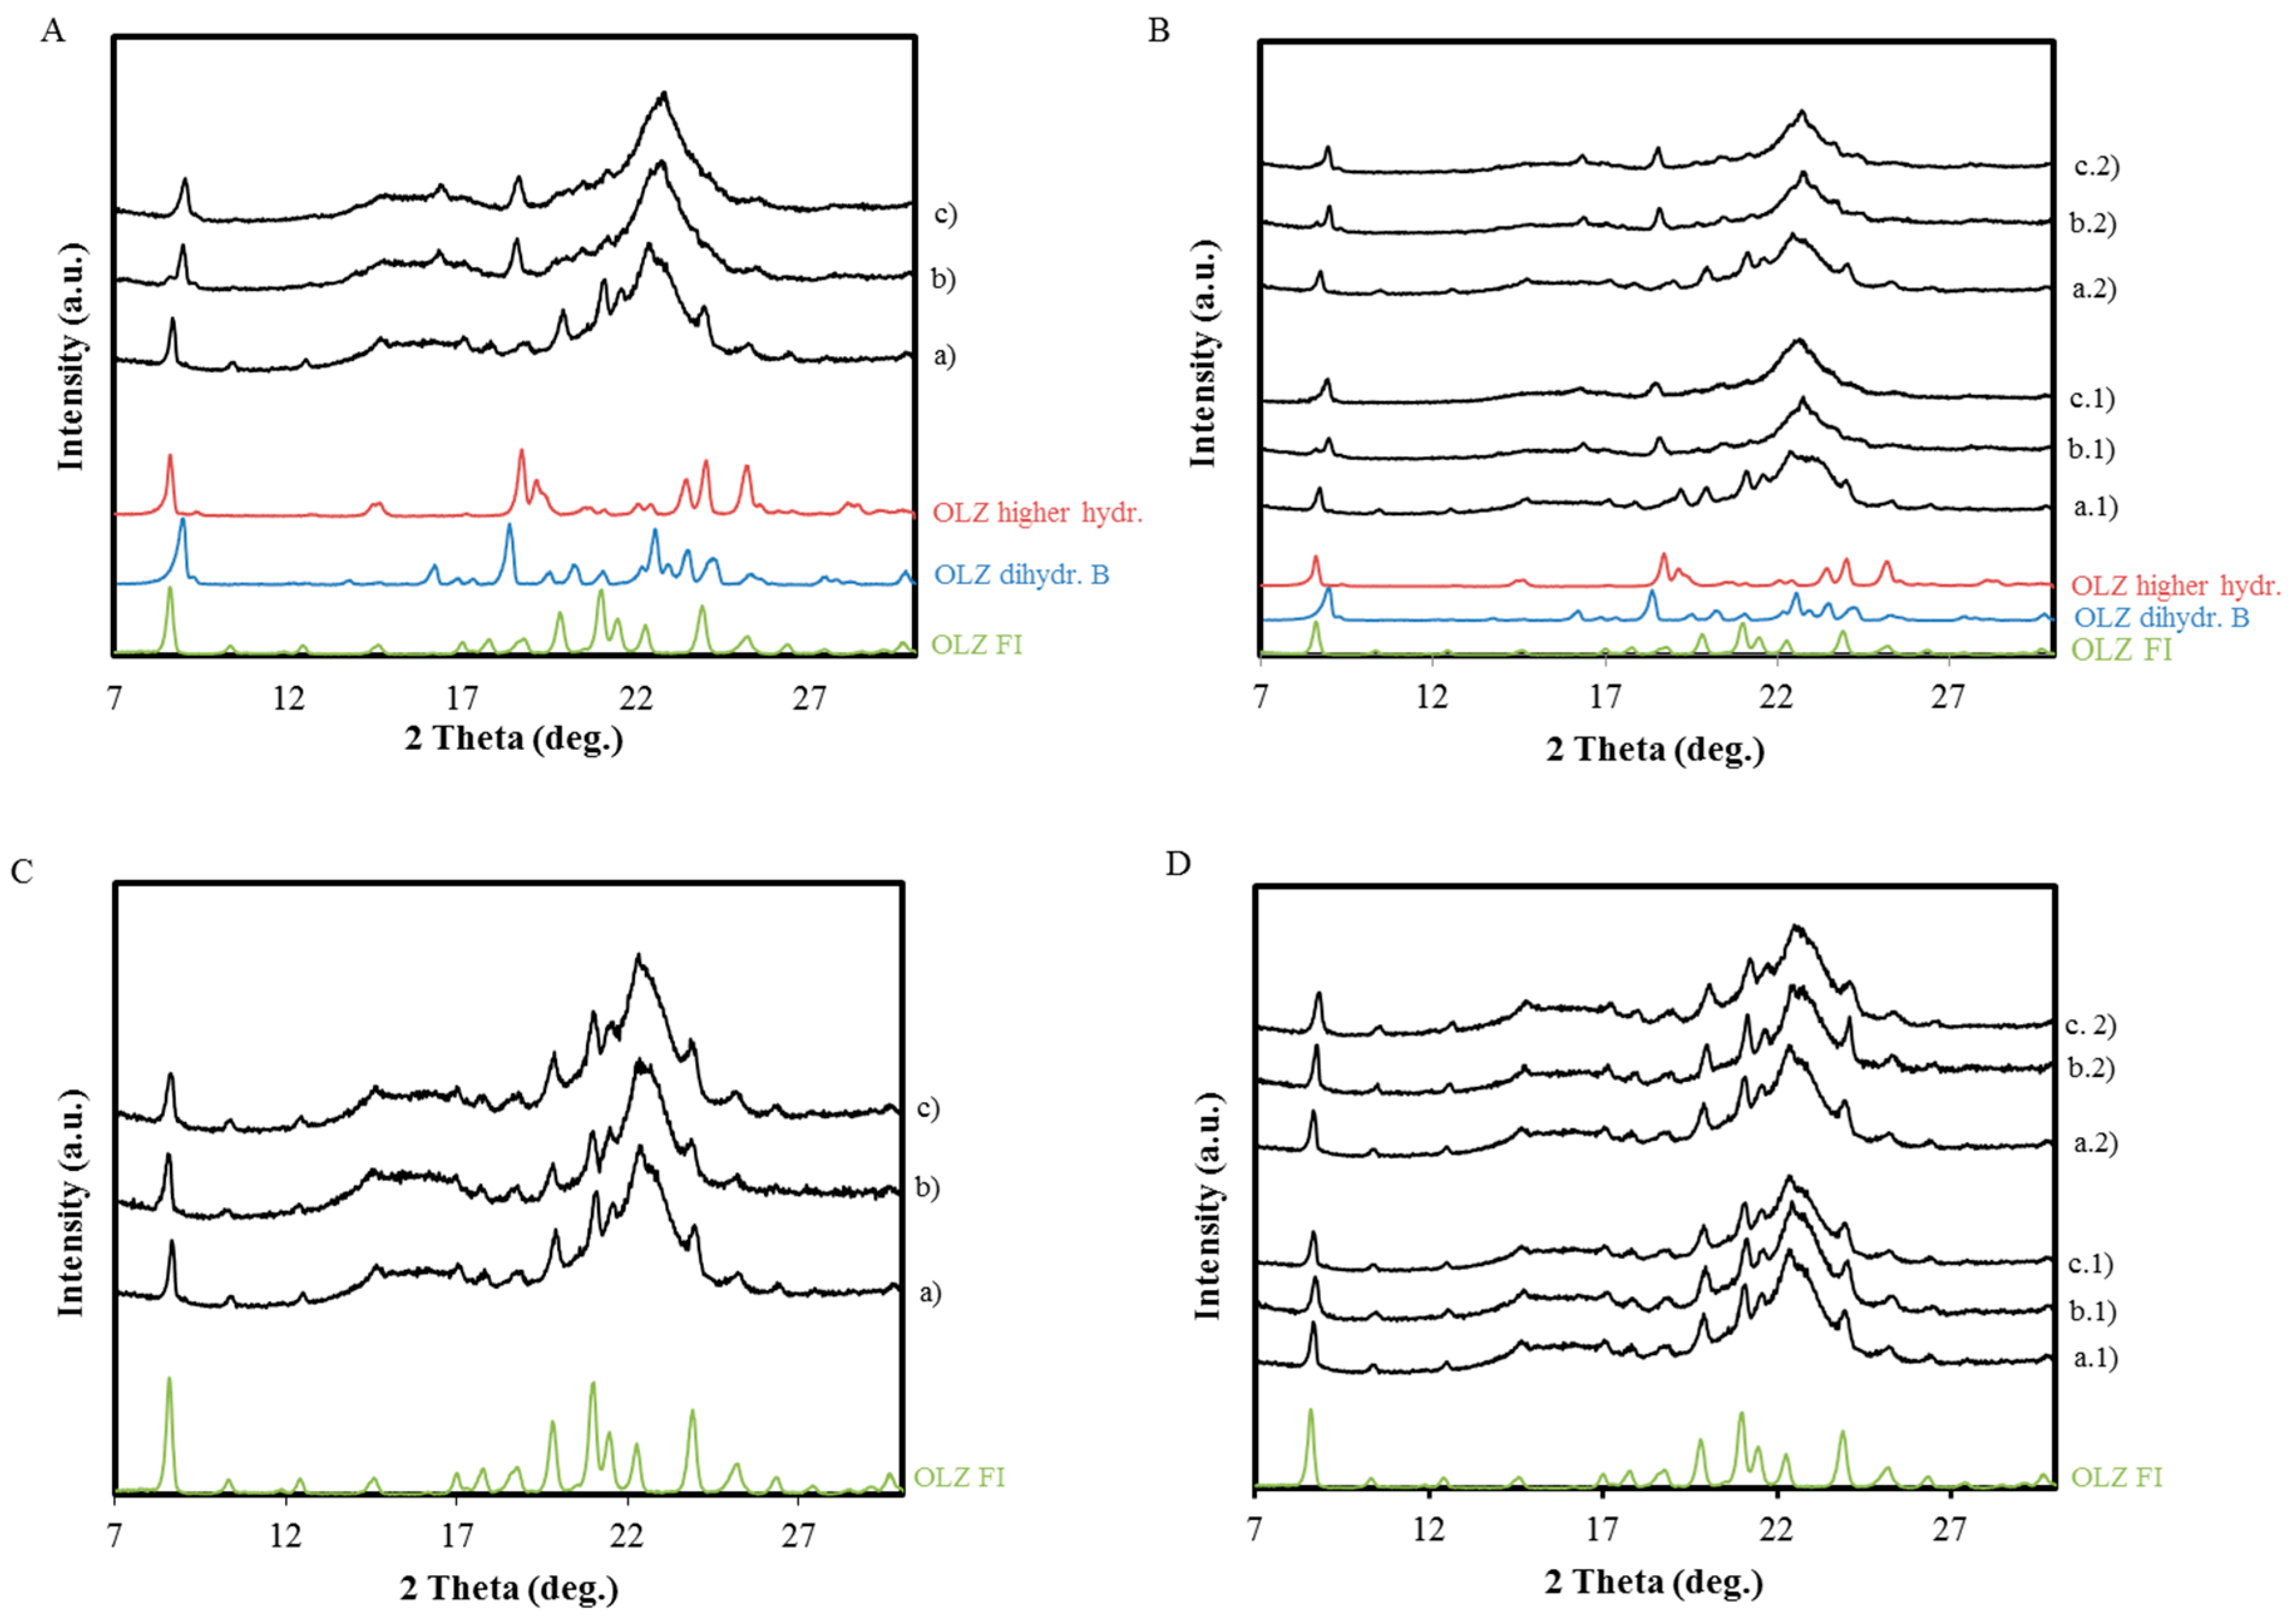
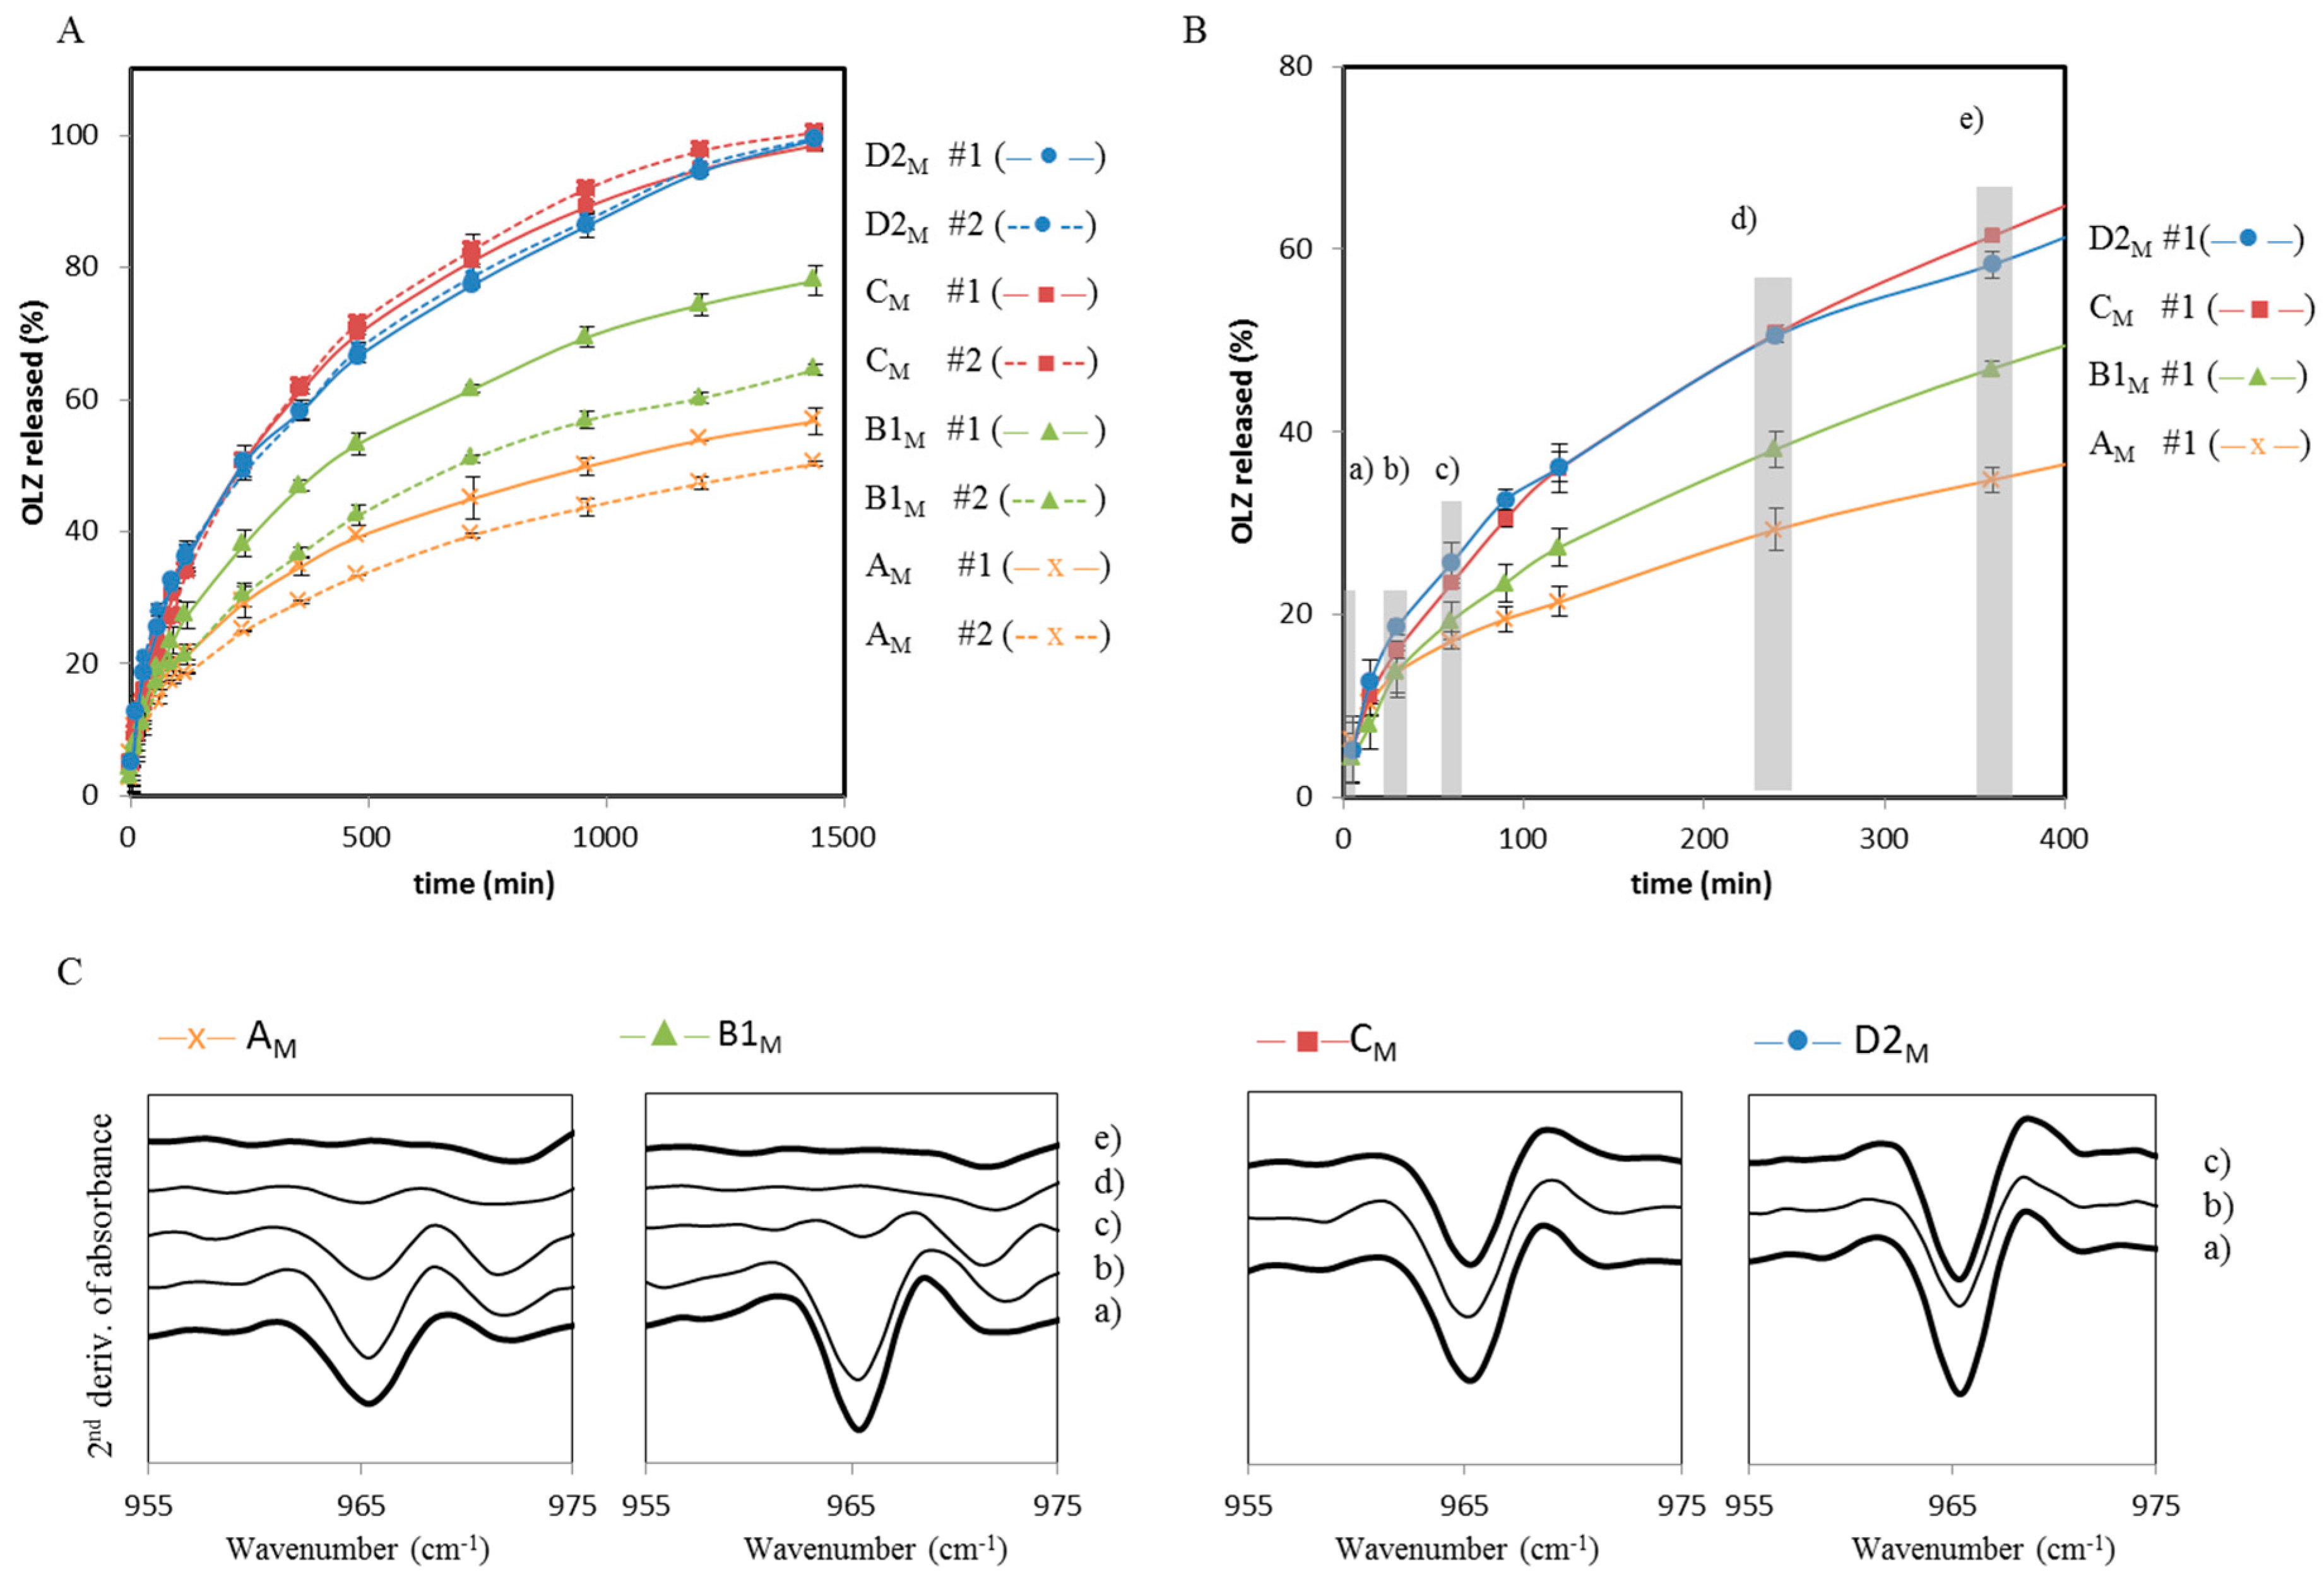
2.2. Characterization of OLZ Wet Masses and Pellets Containing Microcrystalline Cellulose


| Formulation | First-Order Model | Higuchi Model | Korsmeyer-Peppas Model | ||||||||
|---|---|---|---|---|---|---|---|---|---|---|---|
| Adj R2 | MSE Root | K1 | Adj R2 | MSE Root | kH | Adj R2 | MSE Root | kKP | n | ||
| AM | #1 | 0.669 | 9.946 | 0.001 | 0.952 | 3.797 | 1.648 | 0.997 | 0.958 | 3.585 | 0.383 |
| #2 | 0.706 | 8.624 | 0.001 | 0.97 | 2.728 | 1.441 | 0.995 | 1.127 | 2.676 | 0.407 | |
| B1M | #1 | 0.82 | 10.15 | 0.002 | 0.962 | 4.674 | 2.218 | 0.994 | 1.794 | 4.442 | 0.395 |
| #2 | 0.839 | 8.466 | 0.001 | 0.986 | 2.464 | 1.821 | 0.995 | 1.554 | 2.703 | 0.441 | |
| CM | #1 | 0.951 | 6.910 | 0.002 | 0.986 | 3.81 | 2.696 | 0.995 | 2.226 | 4.450 | 0.431 |
| #2 | 0.926 | 8.408 | 0.003 | 0.973 | 5.044 | 2.755 | 0.995 | 2.353 | 4.966 | 0.411 | |
| DM | #1 | 0.972 | 5.697 | 0.003 | 0.958 | 6.991 | 2.995 | 0.980 | 4.801 | 5.510 | 0.408 |
| #2 | 0.978 | 5.115 | 0.003 | 0.956 | 7.321 | 3.069 | 0.981 | 4.658 | 5.494 | 0.410 | |
3. Discussion
4. Experimental Section
4.1. Materials
4.1.1. OLZ Dihydrate B
4.1.2. OLZ Dihydrate E
4.1.3. OLZ Higher Hydrate
4.2. Methods
4.2.1. Conversion of OLZ FI during Wet Massing in the Presence of Polymers
4.2.2. Manufacture of Pellets Containing Polymers
| Formulation | Components (in Parts) | ||
|---|---|---|---|
| OLZ | Polymer | MCC | |
| AM | 1.5 | - | 8.5 |
| B1M | 1.5 | 1.0 (PEG 6000) | 7.5 |
| B2M | 1.5 | 1.0 (PEG 40,000) | 7.5 |
| CM | 1.5 | 1.0 (HPC-LF) | 7.5 |
| D1M | 1.5 | 1.0 (PVP k12) | 7.5 |
| D2M | 1.5 | 1.0 (PVP k30) | 7.5 |
4.2.3. Characterization of Blends and Pellets
X-ray Powder Diffraction (XRPD)
Differential Scanning Calorimetry (DSC)
FT-Infrared Spectroscopy (FTIR)
Scanning Electron Microscopy (SEM)
Wettability and Surface Energy Measurements
Dissolution Studies
5. Conclusions
Acknowledgments
Author Contributions
Conflicts of Interest
Abbreviations
| API | Active pharmaceutical ingredient |
| CSD | Cambridge structural database |
| DSC | dynamic scanning calorimetry |
| Formulation A (A) | OLZ + water |
| Formulation B1/B2 (B1/B2) | OLZ + (PEG 6000/PEG 40,000) + water |
| Formulation C (C) | OLZ + HPC + water |
| Formulation D1/D2 (D1/D2) | OLZ + (PVP k12/PVP k30) + water |
| Formulation AM (A) | OLZ + water + MCC |
| Formulation B1M/B2M (B1M/B2M) | OLZ + (PEG 6000/PEG 40,000) + water + MCC |
| Formulation CM (CM) | OLZ + HPC + water + MCC |
| Formulation D1M/D2M (D1M/D2M) | OLZ + (PVP k12/PVP k30) + water + MCC |
| FTIR | Fourier transformed infrared spectroscopy |
| HPC | Hydroxypropylcellulose |
| HPMC | Hydroxypropylmethylcellulose |
| MCC | Microcrystalline cellulose |
| OLZ | Olanzapine |
| PVP | Polyvinylpyrrolidone |
| SEM | Scanning electronic microscopy |
| SMT | Solvent-mediated polymorphic transformations |
| XRPD | X-ray powder diffraction |
References
- Phadnis, N.V.; Suryanarayanan, R. Polymorphism in anhydrous theophylline—Implications on the dissolution rate of theophylline tablets. J. Pharm. Sci. 1997, 86, 1256–1263. [Google Scholar] [CrossRef] [PubMed]
- Airaksinen, S.; Luukkonen, P.; Jorgensen, A.; Karjalainen, M.; Rantanen, J.; Yliruusi, J. Effects of excipients on hydrate formation in wet masses containing theophylline. J. Pharm. Sci. 2003, 92, 516–528. [Google Scholar] [CrossRef] [PubMed]
- Patel, D.D.; Anderson, B.D. Adsorption of Polyvinylpyrrolidone and its Impact on Maintenance of Aqueous Supersaturation of Indomethacin via Crystal Growth Inhibition. J. Pharm. Sci. 2015, 104, 2923–2933. [Google Scholar] [CrossRef] [PubMed]
- Gift, A.D.; Luner, P.E.; Luedeman, L.; Taylor, L.S. Influence of polymeric excipients on crystal hydrate formation kinetics in aqueous slurries. J. Pharm. Sci. 2008, 97, 5198–5211. [Google Scholar] [CrossRef] [PubMed]
- Sandler, N.; Rantanen, J.; Heinamaki, J.; Romer, M.; Marvola, M.; Yliruusi, J. Pellet manufacturing by extrusion-spheronisation using process analytical technology. AAPS PharmSciTech 2005, 6, E174–E183. [Google Scholar] [CrossRef] [PubMed]
- Jorgensen, A.; Rantanen, J.; Karjalainen, M.; Khriachtchev, L.; Rasanen, E.; Yliruusi, J. Hydrate formation during wet granulation studied by spectroscopic methods and multivariate analysis. Pharm. Res. 2002, 19, 1285–1291. [Google Scholar] [CrossRef] [PubMed]
- Dukić-Ott, A.; Thommes, M.; Remon, J.P.; Kleinebudde, P.; Vervaet, C. Production of pellets via extrusion-spheronisation without the incorporation of microcrystalline cellulose: A critical review. Eur. J. Pharm. Biopharm. 2009, 71, 38–46. [Google Scholar] [CrossRef] [PubMed]
- Katzhendler, I.; Azoury, R.; Friedman, M. Crystalline properties of carbamazepine in sustained release hydrophilic matrix tablets based on hydroxypropyl methylcellulose. J. Control. Release 1998, 54, 69–85. [Google Scholar] [CrossRef]
- Tian, F.; Saville, D.J.; Gordon, K.C.; Strachan, C.J.; Zeitler, J.A.; Sandler, N.; Rades, T. The influence of various excipients on the conversion kinetics of carbamazepine polymorphs in aqueous suspension. J. Pharm. Pharmacol. 2007, 59, 193–201. [Google Scholar] [CrossRef] [PubMed]
- Reutzel-Edens, S.M.; Bush, J.K.; Magee, P.A.; Stephenson, G.A.; Byrn, S.R. Anhydrates and Hydrates of Olanzapine: Crystallization, Solid-State Characterization, and Structural Relationships. Cryst. Growth Des. 2003, 3, 897–907. [Google Scholar] [CrossRef]
- Ayala, A.P.; Siesler, H.W.; Boese, R.; Hoffmann, G.G.; Polla, G.I.; Vega, D.R. Solid state characterization of olanzapine polymorphs using vibrational spectroscopy. Int. J. Pharm. 2006, 326, 69–79. [Google Scholar] [CrossRef] [PubMed]
- Thijs, H.M.L.; Becer, C.R.; Guerrero-Sanchez, C.; Fournier, D.; Hoogenboom, R.; Schubert, U.S. Water uptake of hydrophilic polymers determined by a thermal gravimetric analyzer with a controlled humidity chamber. J. Mater. Chem. 2007, 17, 4864–4871. [Google Scholar] [CrossRef]
- Gift, A.D.; Luner, P.E.; Luedeman, L.; Taylor, L.S. Manipulating hydrate formation during high shear wet granulation using polymeric excipients. J. Pharm. Sci. 2009, 98, 4670–4683. [Google Scholar] [CrossRef] [PubMed]
- Wikström, H.; Rantanen, J.; Gift, A.D.; Taylor, L.S. Toward an Understanding of the Factors Influencing Anhydrate-to-Hydrate Transformation Kinetics in Aqueous Environments. Cryst. Growth Des. 2008, 8, 2684–2693. [Google Scholar] [CrossRef]
- Rodriguez-Hornedo, N.; Murphy, D. Significance of controlling crystallization mechanisms and kinetics in pharmaceutical systems. J. Pharm. Sci. 1999, 88, 651–660. [Google Scholar] [CrossRef] [PubMed]
- Mangin, D.; Puel, F.; Veesler, S. Polymorphism in Processes of Crystallization in Solution: A Practical Review. Org. Process Res. Dev. 2009, 13, 1241–1253. [Google Scholar] [CrossRef]
- Davis, T.D.; Peck, G.E.; Stowell, J.G.; Morris, K.R.; Byrn, S.R. Modeling and monitoring of polymorphic transformations during the drying phase of wet granulation. Pharm. Res. 2004, 21, 860–866. [Google Scholar] [CrossRef] [PubMed]
- Otsuka, M.; Ishii, M.; Matsuda, Y. Effect of surface-modification on hydration kinetics of nitrofurantoin anhydrate. Colloids Surf. B 2002, 23, 73–82. [Google Scholar] [CrossRef]
- Thakuria, R.; Nangia, A. Polymorphic form IV of olanzapine. Acta Crystallogr. Sect. C Cryst. Struct. Commun. 2011, 67, o461–o463. [Google Scholar] [CrossRef] [PubMed]
- Wikstrom, H.; Carroll, W.J.; Taylor, L.S. Manipulating theophylline monohydrate formation during high-shear wet granulation through improved understanding of the role of pharmaceutical excipients. Pharm. Res. 2008, 25, 923–935. [Google Scholar] [CrossRef] [PubMed]
- Otsuka, M.; Ohfusa, T.; Matsuda, Y. Effect of the binders on polymorphic transformation kietics of carbamazepine in aqueous solution. Colloids Surf. B Biointerfaces 2000, 17, 145–152. [Google Scholar] [CrossRef]
- Raghavan, S.L.; Trividic, A.; Davis, A.F.; Hadgraft, J. Crystallization of hydrocortisone acetate: Influence of polymers. Int. J. Pharm. 2001, 212, 213–221. [Google Scholar] [CrossRef]
- Aaltonen, J.; Heinanen, P.; Peltonen, L.; Kortejarvi, H.; Tanninen, V.P.; Christiansen, L.; Hirvonen, J.; Yliruusi, J.; Rantanen, J. In situ measurement of solvent-mediated phase transformations during dissolution testing. J. Pharm. Sci. 2006, 95, 2730–2737. [Google Scholar] [CrossRef] [PubMed]
- Karim, S.; Baie, S.H.; Hay, Y.K.; Bukhari, N.I. Development and evaluation of omeprazole pellets fabricated by sieving-spheronisation and extrusion—Spheronisation process. Pak. J. Pharm. Sci. 2014, 27, 425–438. [Google Scholar] [PubMed]
- Kleinebudde, P. Application of low substituted hydroxypropylcellulose (L-HPC) in the production of pellets using extrusion/spheronisation. Int. J. Pharm. 1993, 96, 119–128. [Google Scholar] [CrossRef]
- Majidi, S.; Motlagh, G.H.; Bahramian, B.; Kaffashi, B.; Nojoumi, S.A.; Haririan, I. Rheological evaluation of wet masses for the preparation of pharmaceutical pellets by capillary and rotational rheometers. Pharm. Dev. Technol. 2013, 18, 112–120. [Google Scholar] [CrossRef] [PubMed]
- Sousa, J.J.; Sousa, A.; Podczeck, F.; Newton, J.M. Factors influencing the physical characteristics of pellets obtained by extrusion-spheronisation. Int. J. Pharm. 2002, 232, 91–106. [Google Scholar] [CrossRef]
- Wu, S. Calculation of interfacial tension in polymer systems. J. Polym. Sci. C Polym.Symp. 1971, 34, 19–30. [Google Scholar] [CrossRef]
- Sample Availability: Samples of hydrated olanzapine are available from the authors.
© 2015 by the authors. Licensee MDPI, Basel, Switzerland. This article is an open access article distributed under the terms and conditions of the Creative Commons by Attribution (CC-BY) license ( http://creativecommons.org/licenses/by/4.0/).
Share and Cite
Paisana, M.; Wahl, M.; Pinto, J. Role of Polymeric Excipients in the Stabilization of Olanzapine when Exposed to Aqueous Environments. Molecules 2015, 20, 22364-22382. https://doi.org/10.3390/molecules201219832
Paisana M, Wahl M, Pinto J. Role of Polymeric Excipients in the Stabilization of Olanzapine when Exposed to Aqueous Environments. Molecules. 2015; 20(12):22364-22382. https://doi.org/10.3390/molecules201219832
Chicago/Turabian StylePaisana, Maria, Martin Wahl, and João Pinto. 2015. "Role of Polymeric Excipients in the Stabilization of Olanzapine when Exposed to Aqueous Environments" Molecules 20, no. 12: 22364-22382. https://doi.org/10.3390/molecules201219832