
Investigation of a Quantitative Method for the Analysis of Chiral Monoterpenes in White Wine by HS-SPME-MDGC-MS of Different Wine Matrices

Abstract
:1. Introduction
2. Results and Discussion
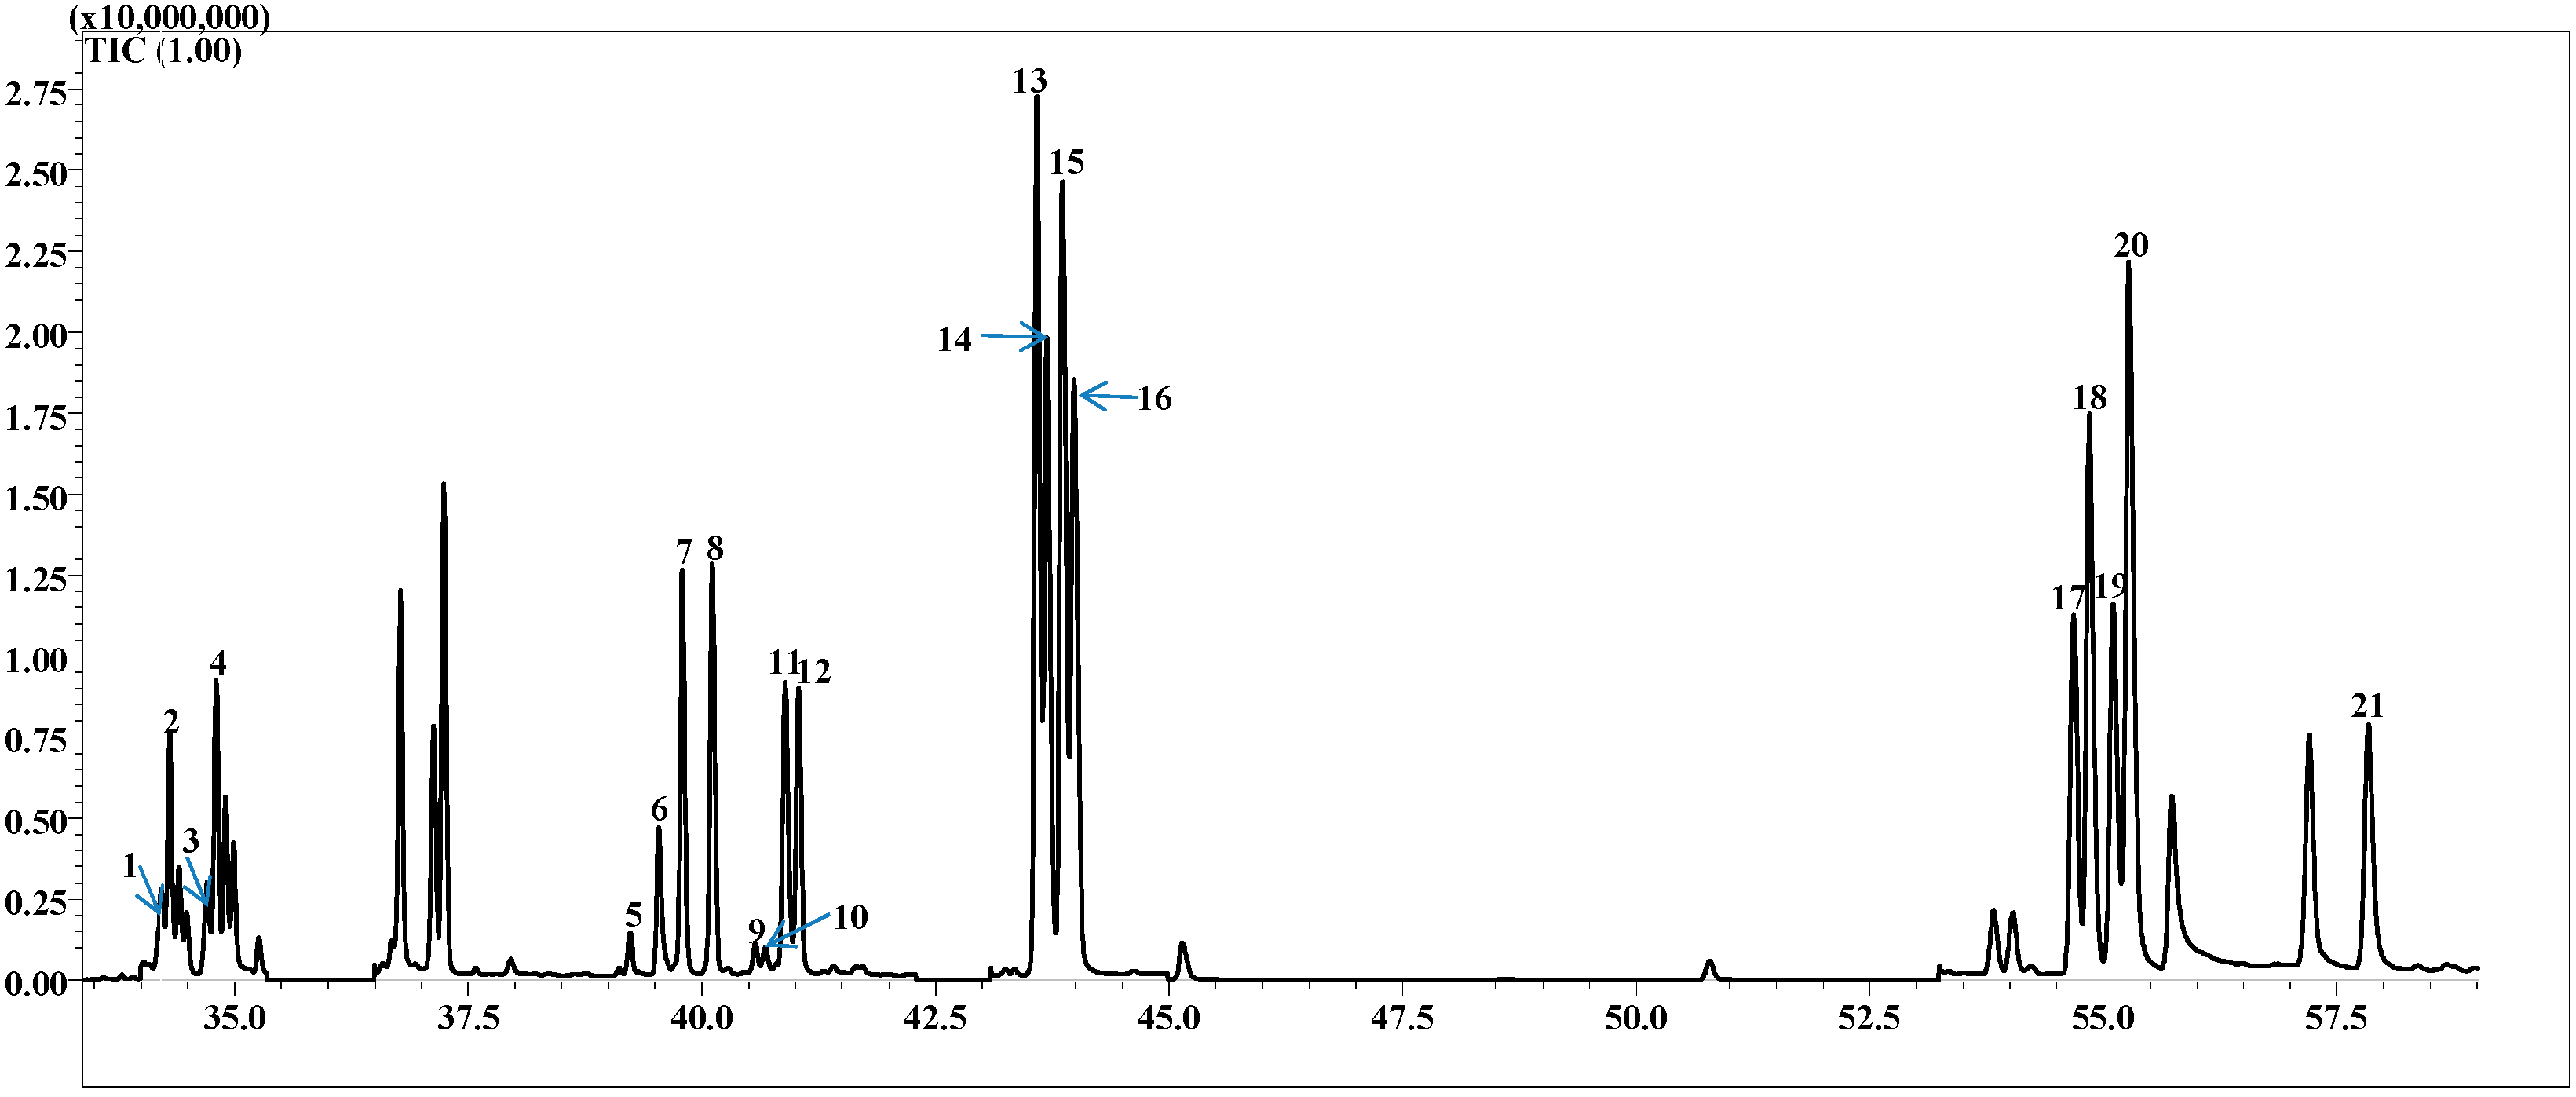
2.1. Separation of Chiral Mono-Terpenes in MDGC-MS

2.2. Validation of the Quantitative Method
2.2.1. Linearity of Calibration Curve in Different Wine Matrix

| Compounds 1 | ISTD 2 | Ions Chosen 3 (m/z) | De-aromatized Low (L) Base 5 | De-aromatized High (H) Base 5 | ||||
|---|---|---|---|---|---|---|---|---|
| L first 4 | L middle 4 | L last 4 | H first 4 | H middle 4 | H last 4 | |||
| Slope | Slope | Slope | Slope | Slope | Slope | |||
| 2 | 1 | 107, 121, 136 | 0.21 a | 0.12 b | 0.10 b | 0.14 a | 0.11 b | 0.10 b |
| 4 | 2 | 107, 121, 136 | 0.23 a | 0.12 b | 0.10 b | 0.12 a | 0.12 a | 0.11 a |
| 5 | 3 | 139, 69, 83 | 0.14 a | 0.33 c | 0.25 b | 0.21 a | 0.32 c | 0.29 b |
| 6 | 3 | 139, 69, 83 | 0.13 a | 0.28 c | 0.24 b | 0.19 a | 0.30 b | 0.28 b |
| 7 | 3 | 94, 93, 111 | 0.01 a | 0.02 a | 0.02 a | 0.01 a | 0.02 a | 0.03 a |
| 8 | 3 | 94, 93, 111 | 0.01 a | 0.02 a | 0.02 a | 0.01 a | 0.02 a | 0.03 a |
| 9 | 3 | 139, 69, 83 | 0.09 a | 0.17 b | 0.15 b | 0.11 a | 0.14 b | 0.16 b |
| 10 | 3 | 139, 69, 83 | 0.07 a | 0.13 b | 0.13 b | 0.09 a | 0.11 ab | 0.13 b |
| 11 | 3 | 94, 93, 111 | 0.01 a | 0.02 a | 0.02 a | 0.01 a | 0.02 a | 0.03 a |
| 12 | 3 | 94, 93, 111 | 0.01 a | 0.02 a | 0.02 a | 0.01 a | 0.02 a | 0.03 a |
| 14 | 3 | 121, 93, 136 | 0.01 a | 0.01 a | 0.01 a | 0.01 a | 0.01 a | 0.01 a |
| 16 | 4 | 121, 93, 136 | 0.01 a | 0.01 a | 0.01 a | 0.01 a | 0.01 a | 0.01 a |
| 18 | 5 | 59, 81, 121 | 0.07 a | 0.06 a | 0.06 a | 0.06 a | 0.06 a | 0.06 a |
| 20 | 6 | 59, 81, 121 | 0.05 a | 0.05 a | 0.05 a | 0.05 a | 0.05 a | 0.05 a |
| 21 | 6 | 95, 109, 123 | 0.03 a | 0.04 a | 0.03 a | 0.03 a | 0.03 a | 0.03 a |
| Compounds | LOD (ug/L) | LOQ (ug/L) | Spiked Recovery (%) | Riesling Reproducibility (RSD) g | Pinot Gris Reproducibility (RSD ) h | Standards Stability (RSD) i | |||||
|---|---|---|---|---|---|---|---|---|---|---|---|
| in PG Dry a | in PG Medium Dry b | in RS Dry c | in RS Medium Dry d | in RS Medium Sweet e | in RS Sweet f | ||||||
| 2 | 0.10 | 0.34 | 106 | 94 | 90 | 87 | 103 | 114 | 15.60 | 0.00 | 12.1 |
| 4 | 0.08 | 0.27 | 104 | 93 | 93 | 111 | 106 | 112 | 15.91 | 0.00 | 11.1 |
| 5 | 0.0002 | 0.001 | 101 | 129 | 119 | 135 | 137 | 119 | 0.00 | 0.00 | 15.2 |
| 6 | 0.0003 | 0.001 | 99 | 112 | 132 | 103 | 125 | 105 | 12.98 | 0.00 | 13.0 |
| 7 | 0.73 | 1.09 | 72 | 102 | 90 | 118 | 110 | 97 | 18.35 | 17.27 | 10.7 |
| 8 | 0.44 | 0.70 | 72 | 101 | 93 | 112 | 113 | 97 | 18.13 | 14.29 | 11.0 |
| 9 | 0.001 | 0.003 | 99 | 116 | 126 | 113 | 120 | 123 | 0.00 | 0.00 | 12.9 |
| 10 | 0.0006 | 0.002 | 94 | 102 | 114 | 118 | 110 | 114 | 15.57 | 0.00 | 12.8 |
| 11 | 0.28 | 0.93 | 76 | 103 | 103 | 116 | 118 | 100 | 15.12 | 0.00 | 15.6 |
| 12 | 0.33 | 1.11 | 72 | 100 | 97 | 115 | 114 | 96 | 0.00 | 15.26 | 12.8 |
| 14 | 0.03 | 0.12 | 101 | 98 | 106 | 101 | 102 | 103 | 0.00 | 0.00 | 9.5 |
| 16 | 0.08 | 0.25 | 102 | 100 | 109 | 98 | 101 | 102 | 12.57 | 0.00 | 9.5 |
| 18 | 0.19 | 0.62 | 100 | 96 | 112 | 104 | 107 | 102 | 13.35 | 14.21 | 4.3 |
| 20 | 0.15 | 0.49 | 98 | 95 | 106 | 101 | 103 | 102 | 14.85 | 16.00 | 4.8 |
| 21 | 0.02 | 0.08 | 98 | 103 | 96 | 81 | 108 | 107 | 15.60 | 11.01 | 15.0 |
2.2.2. Limit of Detection (LOD), Limit of Quantitation (LOQ), Wine Reproducibility and Internal Standards Stability
2.2.3. Accuracy
2.2.4. Temperature Stability
| Standards | Injector Temperature (°C) | Extraction Temperature (°C) | |||
|---|---|---|---|---|---|
| 200 | 230 | 250 | 40 | 60 | |
| 20 | 91.5 | 94.2 | 93.8 | 94.9 | 93.8 |
| 14 | 97.1 | 97.9 | 97.9 | 98.7 | 97.9 |
| 21 | 98.5 | 100.0 | 99.9 | 100.0 | 99.9 |
| 4 | 100.0 | 100.0 | 100.0 | 100.0 | 100.0 |
| 2 | 88.7 | 85.8 | 89.5 | 89.6 | 89.5 |
| 6 | 15.8 | 15.4 | 14.5 | 14.3 | 14.5 |
| 8 | 69.0 | 62.8 | 64.7 | 64.5 | 64.7 |
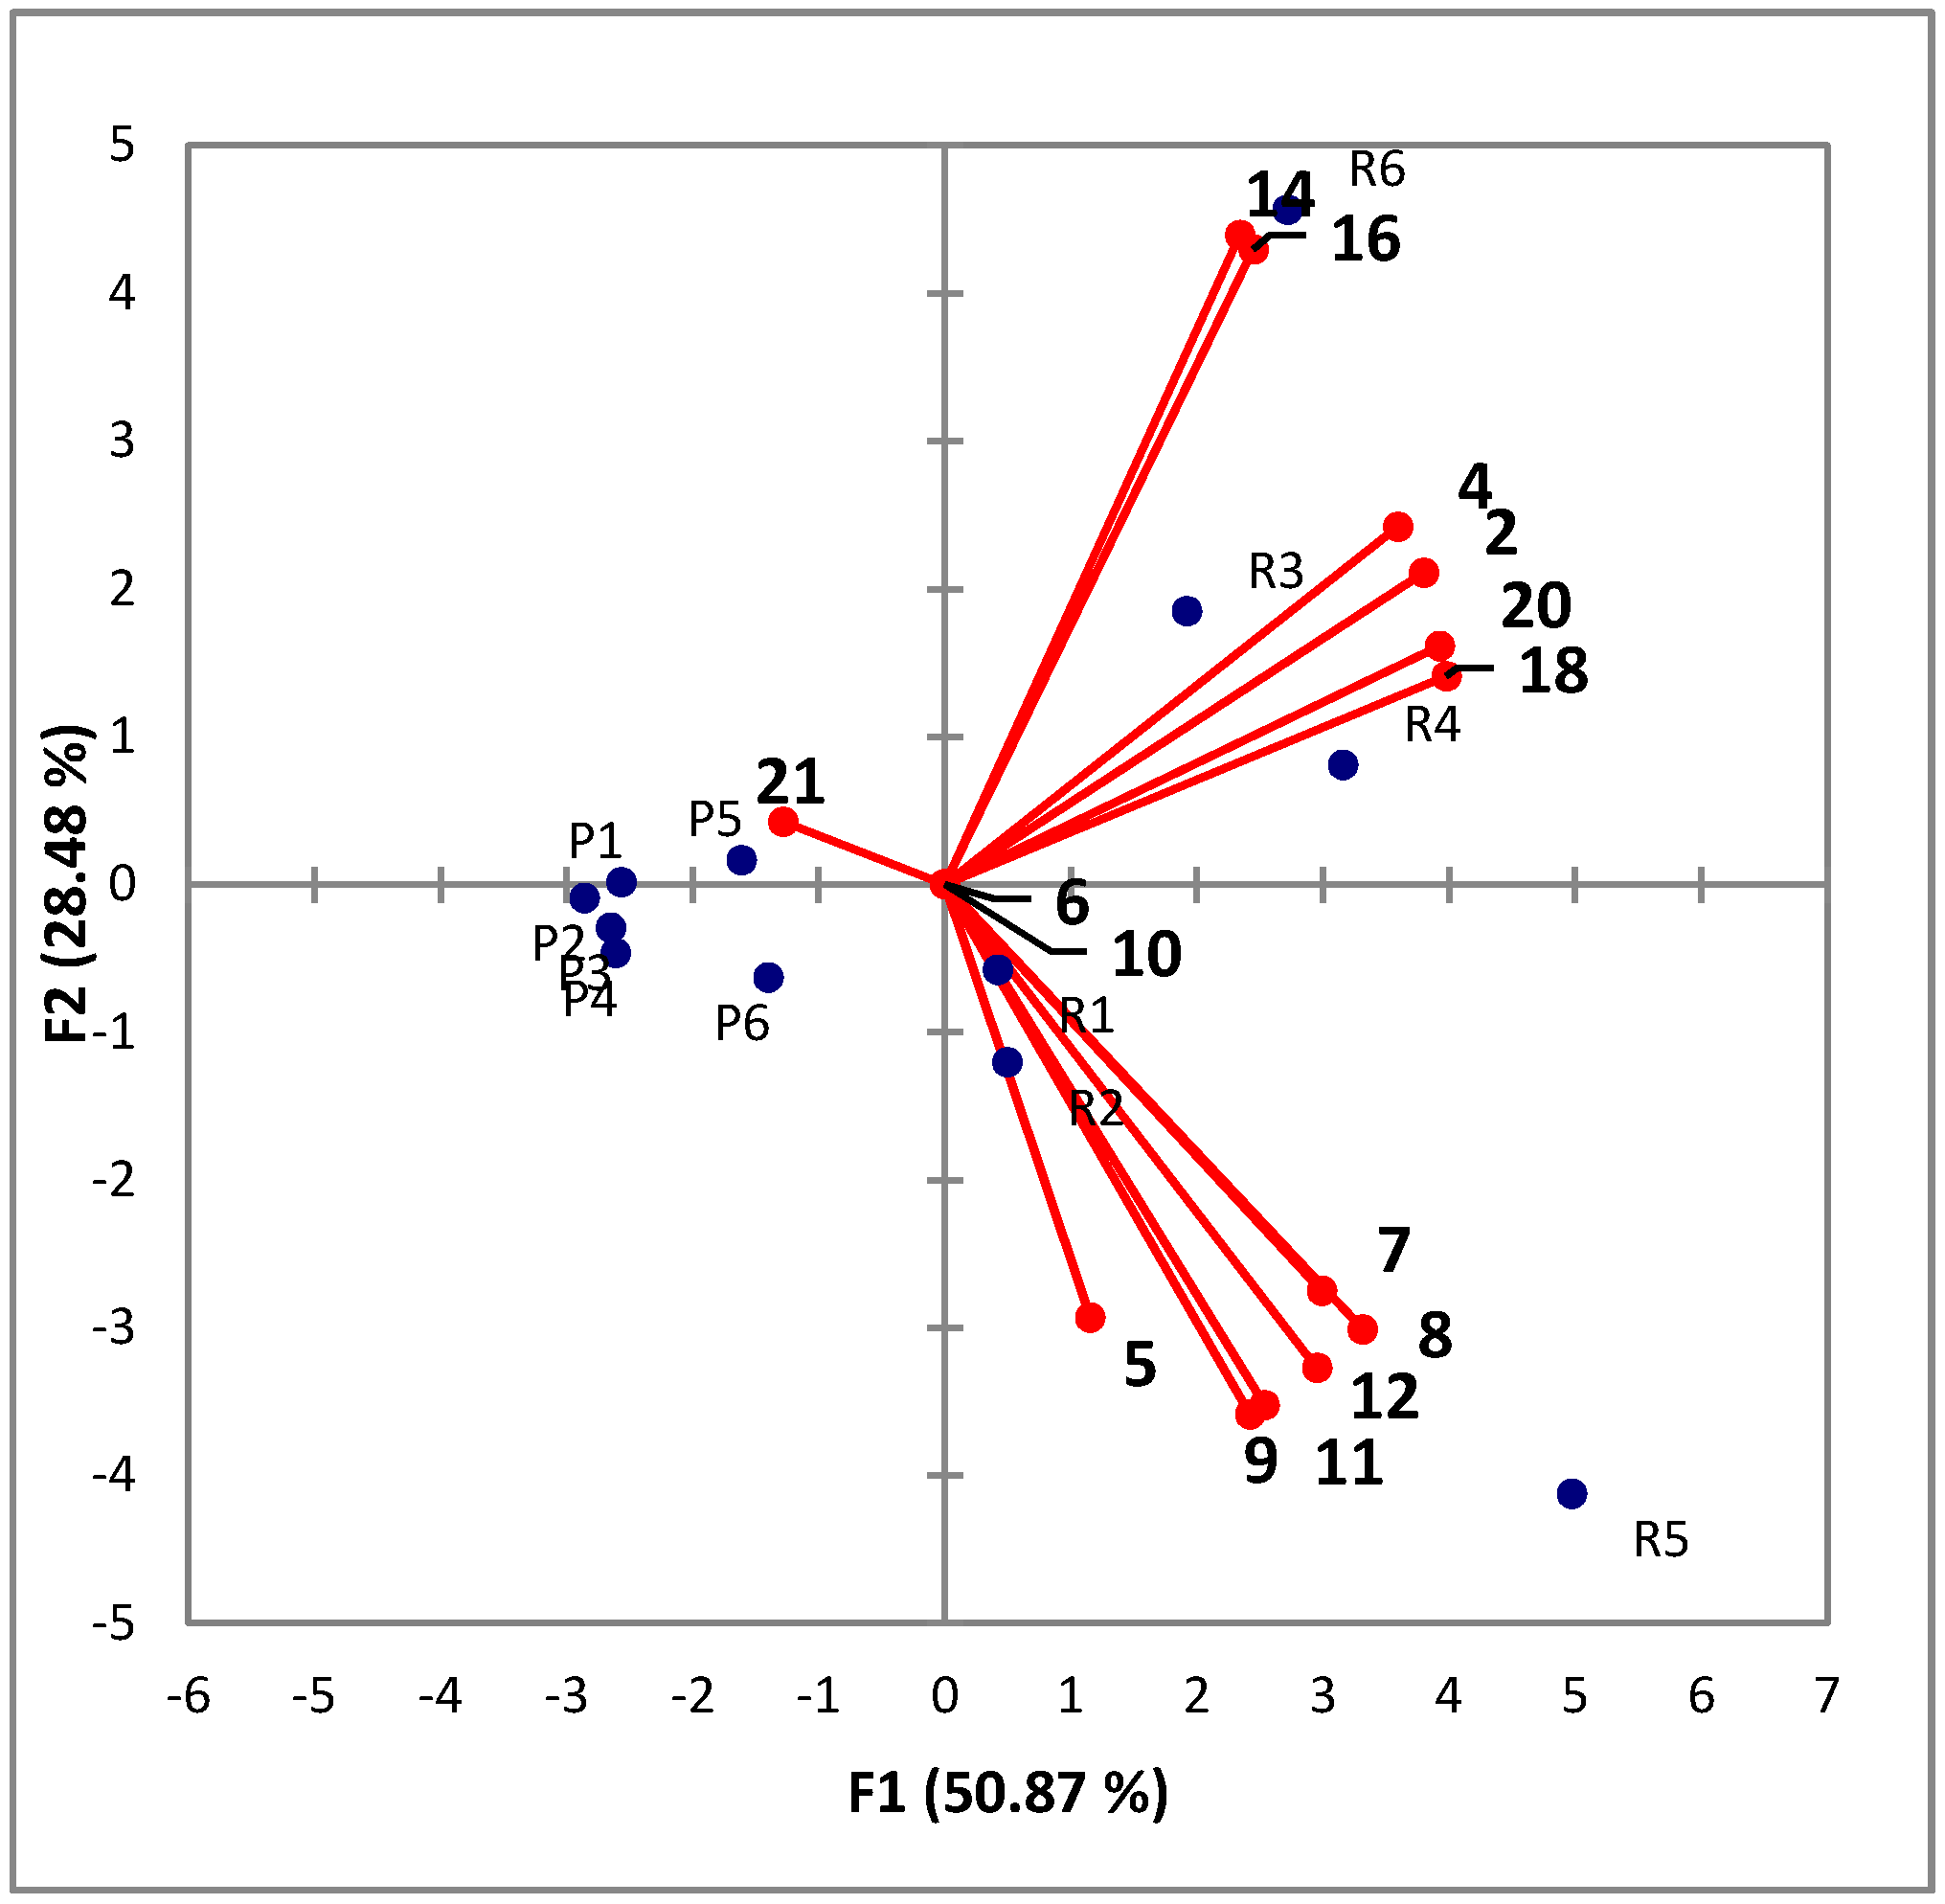
2.3. Wine Analysis
| (2) S-(−)-limonene (p < 0.0001) | (4) R-(+)-limonene (p < 0.0001) | (5) Rose Oxide Isomer (p < 0.0001) | ||||||
| Wine | Conc (µg/L) | Conf. Int. * | Wine | Conc (µg/L) | Conf. Int. * | Wine | Conc (µg/L) | Conf. Int. * |
| R6 | 11.88 | A | R6 | 10.94 | A | P6 | 0.33 | A |
| R4 | 10.56 | AB | R4 | 9.1 | AB | R5 | 0.3 | A |
| R3 | 9.19 | AB | R3 | 8.22 | AB | R4 | 0.11 | AB |
| R5 | 8.61 | AB | R5 | 7.24 | AB | P5 | 0.02 | AB |
| R1 | 4.29 | ABC | R1 | 3.62 | ABC | P1 | 0.02 | AB |
| R2 | 2.79 | ABCD | P5 | 1.71 | ABCD | P2 | nd | AB |
| P5 | 2.33 | ABCD | P6 | 1.39 | ABCD | P3 | nd | AB |
| P6 | 2.19 | ABCD | P1 | 1.29 | ABCD | P4 | nd | AB |
| P1 | 1.57 | ABCD | P2 | 0.75 | ABCD | R1 | nd | AB |
| P2 | 0.83 | ABCD | R2 | 0.21 | ABCD | R2 | nd | AB |
| P3 | nd | ABCD | P4 | nd | ABCD | R3 | nd | AB |
| P4 | nd | ABCD | P3 | nd | ABCD | R6 | nd | AB |
| (7) Linalool Oxide Isomer (p < 0.001) | (8) Linalool Oxide Isomer (p < 0.001) | (11) Linalool Oxide Isomer (p = 0.000) | ||||||
| Wine | Conc (µg/L) | Conf. Int. * | Wine | Conc (µg/L) | Conf. Int. * | Wine | Conc (µg/L) | Conf. Int. * |
| R5 | 44.3 | A | R5 | 34.28 | A | R5 | 14.42 | A |
| R2 | 42.69 | AB | R2 | 22.25 | AB | R4 | 6.7 | AB |
| R4 | 34.5 | ABC | R1 | 20.03 | AB | P5 | 5.06 | B |
| R1 | 29.01 | ABC | R4 | 18.28 | AB | R1 | 4.2 | B |
| R3 | 25.42 | ABC | R3 | 16.17 | B | P6 | 4.05 | B |
| P1 | 9.85 | BC | R6 | 13.62 | B | P4 | 3.4 | B |
| P4 | 9.73 | BC | P4 | 10.66 | B | P1 | nd | B |
| P3 | 9.69 | BC | P3 | 9.89 | B | P2 | nd | B |
| P6 | 8.9 | BC | P5 | 9.78 | B | P3 | nd | B |
| R6 | 8.37 | C | P1 | 9.25 | B | R2 | nd | B |
| P5 | 4.99 | C | P6 | 8.58 | B | R3 | nd | B |
| P2 | 4.69 | C | P2 | 7.61 | B | R6 | nd | B |
| (12) Linalool oxide isomer (p < 0.0001) | (18) (−)-α-Terpineol (18) (p < 0.0001) | (16) S-(+)-Linalool (p < 0.0001) | ||||||
| Wine | Conc (µg/L) | Conf. Int. * | Wine | Conc (µg/L) | Conf. Int. * | Wine | Conc (µg/L) | Conf. Int. * |
| R5 | 17.82 | A | R6 | 58.84 | A | R6 | 46.49 | A |
| R4 | 14.86 | AB | R3 | 30.61 | AB | R3 | 37.99 | AB |
| R2 | 14.23 | AB | R4 | 26.93 | AB | R4 | 29.17 | ABC |
| R1 | 10.96 | ABC | R2 | 12.77 | B | R2 | 13.47 | BC |
| R3 | 10.35 | ABCD | P6 | 12.33 | B | P6 | 12.59 | BC |
| P6 | 5.1 | BCD | P5 | 12 | B | P5 | 12.51 | BC |
| P4 | 5.03 | BCD | R1 | 11.82 | B | R1 | 11.54 | BC |
| P5 | 4.35 | CD | R5 | 7.27 | B | R5 | 9.67 | BC |
| P3 | 4.26 | CD | P1 | 5.26 | B | P1 | 5.44 | C |
| P2 | 3.69 | CD | P4 | nd | B | P4 | nd | C |
| P1 | 3.62 | CD | P3 | nd | B | P2 | nd | C |
| R6 | 1.02 | D | P2` | nd | B | P3 | nd | C |
| (20) (+)-α-Terpineol (p < 0.0001) | (18) (−)-α-Terpineol (18) (p < 0.0001) | (21) R-(+)-β-citronellol (p < 0.0001) | ||||||
| Wine | Conc (µg/L) | Conf. Int. * | Wine | Conc (µg/L) | Conf. Int. * | Wine | Conc (µg/L) | Conf. Int. * |
| R4 | 65.52 | A | R4 | 76.12 | A | P2 | 8.3 | A |
| R3 | 54.09 | AB | R6 | 59.47 | AB | P6 | 5.78 | B |
| R6 | 50.21 | AB | R5 | 53.57 | ABC | R3 | 5.72 | B |
| R5 | 47.6 | AB | R3 | 51.66 | ABCD | P5 | 5.38 | BC |
| R1 | 31.08 | BC | R1 | 35.71 | BCDE | P4 | 4.64 | CD |
| R2 | 27.98 | BC | R2 | 30.28 | BCDE | R4 | 4.03 | DE |
| P1 | 15.12 | C | P1 | 18.87 | CDE | P1 | 3.85 | DEF |
| P5 | 14.07 | C | P5 | 17.72 | CDE | R5 | 3.75 | DEF |
| P6 | 13.57 | C | P3 | 17.29 | DE | R1 | 3.62 | EF |
| P4 | 13.45 | C | P4 | 16.77 | DE | R6 | 2.99 | F |
| P2 | 5.79 | C | P6 | 15.45 | DE | P3 | 2.97 | F |
| P3 | 5.22 | C | P2 | 7.7 | E | R2 | nd | G |

3. Experimental Section
3.1. Chemicals
3.2. D3-Limonene Synthesis
3.2.1. Synthesis of 4-Acetyl-1-methylcyclohexane
| Compounds | Odors | Purity (%) | CAS No. b | Perception Threshold (µg/L) |
|---|---|---|---|---|
| 1 a | N/A | N/A | N/A | |
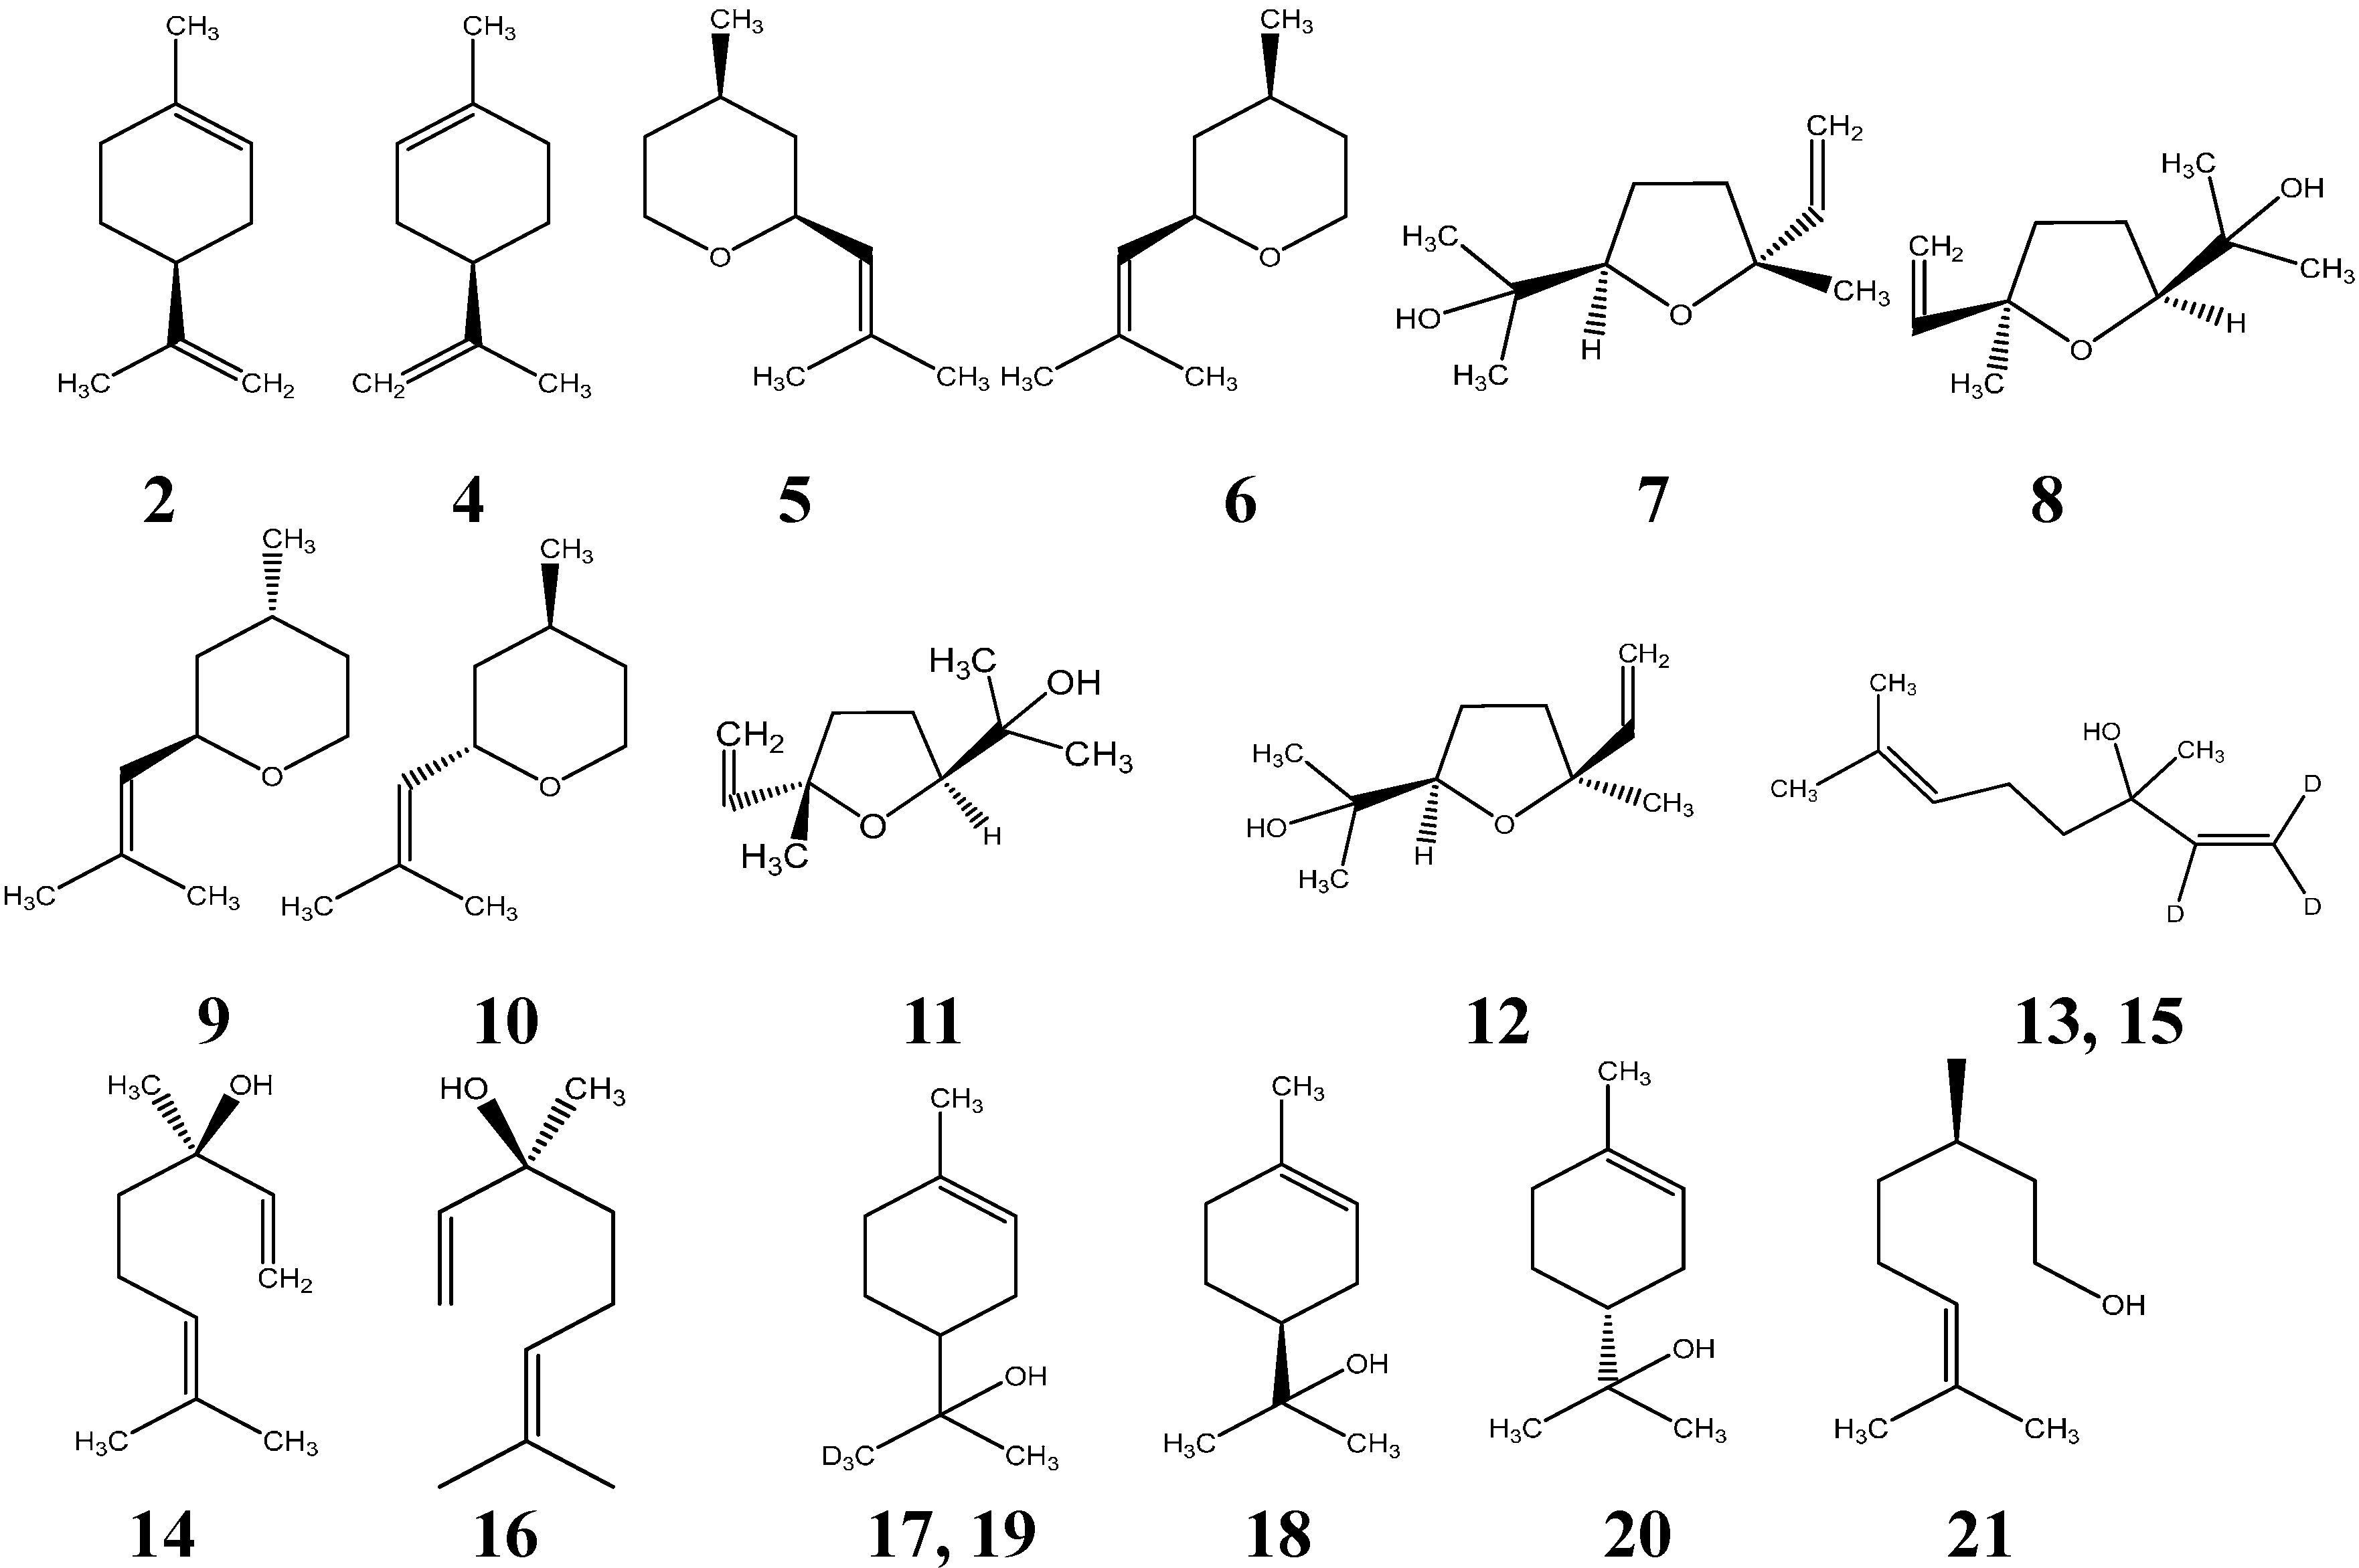
| 2 | Harsh, turpentine-like, lemon note [4] | 89.6 | 5989-54-8 | 500 [4] |
| 3 a | N/A | N/A | N/A | |
| 4 | Fresh, slightly orange note [4] | 99.0 | 5989-27-5 | 200 [4] |
| 5 | Herbal, green, floral, hay green, earthy, heavy [31] | 99.0 | 16409-43-1 | 50 [31,32] |
| 6 | Floral, green, clean, sharp, light, rose green [31] | 99.0 | 16409-43-1 | 0.5 [31,32] |
| 7 | Earthy, leafy [33] | 97.0 | 60047-17-8 | 3000–4000 [34] |
| 8 | Stronger earthy, leafy [33] | 97.0 | 60047-17-8 | 3000–4000 [34] |
| 9 | Floral green, green herbal, minty, fruity [31] | 99.0 | 16409-43-1 | 160 [31,32] |
| 10 | Herbal, green, floral, fruity, herbal, rose, citrus (bitter peel) [31] | 99.0 | 16409-43-1 | 80 [31,32] |
| 11 | Sweet, floral, creamy [33] | 97.0 | 60047-17-8 | 3000–4000 [34] |
| 12 | Sweet, floral, creamy [33] | 97.0 | 60047-17-8 | 3000–4000 [34] |
| 13 | 99.4 | 1216673-02-7 | N/A | |
| 14 | Woody, lavender [31] | 99.0 | 78-70-6 | 0.8 [35] |
| 15 | 99.4 | 1216673-02-7 | N/A | |
| 16 | Sweet, petigrain [31] | 99.0 | 78-70-6 | 7.4 [35] |
| 17 | 99.9 | 203633-12-9 | N/A | |
| 18 | Coniferous odor, tarry, cold pipe like [36] | 96.0 | 98-55-5 | 300,000 [37] |
| 19 | 99.9 | 203633-12-9 | N/A | |
| 20 | Heavy floral lilac-like odor [36] | 96.0 | 98-55-5 | 300,000 [37] |
| 21 | Slightly oily light rosy-leafy, petal-like odor with irritating top note [38] | 98.0 | 1117-61-9 | 50 [38] |

3.2.2. D3-Limonene Synthesis
3.3. Sample Preparation
3.4. Solid Phase Micro-Extraction Coupled with MDGC-MS
3.5. Validation of the Quantitative Method
3.5.1. Linearity of Calibration Curve in Different Wine Matrix
3.5.2. Limit of Detection (LOD), Limit of Quantitation (LOQ), Wine Reproducibility and Internal Standards Stability
| Compound | Standard 1(µg/L) | Standard 2 (µg/L) | Standard 3 (µg/L) | Standard 4 (µg/L) | Standard 5 (µg/L) | Standard 6 (µg/L) |
|---|---|---|---|---|---|---|
| 2 | 0.00 | 0.65 | 1.29 | 2.58 | 5.16 | 7.74 |
| 4 | 0.00 | 0.77 | 1.52 | 3.04 | 6.08 | 9.12 |
| 5 | 0.00 | 0.04 | 0.08 | 0.17 | 0.34 | 0.50 |
| 6 | 0.00 | 0.17 | 0.33 | 0.66 | 1.32 | 1.98 |
| 7 | 0.00 | 3.06 | 6.09 | 12.14 | 24.32 | 36.46 |
| 8 | 0.00 | 3.17 | 6.31 | 12.58 | 25.20 | 37.78 |
| 9 | 0.00 | 0.06 | 0.12 | 0.23 | 0.47 | 0.71 |
| 10 | 0.00 | 0.02 | 0.04 | 0.09 | 0.18 | 0.27 |
| 11 | 0.00 | 2.33 | 4.64 | 9.25 | 18.53 | 27.77 |
| 12 | 0.00 | 2.49 | 4.95 | 9.86 | 19.75 | 29.62 |
| 14 | 0.00 | 2.45 | 4.88 | 9.72 | 19.48 | 29.20 |
| 16 | 0.00 | 2.36 | 4.69 | 9.34 | 18.71 | 28.05 |
| 18 | 0.00 | 2.88 | 5.72 | 11.41 | 22.86 | 34.28 |
| 20 | 0.00 | 4.80 | 9.55 | 19.05 | 38.15 | 57.19 |
| 21 | 0.00 | 1.02 | 2.03 | 4.05 | 8.12 | 12.17 |
3.5.3. Accuracy
3.5.4. Temperature Stability
3.6. Chiral Mono-Terpene Contents in 12 White Wines
| Wine Code | Vintage | Region | Sub-Region | Alcohol Content (v/v) | Residual Sugar Content (g/L) | Wine Type [40] |
|---|---|---|---|---|---|---|
| P1 | 2011 | Italy | Friuli Grave | 12.50% | 0.86 | Dry |
| P2 | 2013 | Oregon | Willamette Valley | 13.17% | 2.68 | Dry |
| P3 | 2012 | Oregon | Willamette Valley | 13.89% | 3.95 | Dry |
| P4 | 2013 | Oregon | Willamette Valley | 12.62% | 4.23 | Medium dry |
| P5 | 2013 | Australia | Limestone Coast | 14.06% | 5.49 | Medium dry |
| P6 | 2013 | New Zealand | Auckland | 12.91% | 7.41 | Medium dry |
| R1 | 2013 | Australia | Eden valley | 11.63% | 3.72 | Dry |
| R2 | 2012 | Oregon | Willamette Valley | 13.17% | 2.68 | Dry |
| R3 | 2012 | Washington | Columbia Valley | 12.92% | 5.69 | Medium dry |
| R4 | 2012 | Washington | Yakima valley | 12.52% | 15.00 | Medium sweet |
| R5 | 2012 | New York | Finger lakes | 11.43% | 15.27 | Medium sweet |
| R6 | 2013 | Washington | Columbia Valley | 7.07% | 95.83 | Sweet |
3.7. Data Analysis
4. Conclusions
Acknowledgments
Author Contributions
Conflicts of Interest
References and Notes
- Skinkis, P.A.; Bordelon, B.P.; Wood, K.V. Comparison of monoterpene constituents in traminette, gewurztraminer, and riesling winegrapes. Am. J. Enol. Vitic. 2008, 59, 440–445. [Google Scholar]
- Dziadas, M.; Jeleń, H.H. Analysis of terpenes in white wines using SPE-SPME-GC/MS approach. Anal. Chim. Acta 2010, 677, 43–49. [Google Scholar] [CrossRef] [PubMed]
- Park, S.K.; Noble, A.C. Monoterpenes and monoterpene glycosides in wine aromas. In ACS Symposium Series; American Chemical Society: Washington, DC, USA, 1993; Volume 536, pp. 98–109. [Google Scholar]
- Brenna, E.; Fuganti, C.; Serra, S. Enantioselective perception of chiral odorants. Tetrahedron Asymmetry 2003, 14, 1–42. [Google Scholar] [CrossRef]
- Friedman, L.; Miller, J.G. Odor Incongruity and chirality. Science 1971, 172, 1044–1046. [Google Scholar] [CrossRef] [PubMed]
- Mateo, J.J.; Jiménez, M. Monoterpenes in grape juice and wines. J. Chromatogr. A 2000, 881, 557–567. [Google Scholar] [CrossRef] [PubMed]
- Gal, J. The discovery of biological enantioselectivity: Louis pasteur and the fermentation of tartaric acid, 1857—A review and analysis 150 yr later. Chirality 2008, 20, 5–19. [Google Scholar] [CrossRef] [PubMed]
- Mason, S. The origin of chirality in nature. Trends Pharmacol. Sci. 1986, 7, 20–23. [Google Scholar] [CrossRef]
- Vallery-Radot, R. Louis Pasteur—His life and labours; D. Appleton and Co.: New York, NY, USA, 1885. [Google Scholar]
- Srinivas, N.; Shyu, W.; Barbhaiya, R. Gaschromatographic determination of enantiomers as diastereomers following pre-column derivatization and applications to pharmacokinetic studies: A review. Biomed. Chromatogr. 1995, 9, 1–9. [Google Scholar] [CrossRef] [PubMed]
- Gil-Av, E.; Feibush, B.; Charles-Sigler, R. Separation of enantiomers by gas liquid chromatography with an optically active stationary phase. Tetrahedron Lett. 1966, 8, 1009–1015. [Google Scholar] [CrossRef]
- Frank, H.; Nicholson, G.; Bayer, E. Chiral polysiloxanes for resolution of optical antipodes. Angew. Chem. Int. Ed. Engl. 1967, 9, 3345–3347. [Google Scholar]
- Ebeler, S.E.; Sun, G.M.; Vickers, A.K.; Stremple, P. Gas chromatographic analysis of chiral aroma compounds in wine using modified cyclodextrin stationary phases and solid phase microextraction. In Aroma Active Compounds in Foods; American Chemical Society: Washington, DC, USA, 2001; pp. 45–56. [Google Scholar]
- König, W.; Krebber, R.; Wenz, G. Enantioselective capillary gas chromatography on the basis of host-guest interactions with modified cyclodextrins. J. High Resolut. Chromatogr. 1989, 12, 641–644. [Google Scholar] [CrossRef]
- Nowotny, H.; Schmalzing, D.; Wistuba, D.; Schurig, V. Extending the scope of enantiomer separation on diluted methylated β-cyclodextrin derivatives by high-resolution gas chromatography. J. High Resolut. Chromatogr. 1989, 12, 383–393. [Google Scholar] [CrossRef]
- Mosandl, A.; Hener, U.; Hagenauer-Hener, U.; Kustermann, A. Direct enantiomer separation of chiral γ-lactones from food and beverages by multidimensional gas chromatography. J. High Resolut. Chromatogr. 1989, 12, 532–536. [Google Scholar] [CrossRef]
- Schmidt, G.; Neugebauer, W.; Winterhalter, P.; Schreier, P. Synthesis and enantiodifferentiation of isomeric 2,3,5,6,8,8a-hexahydro-2,5,5,8a-tetramethyl-7h-1-benzopyran-7-ones (3,4-dihydro-3-oxoedulans). J. Agric. Food Chem. 1995, 43, 1898–1902. [Google Scholar] [CrossRef]
- Dollmann, B.; Full, G.; Schreier, P.; Winterhalter, P.; Guntert, M.; Sommer, H. Synthesis and enaniotdifferentiation of riesling acetals. Phytochem. Anal. 1995, 6, 106–111. [Google Scholar] [CrossRef]
- Guth, H. Determination of the configuration of wine lactone. Helv. Chim. Acta 1996, 79, 1559–1571. [Google Scholar] [CrossRef]
- A Guide to the Analysis of Chiral Compounds by GC; Resteck Corp: Belleftone, PA, USA, 1997.
- Jackson, R.S. Wine Science; Principles,Practices and Perceptions, 2nd ed.; Academic Press: San Diego, CA, USA, 2000. [Google Scholar]
- Muñoz-González, C.; Martín-Álvarez, P.J.; Moreno-Arribas, M.V.; Pozo-Bayón, M.Á. Impact of the nonvolatile wine matrix composition on the in vivo aroma release from wines. J. Agric. Food Chem. 2013, 62, 66–73. [Google Scholar] [CrossRef] [PubMed]
- Sorrentino, F.; Voilley, A.; Richon, D. Activity coefficients of aroma compounds in model food systems. AIChE J. 1986, 32, 1988–1993. [Google Scholar] [CrossRef]
- Villamor, R.R.; Evans, M.A.; Mattinson, D.S.; Ross, C.F. Effects of ethanol, tannin and fructose on the headspace concentration and potential sensory significance of odorants in a model wine. Food Res. Int. 2013, 50, 38–45. [Google Scholar] [CrossRef]
- Rodrıguez-Bencomo, J.; Conde, J.; Rodrıguez-Delgado, M.; Garcıa-Montelongo, F.; Pérez-Trujillo, J. Determination of esters in dry and sweet white wines by headspace solid-phase microextraction and gas chromatography. J. Chromatogr. A 2002, 963, 213–223. [Google Scholar] [CrossRef] [PubMed]
- Tuduri, L.; Desauziers, V.; Fanlo, J.L. Potential of solid-phase microextraction fibers for the analysis of volatile organic compounds in air. J. Chromatogr. Sci. 2001, 39, 521–529. [Google Scholar] [CrossRef] [PubMed]
- Djozan, D.; Bahar, S. Solid-phase microextraction of aliphatic alcohols based on polyaniline coated fibers. Chromatographia 2004, 59, 95–99. [Google Scholar] [CrossRef]
- Popp, P.; Paschke, A. Solid phase microextraction of volatile organic compounds using carboxen-polydimethylsiloxane fibers. Chromatographia 1997, 46, 419–424. [Google Scholar] [CrossRef]
- Abolghasemi, M.M.; Karimi, B.; Yousefi, V. Periodic mesoporous organosilica with ionic liquid framework as a novel fiber coating for headspace solid-phase microextraction of polycyclic aromatic hydrocarbons. Anal. Chim. Acta 2013, 804, 280–286. [Google Scholar] [CrossRef] [PubMed]
- Pozo-Bayón, M.; Pueyo, E.; Martın-Alvarez, P.; Polo, M. Polydimethylsiloxane solid-phase microextraction-gas chromatography method for the analysis of volatile compounds in wines: Its application to the characterization of varietal wines. J. Chromatogr. A 2001, 922, 267–275. [Google Scholar] [CrossRef] [PubMed]
- Pena, R.M.; Barciela, J.; Herrero, C.; Garcia-Martin, S. Optimization of solid-phase microextraction methods for GC-MS determination of terpenes in wine. J. Sci. Food Agric. 2005, 85, 1227–1234. [Google Scholar] [CrossRef]
- Peña-Alvarez, A.; Capella, S.; Juárez, R.; Labastida, C. Determination of terpenes in tequila by solid phase microextraction-gas chromatography-mass spectrometry. J. Chromatogr. A 2006, 1134, 291–297. [Google Scholar] [CrossRef] [PubMed]
- Perkins, M.L.; D’Arcy, B.R.; Lisle, A.T.; Deeth, H.C. Solid phase microextraction of stale flavour volatiles from the headspace of UHT milk. J. Sci. Food Agric. 2005, 85, 2421–2428. [Google Scholar] [CrossRef]
- Garrido-Frenich, A.; Romero-González, R.; Martínez-Vidal, J.; Plaza-Bolaños, P.; Cuadros-Rodríguez, L.; Herrera-Abdo, M. Characterization of recovery profiles using gas chromatography-triple quadrupole mass spectrometry for the determination of pesticide residues in meat samples. J. Chromatogr. A 2006, 1133, 315–321. [Google Scholar] [CrossRef] [PubMed]
- Garneau, F.X.; Collin, G.; Gagnon, H. Chemical composition and stability of the hydrosols obtained during essential oil production. I. The case of Melissa officinalis L. and Asarum canadense L. Am. J. Essent. Oils Nat. Prod. 2014, 2, 54–62. [Google Scholar]
- Garneau, F.X.; Collin, G.; Gagnon, H. Chemical composition and stability of the hydrosols obtained during essential oil production. II. The case of Picea glauca (Moench) Voss., Solidago puberula Nutt., and Mentha piperita L. Am. J. Essent. Oils Nat. Prod. 2014, 2, 29–35. [Google Scholar]
- Versini, G.; Carlin, S.; Nicolini, G.; Dellacassa, E.; Carrau, F. Updating of varietal aroma components in wines. In Vitiviniculture in the Southern Emishpere, Proceedings of the 7th Latin-American Congress of viticulture and winemaking, Mendoza, Argentina, 28 November–3 December 1999; pp. 323–349.
- Gunata, Z.; Bitteur, S.; Brillouet, J.M.; Bayonove, C.; Cordonnier, R. Sequential enzymic hycrolysis of potentially aromatic glycosides from grape. Carbohydr. Res. 1988, 183, 139–149. [Google Scholar] [CrossRef]
- Zoecklein, B.W.; Marcy, J.E.; Williams, J.M.; Jasinski, Y. Effect of native yeasts and selected strains ofsaccharomyces cerevisiaeon glycosyl glucose, potential volatile terpenes, and selected aglycones of white riesling (Vitis vinifera L.) wines. J. Food Compos. Anal. 1997, 10, 55–65. [Google Scholar] [CrossRef]
- Fernández-González, M.; Di Stefano, R.; Briones, A. Hydrolysis and transformation of terpene glycosides from muscat must by different yeast species. Food Microbiol. 2003, 20, 35–41. [Google Scholar] [CrossRef]
- Maicas, S.; Mateo, J.J. Hydrolysis of terpenyl glycosides in grape juice and other fruit juices: A review. Appl. Microbiol. Biotechnol. 2005, 67, 322–335. [Google Scholar] [CrossRef] [PubMed]
- Macaulay, L.E.; Morris, J.R. Influence of cluster exposure and winemaking processes on monoterpenes and wine olfactory evaluation of Golden Muscat. Am. J. Enol. Vitic. 1993, 44, 198–204. [Google Scholar]
- Rapp, A.; Marais, J. The shelf life of wine: Changes ina roma substances during storage and ageining of white wines. In Shelf Life Studies of Food and Beverages. Chemical, Biological, Physical and Nutritional Aspects; Elsevier Science Publishers: Amsterdam, The Netherlands, 1993; pp. 891–921. [Google Scholar]
- Shimizu, J.; Uehara, M.; Watanabe, M. Transformation of terpenoids in grape must by Botrytis cinerea. Agric. Biol. Chem. 1982, 46, 1339–1344. [Google Scholar] [CrossRef]
- Koslitz, S.; Renaud, L.; Kohler, M.; Wust, M. Stereoselective formation of the varietal Aroma Compound Rose Oxide during Alcoholic Fermentation. J. Agric. Food Chem. 2008, 56, 1371–1375. [Google Scholar] [CrossRef] [PubMed]
- Tatum, J.; Nagy, S.; Berry, R. Degradation products formed in canned single-strength orange juice during storage. J. Food Sci. 1975, 40, 707–709. [Google Scholar] [CrossRef]
- Carrau, F.M.; Medina, K.; Boido, E.; Farina, L.; Gaggero, C.; Dellacassa, E.; Versini, G.; Henschke, P.A. De novo synthesis of monoterpenes by Saccharomyces cerevisiae wine yeasts. FEMS Microbiol. Lett. 2005, 243, 107–115. [Google Scholar] [CrossRef] [PubMed]
- Bock, G.; Benda, I.; Schreier, P. Biotransformation of linalool by Botrytis cinerea. J. Food Sci. 1986, 51, 659–662. [Google Scholar] [CrossRef]
- Lambropoulos, I.; Roussis, I.G. Inhibition of the decrease of volatile esters and terpenes during storage of a white wine and a model wine medium by caffeic acid and gallic acid. Food Res. Int. 2007, 40, 176–181. [Google Scholar] [CrossRef]
- Cullere, L.; Cacho, J.; Ferreira, V. An assessment of the Role Played by some Oxidation-Related Aldehydes in Wine Aroma. J. Agric. Food Chem. 2007, 55, 876–881. [Google Scholar] [CrossRef] [PubMed]
- Frank, S.; Wollmann, N.; Schieberle, P.; Hofmann, T. Reconstitution of the flavor signature of Dornfelder Red Wine on the Basis of the Natural Concentrations of Its Key Aroma and Taste Compounds. J. Agric. Food Chem. 2011, 59, 8866–8874. [Google Scholar] [CrossRef] [PubMed]
- Audouin, V.; Bonnet, F.; Vickers, Z.M.; Reineccius, G.A. Limitations in the use of odor activity values to determine important odorants in foods. In ACS Symposium Series; American Chemical Society: Washington, DC, USA, 1999; Volume 782, pp. 156–171. [Google Scholar]
- Rapp, A.; Mandery, H. Wine aroma. Experientia 1986, 42, 873–884. [Google Scholar] [CrossRef]
- Rebelein, H. Rapid method for the determination of the alcohol, sugar and total SO2 contents (by distillation) in wine and fruit juices and also for determining blood alcohol. Chem Mikrobiol. Technol. Leb. 1973, 2, 112–121. [Google Scholar]
- Tomasino, E. Characterization of Regional Examples of New Zealand Pinot Noir by Means of Sensory and Chemical Analysis. PhD Thesis, Lincoln University, Lincoln, New Zealand, February 2011. [Google Scholar]
- Callejon, R.M.; Gonzalez, A.G.; Troncoso, A.M.; Morales, M.L. Optimization and validation of headspace sorptive extraction for the analysis of volatile compounds in wine vinegars. J. Chromatogr. A 2008, 1204, 93–103. [Google Scholar] [CrossRef] [PubMed]
- Miller, J.N.; Miller, J.C. Statistic and Chemometrics for Analytical Chemistry; Pearson Education Limited: Edinburgh, UK, 2005. [Google Scholar]
- Regulation (2005). (EC) No 1512/2005 amending Regulation (EC) No 753/2002 laying down certain rules for applying Council Regulation (EC) No 1496/1999 as regards the description, designation, presentation and protection of certain wine sector products (OJ L 241, 17.9. 2005). 2005.
- Sample Availability: Samples of the compounds are not available from the authors.
© 2015 by the authors. Licensee MDPI, Basel, Switzerland. This article is an open access article distributed under the terms and conditions of the Creative Commons Attribution license ( http://creativecommons.org/licenses/by/4.0/).
Share and Cite
Song, M.; Xia, Y.; Tomasino, E. Investigation of a Quantitative Method for the Analysis of Chiral Monoterpenes in White Wine by HS-SPME-MDGC-MS of Different Wine Matrices. Molecules 2015, 20, 7359-7378. https://doi.org/10.3390/molecules20047359
Song M, Xia Y, Tomasino E. Investigation of a Quantitative Method for the Analysis of Chiral Monoterpenes in White Wine by HS-SPME-MDGC-MS of Different Wine Matrices. Molecules. 2015; 20(4):7359-7378. https://doi.org/10.3390/molecules20047359
Chicago/Turabian StyleSong, Mei, Ying Xia, and Elizabeth Tomasino. 2015. "Investigation of a Quantitative Method for the Analysis of Chiral Monoterpenes in White Wine by HS-SPME-MDGC-MS of Different Wine Matrices" Molecules 20, no. 4: 7359-7378. https://doi.org/10.3390/molecules20047359