Article

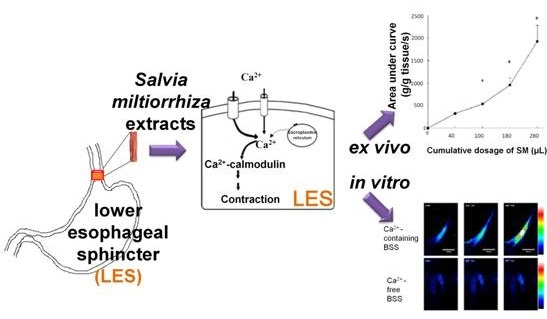
Salvia miltiorrhiza Induces Tonic Contraction of the Lower Esophageal Sphincter in Rats via Activation of Extracellular Ca2+ Influx

1
School of Pharmacy, Kaohsiung Medical University, No. 100, Shih-Chuan 1st Road, Sanmin District, Kaohsiung City 807, Taiwan
2
Departments of Pediatrics, E-Da Hospital, I-Shou University, No. 1, Yida Road, Jiaosu Village, Yanchao District, Kaohsiung City 824, Taiwan
3
Department of Occupational Therapy, I-Shou University, No. 8, Yida Road, Jiaosu Village, Yanchao District, Kaohsiung City 824, Taiwan
4
Department of Pharmacy, E-Da Hospital, I-Shou University, No.1, Yida Road, Jiaosu Village, Yanchao District, Kaohsiung City 824, Taiwan
5
Department of Internal Medicine, E-Da Hospital, I-Shou University, No. 1, Yida Road, Jiaosu Village, Yanchao District, Kaohsiung City 824, Taiwan
6
School of Medicine, I-Shou University, No. 8, Yida Road, Jiaosu Village, Yanchao District, Kaohsiung City, 824, Taiwan
7
Institute of Basic Medical Sciences, Medical College, National Cheng Kung University, No. 1, Dasyue Road, East District, Tainan City 701, Taiwan
*
Authors to whom correspondence should be addressed.
These authors contributed equally to this work.
Molecules 2015, 20(8), 14504-14521; https://doi.org/10.3390/molecules200814504
Submission received: 18 June 2015 / Revised: 31 July 2015 / Accepted: 4 August 2015 / Published: 11 August 2015
(This article belongs to the Collection Bioactive Compounds)

Abstract

:
Up to 40% of patients with gastroesophageal reflux disease (GERD) suffer from proton pump inhibitor refractory GERD but clinically the medications to strengthen the lower esophageal sphincter (LES) to avoid irritating reflux are few in number. This study aimed to examine whether Salvia miltiorrhiza (SM) extracts induce tonic contraction of rat LES ex vivo and elucidate the underlying mechanisms. To investigate the mechanism underlying the SM extract-induced contractile effects, rats were pretreated with atropine (a muscarinic receptor antagonist), tetrodotoxin (a sodium channel blocker), nifedipine (a calcium channel blocker), and Ca2+-free Krebs-Henseleit solution with ethylene glycol tetraacetic acid (EGTA), followed by administration of cumulative dosages of SM extracts. SM extracts induced dose-related tonic contraction of the LES, which was unaffected by tetrodotoxin, atropine, or nifedipine. However, the SM extract-induced LES contraction was significantly inhibited by Ca2+-free Krebs-Henseleit solution with EGTA. Next, SM extracts significantly induce extracellular Ca2+ entry into primary LES cells in addition to intracellular Ca2+ release and in a dose-response manner. Confocal fluorescence microscopy showed that the SM extracts consistently induced significant extracellular Ca2+influx into primary LES cells in a time-dependent manner. In conclusion, SM extracts could induce tonic contraction of LES mainly through the extracellular Ca2+ influx pathway.

Graphical Abstract

1. Introduction

Gastroesophageal reflux disease (GERD) is caused by reflux of acid or other irritants from the stomach into the esophagus. The main cause of GERD is incompetence of the lower esophageal sphincter (LES) which normally closes at the esophagogastric junction to avoid the back-up of food and acid injury and transiently relaxes to allow food from the esophagus into the stomach when swallowing [1]. Acid reflux-induced mucosal inflammation may affect muscle and nerves, and then affect LES and esophageal body motility. Further acid reflux and mucosal damage may cause a vicious cycle of impaired LES function and esophageal injury. Treatment for GERD includes lifestyle modifications, medications, and surgery. Proton-pump inhibitors (PPI), histamine type II receptor blockers or antacids are common medications for GERD. PPI is the first-line medication for GERD, but 10%–40% patients with GERD are refractory to PPI and furthermore, long term use of PPI may lead to complications [2]. The surgery for severe GERD usually involves strengthening the LES and repairing the hiatus hernia [3]. Clinically, there are few medications, such as baclofen which decreases LES relax and then indirectly increases LES pressure for the patients with PPI refectory GERD. However, baclofen may cause central nervous system side effects [4]. Therefore, treatment of PPI refractory GERD is still a challenge and it is important to develop drugs that increase LES contraction to avoid irritant reflux.
Salvia miltiorrhiza Bunge (SM), also known as red sage or Danshen in Chinese, is clinically used in Traditional Chinese Medicines and officially listed by the Pharmacopoeia Commission of the People’s Republic of China [5]. SM is a common drug affecting blood viscosity and its effects include improving blood circulation, removing blood stasis, promoting blood flow in menstruation, resolving mental uneasiness and restlessness, nourishing the blood, tranquilizing the mind, eliminating and breaking stone, treating gurgling in the intestines, relieving fullness, and resolving swelling [6,7]. SM or its active components are widely used as an alternative medicine to treat coronary heart disease, cerebrovascular disease, hepatitis, cirrhosis, chronic renal failure and osteoporosis, and SM has been reported to have anti-cancer effects [8,9,10,11,12].
There are a few studies of SM concerning gastrointestinal motility or disorders to date. The increase in expression of cholecystokinin and vasoactive intestinal peptide in the jejunum was suppressed by SM pretreatment, which might contribute to the early recovery of gastrointestinal motility in digestive tract congestion injury caused by liver ischemia [13]. SM can decrease the inflammation of colon induced by dextran sulfate sodium in rats [14]. SM can ameliorate the pathological changes in the small intestine, spleen and thymus and decrease the mortality rate of rats suffering from severe acute pancreatitis [15]. Our previous study found that SM can induce tonic contraction of the ileal tube in rats through intracellular Ca2+ release and the Ca2+-calmodulin pathway [16].
To the best of our knowledge, no study about the effects of SM on LES has been reported to date. The aim of this study is to therefore to investigate the contractile effects of SM extracts on LES and the mechanism(s) involved. We found that SM extracts can induce LES contractile responses ex vivo. To explore the mechanisms that mediate SM extracts-induced contraction of LES, atropine (a muscarinic receptor antagonist), tetrodotoxin (a neuronal sodium channel blocker), nifedipine (a calcium channel blocker), or Ca2+-free Krebs-Henseleit solution with ethylene glycol tetraacetic acid (EGTA) was given and then cumulative dosages of SM were added. Then, the isometric contractions of LES muscle strips were measured in organ baths.

2. Results and Discussion

2.1. The Content of Tanshinone IIA (TA) in SM Extracts

According to the Pharmacopoeia Commission of the People’s Republic of China [5], TA has been used mainly for quality control of the roots of S. miltiorrhiza Bunge (Danshen). The content of TA was detected by high performance liquid chromatography (HPLC) and quantified as 1190 μg/mL in SM extracts. The extraction yield of TA from SM roots was calculated as 0.0595%.

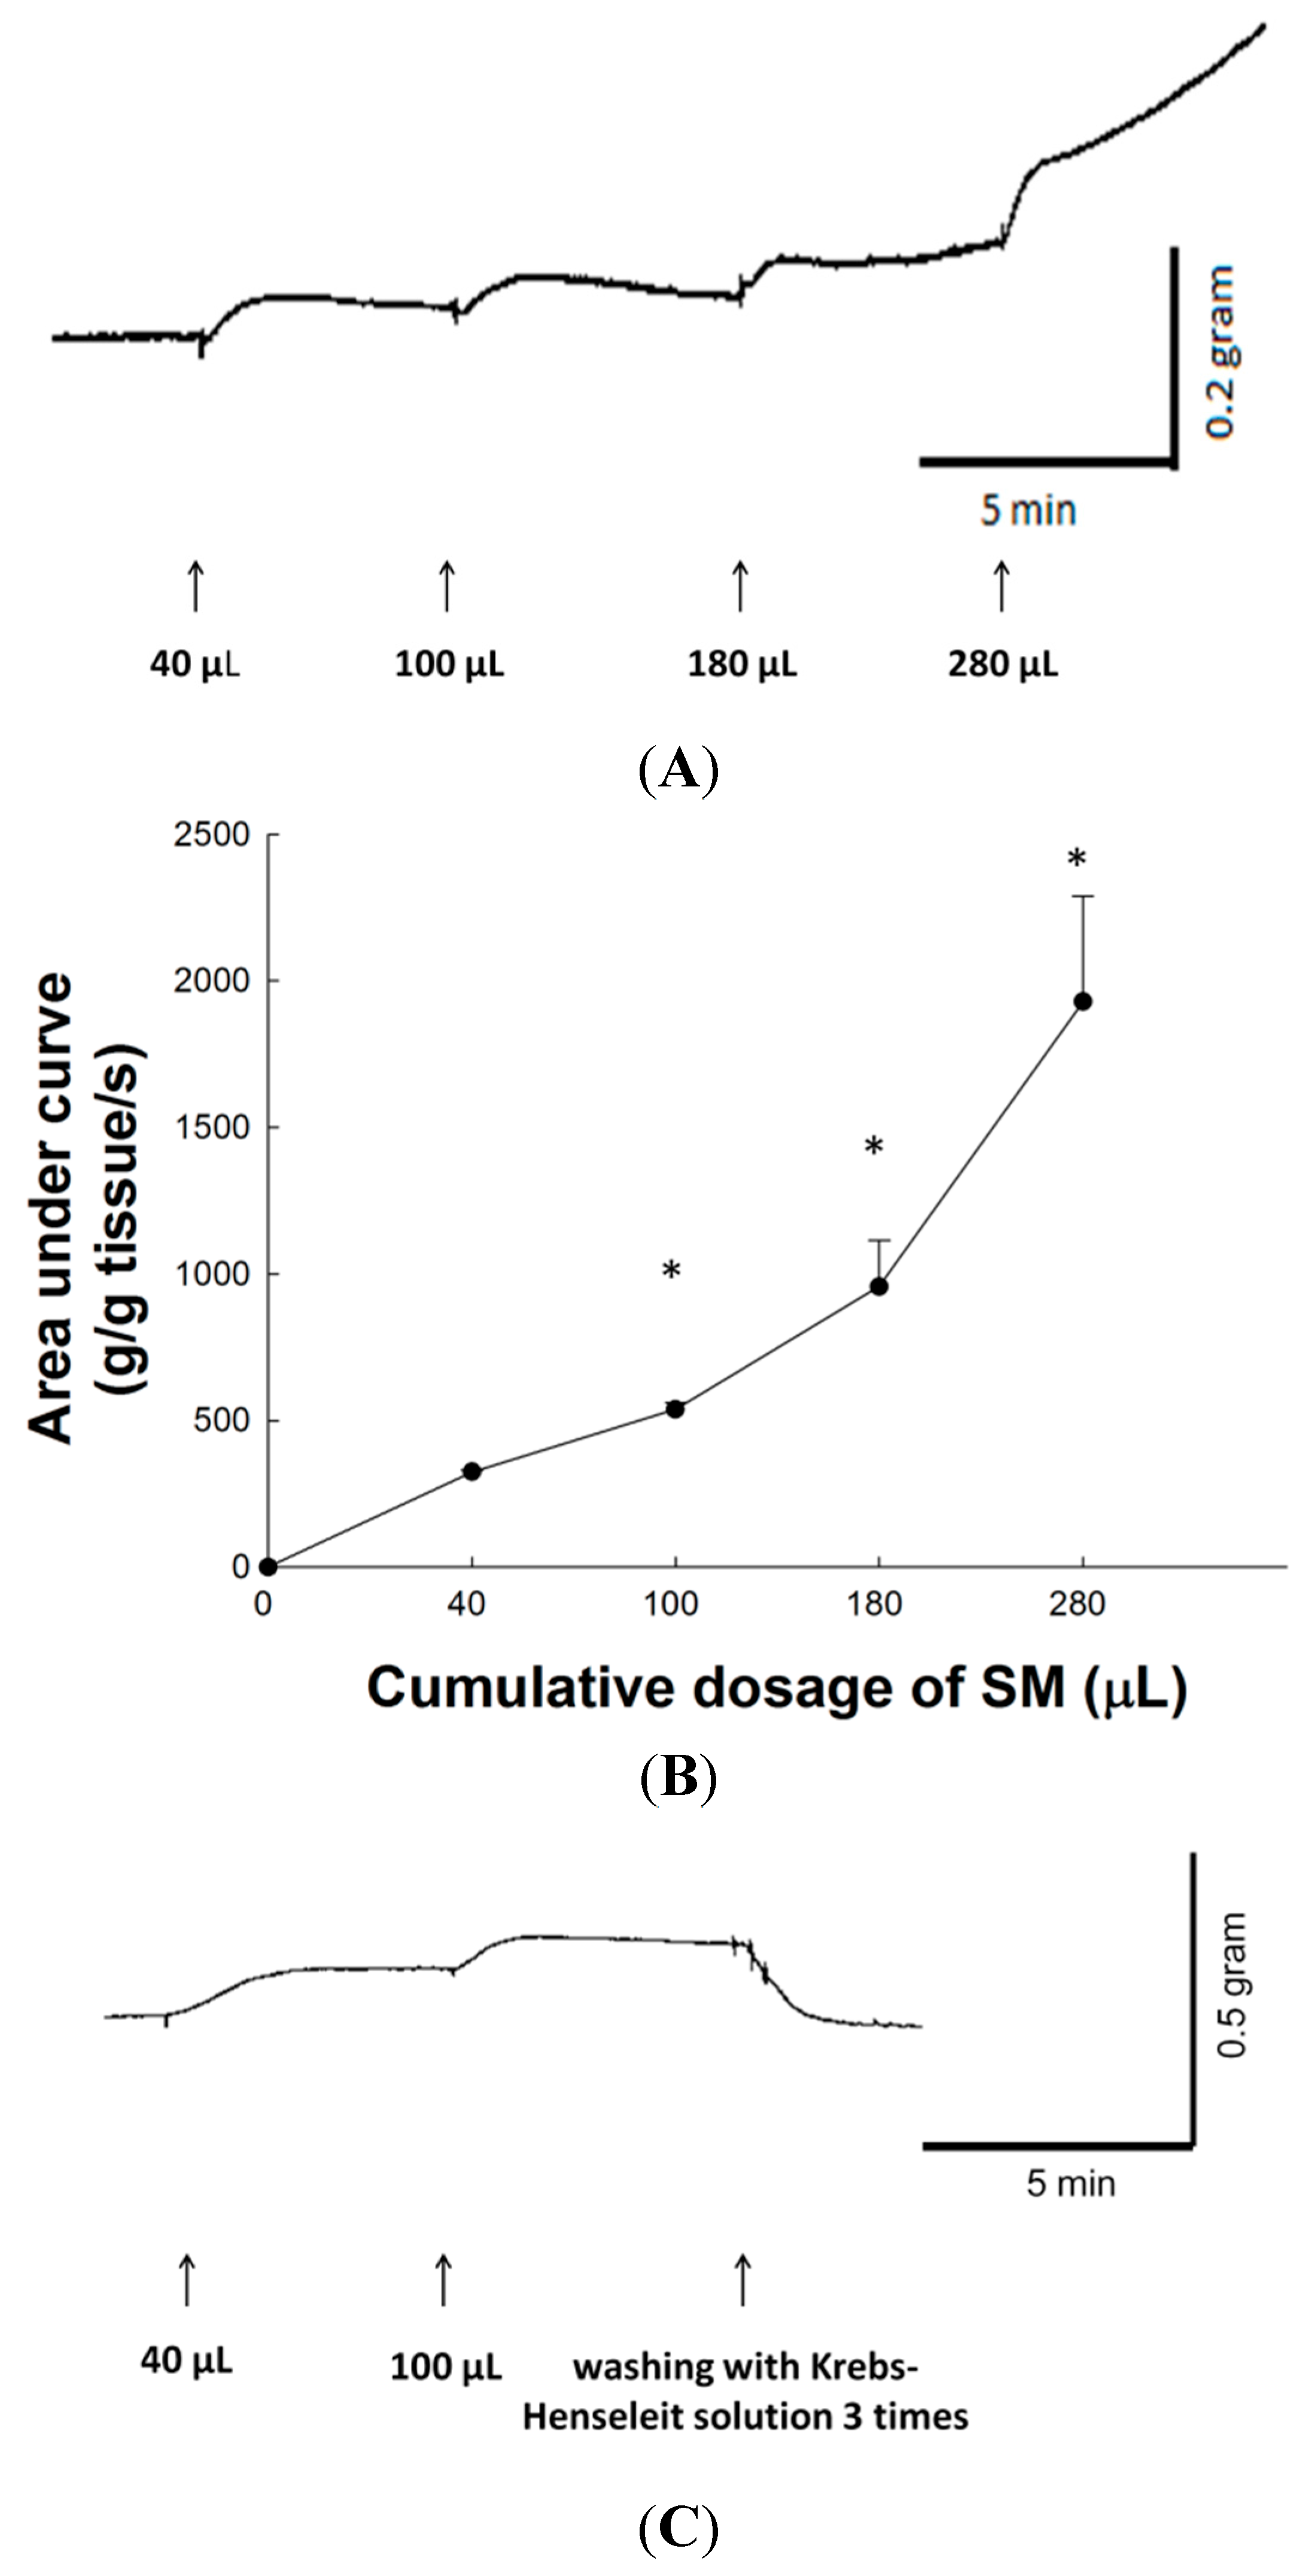
2.2. Dose-Response Effect of SM Extracts on Contraction of LES

SM extracts produced a dose-dependent tonic contraction on isolated LES of rat. Figure 1A shows typical tracings of SM extract-induced tonic contraction of rat LES. Figure 1B shows the contractile responses and area under the contraction curve (AUC) produced in rat LES by the application of increasing concentrations of SM. Compared to the basal line, the AUC on the contraction curves on cumulative dose of 40, 100, 180, and 280 μL SM extracts were 324.8 ± 6.5, 537.8 ± 23.8, 956.3 ± 158.4, and 1927.4 ± 361.7 (g/g of tissue weight/s) respectively. Thus, SM enhanced the contractile activity of LES in a dose-response manner. The LES contraction curves induced by cumulative doses of 40 and 100 μL SM extracts returned to prestimulation levels after removing SM extracts with Krebs-Henseleit solution (Figure 1C). Therefore, the tonic contraction of LES induced by SM extracts was reversible. After removing SM extracts with normal Krebs-Henseleit solution, the LES maximum contraction was remeasured by carbachol addition. The contractile percentage of LES after SM treatment was 96.3% ± 1.1% of pre-SM stimulation level (p > 0.05). Thus, the increased tonic contraction of LES induced by SM extracts probably does not happen via toxic effects.
Figure 1. The SM extracts-induced contractions of LES in rat. (A) Typical tracing of the contraction of LES in rat in response to cumulative addition of SM extracts; (B) Concentration-response curves for the SM extracts-induced contractions of rat LES. Arrows indicate the addition of SM extracts on cumulative dosage at intervals of 5 min; (C) Contraction curve of LES returned to prestimulation level after removing SM extracts with Krebs-Henseleit solution. The contractile change was compared to resting contractility of corresponding experiments. * Significantly different from the resting contractility at p < 0.05.
Molecules 20 14504 g001
The mechanism controlling the contractile activity of the LES is incompletely understood. It may be regulated or modulated by many factors, such as nerve ending-smooth muscle interactions, neurohumoral substances, diet and drugs [17]. This study identified for the first time that SM extracts can induce tonic contraction of LES in rats. The contraction of the smooth muscle of LES is affected by multiple factors but mainly by autonomic neural innervations. Excitatory postganglionic vagal nervous terminals release acetylcholine (ACh) in the myenteric plexus, resulting in activation of muscarinic (M) receptors. Activation of M receptors increases the intracellular concentration of Ca2+. Increased cytosolic Ca2+ comes from the extracellular entry through trans-membrane Ca2+ channels or/and the release of intracellular Ca2+ stores [18]. An increase in cytoplasmic calcium concentration, binding to calmodulin and resulting in Ca2+/calmodulin-dependent activation of myosin light chain kinase (MLCK), is an important pathway for contraction of LES. In addition, resting LES tone is related to a protein kinase C-dependent pathway [19]. Various mechanisms may be involved in the SM extract-induced contraction of LES and they are described as follows.

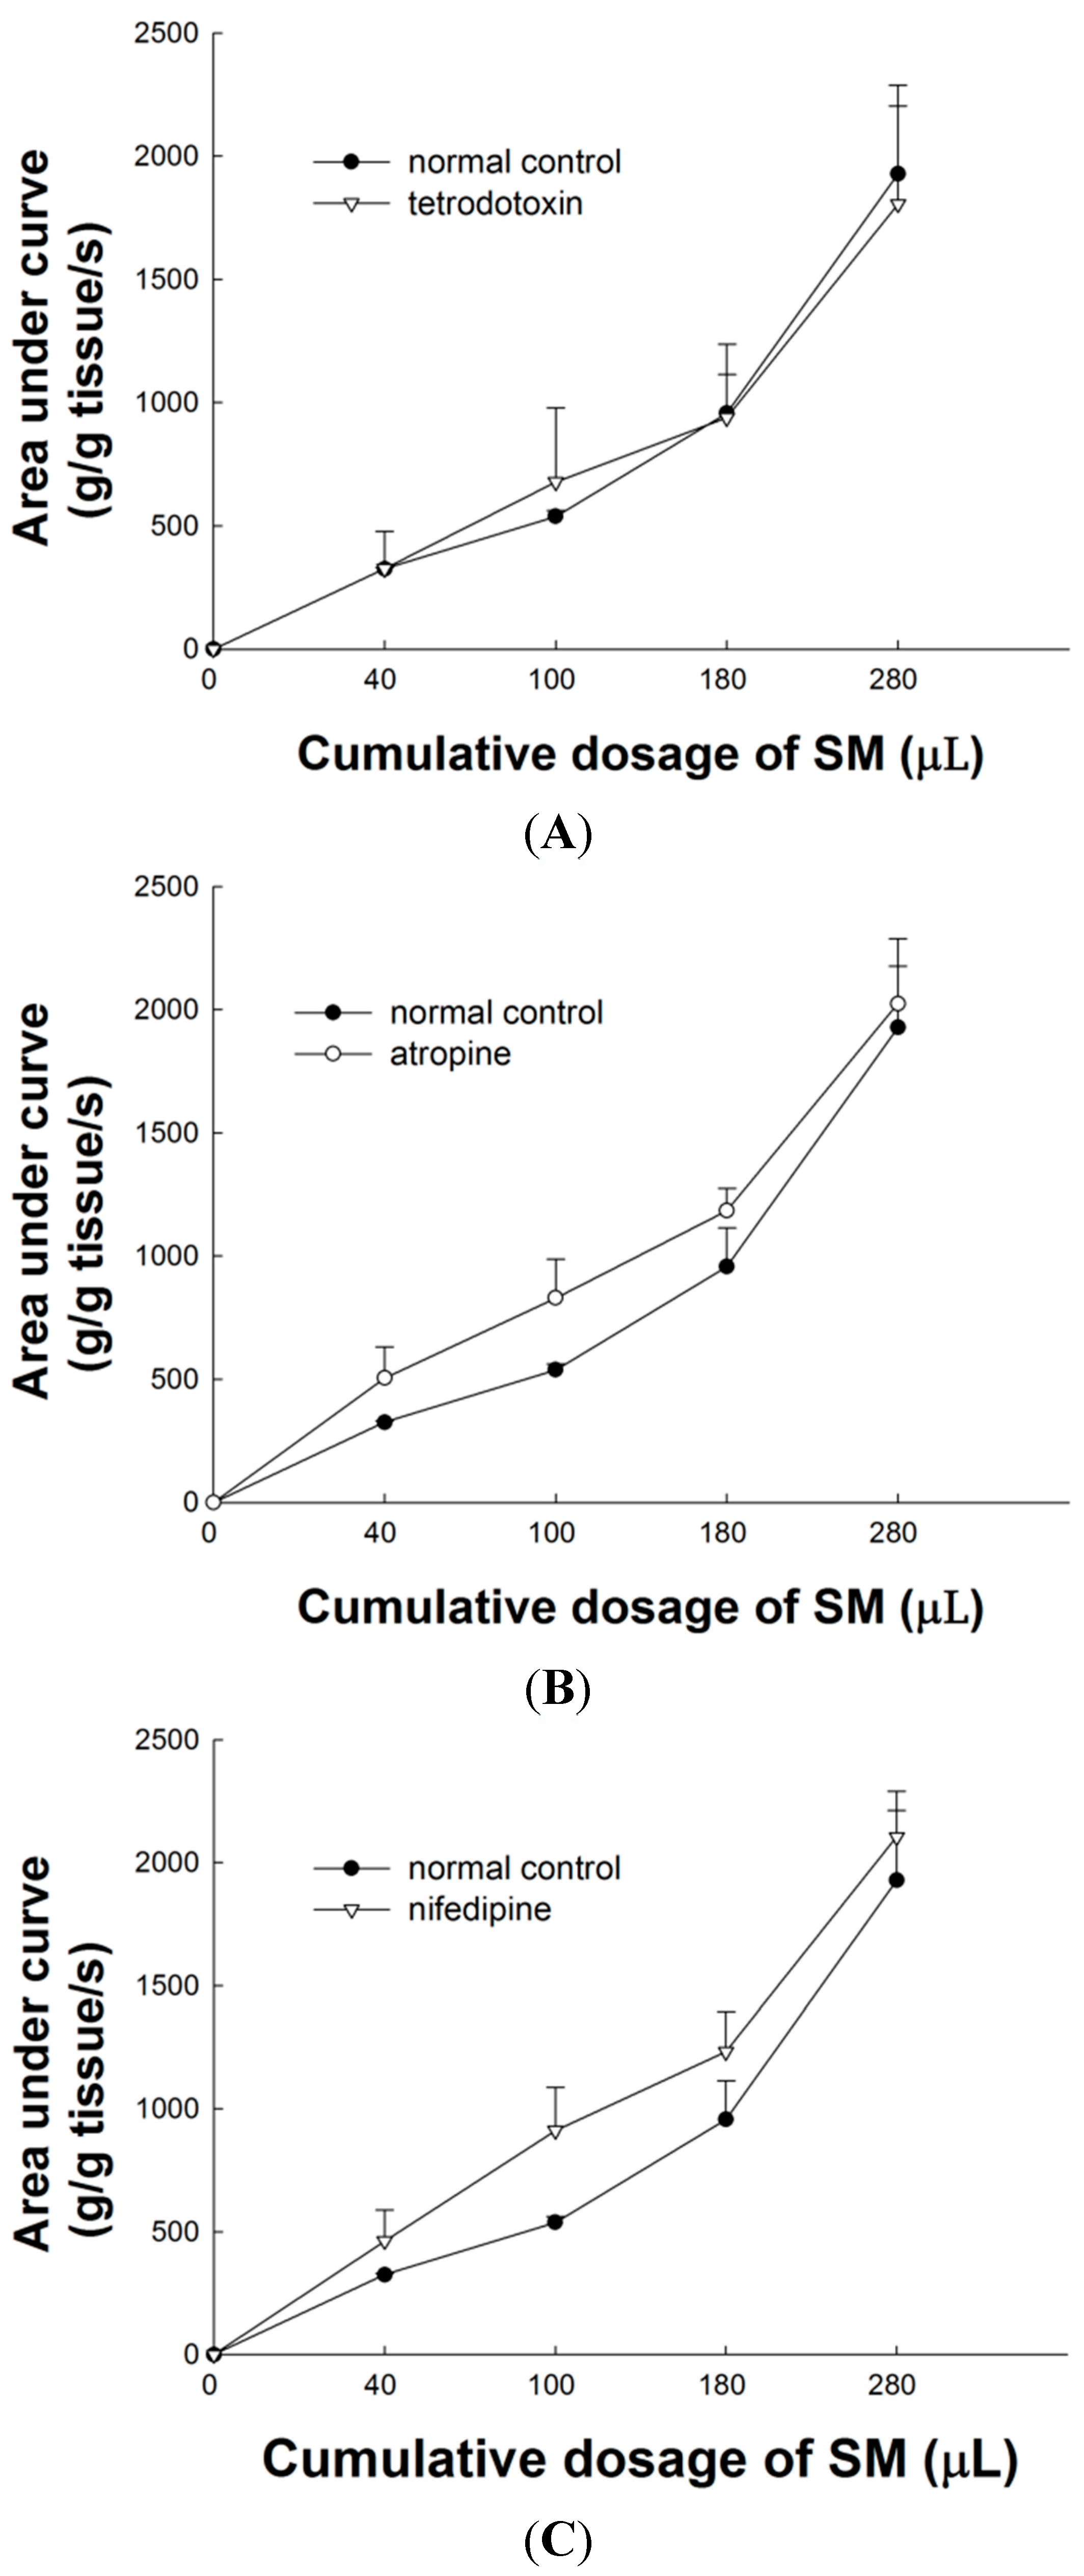
2.3. Effect of Tetrodotoxin (TTX) on SM Extracts-Induced Contraction of LES

TTX has no significant effect on the area under the contraction curve of SM extract-induced contraction of LES. As shown in Figure 2A, the dose-response curves of SM extracts were almost unaffected by 15 min pretreatment with TTX (p > 0.05 compared with administration of SM extracts, n = 3). The efferent neurons from excitatory vagal nerves have the main regulatory action to increase LES tone. TTX is a selective neuronal Na+ channel blocker. To investigate whether SM acts directly on the nerve fiber or on smooth muscle of LES, the effect of TTX (10−6 M) on SM-induced tonic contraction of LES was examined in the present study. No significant difference of TTX on SM extracts-induced contraction of LES was observed, compared to control. The result suggests that SM does not act directly on the nerve fibers of LES.

2.4. Effect of Atropine on SM Extract-Induced Contraction of LES

The non-selective muscarinic receptor antagonist atropine (10−6 M) was also studied its relation to SM extracts-induced contraction of LES. As shown in Figure 2B, 6-min pretreatment with atropine has no significant effect on SM extracts-induced contraction of LES (p > 0.05, n = 3).
In LES, excitatory postganglionic myenteric neurons, releasing acetylcholine and its derivatives such as carbachol, activate muscarinic receptors, inducing increased cytosolic [Ca2+]i and contraction [20]. Muscarinic receptors are divided into five subtypes, M1–M5. Among them, the M1, M2 and M3 receptors are thought to be the main ones associated with the contraction of LES. Non-selective muscarinic receptor antagonists like atropine can block the M1–5 receptors. To understand the mechanism underlying the contractile effects of SM extracts on LES, atropine was used to investigate the possible involvement of the cholinergic pathway. We found that atropine (10−6 M) failed to inhibit SM extract-induced contraction of LES, indicating that the SM extract-induced contraction might not be mediated through the muscarinic receptors.
Figure 2. Effects of pretreatment with TTX, atropine and nifedipine on contraction of LES induced by SM extracts. (A) TTX (10−6 M) has no significant effect on contraction of LES induced by SM extracts; (B) Atropine (10−6 M) has no significant effect on contraction of LES induced by SM extracts; (C) Nifedipine (10−6 M) has no significant effect on contraction of LES induced by SM extracts.
Molecules 20 14504 g002

2.5. Effect of L-Type Ca2+ Channel Blocker on SM Extract-Induced Contraction of LES

The L-type Ca2+ channel blocker nifedipine (10−6 M) has no significant effect on the area under the contraction curve of SM extract-induced contraction of LES. As shown in Figure 2C, the dose-response curve of SM extracts was almost unaffected by a 20 min pretreatment with nifedipine (p > 0.05, n = 3). We confirmed that the L-type Ca2+ channel blocker, nifedipine, failed to block SM extract-induced contraction of LES.

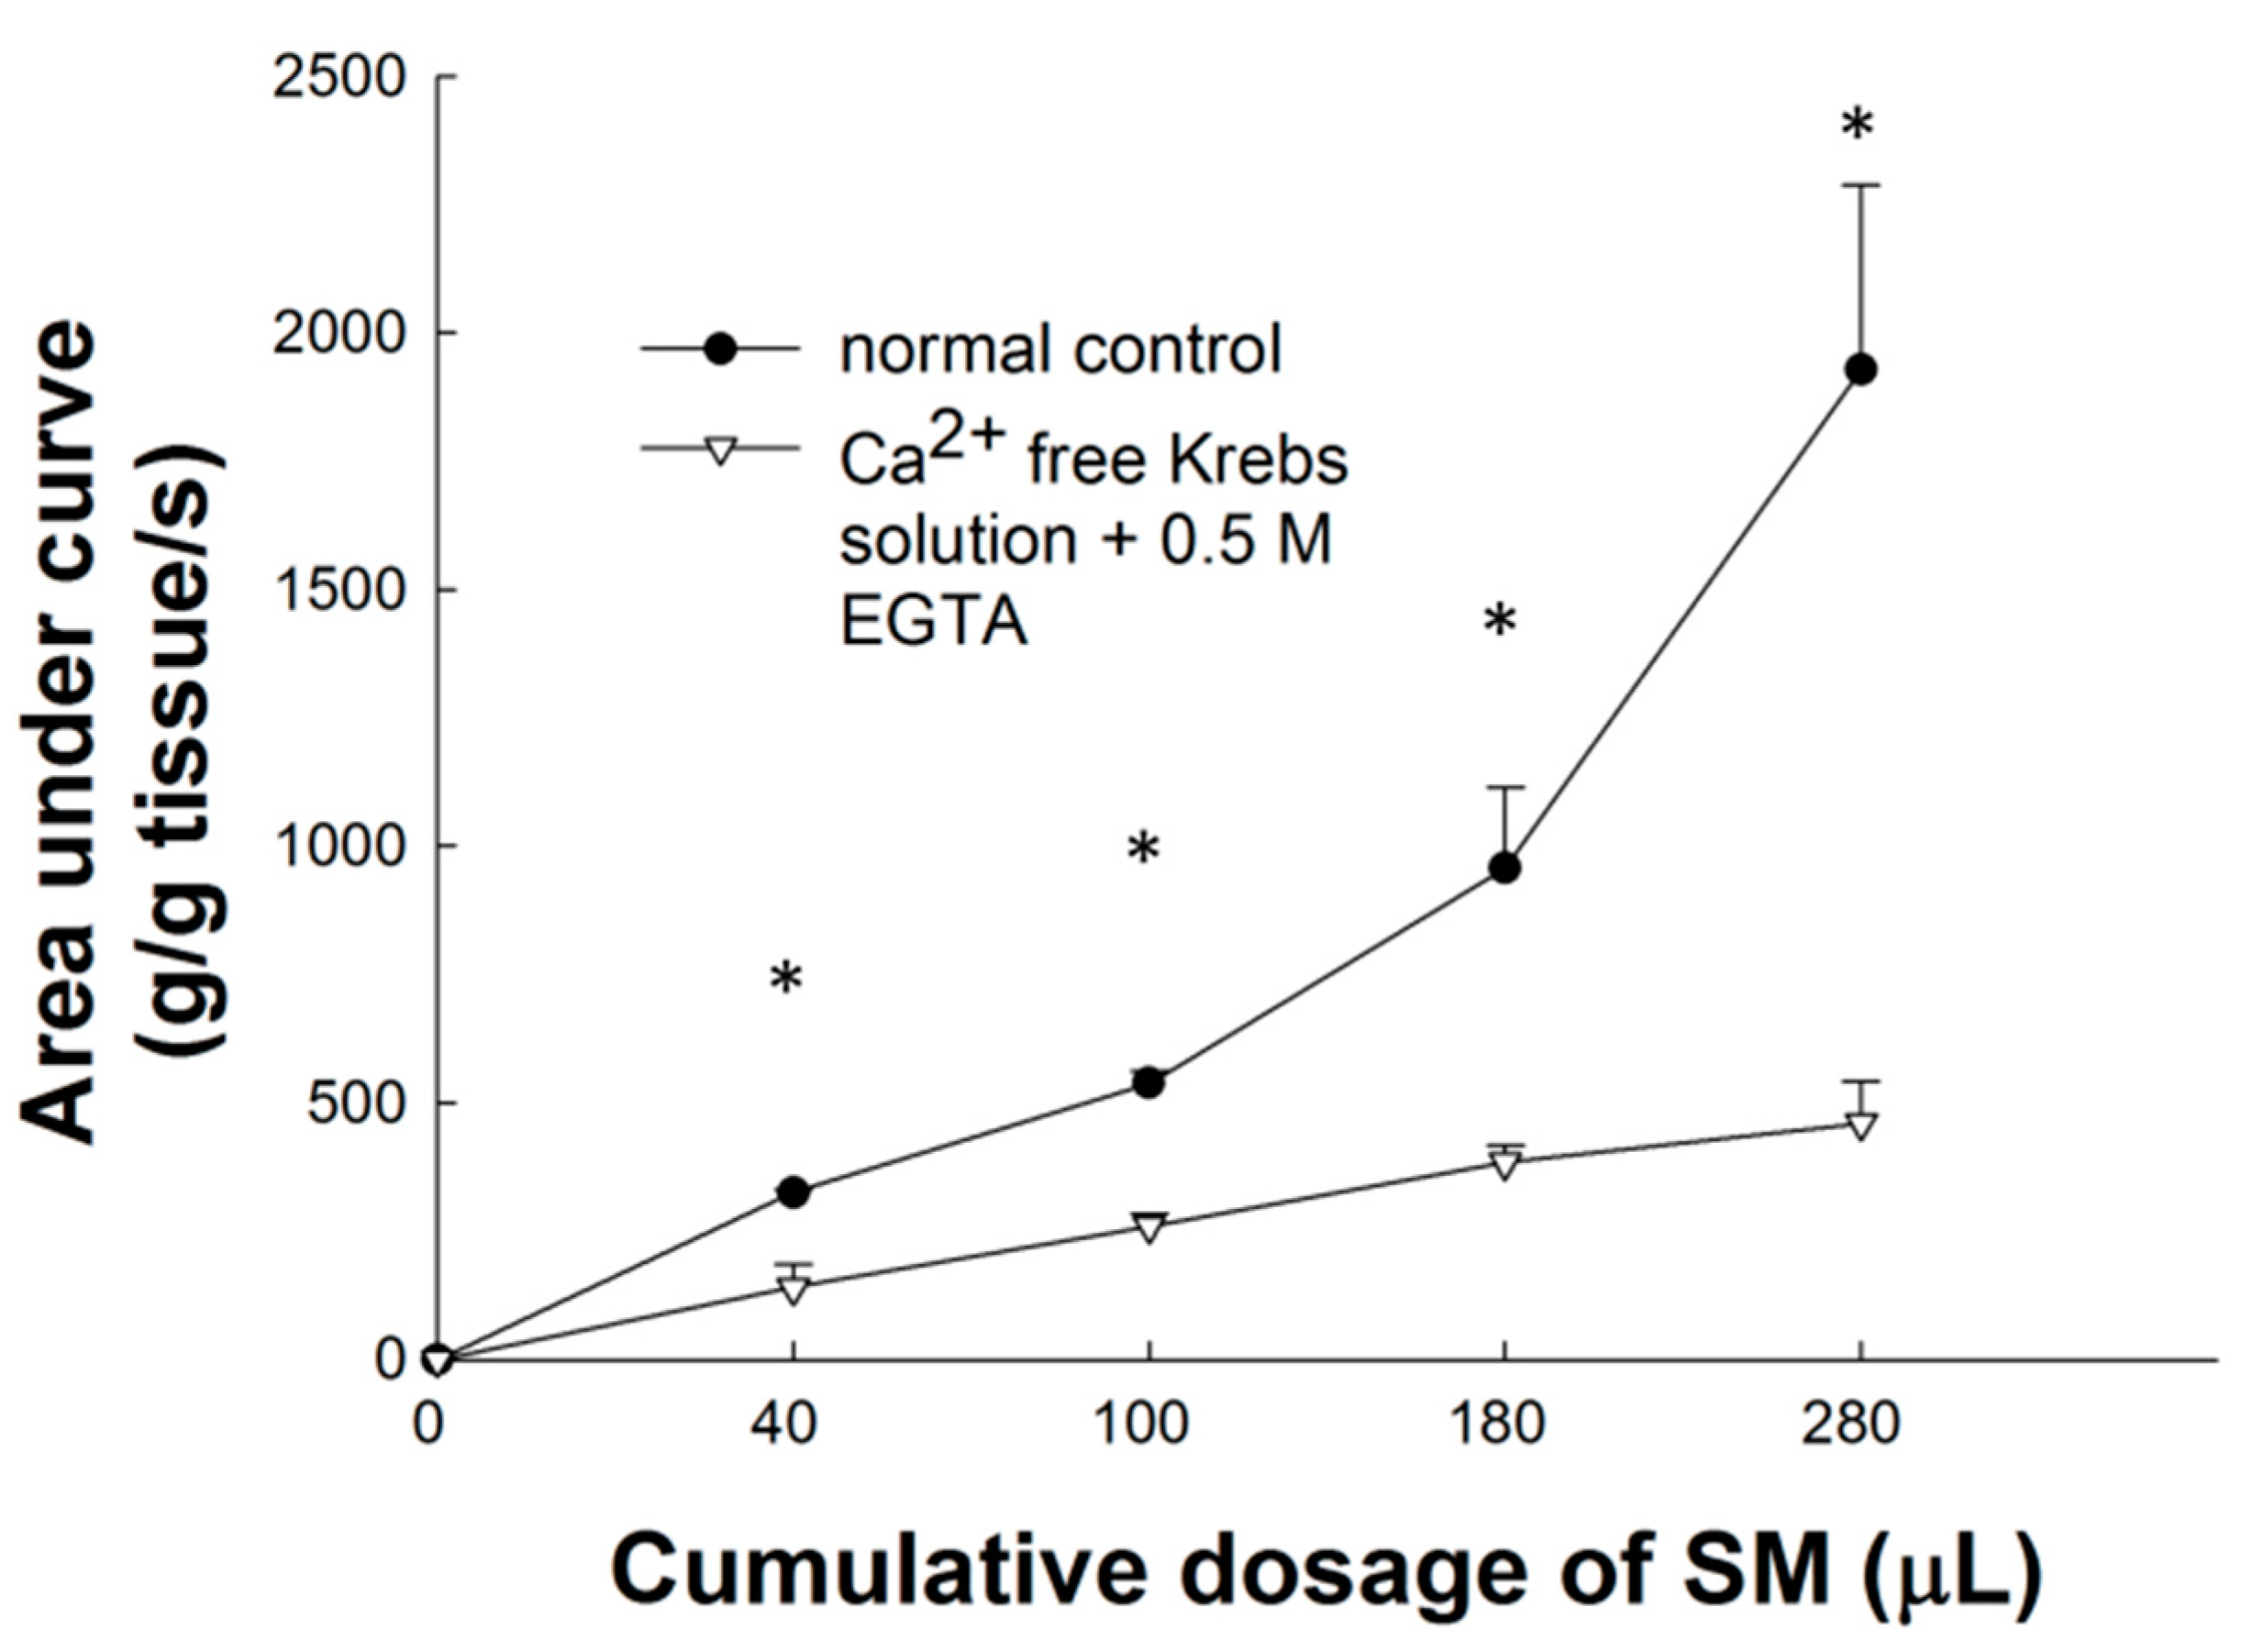
2.6. Effect of Ca2+-Free Krebs-Henseleit Solution plus EGTA on SM Extract-Induced Contraction of LES

Compared to the basal line, the AUC of the contraction curves after cumulative doses of 40, 100, 180, and 280 μL SM extracts were 140.4 ± 45.6, 260.3 ± 22.3, 383.7 ± 33.8, and 460 ± 82.1 (g/g of tissue weight/s) respectively. Ca2+-free Krebs-Henseleit solution plus EGTA has a significant effect on different dosage of SM extract-induced tonic contraction (p < 0.05, n = 3; Figure 3). In Ca2+-free Krebs-Henseleit solution (contained 0.5 mM EGTA), SM extract-induced contraction of LES was significantly different from the contractile response in Krebs-Henseleit solution.
Smooth muscle contraction of LES is generally related to an increase in cytosolic Ca2+ concentration which is produced by trans-membrane Ca2+ entry and/or by intracellular Ca2+ release [18]. Thus, in this ex vivo contraction study of LES in rats, these above results showed the extracellular Ca2+ influx pathway other than the L-type Ca2+ channel may be the main pathway of SM extract-induced contraction of LES. There are several possible pathways for calcium entrance other than the L-type Ca2+ channel in SM extract-induced smooth muscle contraction of LES. The results could be contributed to agonist-induced contraction as well as tone, including capacitative Ca2+ entry [21], a T-type Ca2+ channel [22] and other sarcolemmal Ca2+ channels, such as nonselective cationic channels and receptor-operated calcium channels [23].
Figure 3. Effects of Ca2+-free Krebs-Henseleit solution with EGTA on contraction of induced by SM extracts. Ca2+-free Krebs-Henseleit solution with EGTA significantly (p < 0.05) inhibited the SM extract-induced contraction of LES in a dose-dependent manner. * Significantly different from the control at p < 0.05.
Molecules 20 14504 g003

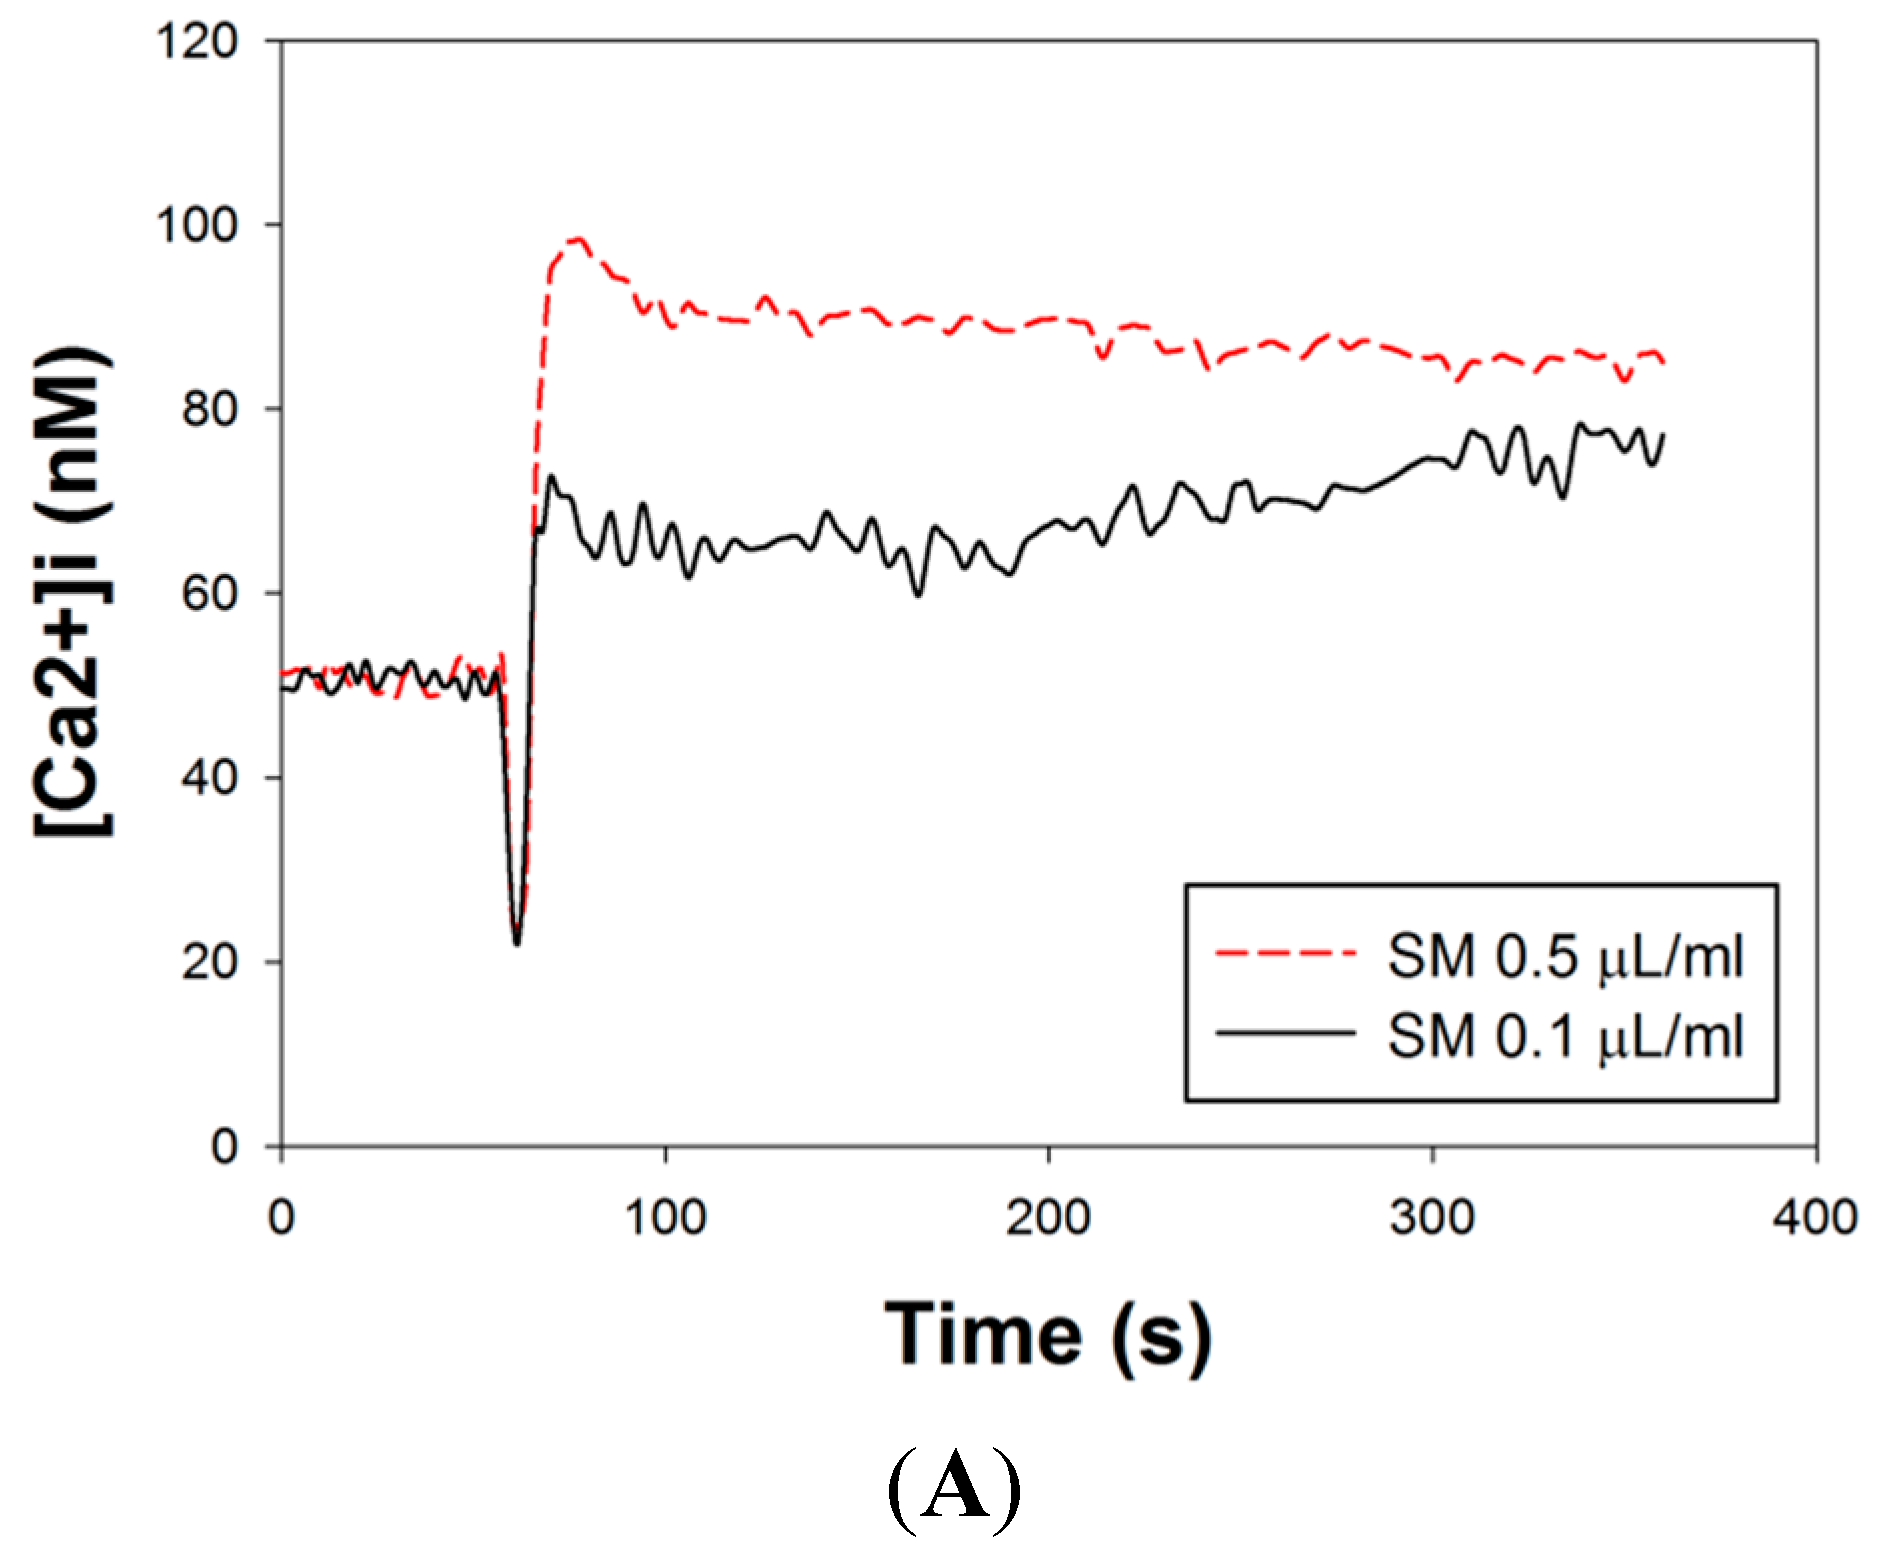
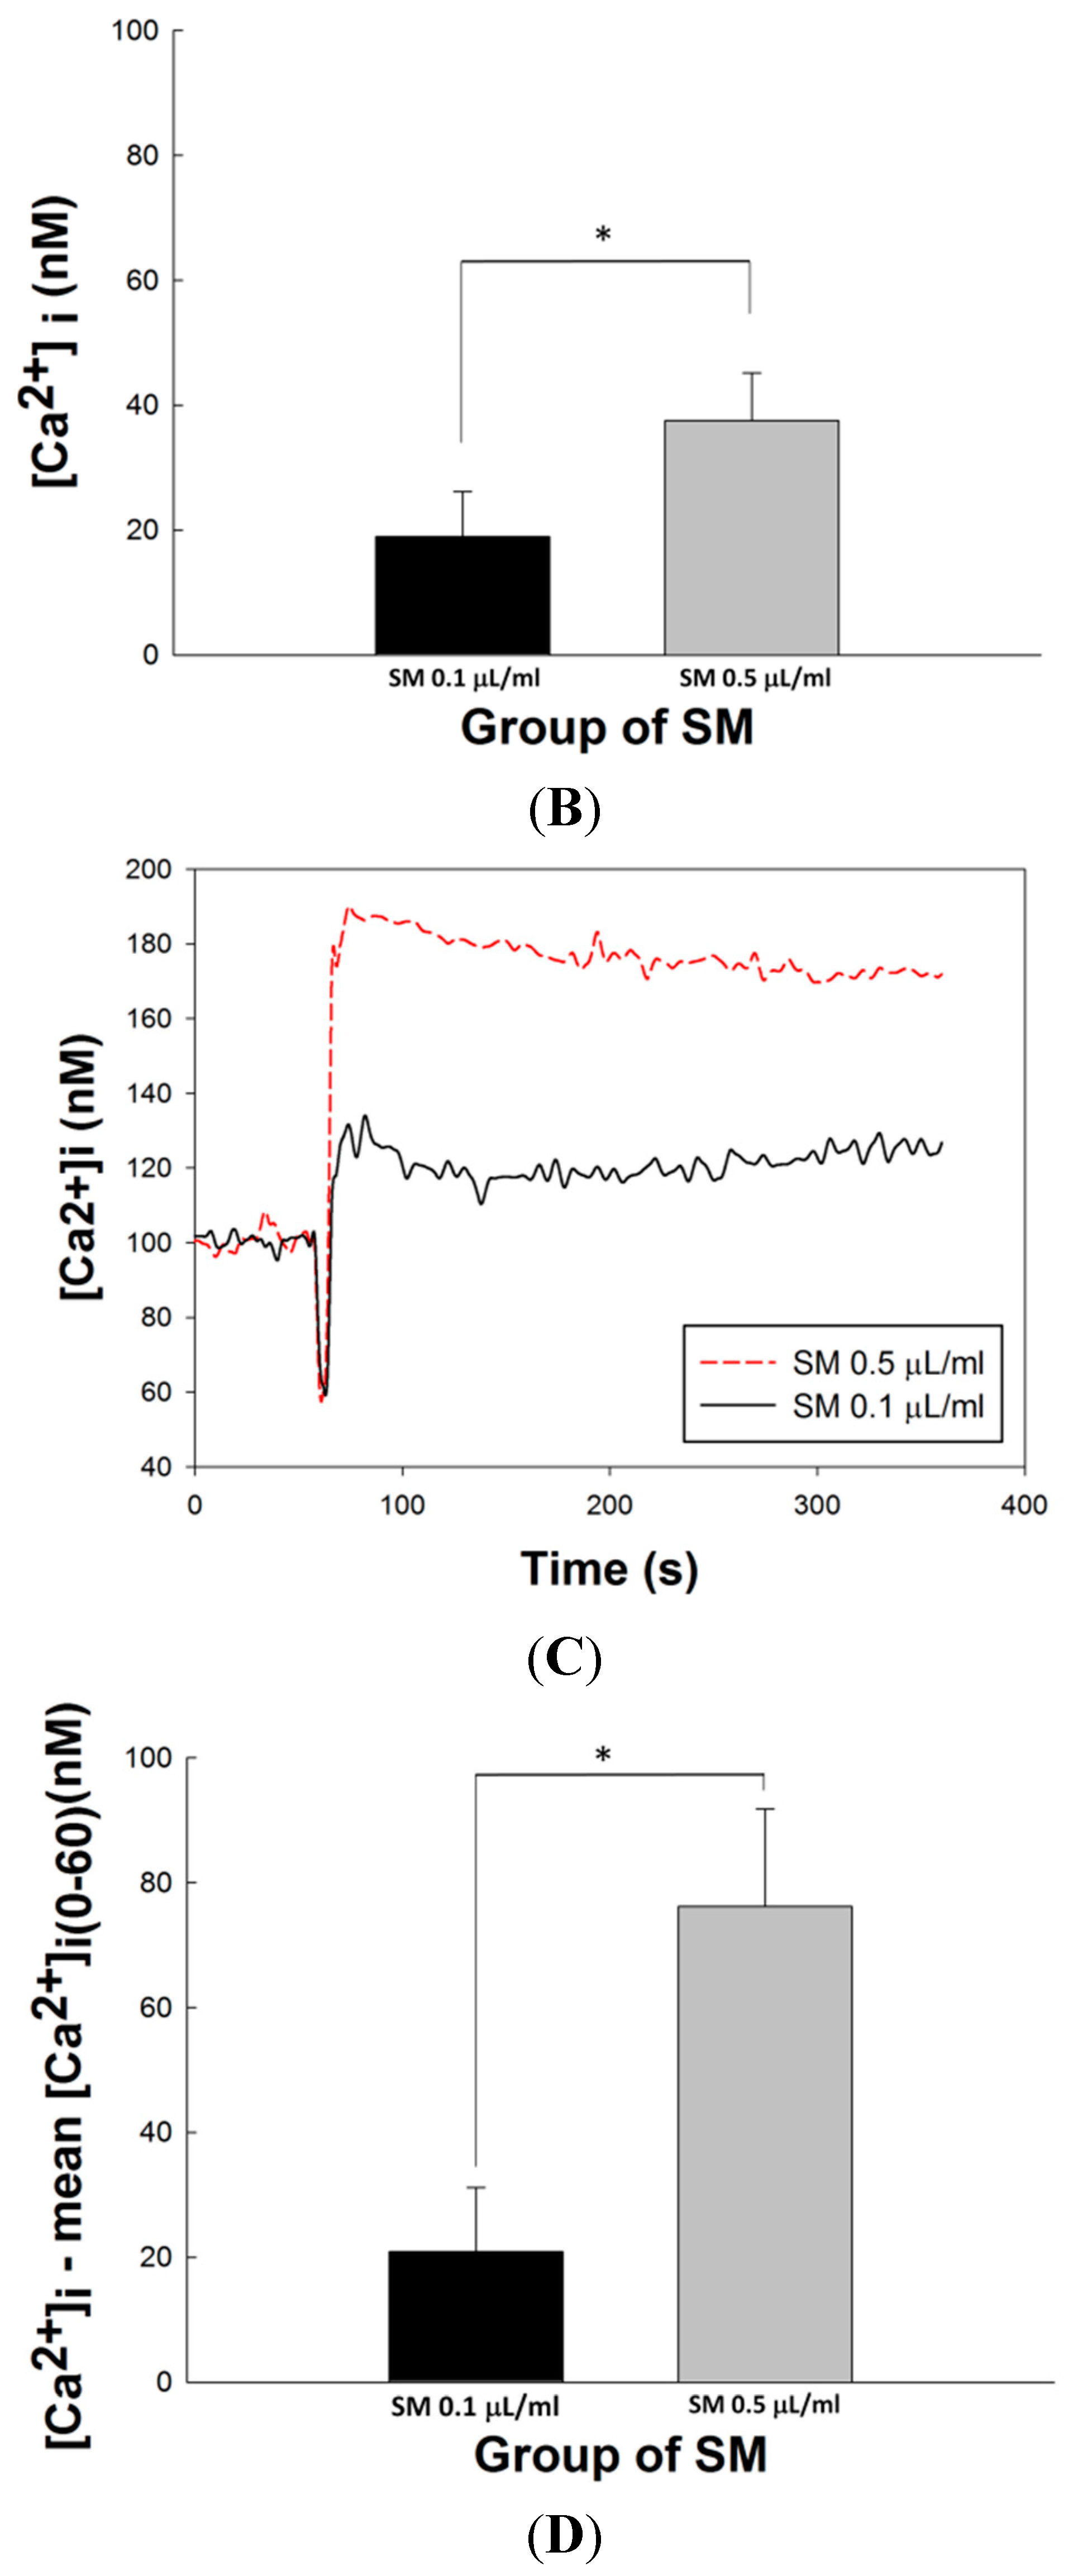
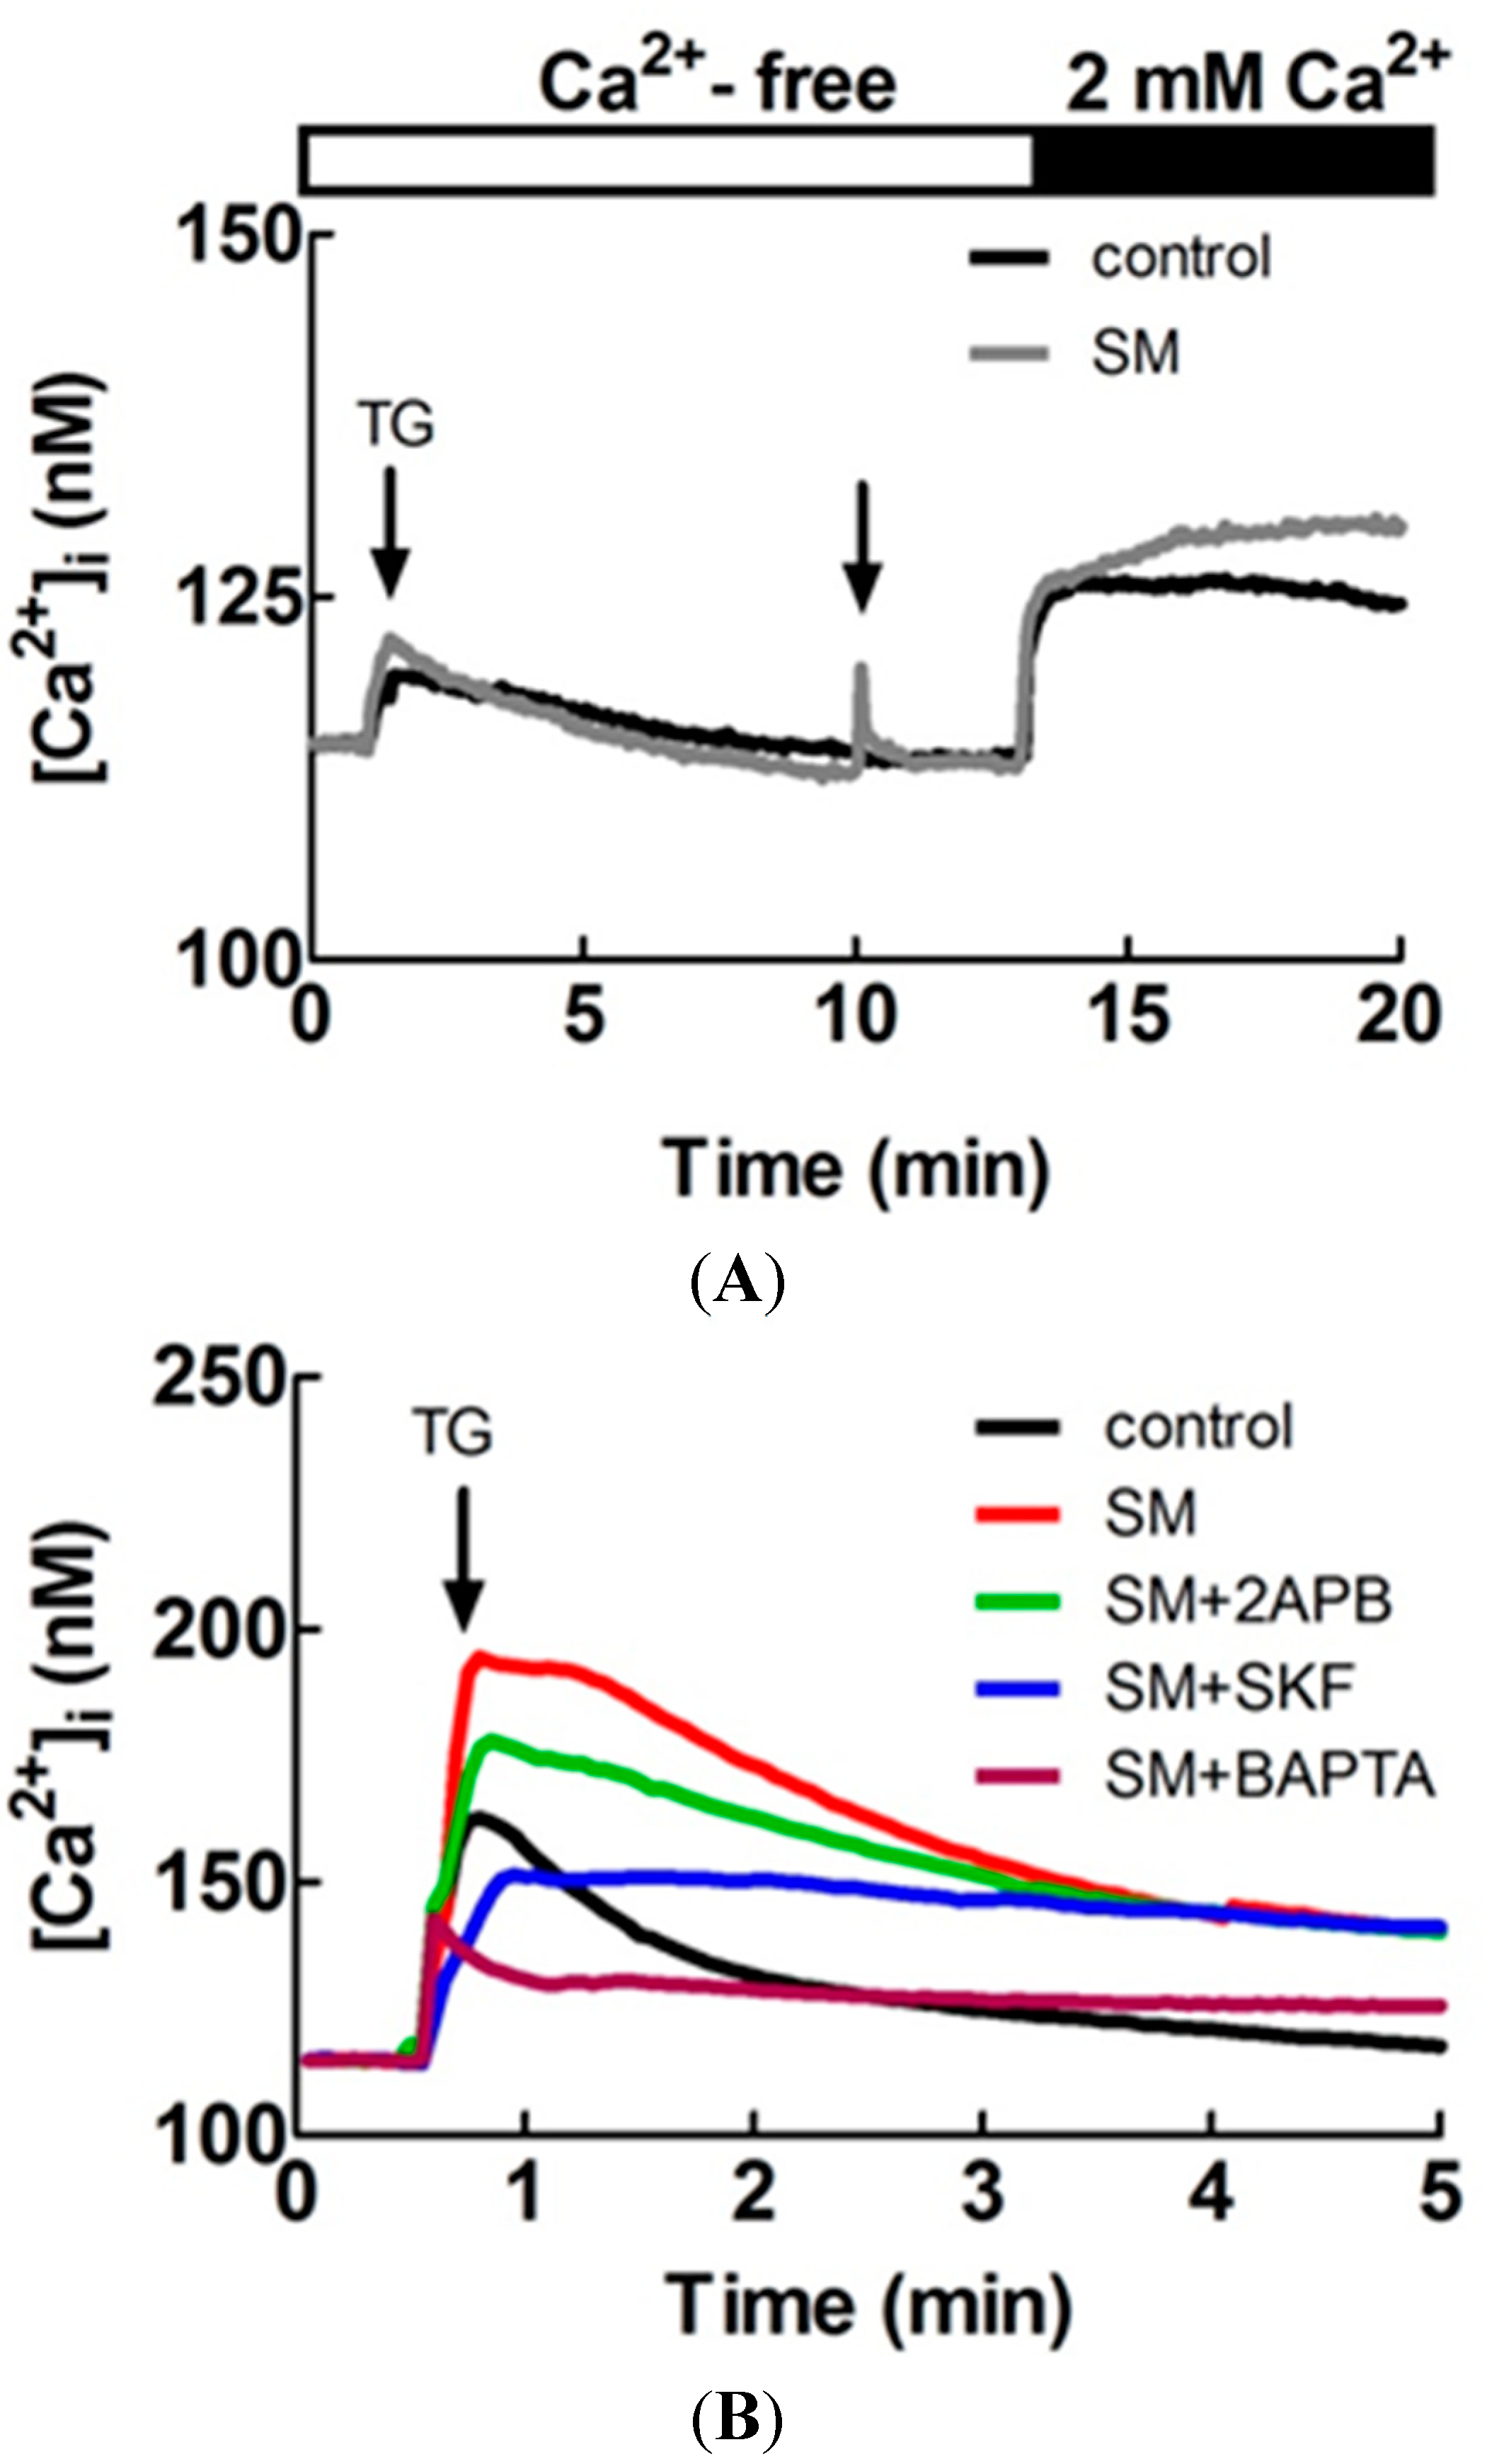
2.7. Effects of SM Extracts on Cytosolic Concentration of Free Ca2+ ([Ca2+]i) in Primary LES Smooth Muscle Cells

The effects of SM extracts on [Ca2+]i flow from extracellular entry or intracellular release were investigated in primary LES smooth muscle cells. The mean concentration-response plots of SM-induced increased [Ca2+]i signals in Ca2+-free medium was shown in Figure 4A. SM extracts were added to primary LES smooth muscle cells at the 60th s (mean [Ca2+]i: 47.03 ± 13.43 nM at the 60th s). After addition of SM extracts, a short decay of [Ca2+]i was noted and rapid rise of [Ca2+]i followed. A sustained [Ca2+]i was noted after [Ca2+]i reached the top. The changes of [Ca2+]i(61–360) were that mean [Ca2+]i during 0–60 s as a background was subtracted from [Ca2+]i at each time point during 61–360 s As showed in Figure 4B, the average of ([Ca2+]i(61–360) − mean [Ca2+]i(0–60)) was calculated and the results in the groups of high (0.5 μL/mL) and low (0.1 μL/mL) concentration of SM extracts were 37.53 ± 8.83 nM and 18.95 ± 7.20 nM, respectively (p < 0.05, n = 3). This result indicated SM extracts induced intracellular Ca2+ release from intracellular stores (sarcoplasmic reticulum) in a dose-response manner.
The mean concentration-response plots of SM-induced increased [Ca2+]i signals in Ca2+-containing medium are shown in Figure 4C. SM extract was added to primary LES smooth muscle cells at the 60th s (mean [Ca2+]i: 99.11 ± 4.61 nM at the 60th s). After addition of SM extract, [Ca2+]i had a similar presentation as that in Ca2+-free medium. As shown in Figure 4D, the average of ([Ca2+]i(61–360) − mean [Ca2+]i(0–60)) was calculated and the results in the groups of high (0.5 μL/mL) and low (0.1 μL/mL) concentration of SM extracts were 76.15 ± 15.65 nM and 20.91 ± 10.26 nM, respectively (p < 0.05, n = 3). Comparing Figure 4D with Figure 4B, the averages of ([Ca2+]i(61–360) − mean [Ca2+]i(0–60)) of these groups stimulated by high and low concentration of SM extract in the Ca2+-containing medium were significantly higher than those in the Ca2+-free medium, respectively (76.15 ± 15.65 vs. 37.53 ± 8.83 nM, 20.91 ± 10.26 vs. 18.95 ± 7.20 nM, both p < 0.05). Compared to low concentration SM extract, high concentrations of SM extract induce 3.64- and 1.98-fold increases (76.15 ± 15.65/20.91 ± 10.26 vs. 37.53 ± 8.83/18.95 ± 7.20) in Ca2+-containing (Figure 4D) and Ca2+-free (Figure 4B) medium, respectively (p < 0.05). These results indicate SM extracts induce extracellular Ca2+ entry into smooth muscle cells in addition to intracellular Ca2+ release in a dose-response manner.
Figure 4. Effects of SM extracts on Ca2+ signaling in primary LES cells. SM extracts were diluted as 0.5 μL/mL or 0.1 μL/mL in Ca2+-containing or Ca2+-free medium. The SM extracts were added at the 60th s (A) Mean concentration-response plots of SM-induced Ca2+ signals in Ca2+-free medium; (B) The mean ([Ca2+]i(61–360) − mean [Ca2+]i(0–60)) in primary LES cells in Ca2+-free medium during the interval of 61–360 s after SM (0.5 μL/mL or 0.1 μL/mL) treatment; (C) Mean concentration-response plots of SM-induced Ca2+ signals in Ca2+-containing medium; (D) The mean ([Ca2+]i(61–360) − mean [Ca2+]i(0–60)) in primary LES cells in Ca2+-containing medium during the interval of 61–360 s after SM (0.5 μL/mL or 0.1 μL/mL) treatment. * Significantly difference between these two groups at p < 0.05.
Molecules 20 14504 g004aMolecules 20 14504 g004b

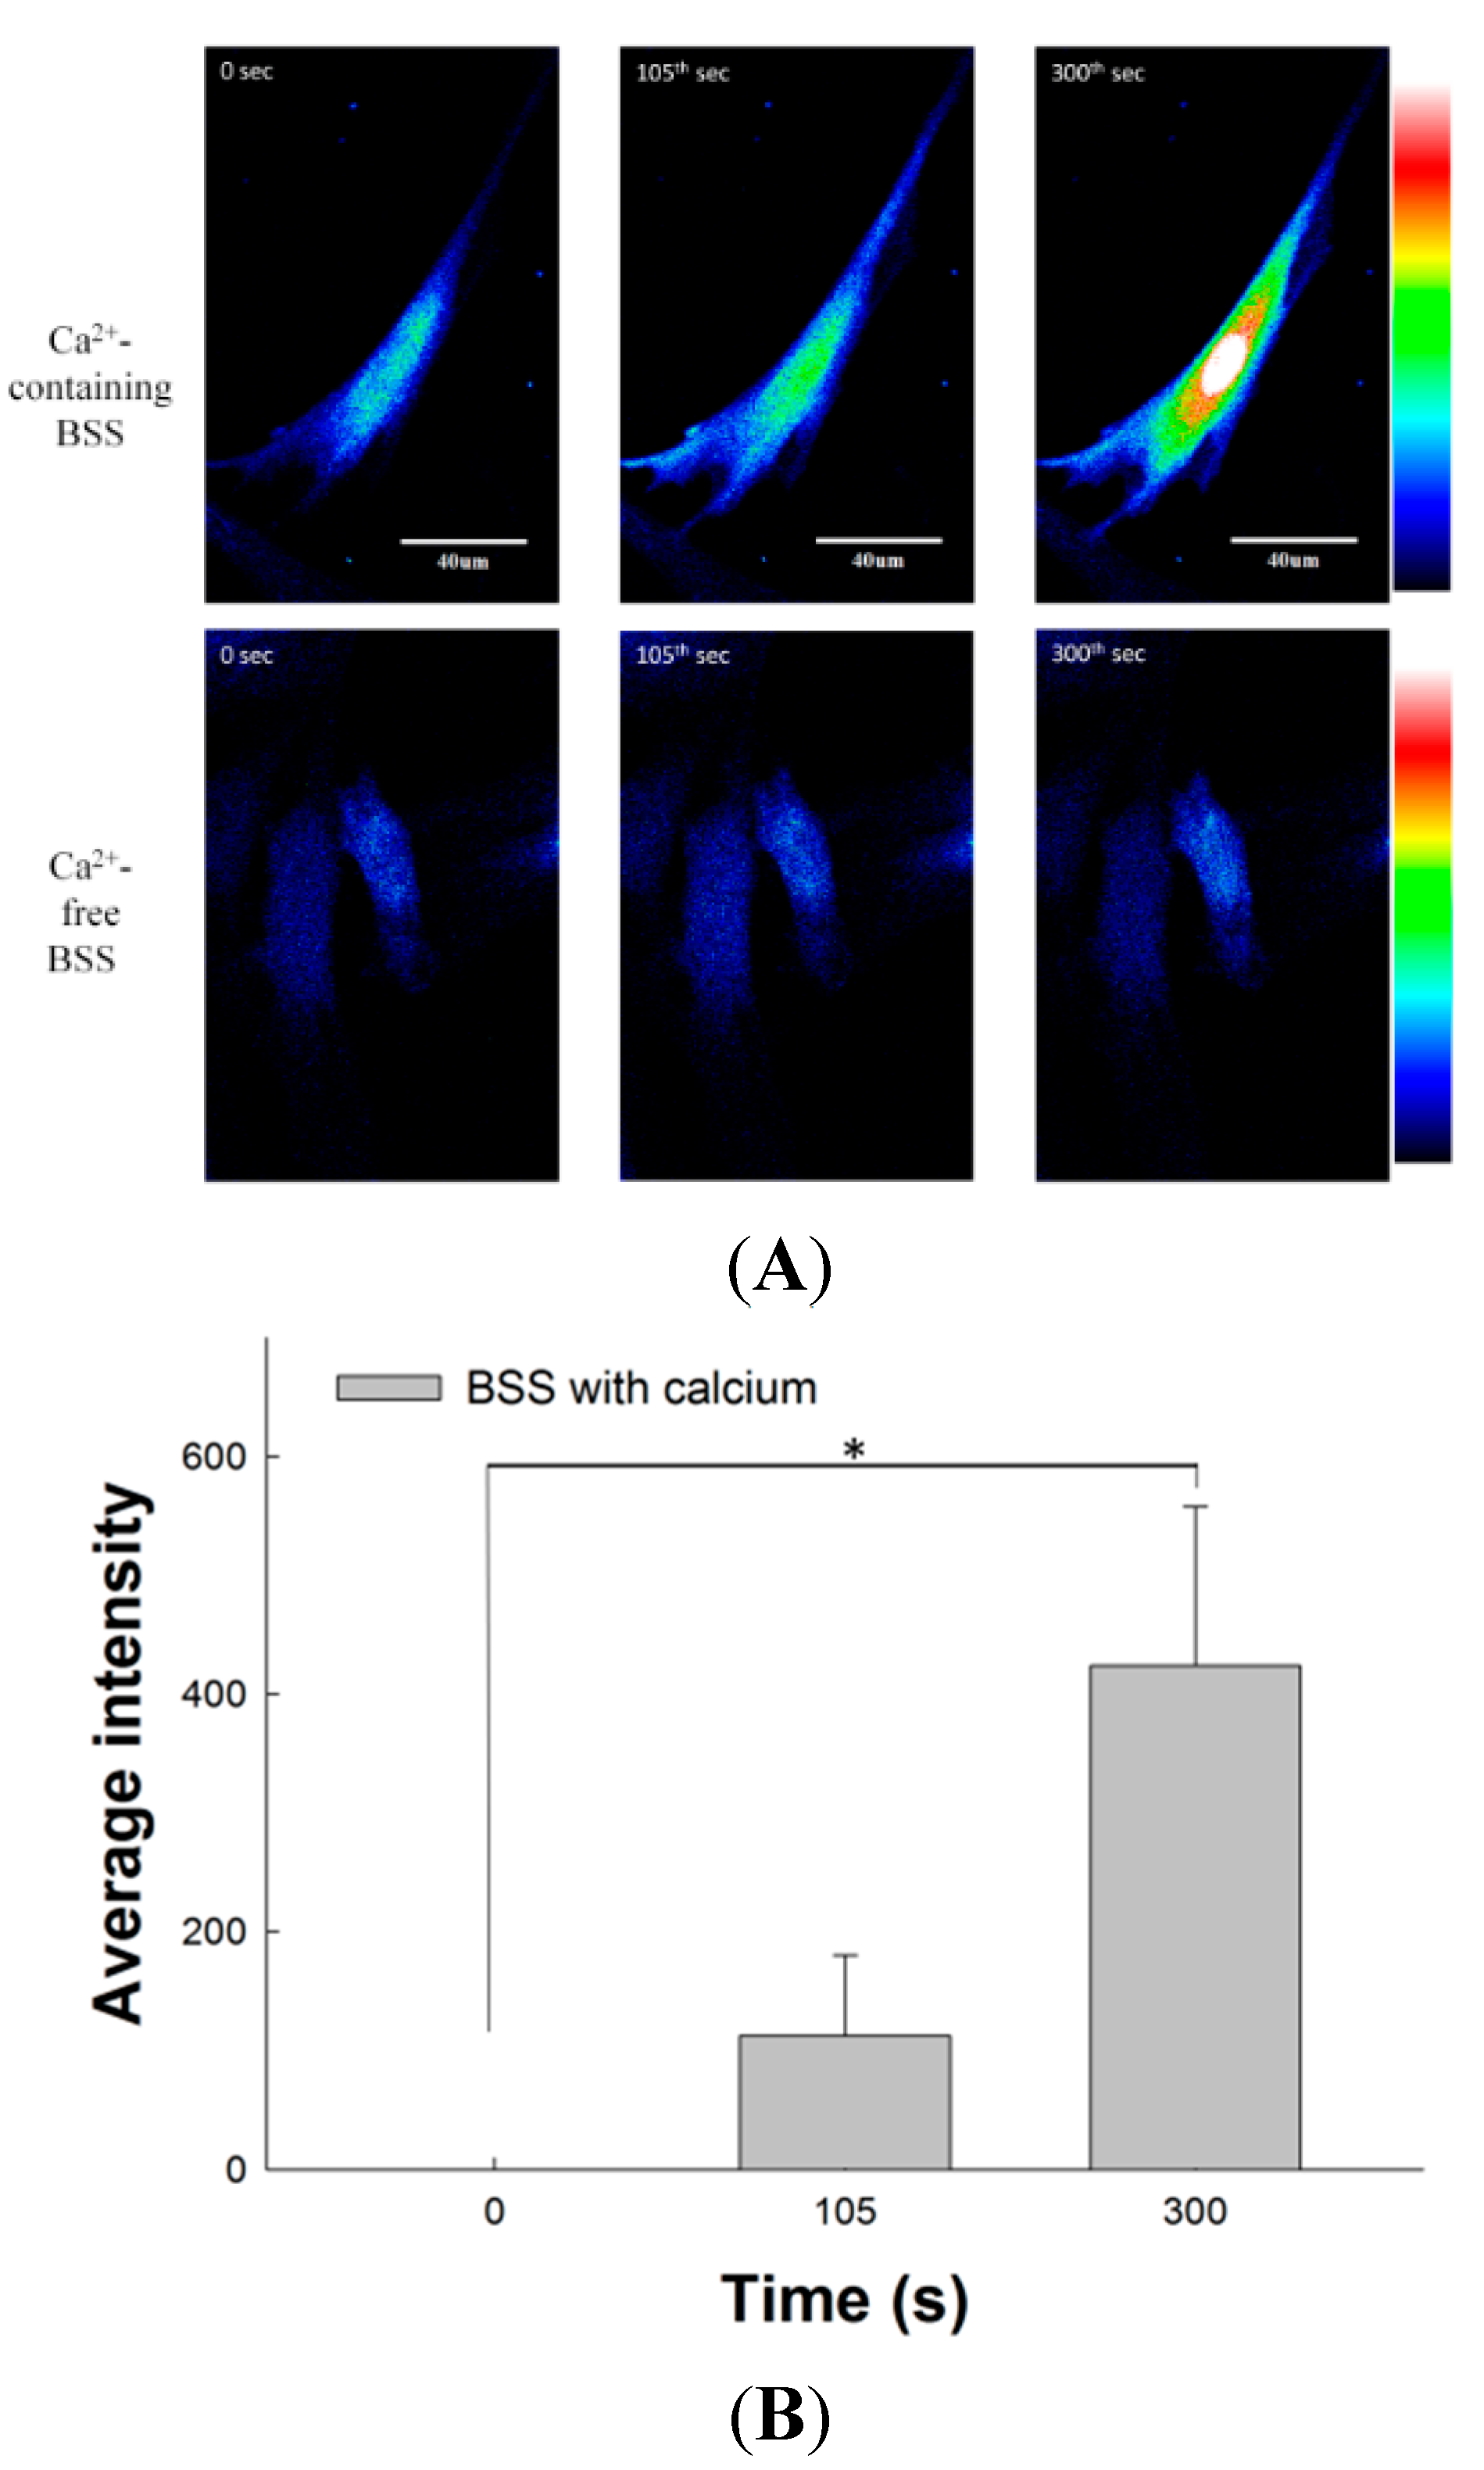
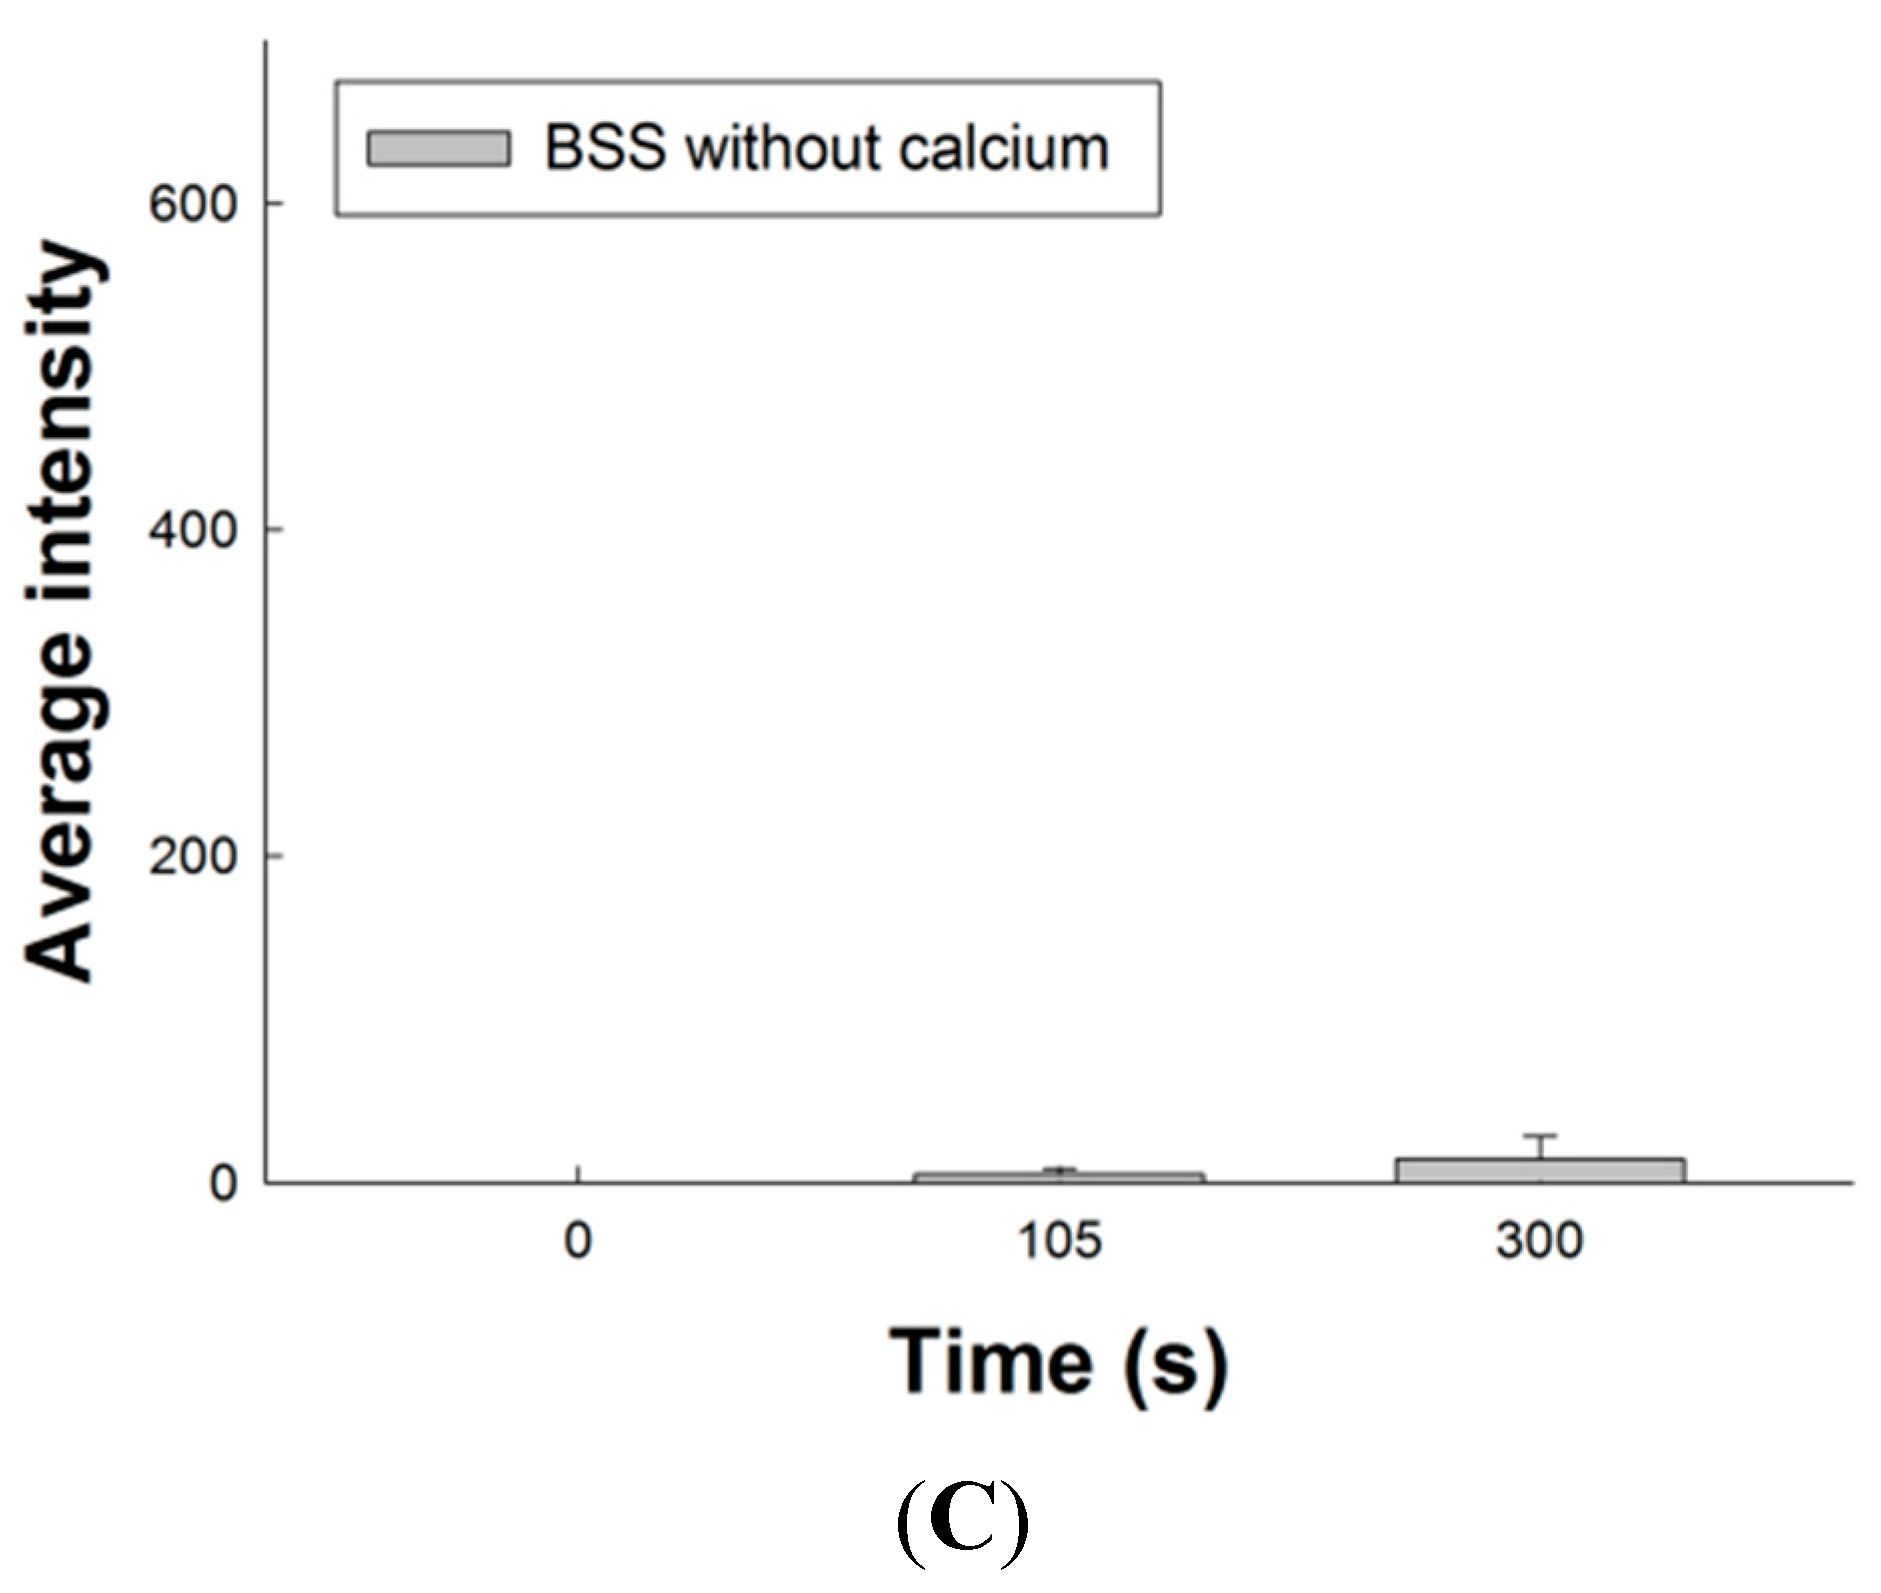
2.8. Effect of SM Extracts on Confocal Images of Changes in Intracellular [Ca2+] in Primary LES Smooth Muscle Cells

Figure 5A shows the fluorescence intensity related to intracellular [Ca2+] in primary LES cells by confocal microscopy. The three images of the upper row were detected in Ca2+-containing Buffer Salt Saline (BSS). After stimulation by SM extract at the 60th s, the fluorescence intensity of intracellular [Ca2+] increased gradually from the 105th s (green) to the 300th s (red and bright). On the contrary, the fluorescence images of primary LES cells after SM treatment in Ca2+-free BSS showed a mild increase at the 105th s and had only a little yellow particle on central part at the 300th s Figure 5B showed the change of relative fluorescence intensity (F − F0, where F0 = the first image of the sequence and F = subsequent images) in the Ca2+-containing BSS. The relative fluorescence intensity (423.82 ± 133.68) of intracellular [Ca2+] in primary LES cells at the 300th s was significantly higher than that at 0 s (p < 0.05, n = 3). Figure 5C shows the change in relative fluorescence intensity (F − F0) in Ca2+-free BSS. The change of relative fluorescence intensity from 0 s, and 105th s to 300th s was at a relatively low level. These results indicate SM extracts induce extracellular Ca2+ entry into smooth muscle cells and increase fluorescence intensity. These in vitro findings are in good agreement with our results obtained in the ex vivo study, which shows SM-induced contraction of LES is mainly associated with extracellular Ca2+ influx.
Figure 5. Effects of SM extracts on the fluorescence intensity of Ca2+ signaling in primary LES cells stained with fluo-4-acetoxymethyl ester and detected by confocal microscopy. SM extracts were diluted as 0.5 μL/mL in Ca2+-containing or Ca2+-free BSS. The SM extracts were added at the 60th s (A) The three images of upper row show the fluorescence intensity of Ca2+ signaling in primary LES smooth muscle cells increased significantly in the Ca2+-containing BSS after SM treatment. On the contrary, there was no significant change in the Ca2+-free BSS after SM treatment; (B) The mean relative fluorescence intensity (F − F0, where F0 = the first image of the sequence and F = subsequent images) in smooth muscle cells at the 300th s in the Ca2+-containing BSS after SM treatment increased significantly; (C) The mean relative fluorescence intensity in smooth muscle cells at the 105th or 300th s in the Ca2+-free BSS after SM treatment did not increase significantly. Scale bar represents 40 μm. * Significant difference between these two groups at p < 0.05.
Molecules 20 14504 g005aMolecules 20 14504 g005b
Figure 6A shows primary LES cells treated by 1 μM thapsigargin (TG) at the 30th s in calcium-free BSS solution and 0.5 μL SM extract stimulation or Ca2+-free BSS solution (control group) added to 1 mL Ca2+-free BSS at the 10th min. The [Ca2+]i in the SM extract stimulation group was more than in the control group after addition of 2 mM CaCl2 at the 13th min (n = 3). These results indicate SM extracts increase [Ca2+]i in primary LES cells by inducing extracellular Ca2+ entry into smooth muscle cells. Figure 6B shows primary LES smooth muscle cells pretreated with only 0.5 μL SM extracts, 0.5 μL SM extracs with 25 μM 2-aminoethoxydiphenyl borate (2APB, a store operated channel blocker), 0.5 μL SM extracts with 20 μM SKF-96365 (SKF, a store operated channel blocker), 0.5 μL SM extracts with 25 μM 1,2-bis(2-aminophenoxy)ethane-N,N,N′,N′-tetraacetic acid tetrakis (acetoxymethyl ester) (BAPTA-AM, a chelator of cytosolic Ca²+), and Ca2+-containing BSS (control group) to 1 mL Ca2+-containing BSS and 1 μM TG was applied to induce Ca2+ influx at the 30th s by depleting the endoplasmic reticulum calcium stores. The [Ca2+]i in the group of only SM extracts pretreatment was more than the other groups (n = 3). These results indicate Ca2+ influx is the main pathway of increased [Ca2+]i induced by SM extracts.
Figure 6. Effects of SM extracts on cytosolic concentration of free Ca2+ ([Ca2+]i) in primary LES cells stained with fluo-4 acetoxymethyl ester and detected by the Olympus CellˆR. (A) 1 μM thapsigargin (TG) treatment was performed at the 30th s and 0.5 μL SM extracts stimulations or Ca2+-free BSS solution (control group) was added to 1 mL Ca2+-free BSS solution at the 10th min. The [Ca2+]i in the SM extract stimulation group was more than the control group after addition of 2 mM CaCl2 at the 13th min (n = 3); (B) Primary LES smooth muscle cells were pretreated with 0.5 μL SM extracts, 0.5 μL SM extract with 20 μM 2-aminoethoxydiphenyl borate (2APB), 0.5 μL SM extracts with 2-aminoethoxydiphenyl borate (2APB), 0.5 μL SM extracts with 20 μM SKF-96365 (SKF), 0.5 μL SM extracts with 25 μM 1,2-bis(2-aminophenoxy)ethane-N,N,N′,Nʹ-tetraacetic acid tetrakis(acetoxymethyl ester) (BAPTA-AM), and 0.5 μL BSS (control group) to 1 mL Ca2+-containing BSS solution. 1 μM TG was applied to induce Ca2+ influx at the 30th s The [Ca2+]i in the group of only SM extracts pretreatment was more than the other groups (n = 3).
Molecules 20 14504 g006

3. Experimental Section

3.1. Materials

This study was carried out in strict accordance with the recommendations in the Guide for the Care and Use of Laboratory Animals of Council of Agriculture, Executive Yuan, Taiwan. The protocol was approved by the Animal Care and Use Committee at E-Da Hospital (Permit Number: IACUC-103025). All rats were directly sacrificed by CO2 and all efforts were made to minimize suffering. Male Sprague-Dawley rats were obtained from the BioLASCO Taiwan (Taipei, Taiwan). Carbachol, atropine, nifedipine, papain, collagenase II, dispase II and buffer reagents were obtained from Sigma-Aldrich (St. Louis, MO, USA). Fura-2-acetoxymethyl ester (Fura-2 AM) and fluo-4 AM were purchased from Invitrogen (Carlsbad, CA, USA). Tetrodotoxin was purchased from Tocris Cookson Inc. (Avonmouth Bristol, UK). TA was obtained from the National Institute for Control of Biological and Pharmaceutical Products of China (Beijing, China) and its purity was more than 98% by HPLC analysis.

3.2. Preparation of SM Extracts

Dried roots of SM were obtained from Winpower Biotech. Co., Ltd. (Kaohsiung, Taiwan). The authentication of SM roots was done on the basis of standards and methods provided as listed in Zhonghua Bencao [24]. A herbarium sample, coding number ISU-CMPB-0012, was maintained in the School of Chinese Medicine for Post-Baccalaureate, I-Shou University (Kaohsiung, Taiwan) for future reference. The dried roots of SM (100 g) were cut up in about 1 cm lengths and then ground using a pulverizer. 95% Ethanol was used to extract the roots of SM three times for 18 h. The ethanol extracts were combined and concentrated to 50 mL under vacuum. A membrane filter (0.45 μm) was used to filter the solutions which were then infused into the HPLC for analysis or used in the study of contraction of LES. In this present study, the extraction yield of TA from SM roots was determined as follows [25]:
Extraction yield  ( w w ) = Mass of tanshinone  ( in extracted solution ) Mass of material  ( roots of SM )   × 100 %

3.3. HPLC Analysis of TA in SM Extracts

The chromatographic system consisted of a LC-10AT pump, a SIL-10AF autosampler and a SPD-10Avp UV-VIS detector (Shimadzu, Kyoto, Japan). A Purospher® STAR RP-18 endcapped (250 mm × 4.6 mm i.d., 5 μm) (Merck, Darmstadt, Germany) was applied for the separation and temperature was controlled at 25 °C. The mobile phase was made up of 75% acetonitrile, 12.5% methanol and 12.5% water at volumetric ratios and pH was titrated to 3.0 with glacial acetic acid. The detection was monitored at 270 nm. The mobile phase was delivered at a rate of 1.0 mL/min and the volume of injection loop was 10 μL. Diazepam was used as the internal standard. The sample calibration curve for TA was linear (r = 0.9999) within the range 0–50 mg/mL. Intra- and inter-day coefficients of variation of the assays were less than 5% (n = 6) [26].

3.4. Measurement of Contraction of LES in Rat

Measurements of contraction of the isolated LES were performed according to the procedure previously described in detail [16,27]. Sprague-Dawley (SD) rats, each weighing 350–400 g, were euthanized with CO2 directly in a sealed plastic bag and confirmed to be dead through observation of discontinuation of respiration and palpation of cessation of heartbeat. The abdomen was opened by surgical scissors and the stomach and lower portion of the esophagus were removed and cut open in the longitudinal direction along the greater curvature. The mucosa was cleared away by surgical forceps. A transverse strip (10 mm long and 2 mm wide) was cut from the LES, which was identified as a pink thickened muscle between the stomach and the esophagus. The muscle strips were mounted in 7-mL organ baths containing Krebs-Henseleit solution (118 mM NaCl, 25 mM NaHCO3, 4.7 mM KCl, 14 mM glucose, 1.2 mM NaH2PO4, and 1.8 mM CaCl2) at 37 °C and being oxygenated with 95% O2 + 5% CO2. The muscle strips were linked by surgical silk sutures to isometric transducers (FT.03; Grass Technologies, West Warwick, RI, USA), which were attached to an amplifier (Gould Instrument Systems, Valley View, OH, USA) and a computer recording system (BIOPAC Systems, Santa Barbara, CA, USA). The resting tension of the muscle strips was adjusted to 1.0 g. After a 30-min equilibration period, carbachol was added into organ bath to check the activity of muscle strip and then washed out. Another equilibration period was performed. SM extracts (40 μL, 100 μL, 180 μL, and 280 μL) were added in a cumulative-dose administration into 7-mL organ baths. The muscle strips of LES were removed from the bath, blotted dry, and weighed (tissue wet weight) at the end of each experiment. The AUC (g/g tissue/s) was calculated.

3.5. Effect of Tetrodotoxin, Atropine, Nifedipine and Ca2+-Free Krebs-Henseleit Solution with EGTA on SM Extract-Induced Contraction of LES in Rat

To investigate the mechanism of SM extract-induced contraction of LES, the isolated LES was pretreated with the Na+ channel blocker TTX (10−6 M) and followed 15 min later by addition of SM extract to the organ bath [28,29]. The isolated LES was also pre-treated with the non-selective muscarinic receptor antagonist atropine (10−6 M) followed 6 min later by addition of SM extract. Isolated LES was also pretreated with the L-type Ca2+ channel blocker nifedipine (10−6 M) followed 20 min later by addition of SM extract. Ca2+-free Krebs-Henseleit solution had a similar composition of Krebs-Henseleit solution except for the Ca2+ and it contained 0.5 mM EGTA. The solution in organ bath was replaced by Ca2+-free Krebs-Henseleit solution with EGTA and SM extracts were added into organ baths [16,30].

3.6. Enzymatic Isolation of Primary LES Smooth Muscle Cells

Single smooth muscle cells from LES of Male SD rats were freshly isolated using enzymatic digestion. Briefly, muscular strips of the LES were cut in small pieces and incubated in a 30 μL/mL papain solution for 10 min, washed with Hank's Balanced Salt Solution (HBSS) and incubated for an additional 15 min with a mixture of collagenase type II 4 mg/mL and dispase II 4.5 mg/mL at 37 °C, then washed with HBSS again. After stopping the enzyme reaction with Dulbecco’s Modified Eagle medium (DMEM), the cells were cultured in dishes [31].

3.7. [Ca2+]i Measurements

Fura-2 AM was applied as a Ca2+ probe to detect the [Ca2+]i and measurement of [Ca2+]i was performed according to the procedure previously described in detail [32,33]. 10−6 M AM form of fura-2 was added to trypsinized cells (106/mL) at 25 °C for 30 min in DMEM. Fura-2 fluorescence measurements were performed in a water-jacketed cuvette (25 °C) with continuous stirring; the cuvette contained 1 mL of medium and 0.5 million cells. A Shimadzu RF-5301PC spectrofluorophotometer (Shimadzu, Kyoto, Japan) was used to monitor fluorescence by recording excitation signals at 340 nm and 380 nm of light and emission signal at 510 nm of light at 2 s intervals. 1% Triton X100 and 20 mM EGTA were sequentially added at the end of each experiment to determine maximum and minimum fluorescence values. Ca2+-containing medium is composed of 5 mM KCl, 140 mM NaCl , 2 mM CaCl2, 1 mM MgCl2, 10 mM HEPES, and 5 mM glucose; the pH was adjusted to 7.4 with 1 N NaOH. Ca2+-free medium had a similar composition except for the absence of Ca2+ and it contained 1 mM EGTA. The extracts of SM (0.5 μL or 0.1 μL) were added into 1 mL Ca2+-containing or Ca2+-free media at the 60th s to measure the Ca2+ levels in primary LES cells.

3.8. Confocal Microscope Fluorescent Images

Fluo-4 AM was applied as Ca2+-sensitive fluorescent indicator and the fluorescence intensity of intracellular [Ca2+] in primary LES smooth muscle cells were detected using a confocal microscope (Olympus FV 1000, Tokyo, Japan). Briefly, 105/mL primary LES smooth muscle cells were seeded onto the glass coverslips in six well plastic plates to grow. Two days later, culture medium was removed and cells were washed with BSS and incubated with 1 μM fluo-4 AM solution for 20 min at 37 °C. Fluo-4 AM solution was removed and cells was washed out again with BSS. The coverslip was nipped on special holder and the confocal microscope was used to detect calcium imaging at 3 s intervals for 6 min. The 0.5 μL extracts of SM were sequentially added into 1 mL Ca2+-containing or Ca2+-free BSS on the holder at 1st min. BSS consisted of 5.4 mM KCl, 5.5 mM D-glucose, 1 mM MgSO4, 130 mM NaCl, 20 mM HEPES, 2 mM CaCl2 and pH was adjusted to 7.4. Ca2+-free BSS had a similar composition except Ca2+. Similarly, CellˆR IX81 fluorescence microscope (Olympus, Hamburg, Germany) with fluo-4 AM staining was also applied to detect the intracellular calcium responses to stimulation, such as by CaCl2 or TG. Calcium concentration was calculated using the following formula: [Ca2+]i = KD × [(F − Fmin)/(Fmax − F)]. Plotting the fluorescence intensity versus [Ca2+]i yielded the calibration curve with the formula of: [Ca2+]i = KD × [(F − Fmin)/(Fmax − F)], where KD = 150.5 nM, F = Fluo-4 intensity, Fmax = 640, and Fmin = 21.7 for Fluo-4 [34,35].

3.9. Data Analysis

These data were expressed as means ± standard deviation, and statistical analysis of the results was performed by using Student t test. In all cases, differences were considered significant when p < 0.05.

4. Conclusions

The present study demonstrates that SM causes tonic contraction of LES. The SM-induced contraction may not relate to neuronal conduction, muscarinic receptors, and L-type voltage-dependent calcium channels. This study provides the evidence that the SM-induced contraction of LES is mainly associated with extracellular Ca2+ influx, especially through store operated calcium channels. Hence, SM has the potential to treat the patients with proton pump inhibitor refractory GERD.

Acknowledgments

This study was supported by intramural funding, provided by the E-Da hospital (EDAHP102021, EDAHP103008, EDAHP103036).

Author Contributions

C.-C.T. and L.-C.C. designed research and supervised S.-C.H. and T.-R.T.; C.-C.T., W.-L.H. and performed most of the experiments, whereas C.-C.T., S.-C.H., S.-L.T., and Y.-T.S. analyzed the data. C.-C.T. and L.-C.C. wrote the paper. C.-W.L. performed primary culture of LES. All authors read and approved the final manuscript.

Conflicts of Interest

The authors declare no conflict of interest.

References

  1. Boeckxstaens, G.E. The lower oesophageal sphincter. Neurogastroenterol. Motil. 2005, 17, 13–21. [Google Scholar] [CrossRef] [PubMed]
  2. Sifrim, D.; Zerbib, F. Diagnosis and management of patients with reflux symptoms refractory to proton pump inhibitors. Gut 2012, 61, 1340–1354. [Google Scholar] [CrossRef] [PubMed]
  3. Bredenoord, A.J.; Pandolfino, J.E.; Smout, A.J. Gastro-oesophageal reflux disease. Lancet 2013, 381, 1933–1942. [Google Scholar] [CrossRef]
  4. Yasawy, M.I.; Randhawa, M.A. GERD is becoming a challenge for the medical profession: Is there any remedy? Hepatogastroenterology 2014, 61, 1623–1626. [Google Scholar] [PubMed]
  5. Pharmacopoeia Commission of People’s Republic of China. Pharmacopoeia of the People’s Republic of China; Chemical Industry Press: Beijing, China, 2010; p. 71. [Google Scholar]
  6. Wang, X.; Morris-Natschke, S.L.; Lee, K.H. New developments in the chemistry and biology of the bioactive constituents of Tanshen. Med. Res. Rev. 2007, 27, 133–148. [Google Scholar] [CrossRef] [PubMed]
  7. Li, M.H.; Chen, J.M.; Peng, Y.; Wu, Q.; Xiao, P.G. Investigation of Danshen and related medicinal plants in China. J. Ethnopharmacol. 2008, 120, 419–426. [Google Scholar] [CrossRef] [PubMed]
  8. Cao, C.M.; Xia, Q.; Zhang, X.; Xu, W.H.; Jiang, H.D.; Chen, J.Z. Salvia miltiorrhiza attenuates the changes in contraction and intracellular calcium induced by anoxia and reoxygenation in rat cardiomyocytes. Life Sci. 2003, 72, 2451–2463. [Google Scholar] [CrossRef]
  9. Lam, F.F.; Deng, S.Y.; Ng, E.S.; Yeung, J.H.; Kwan, Y.W.; Lau, C.B.; Koon, J.C.; Zhou, L.; Zuo, Z.; Leung, P.C.; et al. Mechanisms of the relaxant effect of a Danshen and Gegen formulation on rat isolated cerebral basilar artery. J. Ethnopharmacol. 2010, 132, 186–192. [Google Scholar] [CrossRef] [PubMed]
  10. Chan, K.; Chui, S.H.; Wong, D.Y.; Ha, W.Y.; Chan, C.L.; Wong, R.N. Protective effects of Danshensu from the aqueous extract of Salvia miltiorrhiza (Danshen) against homocysteine-induced endothelial dysfunction. Life Sci. 2004, 75, 3157–3171. [Google Scholar] [CrossRef] [PubMed]
  11. Guo, Y.; Li, Y.; Xue, L.; Severino, R.P.; Gao, S.; Niu, J.; Qin, L.P.; Zhang, D.; Brömme, D. Salvia miltiorrhiza: An ancient Chinese herbal medicine as a source for anti-osteoporotic drugs. J. Ethnopharmacol. 2014, 155, 1401–1416. [Google Scholar] [CrossRef] [PubMed]
  12. Chen, X.; Guo, J.; Bao, J.; Lu, J.; Wang, Y. The anticancer properties of Salvia miltiorrhiza Bunge (Danshen): A systematic review. Med. Res. Rev. 2014, 34, 768–794. [Google Scholar] [CrossRef] [PubMed]
  13. Zhang, Z.Y.; Chen, X.P.; Lu, Q.P. Effect of Salvia miltiorrhiza pretreatment on the CCK and VIP expression in hepatic ischemia-reperfusion-induced digestive tract congestion. Front. Med. China 2010, 4, 317–322. [Google Scholar] [CrossRef] [PubMed]
  14. Wen, X.D.; Wang, C.Z.; Yu, C.; Zhang, Z.; Calway, T.; Wang, Y.; Li, P.; Yuan, C.S. Salvia miltiorrhiza (Danshen) significantly ameliorates colon inflammation in dextran sulfate sodium induced colitis. Am. J. Chin. Med. 2013, 41, 1097–1108. [Google Scholar] [CrossRef] [PubMed]
  15. Xiping, Z.; Yan, P.; Xinmei, H.; Guanghua, F.; Meili, M.; Jie, N.; Fangjie, Z. Effects of dexamethasone and Salvia miltiorrhizae on the small intestine and immune organs of rats with severe acute pancreatitis. Inflammation 2010, 33, 259–266. [Google Scholar] [CrossRef] [PubMed]
  16. Tsai, C.C.; Huang, S.C.; Liu, J.K.; Wang, H.C.; Tsai, T.R.; Tsai, P.J.; Liu, C.W.; Chang, L.C. Salvia miltiorrhiza causes tonic contraction in rat ileum through Ca2+-calmodulin pathway. J. Ethnopharmacol. 2012, 142, 694–699. [Google Scholar] [CrossRef] [PubMed]
  17. Farré, R.; Sifrim, D. Regulation of basal tone, relaxation and contraction of the lower oesophageal sphincter. Relevance to drug discovery for oesophageal disorders. Br. J. Pharmacol. 2008, 153, 858–869. [Google Scholar] [CrossRef] [PubMed]
  18. Muinuddin, A.; Neshatian, L.; Gaisano, H.Y.; Diamant, N.E. Calcium source diversity in feline lower esophageal sphincter circular and sling muscle. Am. J. Physiol. Gastrointest. Liver Physiol. 2004, 286, 271–277. [Google Scholar] [CrossRef] [PubMed]
  19. Biancani, P.; Sohn, U.D.; Rich, H.G.; Harnett, K.M.; Behar, J. Signal transduction pathways in esophageal and lower esophageal sphincter circular muscle. Am. J. Med. 1997, 103, 23S–28S. [Google Scholar] [CrossRef]
  20. Hornby, P.J.; Abrahams, T.P. Central control of lower esophageal sphincter relaxation. Am. J. Med. 2000, 108, 90–98. [Google Scholar] [CrossRef]
  21. Wang, J.; Laurier, L.G.; Sims, S.M.; Preiksaitis, H.G. Enhanced capacitative calcium entry and TRPC channel gene expression in human LES smooth muscle. Am. J. Physiol. Gastrointest. Liver Physiol. 2003, 284. [Google Scholar] [CrossRef] [PubMed]
  22. Sims, S.M.; Jiao, Y.; Preiksaitis, H.G. Regulation of intracellular calcium in human esophageal smooth muscle. Am. J. Physiol. 1997, 273, 1679–1689. [Google Scholar]
  23. Sanders, K.M. Signal transduction in smooth muscle: Mechanisms of calcium handling in smooth muscles. J. Appl. Physiol. 2001, 91, 1438–1449. [Google Scholar] [PubMed]
  24. Zhonghua Bencao Committee of State Traditional Chinese Medicine Administration. Zhonghua Bencao; Shanghai Scientific and Technical Press: Shanghai, China, 1999; pp. 169–186. [Google Scholar]
  25. Pan, X.; Niu, G.; Liu, H. Microwave-assisted extraction of tanshinones from Salvia miltiorrhiza bunge with analysis by high-performance liquid chromatography. J. Chromatogr. A 2001, 922, 371–375. [Google Scholar] [CrossRef]
  26. Chang, L.C.; Wu, C.L.; Liu, C.W.; Chuo, W.H.; Li, P.C.; Tsai, T.R. Preparation, characterization and cytotoxicity evaluation of tanshinone IIA nanoemulsions. J. Biomed. Nanotechnol. 2011, 7, 558–567. [Google Scholar] [CrossRef] [PubMed]
  27. Huang, S.C. Dendroaspis natriuretic peptide is the most potent natriuretic peptide to cause relaxation of lower esophageal sphincter. Regul. Pept. 2011, 167, 246–249. [Google Scholar] [CrossRef] [PubMed]
  28. Nagao, M.; Linden, D.R.; Duenes, J.A.; Sarr, M.G. Mechanisms of action of the gasotransmitter hydrogen sulfide in modulating contractile activity of longitudinal muscle of rat ileum. J. Gastrointest. Surg. 2011, 15, 12–22. [Google Scholar] [CrossRef] [PubMed]
  29. Chang, B.S.; Chang, J.C.; Wang, Y.S.; Huang, S.C. Cysteinyl leucotriene receptor type 1 mediates contraction in human and guinea-pig oesophagus. Neurogastroenterol. Motil. 2008, 20, 1140–1146. [Google Scholar] [CrossRef] [PubMed]
  30. Park, S.Y.; Je, H.D.; Shim, J.H.; Sohn, U.D. Characteristics of spontaneous contraction in the circular smooth muscles of cat ileum. Arch. Pharm. Res. 2010, 33, 159–165. [Google Scholar] [CrossRef] [PubMed]
  31. Bautista-Cruz, F.; Paterson, W.G. Evidence for altered circular smooth muscle cell function in lower esophageal sphincter of W/Wv mutant mice. Am. J. Physiol. Gastrointest. Liver Physiol. 2011, 301. [Google Scholar] [CrossRef] [PubMed]
  32. Grynkiewicz, G.; Poenie, M.; Tsien, R.Y. A new generation of Ca2+ indicators with greatly improved fluorescence properties. J. Biol. Chem. 1985, 260, 3440–3450. [Google Scholar] [PubMed]
  33. Ohta, T.; Ito, S.; Nakazato, Y. Chloride currents activated by caffeine in rat intestinal smooth muscle cells. J. Physiol. 1993, 465, 149–162. [Google Scholar] [CrossRef] [PubMed]
  34. Zohar, O.; Ikeda, M.; Shinagawa, H.; Inoue, H.; Nakamura, H.; Elbaum, D.; Alkon, D.L.; Yoshioka, T. Thermal imaging of receptor-activated heat production in single cells. Biophys. J. 1998, 74, 82–89. [Google Scholar] [CrossRef] [PubMed]
  35. Florea, A.M.; Splettstoesser, F.; Büsselberg, D. Arsenic trioxide (As2O3) induced calcium signals and cytotoxicity in two human cell lines: SY-5Y neuroblastoma and 293 embryonic kidney (HEK). Toxicol. Appl. Pharmacol. 2007, 220, 292–301. [Google Scholar] [CrossRef] [PubMed]
  • Sample Availability: Samples in the present paper are not available from the authors.

