
Multi-Residue Analysis of Pesticide Residues in Crude Pollens by UPLC-MS/MS


Abstract
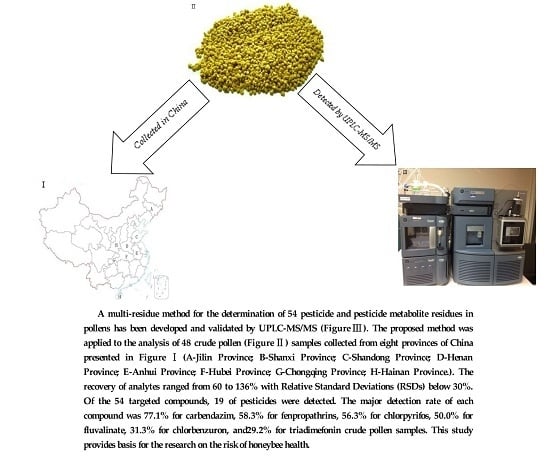
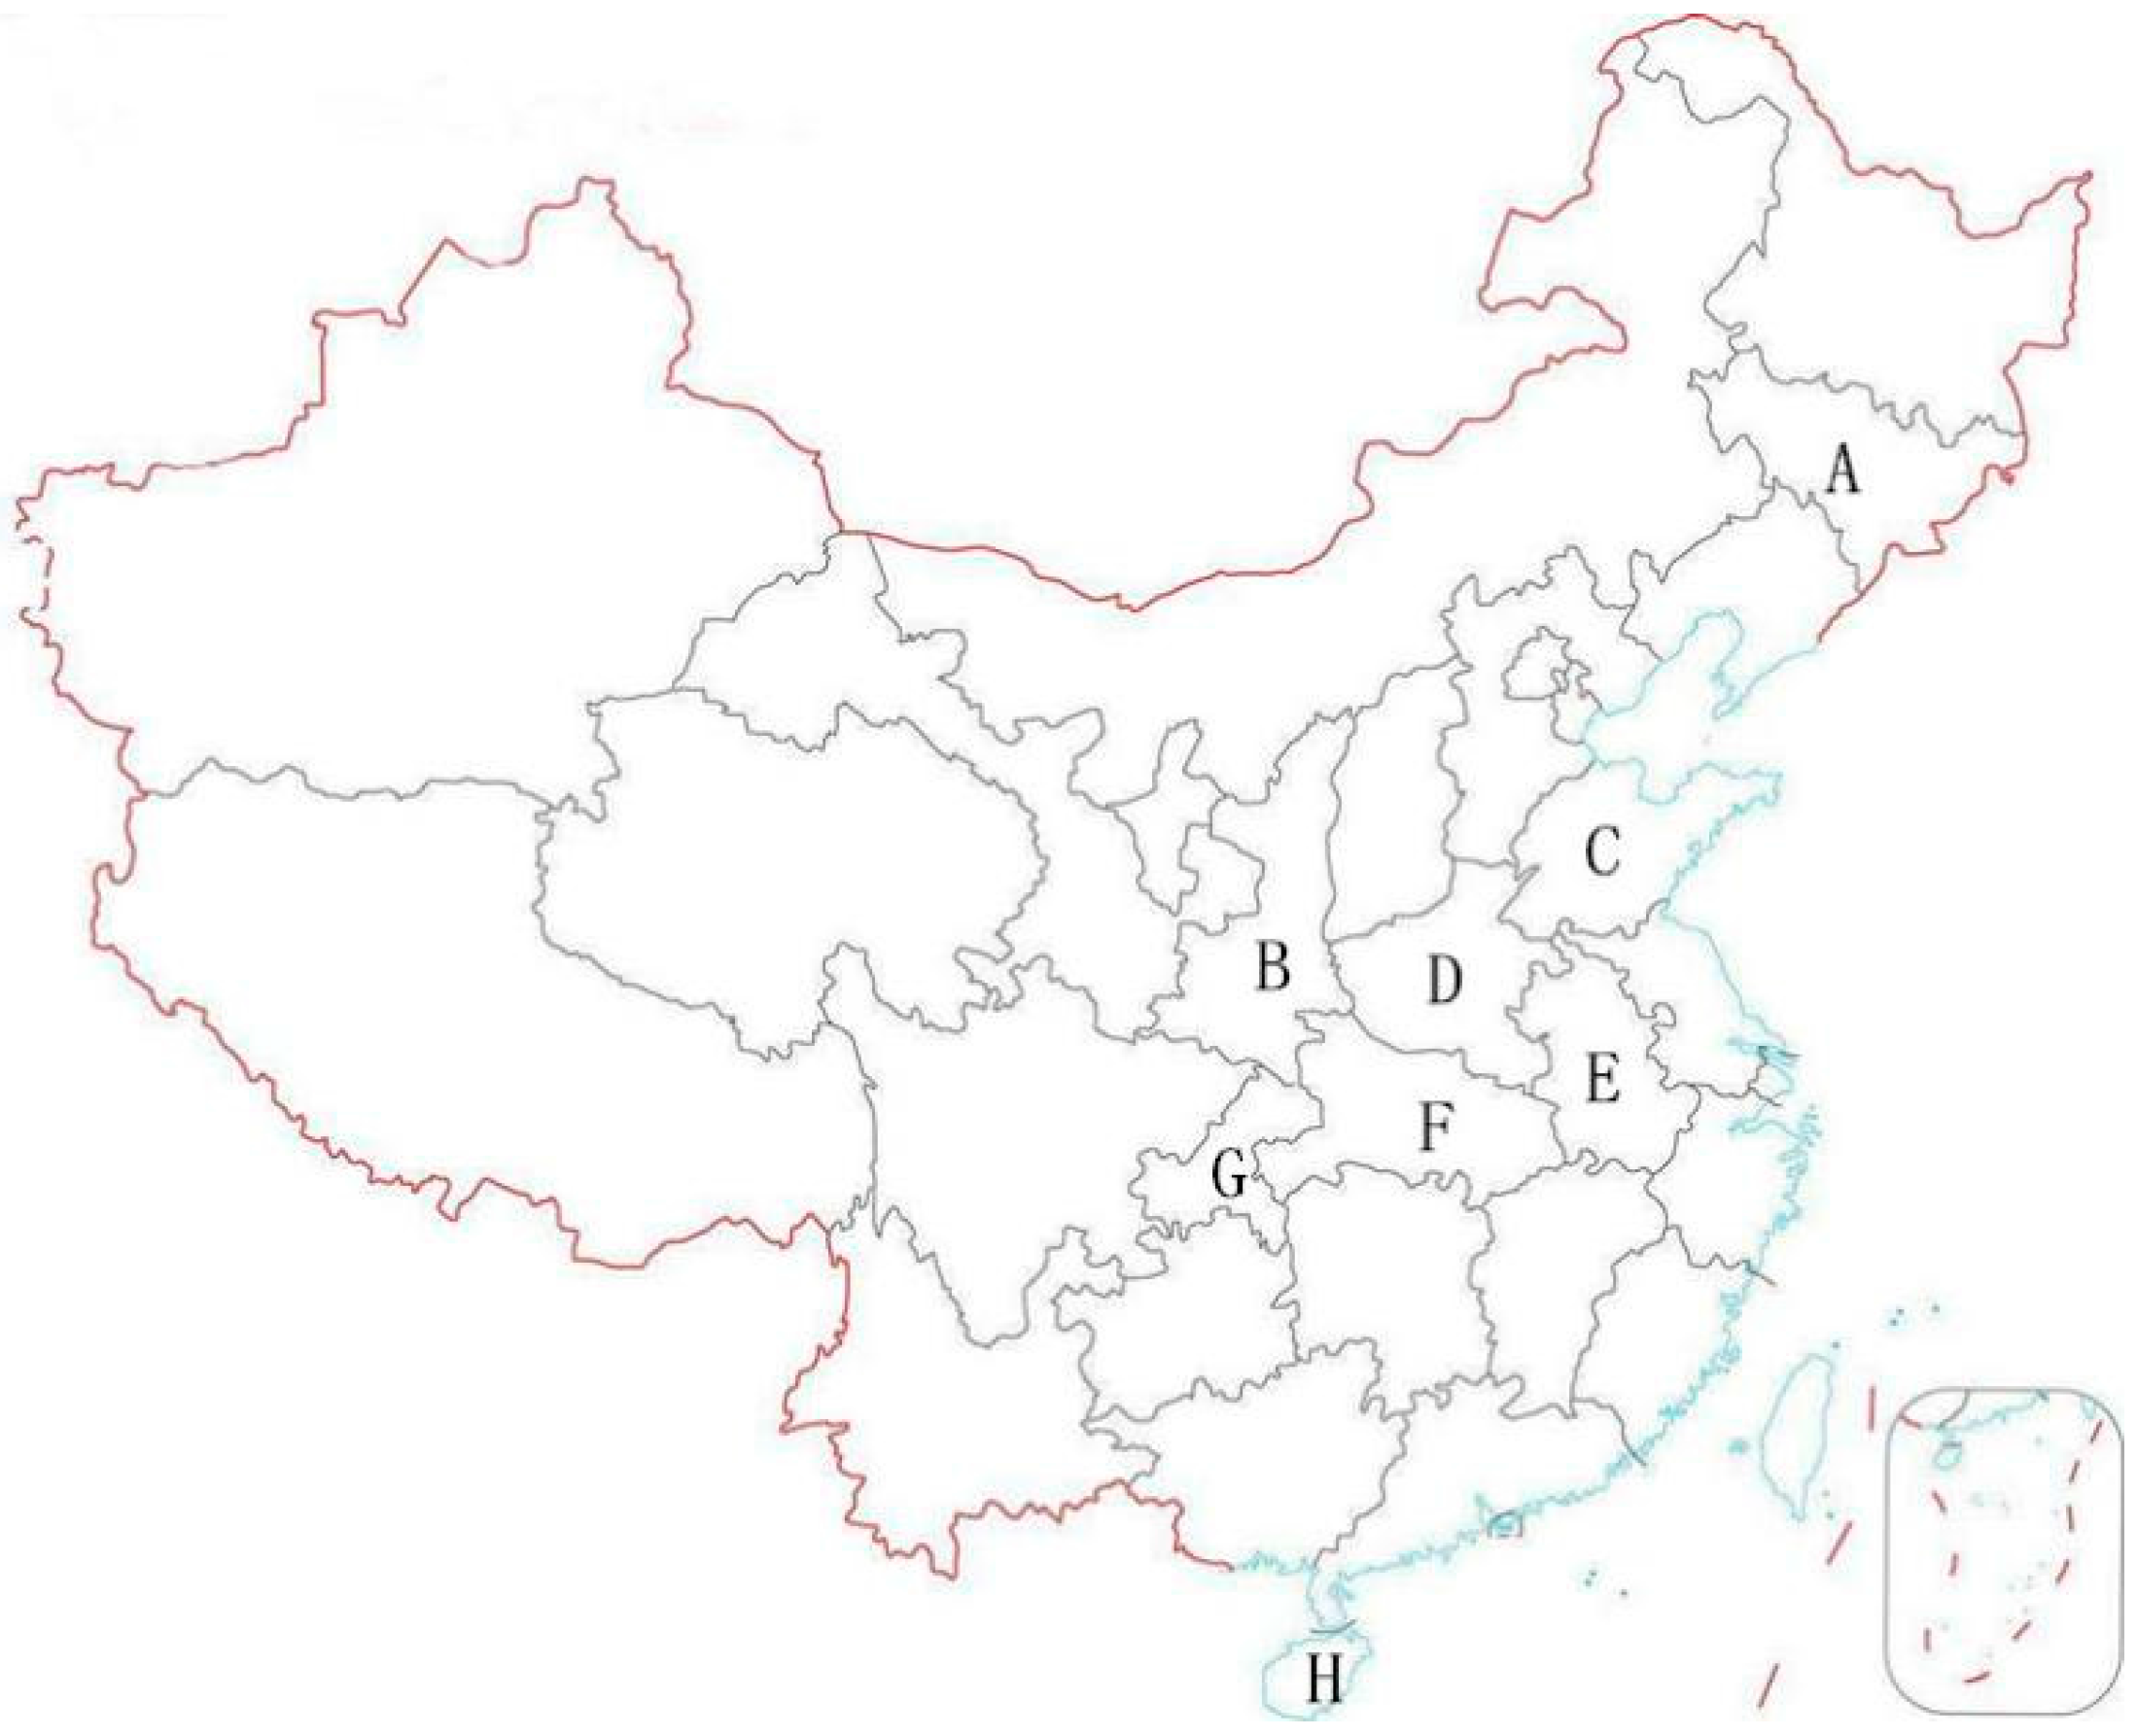
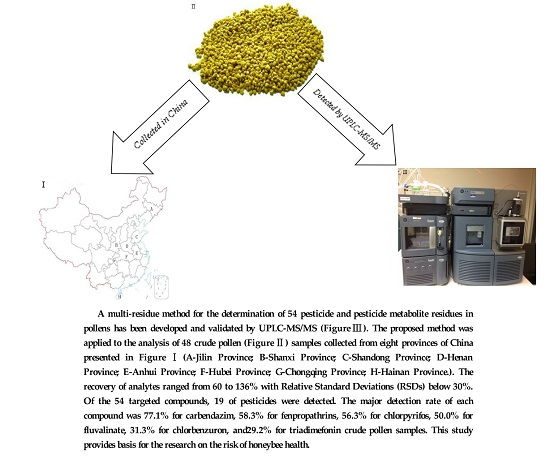
:
1. Introduction
2. Results and Discussion
2.1. Choice of Mobile Phase
2.2. Validation of the Dispersive Solid-Phase Extraction (dSPE) Clean-Up
2.3. Limits of Detection and Quantification
2.4. Linearity
2.5. Matrix Effects
2.6. Recovery Studies
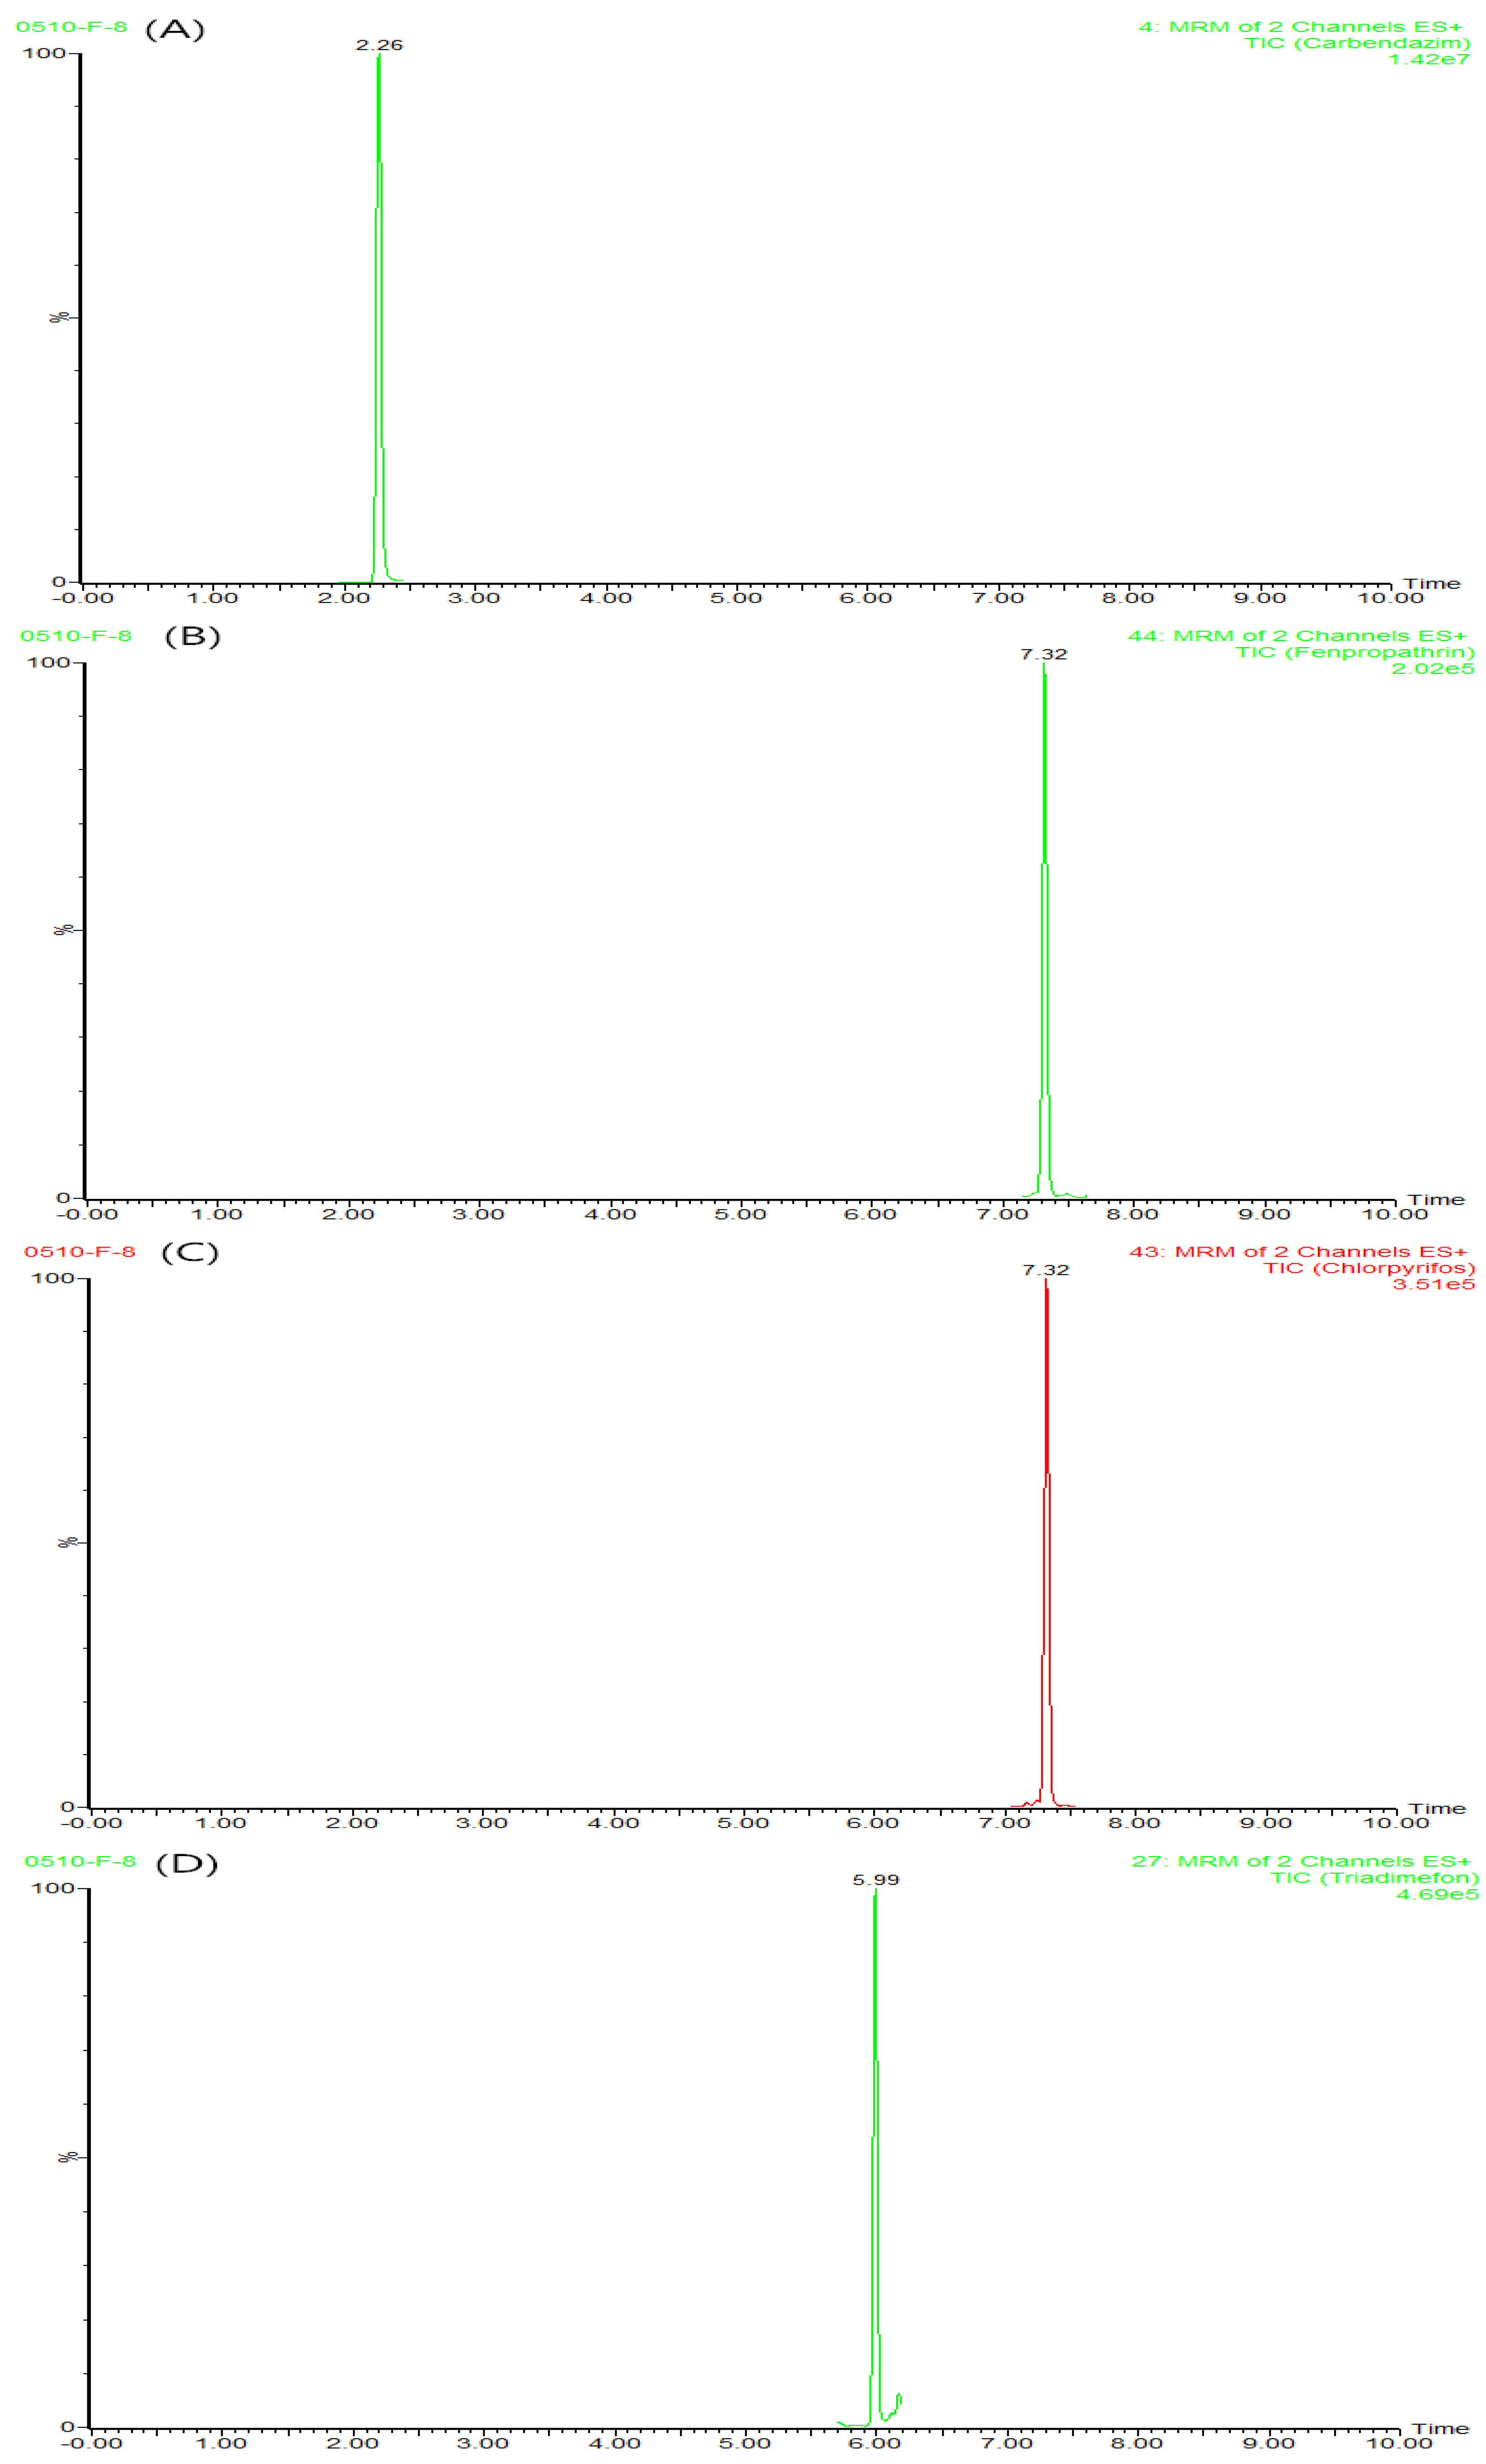
2.7. Real Sample
3. Experimental Section
3.1. Chemicals and Standards
3.2. Sample Preparation
3.3. UPLC-MS/MS Analysis
3.4. Sample Collection
4. Conclusions
Acknowledgments
Author Contributions
Conflicts of Interest
References
- Farooqui, T. A potential link among biogenic amines-based pesticides, learning and memory, and colony collapse disorder: A unique hypothesis. Neurochem. Int. 2013, 62, 122–136. [Google Scholar] [CrossRef] [PubMed]
- Tan, K.; Chen, W.; Dong, S.; Liu, X.; Wang, Y.; Nieh, J.C. A neonicotinoid impairs olfactory learning in Asian honey bees (Apis cerana) exposed as larvae or as adults. Sci. Rep. 2015, 5, 10989. [Google Scholar] [CrossRef] [PubMed]
- Hladik, M.L.; Vandever, M.; Smalling, K.L. Exposure of native bees foraging in an agricultural landscape to current-use pesticides. Sci. Total Environ. 2016, 542 Pt A, 469–477. [Google Scholar] [CrossRef] [PubMed]
- Kiljanek, T.; Niewiadowska, A.; Semeniuk, S.; Gawel, M.; Borzecka, M.; Posyniak, A. Multi-residue method for the determination of pesticides and pesticide metabolites in honeybees by liquid and gas chromatography coupled with tandem mass spectrometry—Honeybee poisoning incidents. J. Chromatogr. A 2016, 1435, 100–114. [Google Scholar] [CrossRef] [PubMed]
- Schmuck, R.; Schöning, R.; Stork, A.; Schramel, O. Risk posed to honeybees (Apis mellifera L, Hymenoptera) by an imidacloprid seed dressing of sunflowers. Pest Manag. Sci. 2001, 57, 225–238. [Google Scholar] [CrossRef] [PubMed]
- Swinton, S.M.; Lupi, F.; Robertson, G.P.; Hamilton, S.K. Ecosystem services and agriculture: Cultivating agricultural ecosystems for diverse benefits. Ecol. Econ. 2007, 64, 245–252. [Google Scholar] [CrossRef]
- Stokstad, E. Agriculture. Field research on bees raises concern about low-dose pesticides. Science 2012, 335, 1555. [Google Scholar] [PubMed]
- Yu, C.; Lin, R.; Fu, M.; Zhou, Y.; Zong, F.; Hui, J.; Ning, L.; Piao, X.; Jia, Z.; Liu, Y. Impact of imidacloprid on life-cycle development of Coccinella septempunctata in laboratory microcosms. Ecotoxicol. Environ. Saf. 2014, 110, 168–173. [Google Scholar] [PubMed]
- Tette, P.A.; Guidi, L.R.; Gloria, M.B.; Fernandes, C. Pesticides in honey: A review on chromatographic analytical methods. Talanta 2016, 149, 124–141. [Google Scholar] [PubMed]
- Brittain, C.A.; Vighi, M.; Bommarco, R.; Settele, J.; Potts, S.G. Impacts of a pesticide on pollinator species richness at different spatial scales. Basic Appl. Ecol. 2010, 11, 106–115. [Google Scholar] [CrossRef]
- Bryden, J.; Gill, R.J.; Mitton, R.A.A.; Raine, N.E.; Jansen, V.A.A. Chronic sublethal stress causes bee colony failure. Ecol. Lett. 2013, 16, 1463–1469. [Google Scholar] [CrossRef] [PubMed]
- Cressey, D. Europe debates risk to bees. Nature 2013, 496, 408. [Google Scholar] [CrossRef] [PubMed]
- Ciarlo, T.J.; Mullin, C.A.; Frazier, J.L.; Schmehl, D.R. Learning impairment in honey bees caused by agricultural spray adjuvants. PLoS ONE 2012, 7, e40848. [Google Scholar] [CrossRef] [PubMed]
- Chen, M.; Collins, E.M.; Tao, L.; Lu, C. Simultaneous determination of residues in pollen and high-fructose corn syrup from eight neonicotinoid insecticides by liquid chromatography-tandem mass spectrometry. Anal. Bioanal. Chem. 2013, 405, 9251–9264. [Google Scholar] [CrossRef] [PubMed]
- Garcia-Chao, M.; Agruna, M.J.; Calvete, G.F.; Sakkas, V.; Llompart, M.; Dagnac, T. Validation of an off line solid phase extraction liquid chromatography-tandem mass spectrometry method for the determination of systemic insecticide residues in honey and pollen samples collected in apiaries from NW Spain. Anal. Chim. Acta 2010, 672, 107–113. [Google Scholar] [CrossRef] [PubMed]
- Kamel, A. Refined methodology for the determination of neonicotinoid pesticides and their metabolites in honey bees and bee products by liquid chromatography-tandem mass spectrometry (LC-MS/MS). J. Agric. Food Chem. 2010, 58, 5926–5931. [Google Scholar] [CrossRef] [PubMed]
- Kasiotis, K.M.; Anagnostopoulos, C.; Anastasiadou, P.; Machera, K. Pesticide residues in honeybees, honey and bee pollen by LC-MS/MS screening: Reported death incidents in honeybees. Sci. Total Environ. 2014, 485–486, 633–642. [Google Scholar] [CrossRef] [PubMed]
- Li, Y.; Kelley, R.A.; Anderson, T.D.; Lydy, M.J. Development and comparison of two multi-residue methods for the analysis of select pesticides in honey bees, pollen, and wax by gas chromatography-quadrupole mass spectrometry. Talanta 2015, 140, 81–87. [Google Scholar] [CrossRef] [PubMed]
- Vazquez, P.P.; Lozano, A.; Ucles, S.; Ramos, M.M.; Fernandez-Alba, A.R. A sensitive and efficient method for routine pesticide multiresidue analysis in bee pollen samples using gas and liquid chromatography coupled to tandem mass spectrometry. J. Chromatogr. A 2015, 1426, 161–173. [Google Scholar] [CrossRef] [PubMed]
- Wiest, L.; Bulete, A.; Giroud, B.; Fratta, C.; Amic, S.; Lambert, O.; Pouliquen, H.; Arnaudguilhem, C. Multi-residue analysis of 80 environmental contaminants in honeys, honeybees and pollens by one extraction procedure followed by liquid and gas chromatography coupled with mass spectrometric detection. J. Chromatogr. A 2011, 1218, 5743–5756. [Google Scholar] [CrossRef] [PubMed]
- Leandro, C.C.; Bishop, D.A.; Fussell, R.J.; Smith, F.D.; Keely, B.J. Semiautomated determination of pesticides in water using solid phase extraction disks and gas chromatography-mass spectrometry. J. Agric. Food Chem. 2006, 54, 645–649. [Google Scholar] [CrossRef] [PubMed]
- Mullin, C.A.; Frazier, M.; Frazier, J.L.; Ashcraft, S.; Simonds, R.; Vanengelsdorp, D.; Pettis, J.S. High levels of miticides and agrochemicals in North American apiaries: Implications for honey bee health. PLoS ONE 2010, 5, e9754. [Google Scholar] [CrossRef] [PubMed]
- Hajšlová, J.; Zrostlı́ková, J. Matrix effects in (ultra)trace analysis of pesticide residues in food and biotic matrices. J. Chromatogr. A 2003, 1000, 181–197. [Google Scholar] [CrossRef]
- Kruve, A.; Kunnapas, A.; Herodes, K.; Leito, I. Matrix effects in pesticide multi-residue analysis by liquid chromatography-mass spectrometry. J. Chromatogr. A 2008, 1187, 58–66. [Google Scholar] [CrossRef] [PubMed]
- Niessen, W.M.; Manini, P.; Andreoli, R. Matrix effects in quantitative pesticide analysis using liquid chromatography-mass spectrometry. Mass Spectrom. Rev. 2006, 25, 881–899. [Google Scholar] [CrossRef] [PubMed]
- Hatjina, F.; Papaefthimiou, C.; Charistos, L.; Dogaroglu, T.; Bouga, M.; Emmanouil, C.; Arnold, G. Sublethal doses of imidacloprid decreased size of hypopharyngeal glands and respiratory rhythm of honeybees in vivo. Apidologie 2013, 44, 467–480. [Google Scholar] [CrossRef]
- Gonalons, C.M.; Farina, W.M. Effects of Sublethal Doses of Imidacloprid on Young Adult Honeybee Behaviour. PLoS ONE 2015, 10, e0140814. [Google Scholar]
- Zhang, E.; Nieh, J.C. The neonicotinoid imidacloprid impairs honey bee aversive learning of simulated predation. J. Exp. Biol. 2015, 218, 3199–3205. [Google Scholar] [CrossRef] [PubMed]
- Frost, E.H.; Shutler, D.; Hillier, N.K. Effects of fluvalinate on honey bee learning, memory, responsiveness to sucrose, and survival. J. Exp. Biol. 2013, 216 Pt 15, 2931–2938. [Google Scholar] [CrossRef] [PubMed]
- David, A.; Botias, C.; Abdul-Sada, A.; Nicholls, E.; Rotheray, E.L.; Hill, E.M.; Goulson, D. Widespread contamination of wildflower and bee-collected pollen with complex mixtures of neonicotinoids and fungicides commonly applied to crops. Environ. Int. 2016, 88, 169–178. [Google Scholar] [CrossRef] [PubMed]
- Renzi, M.T.; Amichot, M.; Pauron, D.; Tchamitchian, S.; Brunet, J.L.; Kretzschmar, A.; Maini, S.; Belzunces, L.P. Chronic toxicity and physiological changes induced in the honey bee by the exposure to fipronil and Bacillus thuringiensis spores alone or combined. Ecotoxicol. Environ. Saf. 2016, 127, 205–213. [Google Scholar] [CrossRef] [PubMed]
- Berenbaum, M.R.; Johnson, R.M. Xenobiotic detoxification pathways in honey bees. Curr. Opin. Insect Sci. 2015, 10, 51–58. [Google Scholar] [CrossRef]
- Thompson, H.M.; Fryday, S.L.; Harkin, S.; Milner, S. Potential impacts of synergism in honeybees (Apis mellifera) of exposure to neonicotinoids and sprayed fungicides in crops. Apidologie 2014, 45, 545–553. [Google Scholar] [CrossRef]
- González-Curbelo, M.Á.; Socas-Rodríguez, B.; Herrera-Herrera, A.V.; González-Sálamo, J.; Hernández-Borges, J.; Rodríguez-Delgado, M.Á. Evolution and applications of the QuEChERS method. TrAC Trends Anal. Chem. 2015, 71, 169–185. [Google Scholar] [CrossRef]
- Barganska, Z.; Slebioda, M.; Namiesnik, J. Determination of pesticide residues in honeybees using modified QUEChERS sample work-up and liquid chromatography-tandem mass spectrometry. Molecules 2014, 19, 2911–2924. [Google Scholar] [CrossRef] [PubMed]
- Fidente, P.; Seccia, S.; Vanni, F.; Morrica, P. Analysis of nicotinoid insecticides residues in honey by solid matrix partition clean-up and liquid chromatography-electrospray mass spectrometry. J. Chromatogr. A 2005, 1094, 175–178. [Google Scholar] [CrossRef] [PubMed]
- Wang, J.; Chow, W.; Chang, J.; Wong, J.W. Ultrahigh-performance liquid chromatography electrospray ionization Q-Orbitrap mass spectrometry for the analysis of 451 pesticide residues in fruits and vegetables: Method development and validation. J. Agric. Food Chem. 2014, 62, 10375–10391. [Google Scholar] [CrossRef] [PubMed]
- Walorczyk, S.; Gnusowski, B. Development and validation of a multi-residue method for the determination of pesticides in honeybees using acetonitrile-based extraction and gas chromatography-tandem quadrupole mass spectrometry. J. Chromatogr. A 2009, 1216, 6522–6531. [Google Scholar] [CrossRef] [PubMed]
- Sample Availability: Samples of the compounds are available from the authors.


| Type | Mobile Phase A | Mobile Phase B |
|---|---|---|
| I | water/methanol (98:2) + 0.05% formic acid | methanol + 0.05% formic acid |
| II | 0.1% formic acid | methanol |
| III | 0.1% formic acid | acetonitrile |
| IV | 0.05% formic acid + 5 mmol/L ammonium acetate | methanol |
| V | 0.05% formic acid + 5 mmol/L ammonium acetate | acetonitrile |
| Level | PSA | C18 | GCB | MgSO4 |
|---|---|---|---|---|
| A | 50 mg | 50 mg | 0 mg | 150 mg |
| B | 50 mg | 50 mg | 3.75 mg | 150 mg |
| C | 50 mg | 50 mg | 7.5 mg | 150 mg |
| D | 50 mg | 50 mg | 15 mg | 150 mg |
| Compound | LOD (ng/g) | LOQ (ng/g) | Recovery (%) | RSD (%) | ||||
|---|---|---|---|---|---|---|---|---|
| Low (ng/g) | Medium (ng/g) | High (ng/g) | Low (ng/g) | Medium (ng/g) | High (ng/g) | |||
| Methamidophos | 0.0556 | 0.1667 | 103 | 85.1 | 89.1 | 5.95 | 1.96 | 1.70 |
| Acephate | 0.2691 | 0.8072 | 123 | 87.7 | 91.2 | 12.5 | 1.39 | 1.52 |
| Omethoate | 0.1383 | 0.4149 | 112 | 89.6 | 93.5 | 3.75 | 1.79 | 1.93 |
| Aldicarb-sulfoxide | 0.5291 | 1.5873 | 120 | 93.3 | 97.5 | 3.33 | 3.01 | 2.02 |
| Aldicarb-sulfone | 0.1343 | 0.4030 | 108 | 98.4 | 98.1 | 3.70 | 0.81 | 2.05 |
| Carbendazim | 0.1064 | 0.3191 | 109 | 93.3 | 93.1 | 8.45 | 5.51 | 2.63 |
| Methomyl | 0.0337 | 0.1010 | 111 | 89.3 | 96.5 | 5.52 | 4.23 | 1.33 |
| Thiamethoxam | 0.0028 | 0.0084 | 125 | 103 | 101 | 4.63 | 1.78 | 0.71 |
| Monocrotophos | 0.0051 | 0.0154 | 112 | 90.9 | 96.9 | 3.57 | 2.21 | 2.68 |
| Imidacloprid | 0.0809 | 0.2427 | 92.7 | 85.6 | 96.2 | 8.99 | 1.40 | 3.50 |
| Trichlorfon | 0.1265 | 0.3794 | 121 | 86.9 | 98.0 | 3.81 | 3.72 | 3.67 |
| Dimethoate | 0.0366 | 0.1098 | 105 | 87.2 | 92.4 | 9.56 | 1.83 | 2.84 |
| Carbofuran-3-hydroxy | 0.0344 | 0.1032 | 94.7 | 90.1 | 99.3 | 6.45 | 1.85 | 2.03 |
| Acetamiprid | 0.0114 | 0.0343 | 103 | 86.9 | 97.7 | 5.95 | 1.41 | 2.25 |
| Aldicarb | 0.0432 | 0.1295 | 93.3 | 86.1 | 98.7 | 6.55 | 4.58 | 1.30 |
| Phosphamidon | 0.0037 | 0.0112 | 117 | 86.9 | 95.5 | 3.94 | 2.13 | 2.56 |
| Dichlorvos | 0.2483 | 0.7450 | 65.3 | 69.7 | 78.4 | 8.66 | 7.26 | 13.60 |
| Carbofuran | 0.0060 | 0.0179 | 88.0 | 87.5 | 95.6 | 4.55 | 4.32 | 1.26 |
| Fenthion-sulfoxide | 0.0202 | 0.0605 | 104 | 89.3 | 96.4 | 3.85 | 1.03 | 1.66 |
| Carbaryl | 0.1087 | 0.3261 | 86.7 | 89.1 | 98.1 | 5.33 | 2.89 | 1.25 |
| Fenthion-sulfone | 0.0369 | 0.1108 | 88.0 | 86.4 | 98.1 | 4.55 | 0.93 | 1.93 |
| Pyrimethanil | 0.0145 | 0.0435 | nd | 82.1 | 89.9 | - | 1.12 | 1.36 |
| Phorate-sulfoxide | 0.0244 | 0.0731 | 112 | 90.9 | 96.5 | 7.14 | 2.54 | 2.09 |
| Phorate-sulfone | 0.0241 | 0.0722 | 98.7 | 86.1 | 94.9 | 2.34 | 3.52 | 0.64 |
| Methidathion | 0.0095 | 0.0286 | 96.0 | 88.4 | 100 | 8.33 | 4.32 | 1.20 |
| Phosmet | 0.0343 | 0.1029 | 94.7 | 85.3 | 90.8 | 2.44 | 3.55 | 10.42 |
| Terbufos-sulfone | 0.0759 | 0.2277 | 112 | 93.6 | 98.0 | 6.19 | 3.08 | 2.45 |
| Terbufos-sulfoxide | 0.0243 | 0.0729 | 109 | 89.9 | 94.5 | 2.11 | 0.51 | 0.65 |
| Azoxystrobin | 0.0062 | 0.0186 | 131 | 91.7 | 97.1 | 9.35 | 2.66 | 1.90 |
| Malathion | 0.0610 | 0.1829 | 101 | 85.0 | 98.5 | 2.28 | 1.44 | 2.00 |
| Triadimefon | 0.0029 | 0.0088 | 133 | 89.6 | 91.2 | 3.46 | 1.79 | 1.52 |
| Dimethomorph | 0.0049 | 0.0147 | 70.7 | 85.3 | 93.6 | 6.54 | 0.54 | 1.48 |
| Triazophos | 0.0082 | 0.0246 | 112 | 93.3 | 101 | 7.14 | 6.49 | 1.82 |
| Ethoprophos | 0.0177 | 0.0530 | 90.7 | 83.5 | 95.3 | 9.18 | 3.08 | 3.81 |
| Iprodione | 0.0611 | 0.1833 | 90.0 | 85.5 | 91.4 | 13.6 | 8.66 | 3.83 |
| Diflubenzuron | 0.0045 | 0.0136 | 81.3 | 81.9 | 92.5 | 11.4 | 5.38 | 1.75 |
| Procholraz | 0.0166 | 0.0499 | 120 | 96.3 | 93.7 | 2.03 | 6.45 | 2.71 |
| Sulfotep | 0.0195 | 0.0585 | 89.3 | 87.2 | 93.9 | 5.17 | 2.43 | 4.94 |
| Chlorbenzuron | 0.0226 | 0.0678 | 68.0 | 89.9 | 92.3 | 30.6 | 6.06 | 1.52 |
| Fenthion | 0.0514 | 0.1542 | 86.7 | 91.7 | 88.3 | 13.3 | 2.19 | 0.94 |
| Coumaphos | 0.0030 | 0.0090 | 88.0 | 103 | 100 | 9.09 | 7.10 | 4.39 |
| Diazinon | 0.0176 | 0.0529 | 101 | 86.4 | 90.7 | 4.56 | 3.21 | 2.70 |
| Phoxim | 0.0135 | 0.0406 | 92.0 | 83.7 | 95.3 | 4.35 | 9.18 | 3.57 |
| Phorate | 0.0154 | 0.0462 | 72.0 | 78.7 | 85.6 | 9.62 | 0.59 | 3.99 |
| Phosalone | 0.0158 | 0.0475 | 97.3 | 86.7 | 95.6 | 8.55 | 3.24 | 3.16 |
| Difenoconazole | 0.0242 | 0.0726 | 104 | 85.9 | 84.4 | 3.85 | 2.34 | 4.52 |
| Emamectin benzoate | 0.0008 | 0.0025 | 85.3 | 81.1 | 76.5 | 7.16 | 1.14 | 1.09 |
| Profenofos | 0.0189 | 0.0568 | 127 | 92.8 | 84.8 | 4.82 | 8.31 | 1.89 |
| Terbufos | 0.1414 | 0.4241 | 97.3 | 77.1 | 86.4 | 8.55 | 5.12 | 1.85 |
| Chlorpyrifos | 0.0638 | 0.1914 | 103 | 74.7 | 81.9 | 12.5 | 3.76 | 2.78 |
| Fenpropathrin | 0.0433 | 0.1300 | 92.0 | 75.5 | 80.0 | 7.53 | 1.62 | 4.77 |
| Pendimethalin | 0.0236 | 0.0708 | 85.3 | 82.4 | 90.1 | 7.16 | 2.57 | 1.56 |
| Pyridaben | 0.0070 | 0.0211 | 136 | 85.3 | 84.8 | 5.88 | 1.08 | 1.89 |
| Fluvalinate | 0.0068 | 0.0203 | 98.7 | 76.8 | 66.0 | 1.17 | 9.16 | 2.12 |
| Compound | ME (%) | tR (min) | Linear Range (ng/g) | Linear Regression Equation | Linearity |
|---|---|---|---|---|---|
| Methamidophos | −6 | 1.17 | 5–200 | Y = 140.5X + 99.14 | 0.9984 |
| Acephate | 0 | 1.50 | 5–200 | Y = 61.56X − 69.02 | 0.9990 |
| Omethoate | −21 | 1.74 | 5–200 | Y = 266.0X + 94.55 | 0.9963 |
| Aldicarb-sulfoxide | −5 | 1.92 | 5–200 | Y = 38.60X + 39.18 | 0.9954 |
| Aldicarb-sulfone | −10 | 2.10 | 5–200 | Y = 112.0X + 38.23 | 0.9994 |
| Carbendazim | −10 | 2.26 | 2.5–100 | Y = 941.6X + 11.03 | 0.9993 |
| Methomyl | 3 | 2.38 | 5–200 | Y = 98.08X − 28.38 | 0.9997 |
| Thiamethoxam | −24 | 2.54 | 10–400 | Y = 66.00X + 134.2 | 0.9975 |
| Monocrotophos | −20 | 2.67 | 5–200 | Y = 1022X + 889.6 | 0.9967 |
| Imidacloprid | −13 | 3.04 | 10–400 | Y = 71.91X − 48.57 | 0.9996 |
| Trichlorfon | −80 | 3.26 | 5–200 | Y = 138.7X + 12.85 | 0.9991 |
| Dimethoate | −76 | 3.29 | 5–200 | Y = 154.1X + 79.95 | 0.9986 |
| Carbofuran-3-hydroxy | −80 | 3.35 | 5–200 | Y = 179.0X + 101.9 | 0.9991 |
| Acetamiprid | −50 | 3.37 | 5–200 | Y = 645.1X + 279.1 | 0.9986 |
| Aldicarb | −24 | 3.97 | 5–200 | Y = 578.5X + 620.2 | 0.9954 |
| Phosphamidon | 15 | 4.33 | 2.5–100 | Y = 207.4X − 73.14 | 0.9996 |
| Dichlorvos | −1 | 4.48 | 5–200 | Y = 232.7X − 24.55 | 0.9998 |
| Carbofuran | −38 | 4.58 | 5–200 | Y = 854.1X − 164.8 | 0.9995 |
| Fenthion-sulfoxide | −51 | 4.76 | 5–200 | Y = 780.0X + 66.08 | 0.9999 |
| Carbaryl | −30 | 4.80 | 5–200 | Y = 139.9X + 21.77 | 0.9985 |
| Fenthion-sulfone | −15 | 4.91 | 5–200 | Y = 165.1X − 26.61 | 0.9991 |
| Pyrimethanil | −25 | 5.03 | 2.5–100 | Y = 1810X − 63.22 | 0.9999 |
| Phorate-sulfoxide | −27 | 5.05 | 5–200 | Y = 938.3X + 576.2 | 0.9990 |
| Phorate-sulfone | −24 | 5.14 | 5–200 | Y = 302.9X − 5.827 | 0.9998 |
| Methidathion | −4 | 5.39 | 5–200 | Y = 93.08X + 9.293 | 0.9998 |
| Phosmet | −50 | 5.52 | 5–200 | Y = 106.4X + 64.63 | 0.9976 |
| Terbufos-sulfone | 16 | 5.62 | 5–200 | Y = 96.91X − 66.94 | 0.9975 |
| Terbufos-sulfoxide | 20 | 5.64 | 5–200 | Y = 192.5X − 80.41 | 0.9983 |
| Azoxystrobin | 25 | 5.67 | 2.5–100 | Y = 363.1X + 48.65 | 0.9990 |
| Malathion | 13 | 5.89 | 5–200 | Y = 151.5X − 111.6 | 0.9952 |
| Triadimefon | 15 | 5.99 | 2.5–100 | Y = 310.0X − 135.0 | 0.9955 |
| Dimethomorph | −20 | 6.01 | 5–200 | Y = 168.5X − 169.4 | 0.9903 |
| Triazophos | 16 | 6.05 | 2.5–100 | Y = 747.9X + 45.03 | 0.9995 |
| Ethoprophos | −1 | 6.19 | 5–200 | Y = 305.2X − 87.03 | 0.9992 |
| Iprodione | −46 | 6.33 | 10–400 | Y = 55.78X − 106.2 | 0.9952 |
| Diflubenzuron | −6 | 6.34 | 5–200 | Y = 86.59X − 52.92 | 0.9941 |
| Prochloraz | −27 | 6.44 | 5–200 | Y = 587.4X − 606.3 | 0.9902 |
| Sulfotep | −33 | 6.44 | 5–200 | Y = 1144X − 1042 | 0.9955 |
| Chlorbenzuron | −27 | 6.48 | 5–200 | Y = 89.28X − 107.6 | 0.9940 |
| Fenthion | −66 | 6.51 | 5–200 | Y = 101.6X − 19.60 | 0.9983 |
| Coumaphos | −35 | 6.54 | 5–200 | Y = 63.55X − 95.86 | 0.9914 |
| Diazinon | 9 | 6.55 | 2.5–100 | Y = 1220X − 596.6 | 0.9907 |
| Phoxim | −20 | 6.63 | 5–200 | Y = 49.86X + 5.412 | 0.9969 |
| Phorate | −12 | 6.67 | 5–200 | Y = 33.04X − 65.92 | 0.9996 |
| Phosalone | −26 | 6.69 | 5–200 | Y = 49.75X − 34.82 | 0.9944 |
| Difenoconazole | −10 | 6.84 | 5–200 | Y = 520.7X − 417.0 | 0.9949 |
| Emamectin benzoate | −12 | 6.83 | 5–200 | Y = 1177X − 804.8 | 0.9931 |
| Profenofos | −25 | 7.05 | 5–200 | Y = 182.7X − 171.3 | 0.9935 |
| Terbufos | −34 | 7.10 | 5–200 | Y = 83.82X − 1.636 | 0.9989 |
| Chlorpyrifos | −44 | 7.32 | 5–200 | Y = 327.6X + 67.46 | 0.9995 |
| Fenpropathrin | −46 | 7.32 | 5–200 | Y = 407.6X + 67.03 | 0.9999 |
| Pendimethalin | −26 | 7.34 | 5–200 | Y = 230.1X − 83.93 | 0.9987 |
| Pyridaben | −73 | 7.67 | 5–200 | Y = 1811X − 172.8 | 0.9984 |
| Fluvalinate | −77 | 7.74 | 10–400 | Y = 472.3X + 334.3 | 0.9997 |
| Compound | Positive Sample | Total Number of Sample | Detection Rate (%) | Detected Concentration Ranges (ng/g) | Max Value (ng/g) | Central Values (ng/g) |
|---|---|---|---|---|---|---|
| carbendazim | 37 | 48 | 77.1 | 3.200–4516 | 4516 | 44.00 |
| fenpropathrin | 28 | 48 | 58.3 | 5.000–162.8 | 162.8 | 21.70 |
| chlorpyrifos | 27 | 48 | 56.3 | 5.000–176.6 | 176.6 | 23.60 |
| fluvalinate | 27 | 48 | 50.0 | 6.600–316.2 | 316.2 | 33.00 |
| chlorbenzuron | 15 | 48 | 31.3 | 5.000–437.2 | 437.2 | 27.00 |
| triadimefon | 14 | 48 | 29.2 | 2.600–79.00 | 79.00 | 19.70 |
| acetamiprid | 8 | 48 | 1.7 | 5.200–63.60 | 63.60 | 8.300 |
| imidacloprid | 7 | 48 | 1.5 | 17.60–49.80 | 49.80 | 27.60 |
| Compound | Transitions | Dwell Time (s) | Cone Voltage (V) | Collision Energy (eV) |
|---|---|---|---|---|
| Methamidophos | Quantification ion 142 > 93.9 | 0.050 | 17 | 13 |
| Confirmation ion 142 > 124.9 | 17 | 13 | ||
| Acephate | Quantification ion 184.1 > 143 | 0.036 | 8 | 8 |
| Confirmation ion 184.1 > 125.1 | 8 | 18 | ||
| Omethoate | Quantification ion 214.1 > 125.1 | 0.028 | 16 | 22 |
| Confirmation ion 214.1 > 183.1 | 16 | 11 | ||
| Aldicarb sulfoxide | Quantification ion 207 > 89 | 0.028 | 13 | 14 |
| Confirmation ion 207 > 132 | 13 | 10 | ||
| Aldicarb sulfone | Quantification ion 223 > 86 | 0.028 | 22 | 14 |
| Confirmation ion 223 > 148 | 22 | 10 | ||
| Carbendazim | Quantification ion 192.1 > 160.1 | 0.028 | 24 | 18 |
| Confirmation ion 192.1 > 132.1 | 24 | 28 | ||
| Methomyl | Quantification ion 163 > 88 | 0.028 | 17 | 10 |
| Confirmation ion 163 > 106 | 17 | 10 | ||
| Thiamethoxam | Quantification ion 292.1 > 210.9 | 0.044 | 18 | 12 |
| Confirmation ion 292.1 > 181 | 18 | 24 | ||
| Monocrotophos | Quantification ion 224.1 > 127.1 | 0.044 | 15 | 16 |
| Confirmation ion 224.1 > 98.1 | 15 | 12 | ||
| Imidacloprid | Quantification ion 256.1 > 209.1 | 0.028 | 23 | 15 |
| Confirmation ion 256.1 > 175.1 | 23 | 20 | ||
| Trichlorfon | Quantification ion 257 > 109 | 0.028 | 22 | 18 |
| Confirmation ion 257 > 79 | 22 | 30 | ||
| Dimethoate | Quantification ion 230.1 > 199 | 0.028 | 12 | 10 |
| Confirmation ion 230.1 > 125 | 12 | 20 | ||
| Carbofuran-3-hydroxy | Quantification ion 238 > 163 | 0.028 | 25 | 16 |
| Confirmation ion 238 > 181 | 25 | 10 | ||
| Acetamiprid | Quantification ion 223 > 126 | 0.028 | 23 | 20 |
| Confirmation ion 223 > 56.1 | 23 | 15 | ||
| Aldicarb | Quantification ion 212.8 > 88.9 | 0.078 | 20 | 16 |
| Confirmation ion 212.8 > 115.9 | 20 | 12 | ||
| Phosphamidon | Quantification ion 300.1 > 174.1 | 0.028 | 17 | 14 |
| Confirmation ion 300.1 > 127.1 | 17 | 25 | ||
| Dichlorvos | Quantification ion 221 > 109 | 0.022 | 23 | 22 |
| Confirmation ion 221 > 79 | 23 | 34 | ||
| Carbofuran | Quantification ion 222.1 > 165.1 | 0.022 | 25 | 16 |
| Confirmation ion 222.1 > 123 | 25 | 16 | ||
| Fenthion-sulfoxide | Quantification ion 295 > 109 | 0.022 | 29 | 32 |
| Confirmation ion 295 > 280 | 29 | 18 | ||
| Carbaryl | Quantification ion 202 > 145 | 0.022 | 19 | 22 |
| Confirmation ion 202 > 117 | 19 | 28 | ||
| Fenthion-sulfone | Quantification ion 311 > 125 | 0.022 | 29 | 22 |
| Confirmation ion 311 > 109 | 29 | 28 | ||
| Pyrimethanil | Quantification ion 200.2 > 107 | 0.022 | 42 | 24 |
| Confirmation ion 200.2 > 82 | 42 | 24 | ||
| Phorate-sulfoxide | Quantification ion 277 > 96.9 | 0.022 | 15 | 32 |
| Confirmation ion 277 > 143 | 15 | 20 | ||
| Phorate-sulfone | Quantification ion 293 > 96.9 | 0.022 | 15 | 30 |
| Confirmation ion 293 > 115 | 15 | 24 | ||
| Methidathion | Quantification ion 303 > 145 | 0.022 | 10 | 10 |
| Confirmation ion 303 > 85.1 | 10 | 20 | ||
| Phosmet | Quantification ion 318 > 160 | 0.018 | 20 | 14 |
| Confirmation ion 340 > 214.1 | 30 | 14 | ||
| Terbufos-sulfone | Quantification ion 321.2 > 171 | 0.018 | 19 | 12 |
| Confirmation ion 321.2 > 97 | 19 | 40 | ||
| Terbufos-sulfoxide | Quantification ion 305 > 187 | 0.018 | 10 | 11 |
| Confirmation ion 305 > 97 | 10 | 40 | ||
| Azoxystrobin | Quantification ion 404 > 372 | 0.017 | 17 | 15 |
| Confirmation ion 404 > 329 | 17 | 30 | ||
| Malathion | Quantification ion 331 > 127 | 0.018 | 18 | 12 |
| Confirmation ion 331 > 79 | 18 | 40 | ||
| Triadimefon | Quantification ion 294.1 > 197.2 | 0.018 | 22 | 15 |
| Confirmation ion 294.1 > 69.3 | 22 | 20 | ||
| Dimethomorph | Quantification ion 388.1 > 300.9 | 0.018 | 30 | 20 |
| Confirmation ion 388.1 > 165 | 30 | 30 | ||
| Triazophos | Quantification ion 314.1 > 161.9 | 0.013 | 22 | 18 |
| Confirmation ion 314.1 > 118.9 | 22 | 35 | ||
| Ethoprophos | Quantification ion 243.2 > 131 | 0.008 | 18 | 20 |
| Confirmation ion 243.2 > 97 | 18 | 31 | ||
| Iprodione | Quantification ion 330 > 244.7 | 0.008 | 12 | 16 |
| Confirmation ion 330 > 288 | 12 | 15 | ||
| Diflubenzuron | Quantification ion 310.9 > 157.9 | 0.008 | 20 | 14 |
| Confirmation ion 310.9 > 140.9 | 20 | 36 | ||
| Procholraz | Quantification ion 376 > 308 | 0.008 | 20 | 15 |
| Confirmation ion 376 > 266 | 20 | 15 | ||
| Sulfotep | Quantification ion 323 > 97 | 0.008 | 17 | 32 |
| Confirmation ion 323 > 171 | 17 | 15 | ||
| Chlorbenzuron | Quantification ion 309 > 155.9 | 0.008 | 22 | 26 |
| Confirmation ion 309 > 138.8 | 22 | 18 | ||
| Fenthion | Quantification ion 279 > 168.9 | 0.008 | 30 | 18 |
| Confirmation ion 279 > 105 | 30 | 28 | ||
| Coumaphos | Quantification ion 363.1 > 307 | 0.008 | 21 | 16 |
| Confirmation ion 363.1 > 289 | 21 | 24 | ||
| Diazinon | Quantification ion 305.1 > 169 | 0.008 | 20 | 22 |
| Confirmation ion 305.1 > 96.9 | 20 | 35 | ||
| Phoxim | Quantification ion 299 > 129 | 0.008 | 12 | 13 |
| Confirmation ion 299 > 153 | 12 | 7 | ||
| Phorate | Quantification ion 261 > 97 | 0.008 | 14 | 28 |
| Confirmation ion 261 > 75 | 14 | 10 | ||
| Phosalone | Quantification ion 367.9 > 181.9 | 0.008 | 12 | 14 |
| Confirmation ion 367.9 > 110.9 | 12 | 42 | ||
| Difenoconazole | Quantification ion 406 > 251.1 | 0.026 | 37 | 25 |
| Confirmation ion 406 > 111.1 | 37 | 60 | ||
| Emamectin benzoate | Quantification ion 886.5 > 158.1 | 0.022 | 20 | 32 |
| Confirmation ion 886.5 > 81.9 | 20 | 64 | ||
| Profenofos | Quantification ion 372.9 > 302.6 | 0.022 | 25 | 20 |
| Confirmation ion 372.9 > 127.9 | 25 | 40 | ||
| Terbufos | Quantification ion 289 > 103 | 0.022 | 12 | 8 |
| Confirmation ion 289 > 57.2 | 12 | 22 | ||
| Chlorpyrifos | Quantification ion 350 > 97 | 0.022 | 27 | 32 |
| Confirmation ion 350 > 198 | 27 | 20 | ||
| Fenpropathrin | Quantification ion 350.1 > 97 | 0.022 | 15 | 34 |
| Confirmation ion 350.1 > 125 | 15 | 14 | ||
| Pendimethalin | Quantification ion 252.2 > 212.2 | 0.022 | 12 | 10 |
| Confirmation ion 252.2 > 194.1 | 12 | 17 | ||
| Pyridaben | Quantification ion 365.1 > 147.1 | 0.022 | 19 | 24 |
| Confirmation ion 365.1 > 309.1 | 19 | 12 | ||
| Fluvalinate | Quantification ion 507 > 181.1 | 0.022 | 15 | 30 |
| Confirmation ion 507 > 208.1 | 15 | 12 |
© 2016 by the authors. Licensee MDPI, Basel, Switzerland. This article is an open access article distributed under the terms and conditions of the Creative Commons Attribution (CC-BY) license ( http://creativecommons.org/licenses/by/4.0/).
Share and Cite
Tong, Z.; Wu, Y.-C.; Liu, Q.-Q.; Shi, Y.-H.; Zhou, L.-J.; Liu, Z.-Y.; Yu, L.-S.; Cao, H.-Q. Multi-Residue Analysis of Pesticide Residues in Crude Pollens by UPLC-MS/MS. Molecules 2016, 21, 1652. https://doi.org/10.3390/molecules21121652
Tong Z, Wu Y-C, Liu Q-Q, Shi Y-H, Zhou L-J, Liu Z-Y, Yu L-S, Cao H-Q. Multi-Residue Analysis of Pesticide Residues in Crude Pollens by UPLC-MS/MS. Molecules. 2016; 21(12):1652. https://doi.org/10.3390/molecules21121652
Chicago/Turabian StyleTong, Zhou, Yan-Can Wu, Qiong-Qiong Liu, Yan-Hong Shi, Li-Jun Zhou, Zhen-Yu Liu, Lin-Sheng Yu, and Hai-Qun Cao. 2016. "Multi-Residue Analysis of Pesticide Residues in Crude Pollens by UPLC-MS/MS" Molecules 21, no. 12: 1652. https://doi.org/10.3390/molecules21121652