Article

Optimization of Microwave-Assisted Extraction Conditions for Five Major Bioactive Compounds from Flos Sophorae Immaturus (Cultivars of Sophora japonica L.) Using Response Surface Methodology

1
Institute of Material Medical Planting, Chongqing Academy of Chinese Materia Medica (Chongqing Engineering Research Center for Fine Variety Breeding Techniques of Chinese Materia Medica, Chongqing Key Laboratory of Chinese Medicine Resources), Chongqing Sub-Center of National Resource Center for Chinese Materia Medica, China Academy of Chinese Medical Science, Chongqing 400065, China
2
College of Agronomy and Biotechnology, Southwest University, Chongqing 400715, China
*
Authors to whom correspondence should be addressed.
Molecules 2016, 21(3), 296; https://doi.org/10.3390/molecules21030296
Submission received: 14 December 2015 / Revised: 22 February 2016 / Accepted: 23 February 2016 / Published: 2 March 2016
(This article belongs to the Collection Bioactive Compounds)

Abstract

:
Microwave-assisted extraction was applied to extract rutin; quercetin; genistein; kaempferol; and isorhamnetin from Flos Sophorae Immaturus. Six independent variables; namely; solvent type; particle size; extraction frequency; liquid-to-solid ratio; microwave power; and extraction time were examined. Response surface methodology using a central composite design was employed to optimize experimental conditions (liquid-to-solid ratio; microwave power; and extraction time) based on the results of single factor tests to extract the five major components in Flos Sophorae Immaturus. Experimental data were fitted to a second-order polynomial equation using multiple regression analysis. Data were also analyzed using appropriate statistical methods. Optimal extraction conditions were as follows: extraction solvent; 100% methanol; particle size; 100 mesh; extraction frequency; 1; liquid-to-solid ratio; 50:1; microwave power; 287 W; and extraction time; 80 s. A rapid and sensitive ultra-high performance liquid chromatography method coupled with electrospray ionization quadrupole time-of-flight tandem mass spectrometry (EIS-Q-TOF MS/MS) was developed and validated for the simultaneous determination of rutin; quercetin; genistein; kaempferol; and isorhamnetin in Flos Sophorae Immaturus. Chromatographic separation was accomplished on a Kinetex C18 column (100 mm × 2.1 mm; 2.6 μm) at 40 °C within 5 min. The mobile phase consisted of 0.1% aqueous formic acid and acetonitrile (71:29; v/v). Isocratic elution was carried out at a flow rate of 0.35 mL/min. The constituents of Flos Sophorae Immaturus were simultaneously identified by EIS-Q-TOF MS/MS in multiple reaction monitoring mode. During quantitative analysis; all of the calibration curves showed good linear relationships (R2 > 0.999) within the tested ranges; and mean recoveries ranged from 96.0216% to 101.0601%. The precision determined through intra- and inter-day studies showed an RSD% of <2.833%. These results demonstrate that the developed method is accurate and effective and could be readily utilized for the comprehensive quality control of Flos Sophorae Immaturus.

1. Introduction

Sophora japonica L. is used in Traditional Chinese Materia Medica (TCMM), and was first officially listed in the Chinese Pharmacopoeia in 1963 [1,2,3,4,5,6,7,8,9]. The dried flower bud of S. japonica L. is generally called Huaimi (Flos Sophorae Immaturus, FSI) in China. In the south of China more than 13,000 hectares of this species have been artificially planted. Mainly cultivated in Chongqing City, and Quanzhou County, Guilin City, Guangxi Autonomous Region in China, and twice in 2009 and 2015 successively through the examination and approval of varieties by the forestry administration committee Chongqing city, China. The main constituents of S. japonica L. include rutin, quercetin, genistein, kaempferol, and isorhamnetin, among others [10,11,12,13,14,15]. FSI is used as a hemostatic agent to treat hemorrhoids and hematemesis [15,16,17,18].
Extraction of herbs for TCMM is a good technique for process engineers in production development and for product quality evaluation in pharmaceutical industry. However, simultaneous extraction of the five aforementioned contents from FSI and Sophora Flower (SF) has not been reported. Various novel techniques have recently been developed to extract one, two, or three constituents from FSI and SF [8,19,20,21,22,23,24,25,26,27,28,29,30,31,32,33,34,35,36,37,38,39,40,41,42,43,44,45,46,47,48,49,50,51,52,53,54,55,56,57,58,59,60,61]. These methods include decoction [49], percolation [22,28], reflux [25,44,46,53], Soxhlet [27,44,60], ultrasonic-assisted extraction [8,20,21,23,25,26,29,30,38,42,50,51,52,56,57,58,59,61], microwave-assisted extraction (MAE) [24,25,32,33,34,35,36,45,47,55], infrared-assisted extraction [43], supercritical fluid CO2 extraction [41], basic method [39,48], and enzymatic method [37] (Table 1). However, despite their advantages, these extraction methods require long extraction times [8,19,20,21,22,23,25,30,37,39,40,41,44,46,48,50,51,52,53,55,56,57,58], have low efficiency [1,19,20,22,25,26,28,39,41,44,45,47,50,60], and/or are expensive [8,21,22,23,27,37,58]. Thus, developing a reliable, economical, efficient, and ecologically sensitive technique for extracting the constituents of FSI is necessary.
MAE is widely used to extract active constituents from various kinds of plant materials because of its enhanced extraction efficiency compared with other traditional extraction methods [62,63,64,65,66]. The MAE system rapidly generates heat and can facilitate the penetration of solvent into raw plant material and intracellular material to improve constituent transfer, reducing extraction time and improving extraction rate [62,63]. The efficiency of MAE depends on extraction time, liquid-to-solid ratio, extraction power, and type of extraction solvent [62,63,64,67]. In this study, we investigated the MAE of major constituents from FSI and SF. Response surface methodology (RSM) was used to improve the extraction yield of constituents by systematically analyzing the effects of extraction parameters on yields. RSM is a collection of statistical, as well as mathematical, techniques and effective for responses that are influenced by various factors and their interactions [68,69].
The active compounds of herbs vary according to several factors, including variety, geographic area, nutritional status, harvest time, manufacturing process, and even storage method [70]. Variations in these factors could result in significant differences in pharmacological activity. Accurate, analytically obtained qualitative and quantitative data are used to evaluate the efficacy and safety of TCMM [71,72,73,74,75,76,77,78,79]. Therefore, developing a reliable and accurate quality control method for TCMM is necessary. Previous, analytical methods developed for determining the quality of a few components in FSI include HPLC-UV [20,80,81,82], HPLC-DAD [21,23,59], HPLC-DAD-ESI-MS/MS [83], and capillary electrophoresis [17,84,85]. While these reported methods contribute significantly to the current knowledge of FSI compounds, several drawbacks, such as identification of too few constituents, long analysis times, and high solvent consumption, limit their practical application. Thus, a new analytical method must be developed to qualitatively and quantitatively determine multiple active constituents in FSI.
Ultra-high performance liquid chromatography coupled with electrospray ionization quadrupole time-of-flight tandem mass spectrometry (UHPLC-ESI-Q-TOF MS/MS) is a powerful approach that enables simultaneous determination of multiple components [86,87,88,89,90,91,92]. The chemical structures of FSI constituents could readily be defined by using fragmentation rules, characteristic fragmentation and quasi-molecular ions summarized in the literature, and comparison of retention times and parent and product ions with those of standards.
This study aimed to investigate the significant variables (methanol and ethanol concentrations, particle size, extraction frequency, liquid-to-solid ratio, microwave power, and extraction time) prior to RSM to optimize variables for FSI extraction and developed a simple and accurate UHPLC and LC-ESI-Q-TOF MS/MS method for simultaneously determining five components of FSI.

2. Results and Discussion

2.1 Analysis of Single Factor Test Results

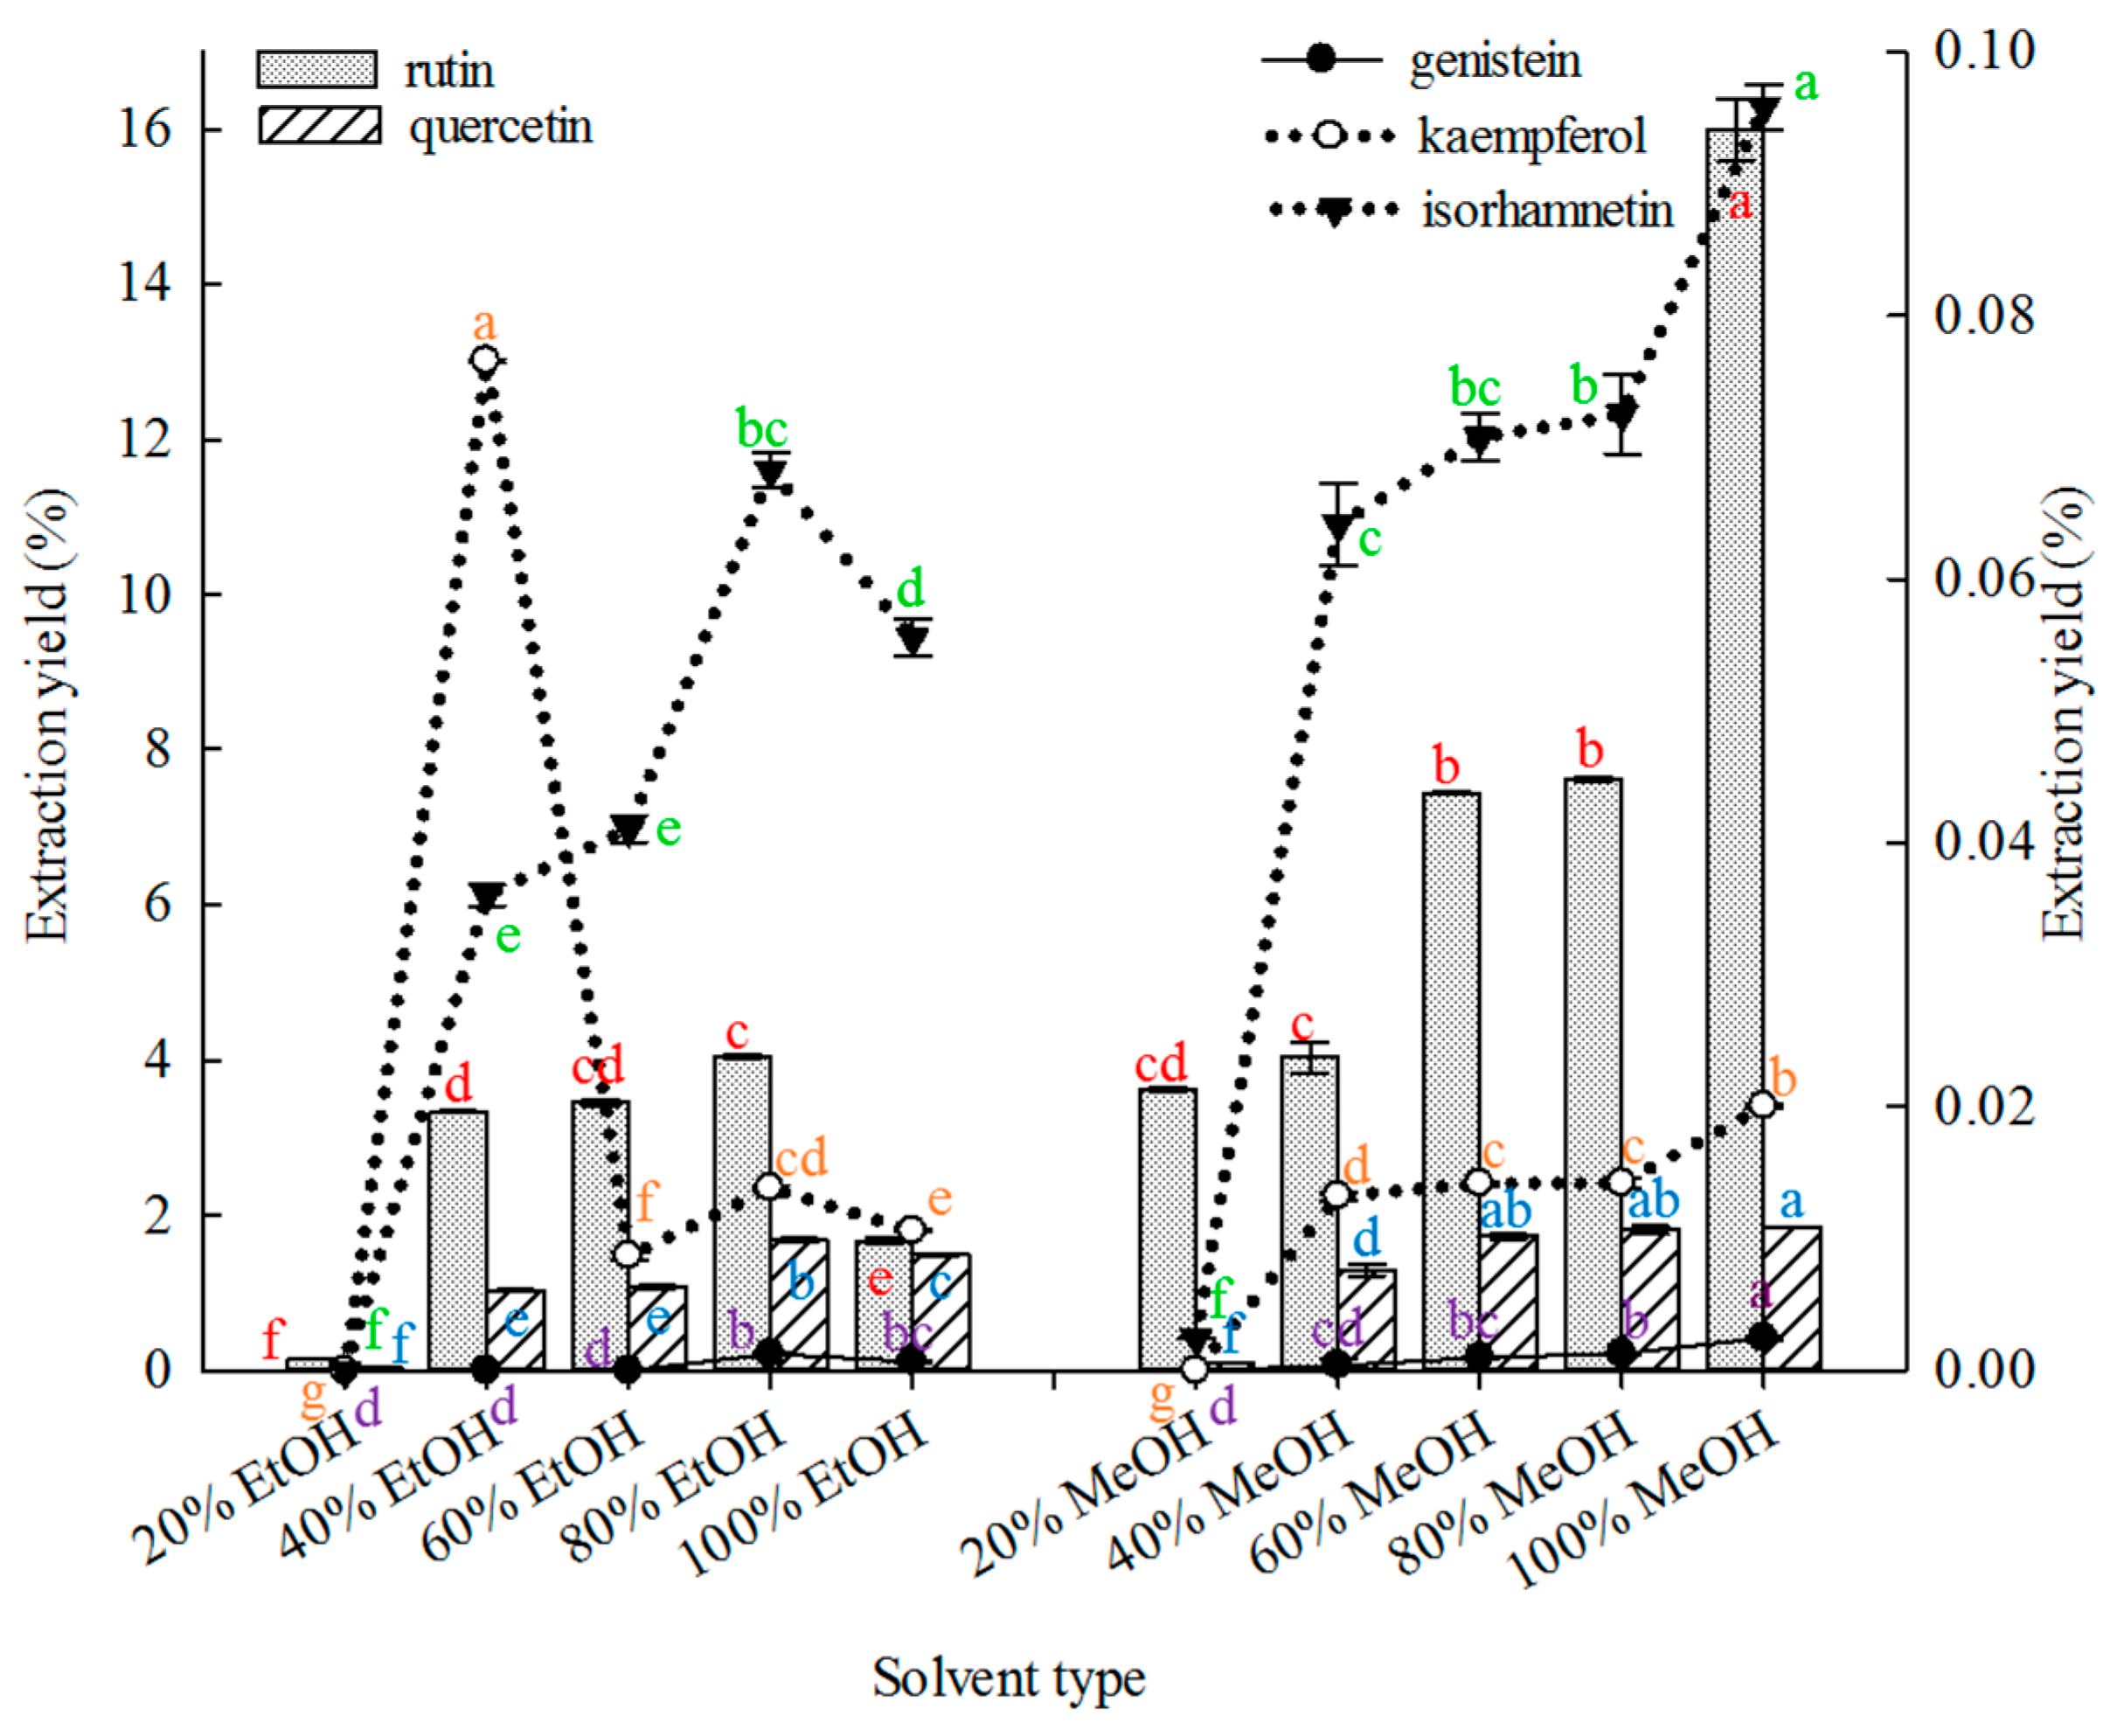
2.1.1. Effect of Solvent Type on Extraction

Solvent selection is important in the extraction of compounds from botanical materials [69]. Figure 1 shows that under similar extraction conditions. 100% MeOH was superior to other solvents in extracting rutin, genistein and isorhamnetin from FSI. Both 80% MeOH and 100% MeOH were superior to the other solvents in extracting quercetin, but without significant differences in their extraction yields (p ≤ 0.01). The 40% EtOH solvent was superior to the other solvents in extracting kaempferol.
Thus, 100% methanol was selected as the extraction solvent to extract the five major constituents using MAE in subsequent experiments. Previous studies reported the use of different ethanol and methanol concentrations mainly for extracting rutin or quercetin from SFI [19,20,21,22,23,25,26,27,28,32,34,35,40,43,45,46,47,58,59,60]. Water [31,33,36,42], alkaline solution [29,30,38,48], cellulase [37], ether [41], and sodium hydroxide [49] have also been reported as extraction solvents for extracting ingredients from SFI. However, ether and alkaline solutions are toxic, water cannot dissolve flavonoid components, and cellulase is expensive. Although the methanol and ethanol concentrations used were somewhat variable, methanol was selected as the best extraction solvent among the extraction solvents listed in Section 3.2.1.

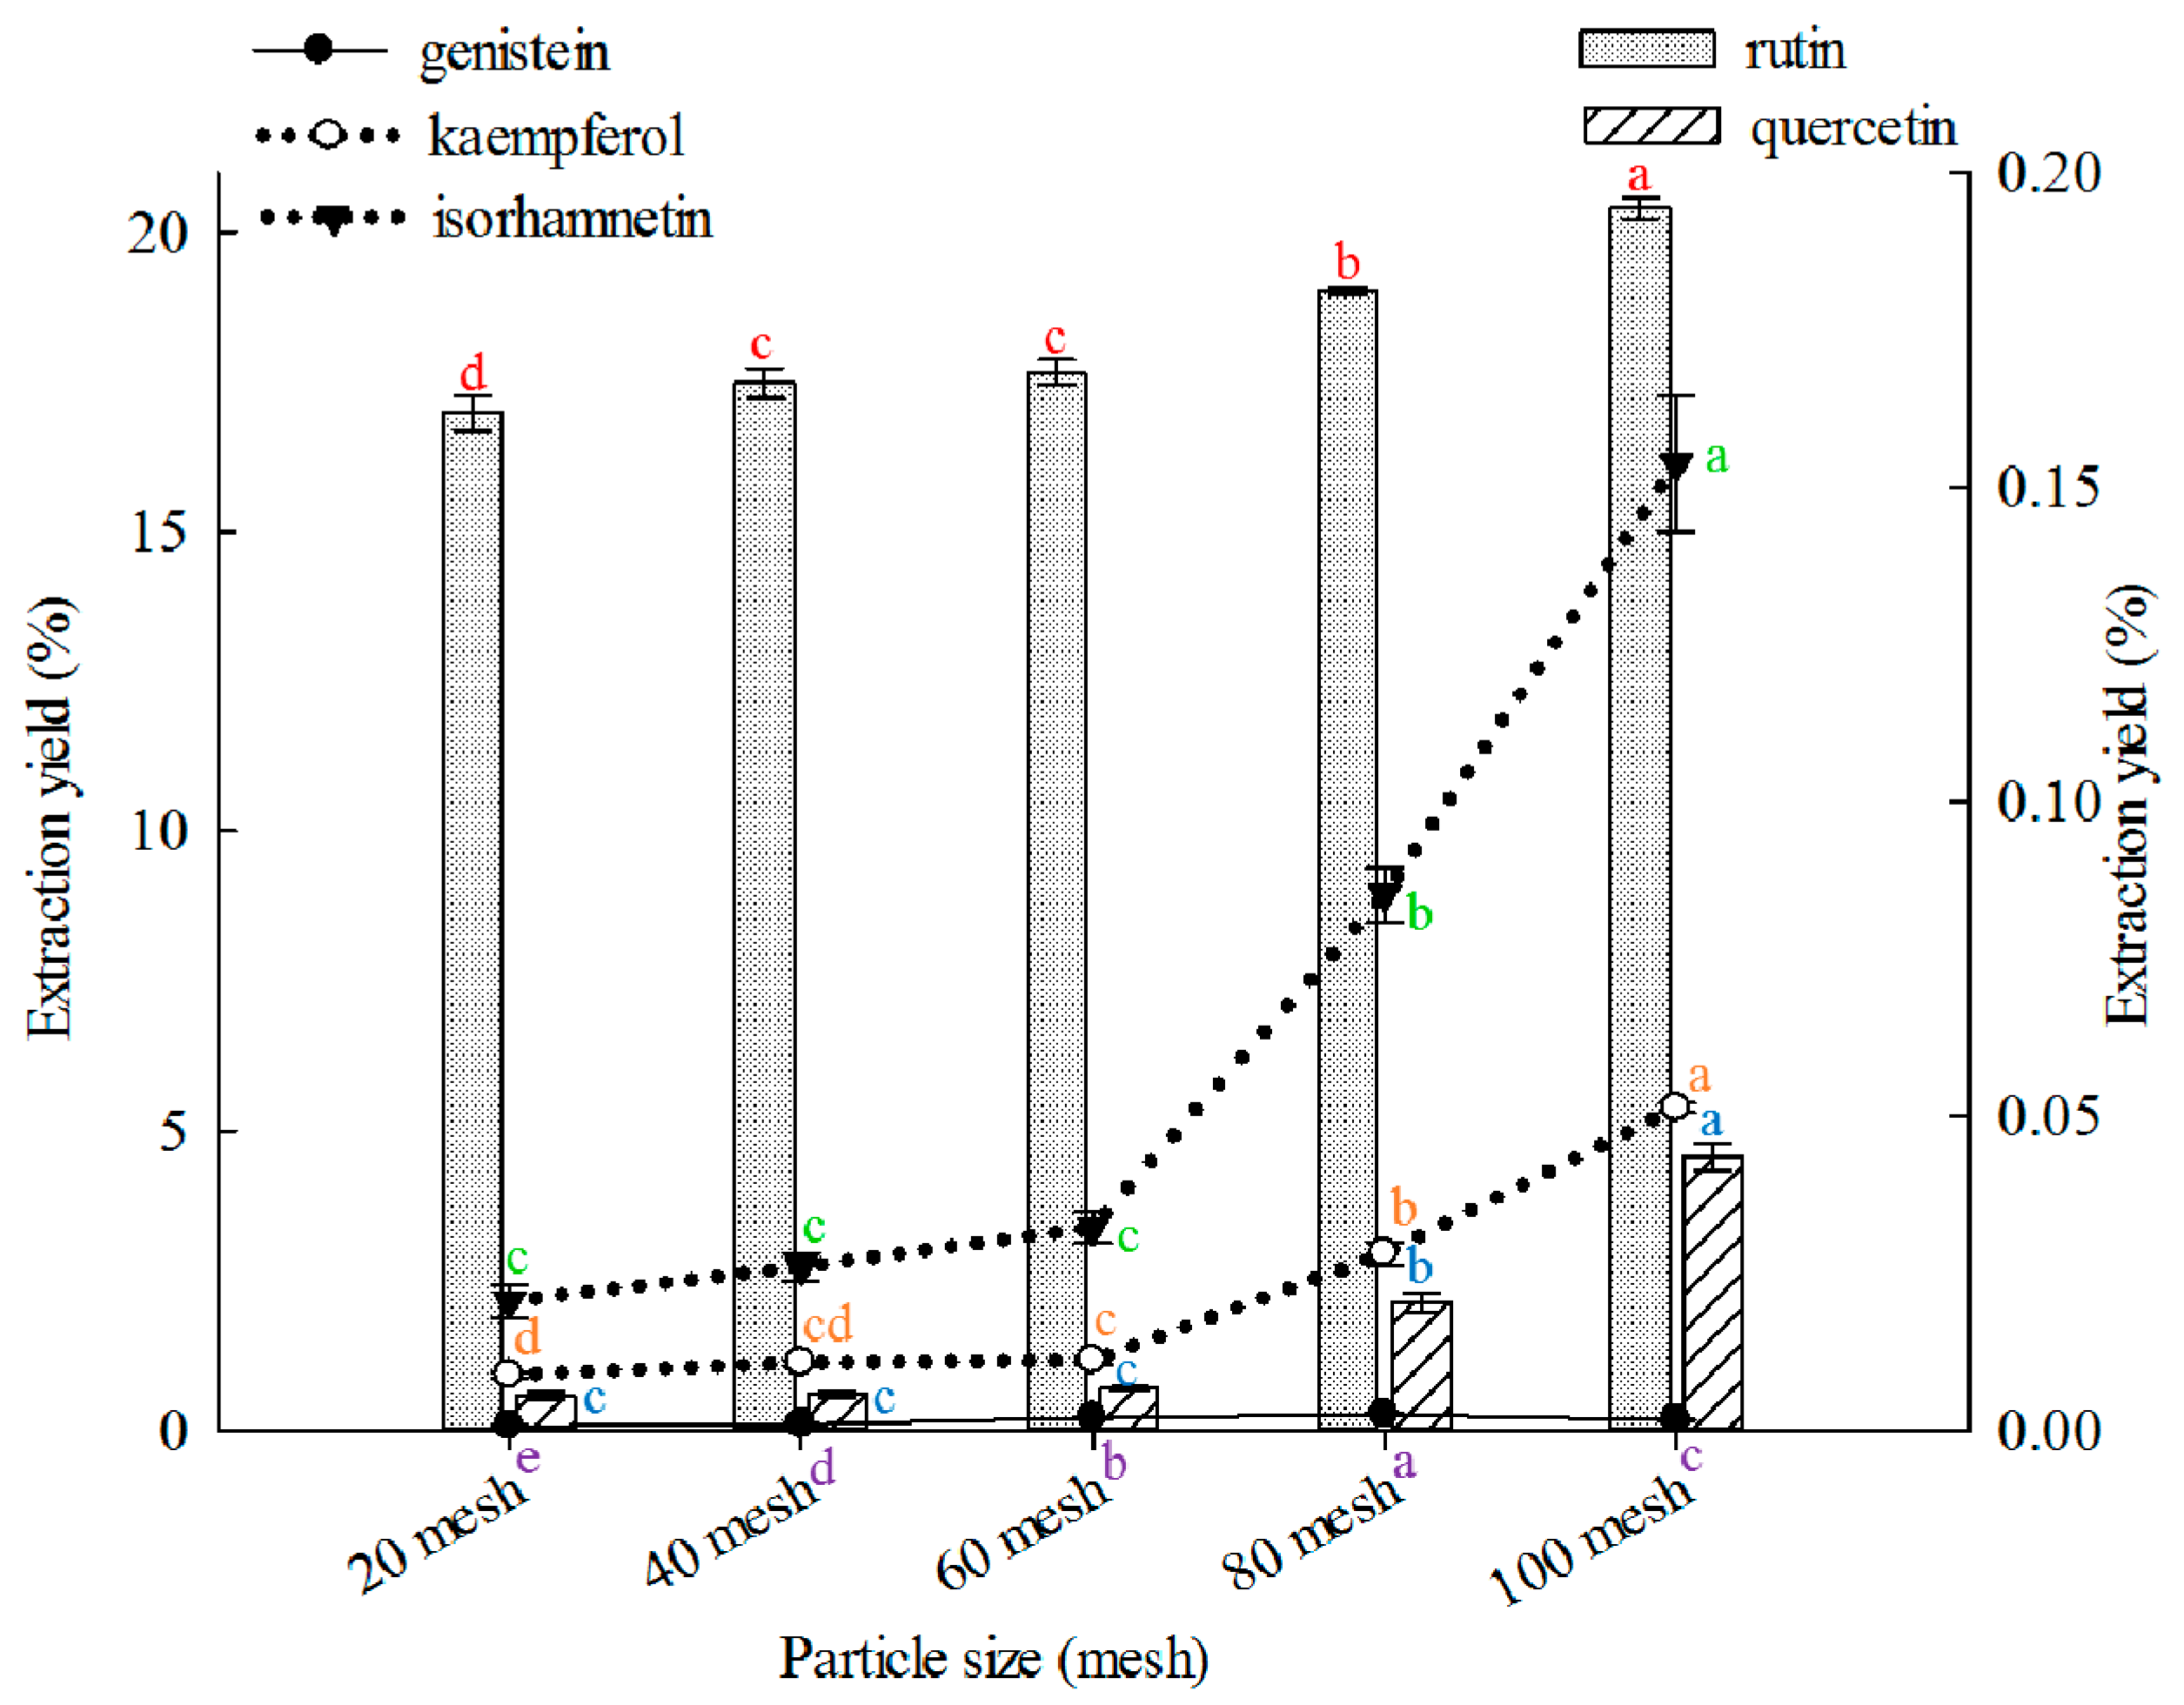
2.1.2. Effect of Particle Size on Extraction

The appropriate particle size is fundamental to obtain optimal extraction, and varied particle sizes can significantly affect extraction yields [69]. In this study, 100 mesh showed better results than other particle sizes in extracting rutin, quercetin, kaempferol, and isorhamnetin (Figure 2), and 80 mesh was better than other particle sizes in extracting genistein. Effects of particle size on extraction of rutin, quercetin, genistein, kaempferol, or isorhamnetin from FSI are rarely reported.

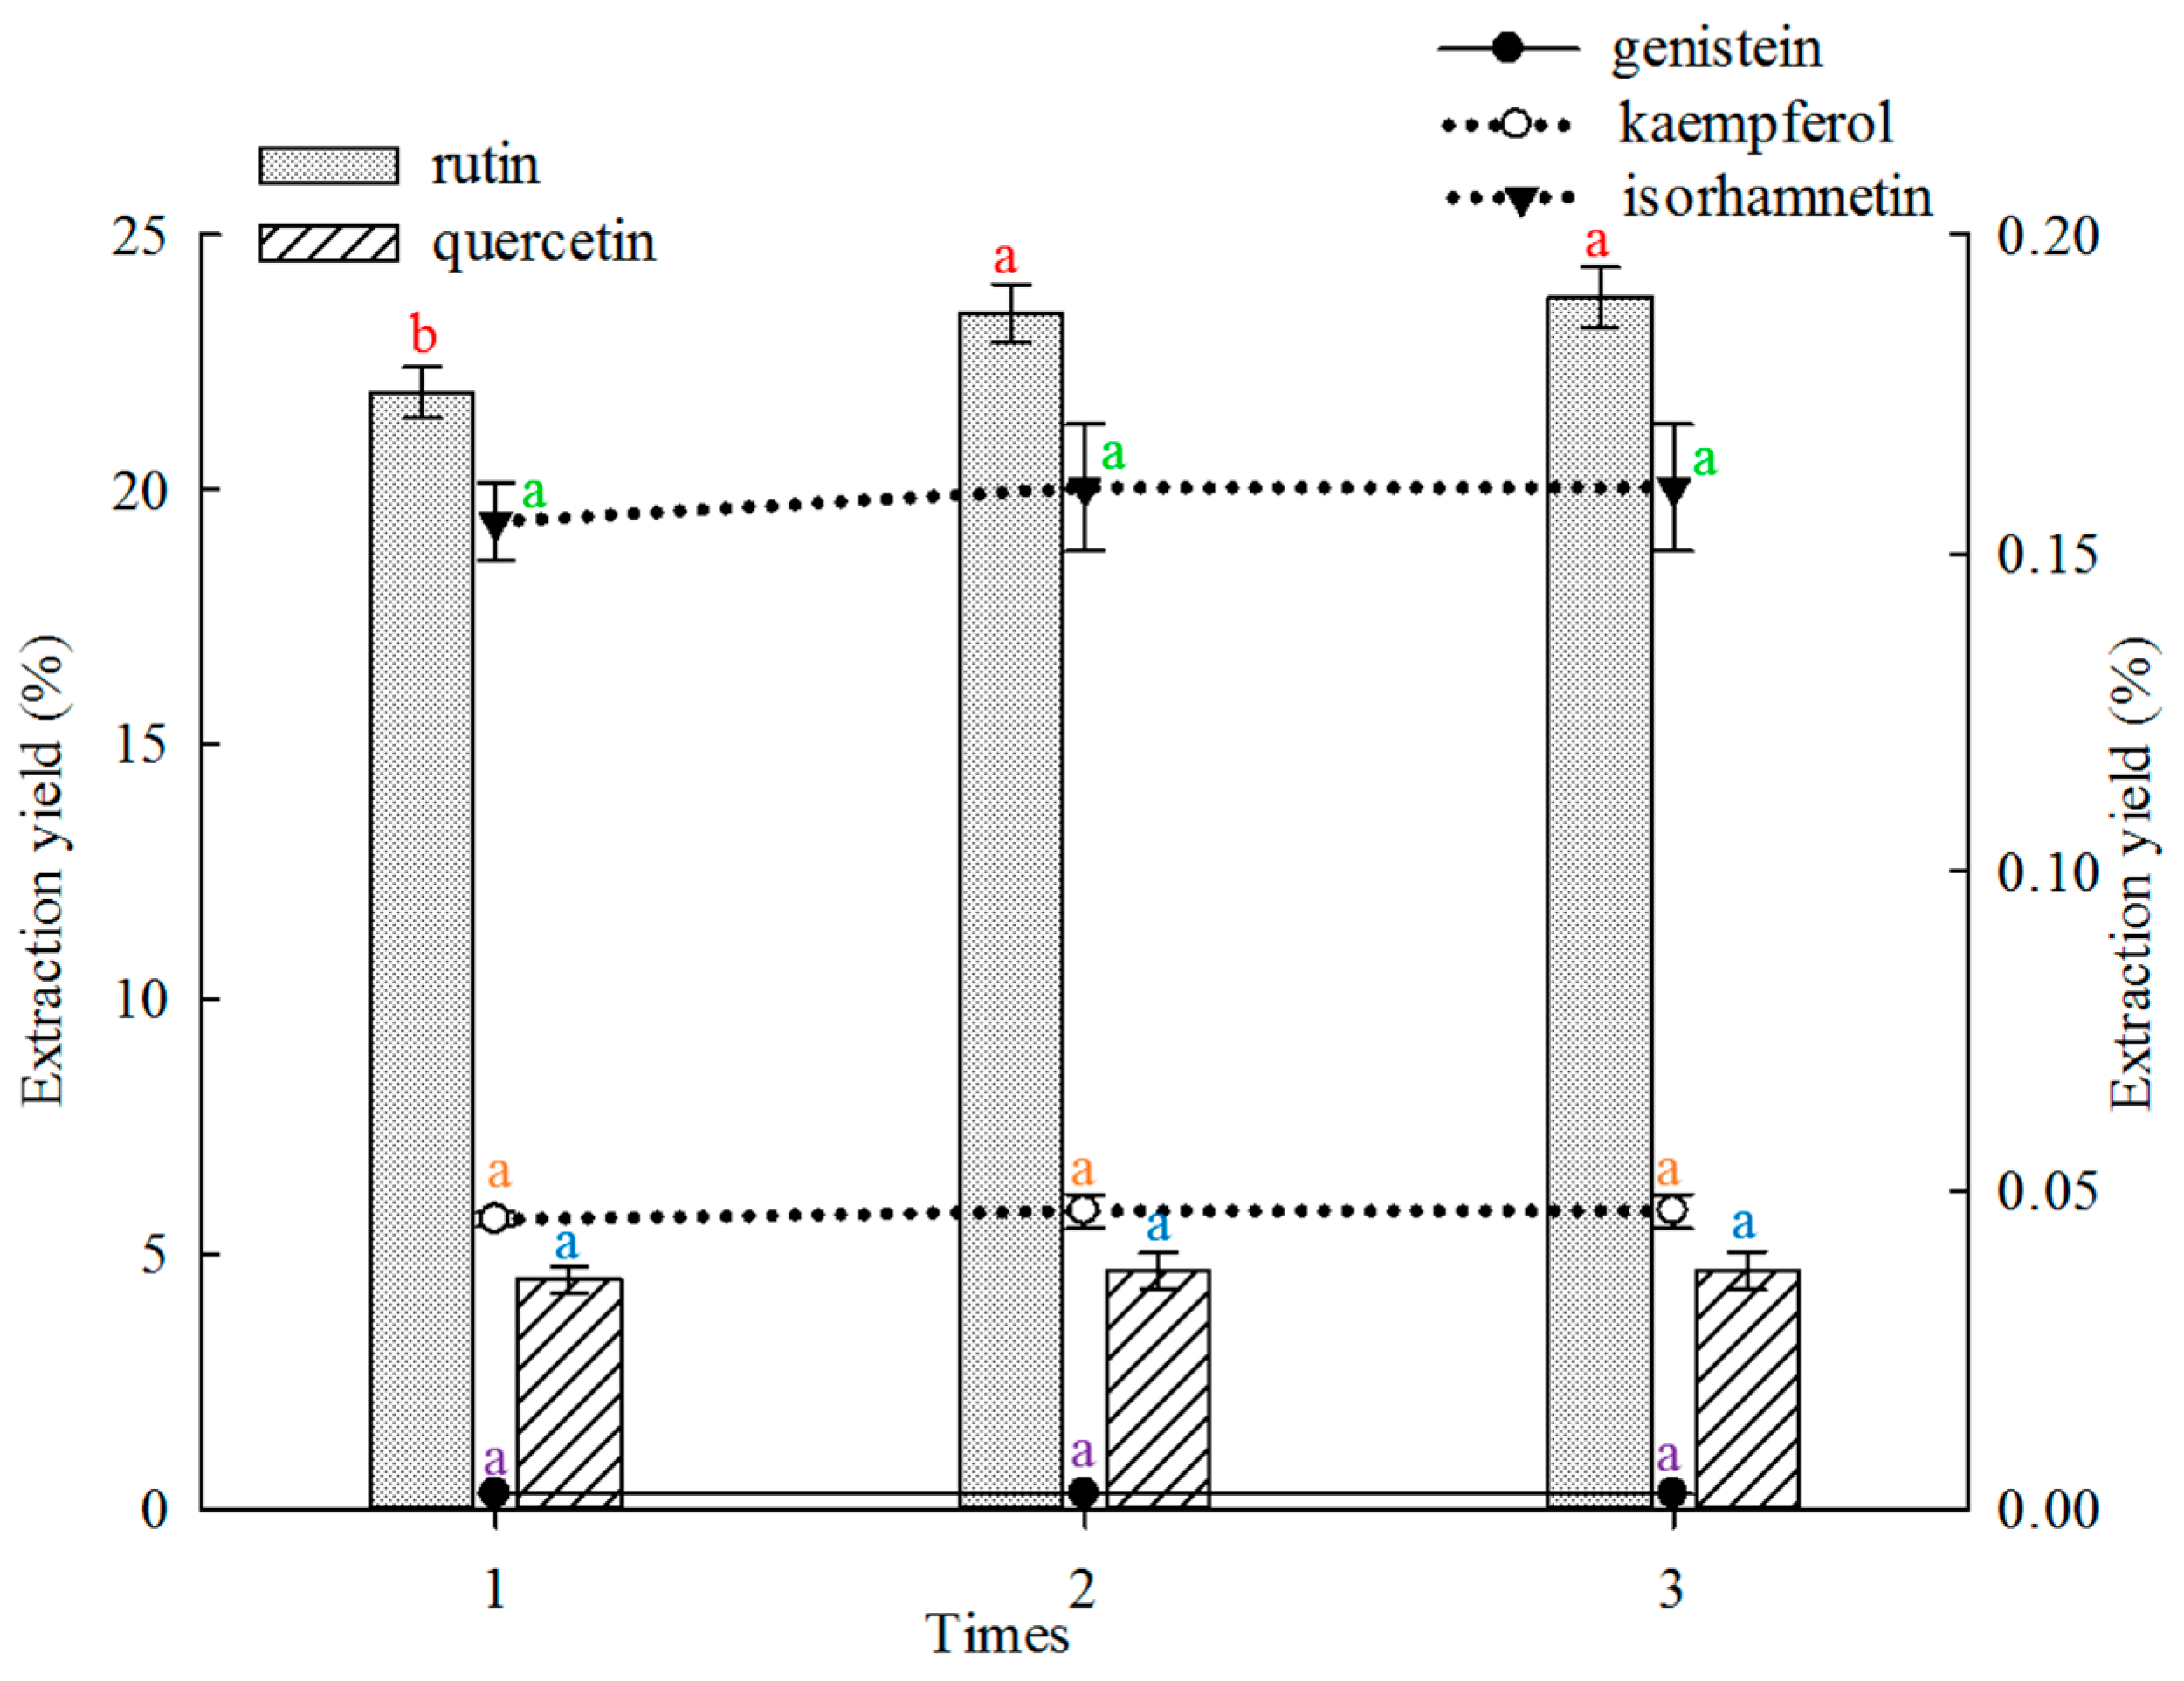
2.1.3. Effect of Frequency on Extraction

The effect of extraction frequency on the extraction yield of the five main constituents from FSI was investigated, and the results are shown in Figure 3. In this study, twice and thrice extraction showed better results in extracting rutin than single extraction. The twice extraction and thrice extraction did not differ significantly. The extraction yields of quercetin, genistein, kaempferol and isorhamnetin did not differ significantly when the extraction was performed once to thrice.

2.1.4. Effect of Liquid-to-Solid Ratio on Extraction

The solvent volume must be sufficient to ensure complete immersion of materials for efficient extraction. Extraction solvent deficiency can lead to incomplete extraction of ingredients, but redundant solvent may also lead to lower extraction yields and solvent waste [69]. Therefore, the liquid-to-solid ratio must be appropriate. The effect of liquid-to-solid ratio on the extraction yield of the five constituents was investigated, and the results are shown in Figure 4. The 50:1 (v/m) proportion showed better results than other liquid-to-solid ratios in extracting rutin and quercetin. The 100:1 proportions were better than other liquid-to-solid ratios in extracting genistein, kaempferol and isorhamnetin. The maximum and minimum liquid-to-solid ratios of 500:1 and 4:1, respectively, have been reported for the extraction of rutin or quercetin from FSI, but with low extraction yields [21,47].

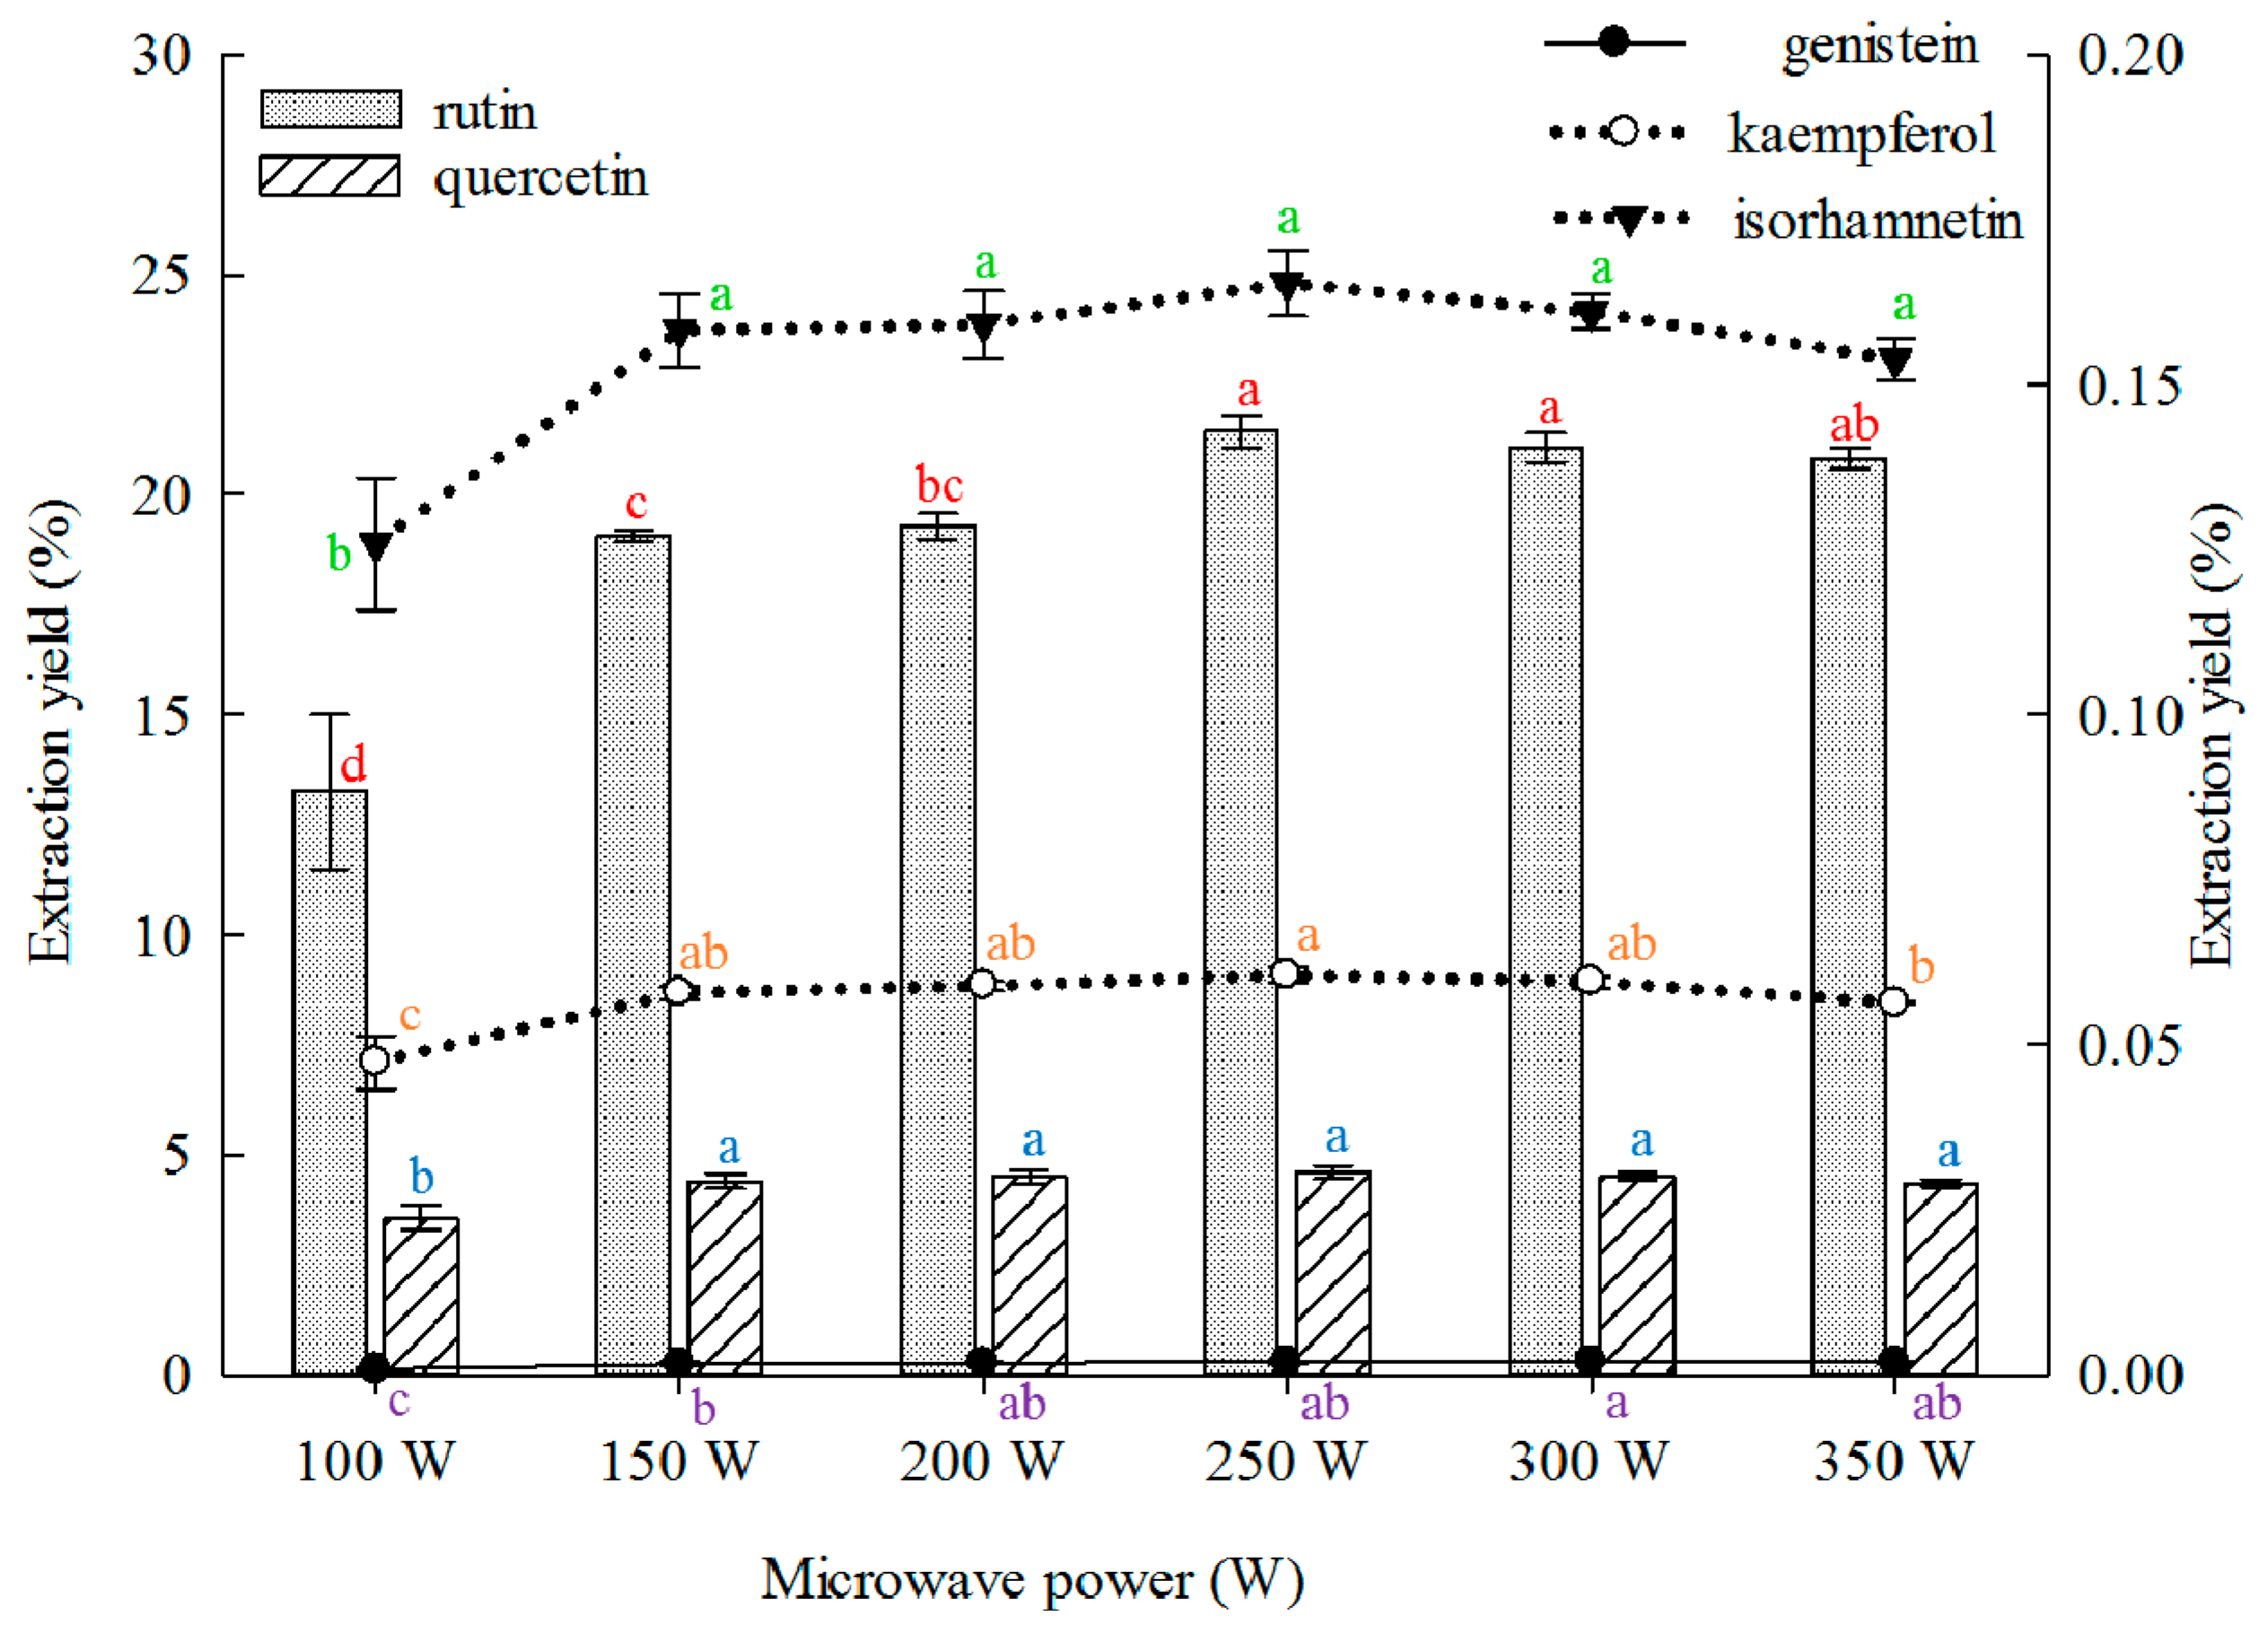
2.1.5. Effect of Microwave Power on Extraction

Low microwave power reduces extraction yield. However, excessively high power results in energy wastage. Therefore, the optimal microwave power should be determined. The effect of microwave power on the extraction yield of the five main constituents from the FSI was investigated, and the results are shown in Figure 5. The extraction yields of rutin, quercetin, kaempferol, and isorhamnetin from the FSI evidently increased with increasing microwave power, but no increase was observed above 250 W. The extraction yield of genistein continued to increase with the microwave power and peaked when the power was 300 W. Subsequently, a reduction in yield was observed. Previous study on the effects of microwave power for rutin and quercetin extraction from FSI are available, but microwave power was high (350–480 W) and the extraction yield was low (rutin, 14.66%–21.97%; quercetin, 0.46%–0.61%) [31,36,45,47].

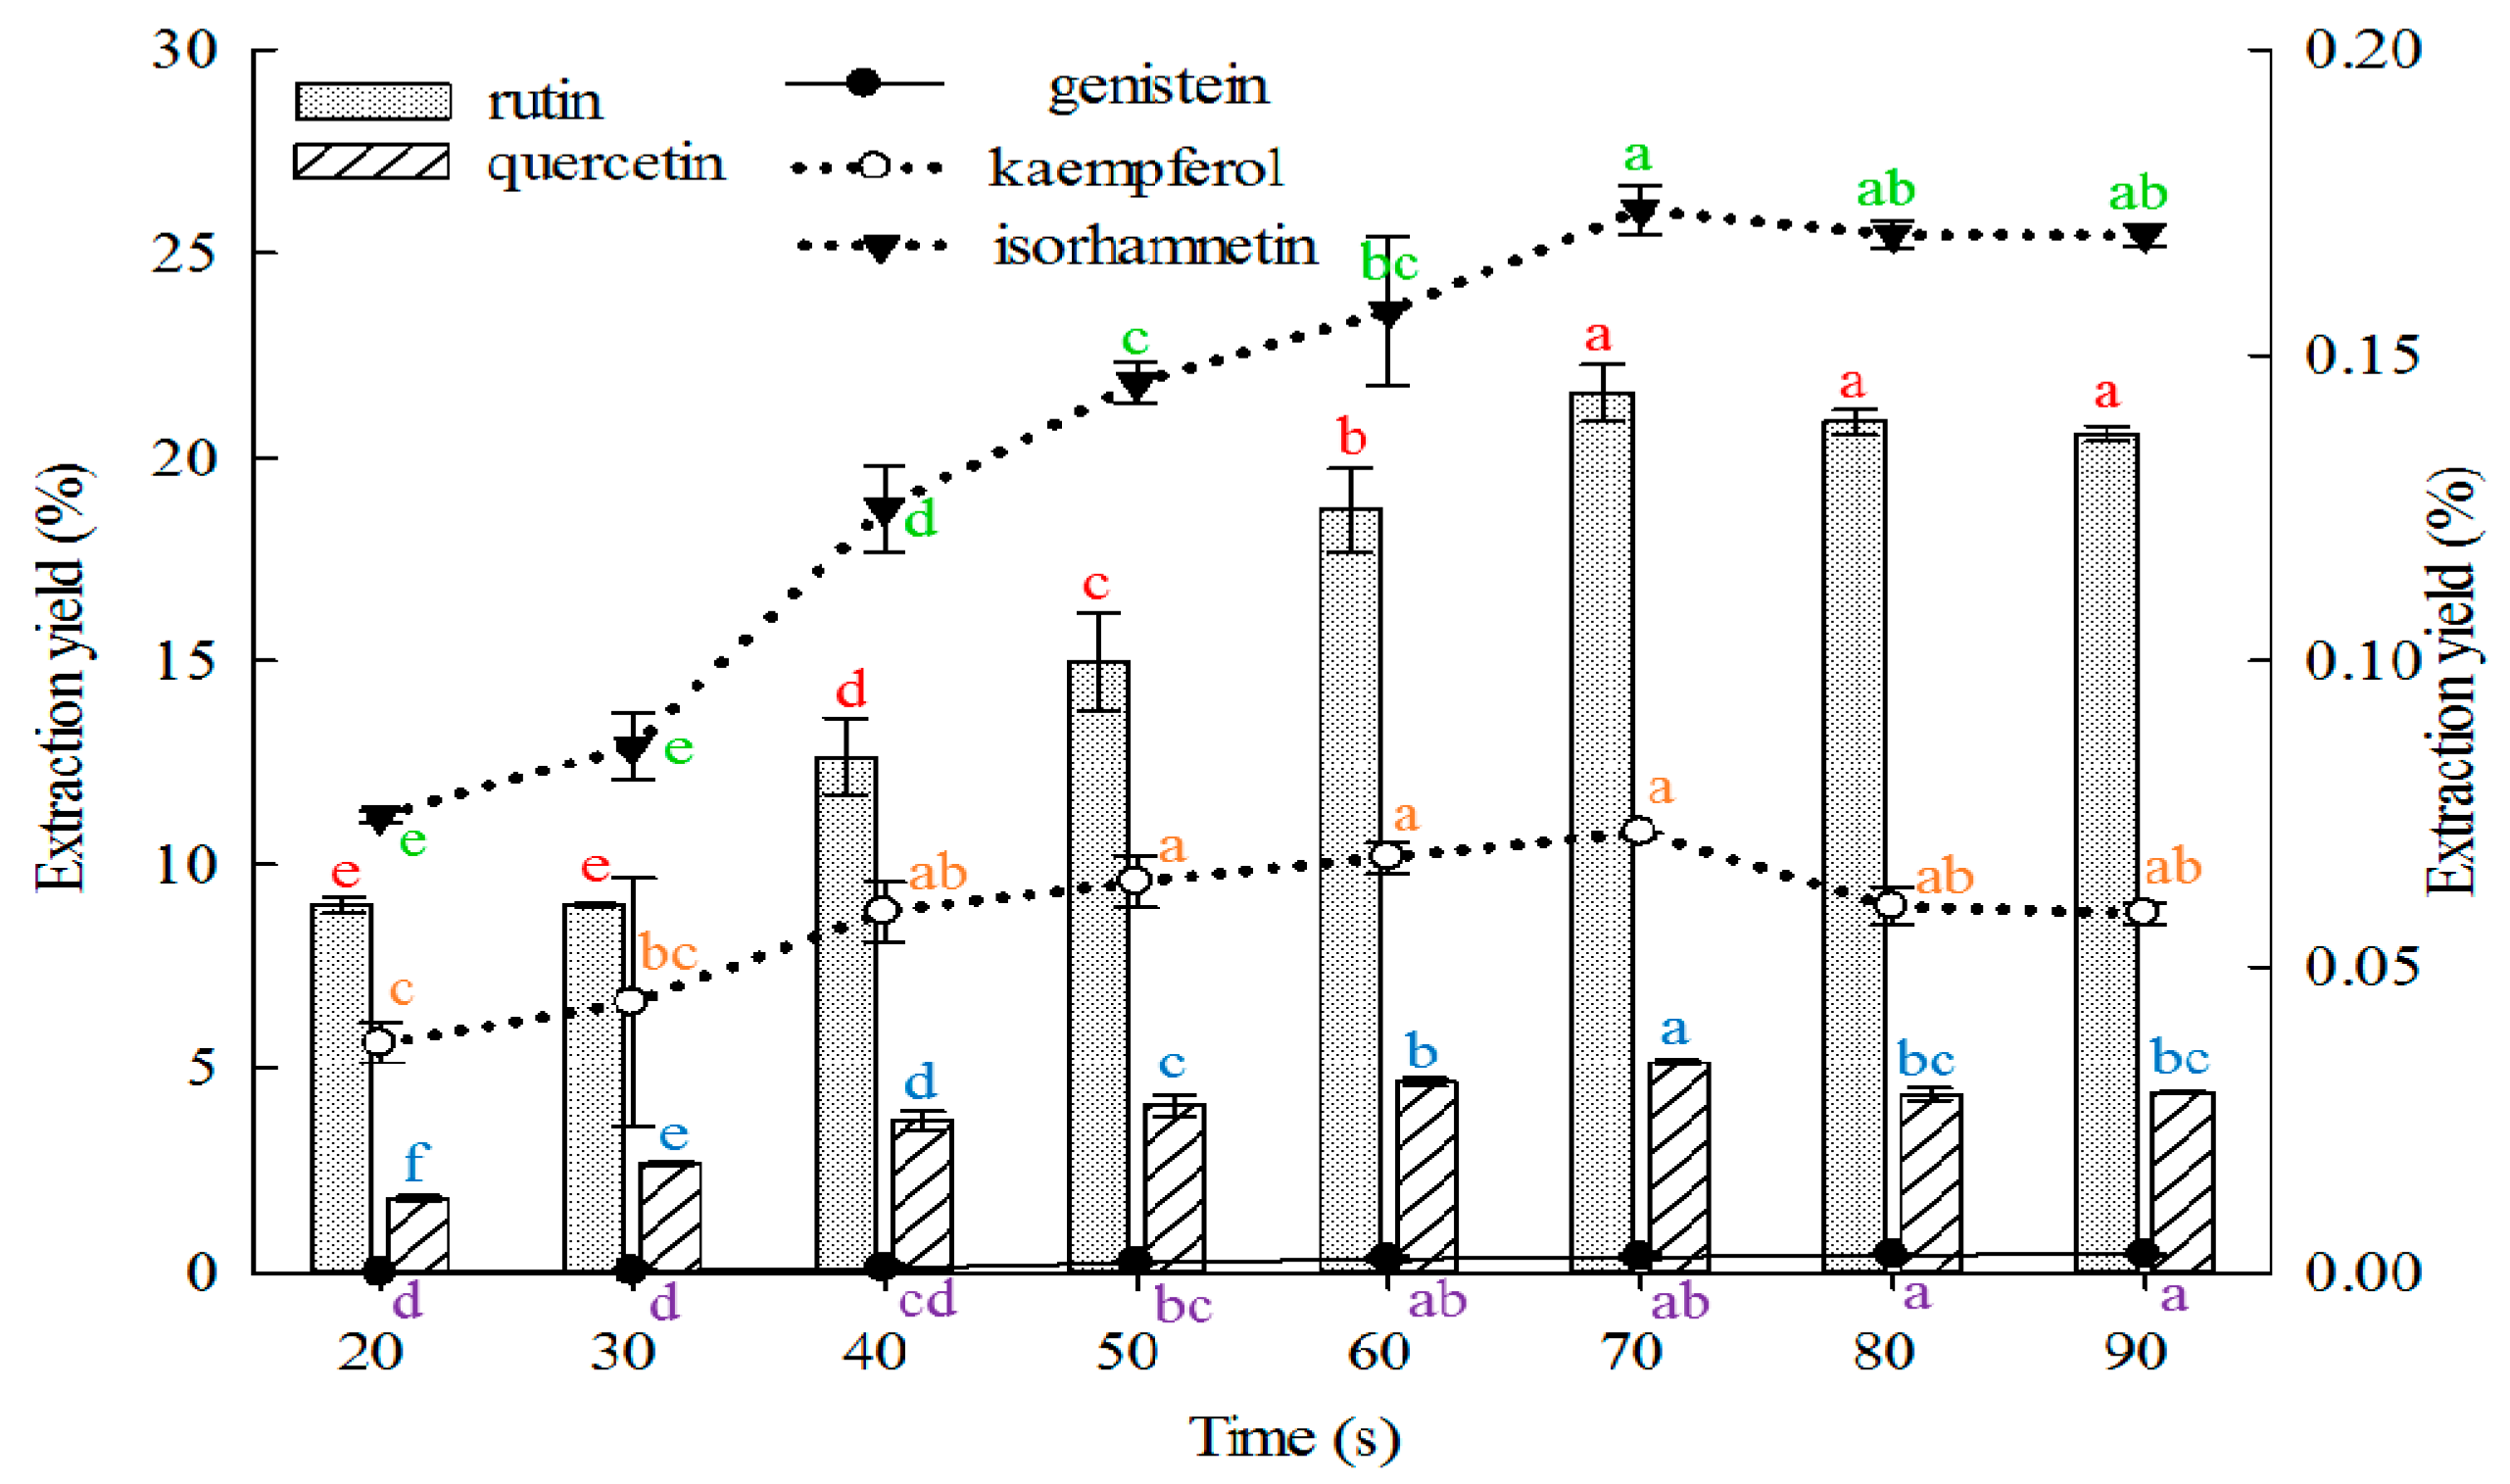
2.1.6. Effect of Time on Extraction

Longer time indicates greater contact between the solvent and sample contact. This phenomenon may accelerate the absorption of solvent, soften the plant tissues, and weaken the cell wall integrity. Moreover, ingredient solubility may be enhanced, thus larger amounts of substances are distributed to the solvent. However, excessive extraction time may lead to lower process efficiency and wasted time. Therefore, the extraction time must be appropriate. The effects of extraction time on the extraction yields of the five constituents from FSI are shown in Figure 6.
The extraction yields of rutin, quercetin, kaempferol, and isorhamnetin increased as the extraction time was prolonged from 20 s to 70 s and peaked at 70 s. However, extraction yields of genistein increased as the extraction time was increased from 20 s to 80 s and peaked at 80 and 90 s, but without a statistically significant difference. Thus, extraction time is shorter than those reported in previous reports [8,19,20,21,22,23,25,30,37,39,40,41,44,46,48,50,51,52,53,55,56,57,58].

2.2. Model Fitting of Parameters Based on the Extraction Yields of the Five Constituents

The responses of the five extracts in each run are presented in Table 2. The regression coefficients and results from ANOVA of the second-order polynomial models (Y = A0 + A1X1 + A2X2 + A3X3 + A11X12 + A22X22 + A33X32 + A12X1X2 + A13X1X3 + A23X2X3) for five extracts are summarized in Table 3. Regression parameters of the surface response analysis of the linear and quadratic models, and their corresponding interaction terms showed significant differences (p ≤ 0.0001, p ≤ 0.01 or p ≤ 0.05). The fitness of the model was evaluated through the lack of fit test (p < 0.05), which indicates the adequacy of the model to predict the variation accurately [93]. The models were used to construct three-dimensional response surface plots to predict the relationship between independent and dependent variables.

2.2.1. Effect of Process Variables on the Extraction Yield of Rutin

The experimental data were examined through regression analysis, and the coefficients of the model were evaluated for significance. Liquid-to-solid ratio (X1), microwave power (X2), and time (X3) significantly affected the extraction yield of rutin (Y1, Table 3), with corresponding contribution rates of 2.88, 2.90, and 2.92. These results indicate that microwave power and extraction time exhibited the greatest effect on the extraction yield of rutin.
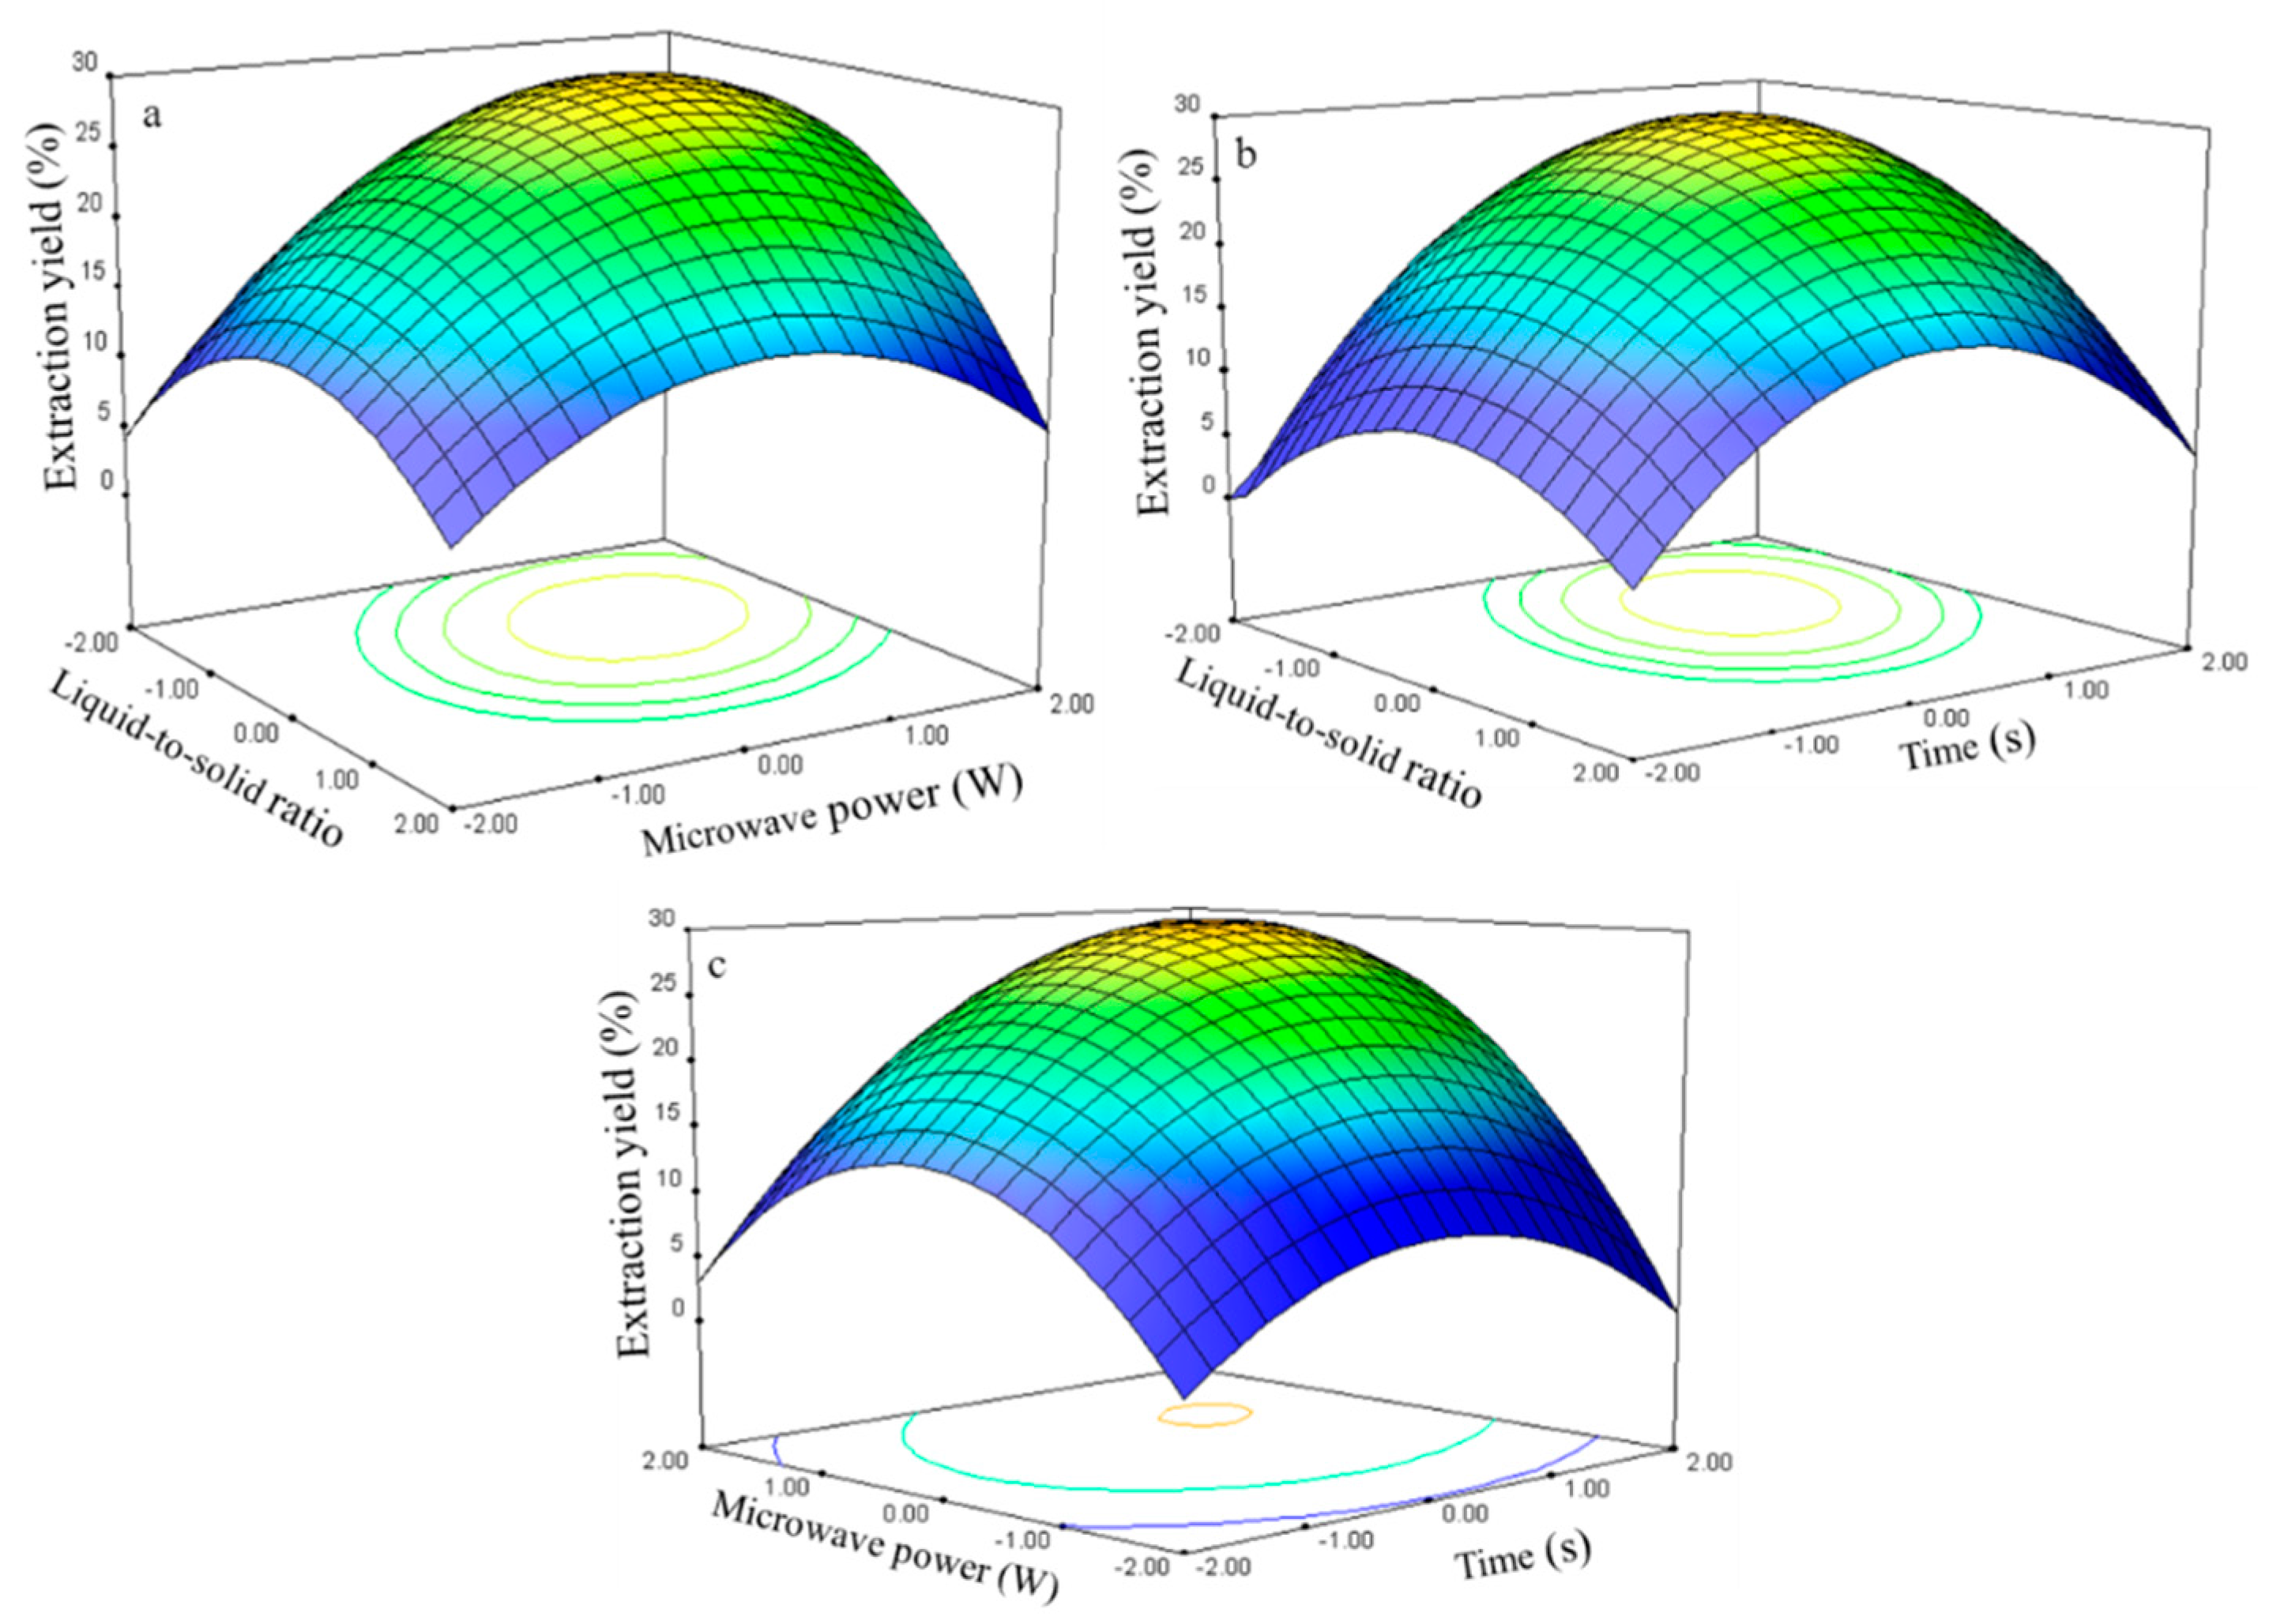
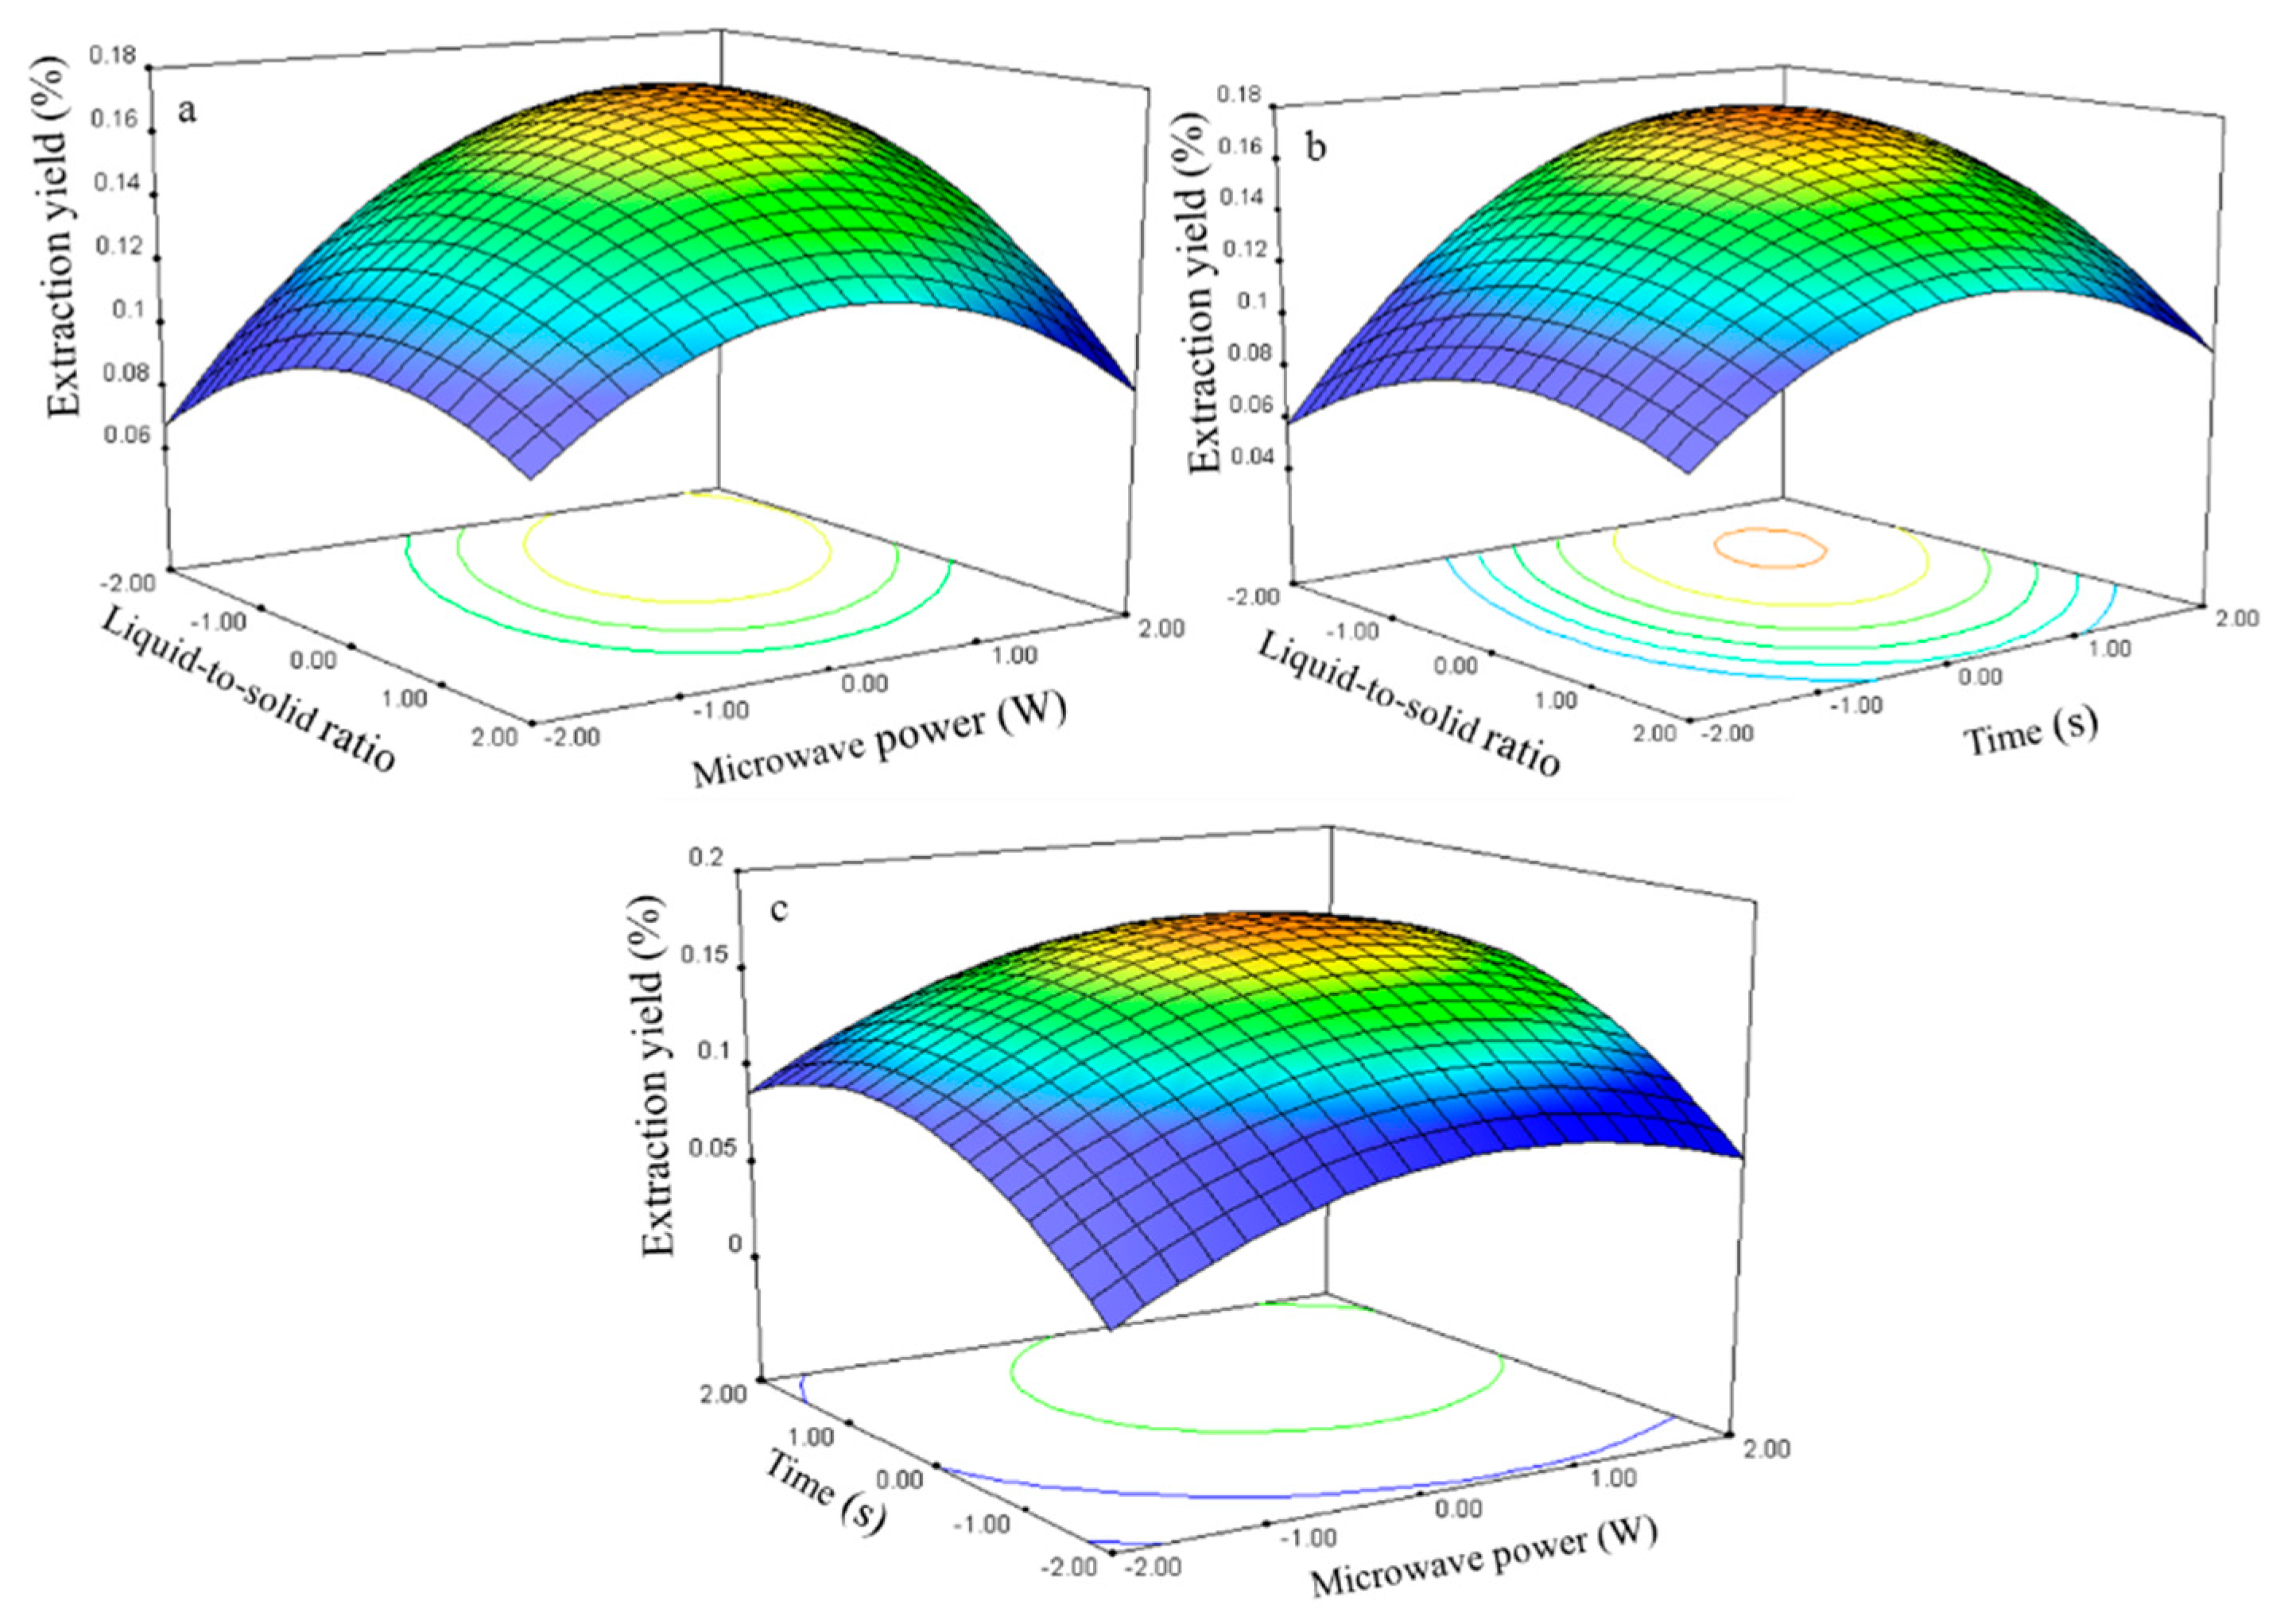
The three-dimensional response surface plots in Figure 7 illustrate the relationship between the extraction yield of rutin and experimental variables. Figure 7a illustrates the interaction effect of liquid-to-solid ratio and power on the extraction yield of rutin when the time was set to its 0 level (70 s). Rutin yields gradually increased with liquid-to-solid ratio and microwave power and peaked at approximately 50:1 to 75:1 and 250 W to 300 W. However, extraction yield of rutin began to decrease after further increase in these parameters.
The interaction effects between the liquid-to-solid ratio and the time on the rutin extraction yield when the power was set to its 0 level (250 W) are presented in Figure 7b. The rutin yield increased and peaked at 50:1 to 100:1 from 75 s to 80 s.
The interaction effects of power and time at 75:1 (0 level) on the rutin extraction yield are presented in Figure 7c. Strong interaction was observed when the power was set from 275 W to 300 W and the time ranged from 75 s to 80 s, which contributed to the increased extraction yield.
The rutin regression model for the statistical frequency method of analysis with 95% confidence interval was obtained (X1: –1.47 to –0.58, X2: 0.72 to 1.26, and X3: 0.64 to 1.18) when the extraction yield was >26.80% (n = 21). Therefore, the optimal conditions were 46.33–60.60, 286.05–312.85W, and 76.35–81.83 s.

2.2.2. Effect of Process Variables on the Extraction Yield of Quercetin

The quercetin extraction yield results are presented in Table 2. The regression analysis results indicate that the main extraction parameters of quercetin are the liquid-to-solid ratio (X1), microwave power (X2), and time (X3). The relationships between the quercetin extraction yield (Y2, Table 3) and the variables are shown in Figure 8. The contributions of the liquid-to-solid ratio, microwave power, and extraction time were 2.79, 2.95, and 2.80, respectively. Microwave power had the largest impact on the quercetin extraction yield.
The effect of the liquid-to-solid ratio and microwave power on the quercetin extraction yield at a constant time (0 level) is shown in Figure 8a. The quercetin extraction yield gradually increased with the ratio and power and peaked at approximately 45–55 and 260–300 W, respectively. The quercetin extraction yield began to decrease beyond 55 and 300 W. The appropriate extraction time (75–80 s) had positive effects on the extraction yield, as shown in the response surface plots for the time effect on the extraction yield (Figure 8b,c) at constant microwave power and liquid-to-solid ratio.
The quercetin regression model for the statistical frequency method of analysis with 95% confidence interval was obtained (X1: −1.11 to −0.53, X2: 0.23 to 0.95 and X3: 0.51 to 1.10) when the extraction yield was >5% (n = 20). Thus, the optimal conditions were 47.28–61.70, 261.35–297.30 W, and 75.10–80.63 s.

2.2.3. Effect of Process Variables on the Extraction Yield of Genistein

The genistein extraction yield is presented in Table 2. The regression analysis shows that the extraction yield (Y3, Table 3) was significantly affected by the liquid-to-solid ratio (X1), microwave power (X2), and time (X3), with corresponding contribution rates of 2.88, 1.91, and 2.86, respectively. The liquid-to-solid ratio and extraction time exhibited the largest impact on the genistein extraction yield.
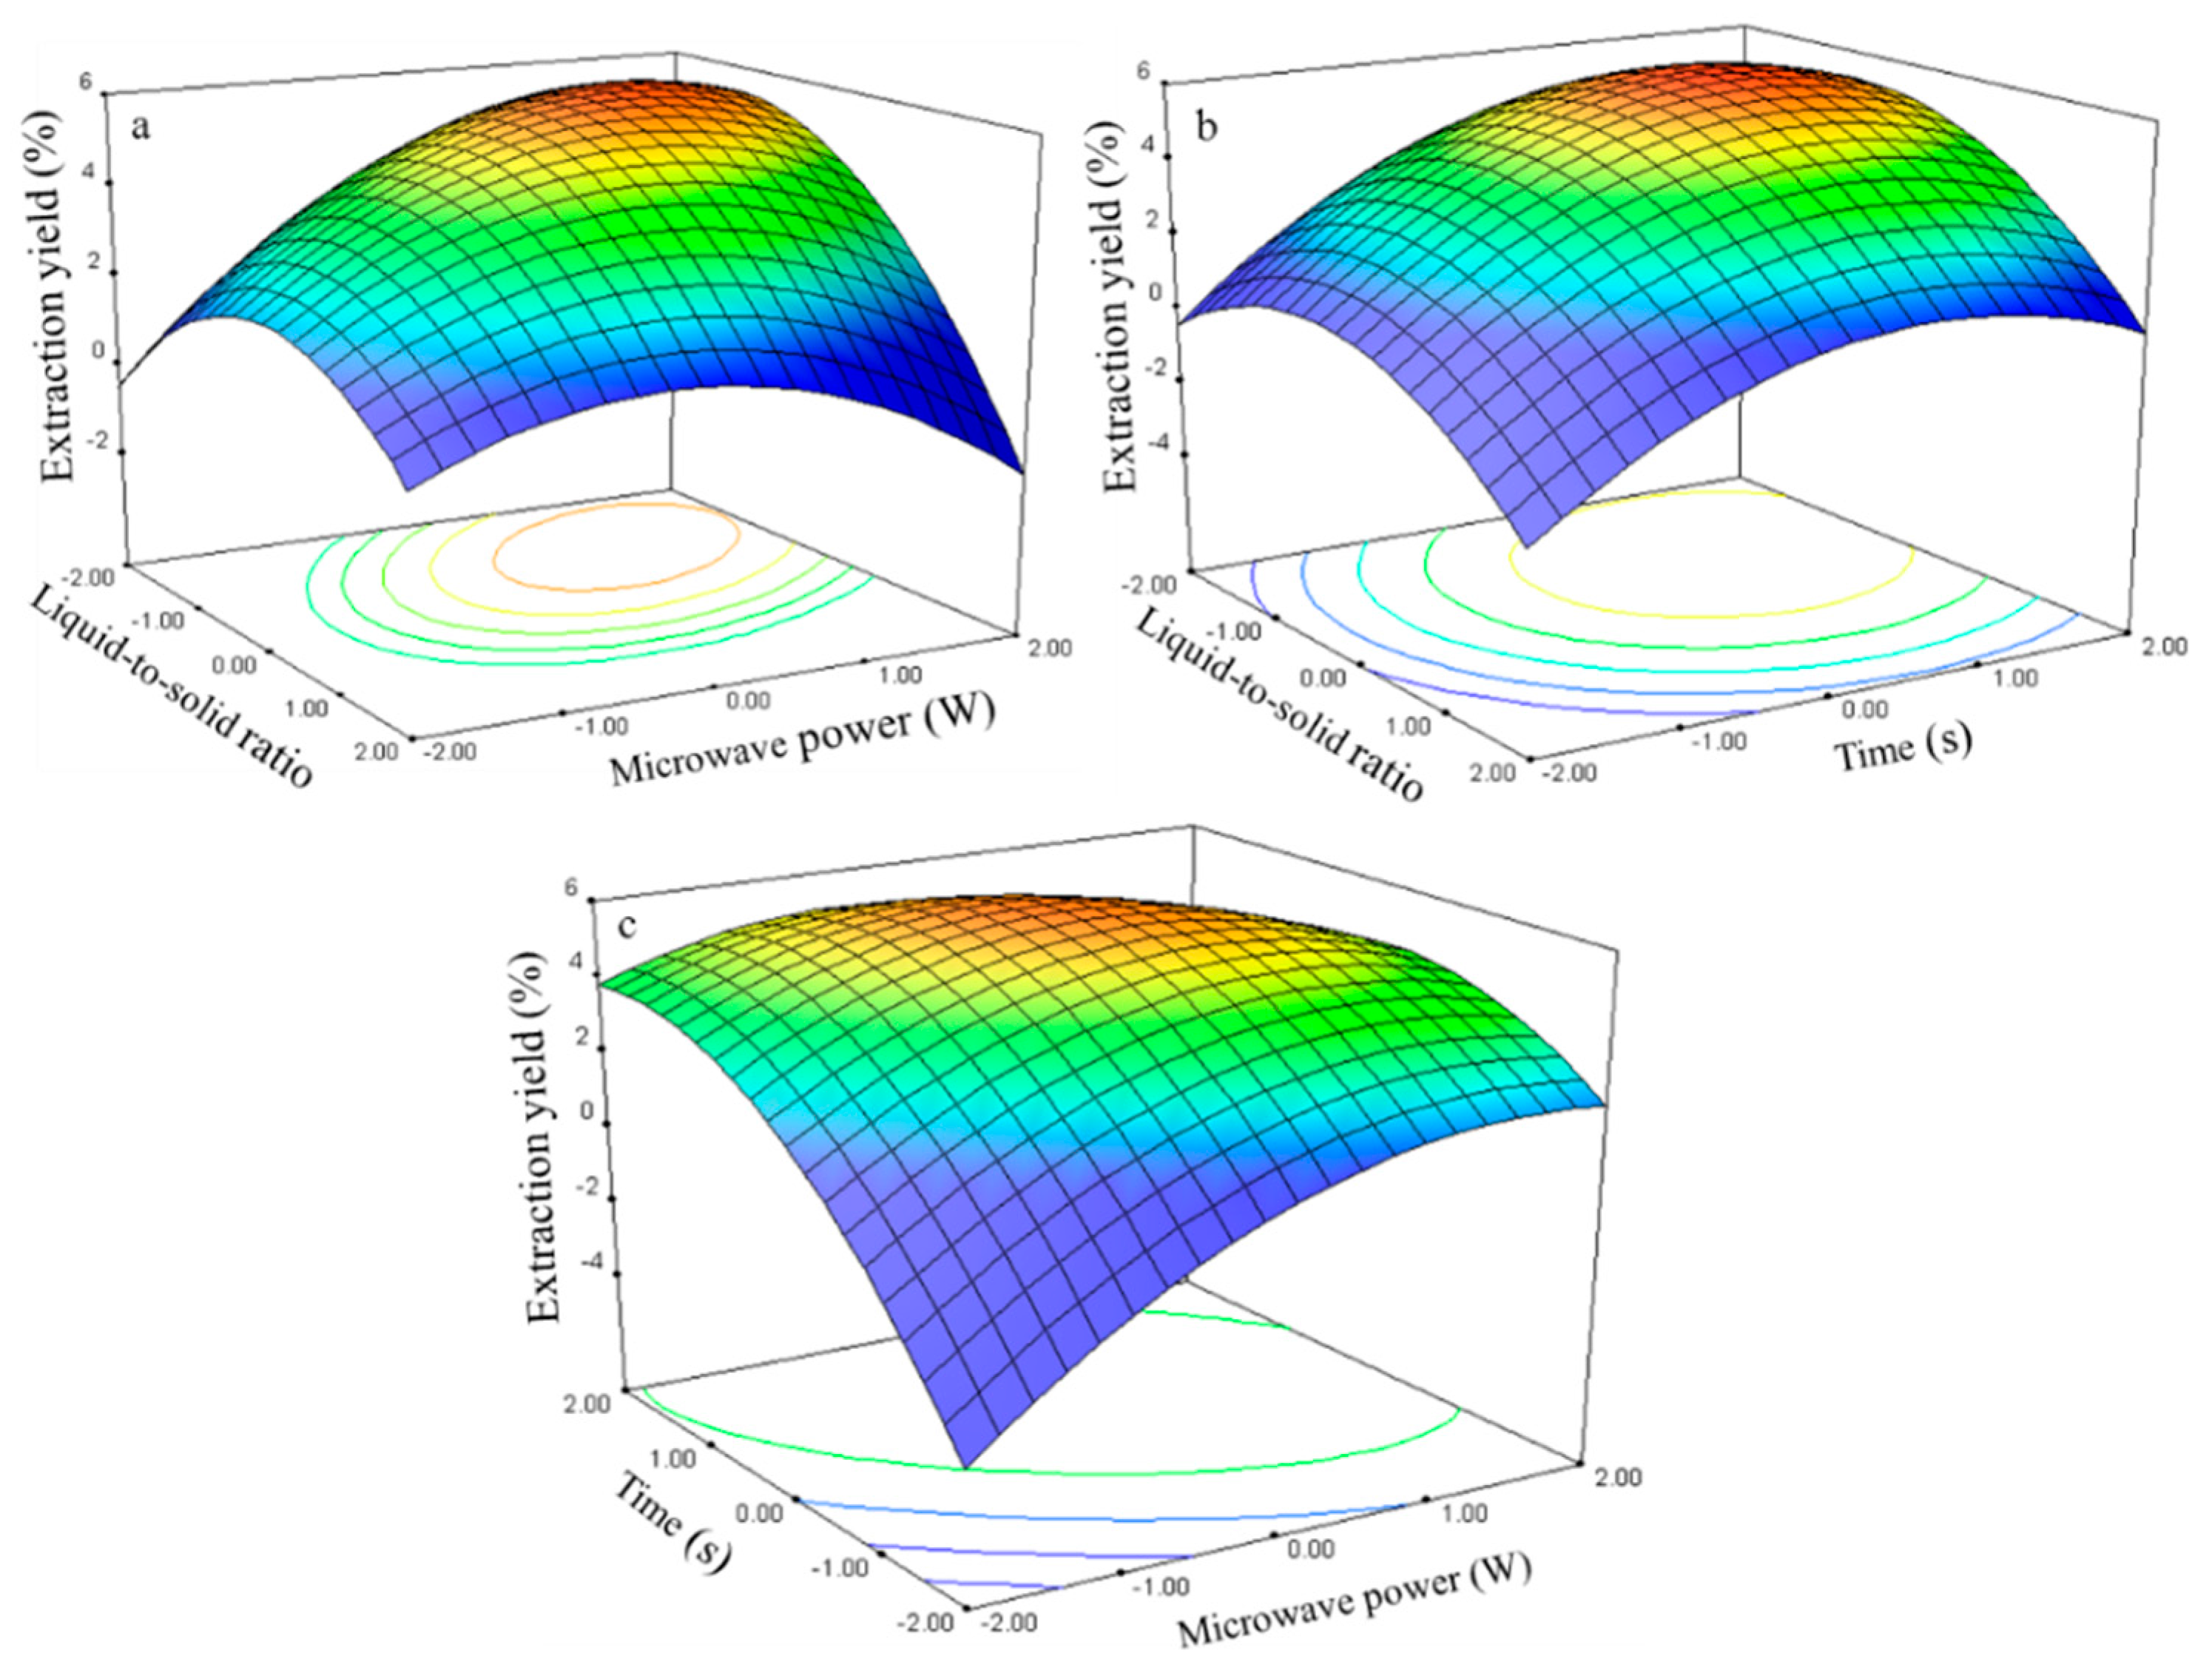
The relationship between the genistein extraction yield and the process variables is depicted in Figure 9. The liquid-to-solid ratio and microwave power effects on the extraction yield at 0 level fixed time are shown in Figure 9a. The genistein extraction yield gradually increased with the ratio and power and peaked at approximately 50–60 and 270–300 W. Further increases in these parameters resulted in decreased genistein extraction yield.
The response surface plots for the time effect on the extraction yield (Figure 9b,c) at constant microwave power and liquid-to-solid ratio show that an appropriate extraction time (75–80 s) had positive effects on the extraction yield.
The genistein regression model for the statistical frequency method of analysis with 95% confidence interval was obtained (X1: −1.31 to −0.79, X2: 0.30 to 0.96, and X3: 0.51 to 1.10) when the extraction yield >0.002% (n = 23). Thus, the optimal conditions were 42.33–55.20, 264.75–297.90 W, and 75.07–80.66 s.

2.2.4. Effect of Process Variables on the Extraction Yield of Kaempferol

The kaempferol extraction yield is presented in Table 2. The regression analysis shows that the extraction yield (Y4, Table 3) was significantly affected by the liquid-to-solid ratio (X1), microwave power (X2), and time (X3), with corresponding contribution rates of 1.06, 1.93, and 2.81. The extraction time had the largest impact on the kaempferol extraction yield.
The relationship between the kaempferol extraction yield and the process variables is depicted in Figure 10. The ratio and power effects on the extraction yield at 0 level fixed time are shown in Figure 10a.
The extraction yield gradually increased with the ratio and power and peaked at approximately 50–75 and 250–300 W. Further increases in these parameters resulted in decreased kaempferol extraction yields. The response surface plots for the time effect on the extraction yield (Figure 10b,c) at constant microwave power and constant liquid-to-solid ratio show that an appropriate extraction time (75–80 s) had positive effects on the extraction yield.
The kaempferol regression model for the statistical frequency method of analysis with 95% confidence interval was obtained (X1: −1.14 to −0.17, X2: 0.11 to 0.78, and X3: 0.44 to 1.12) when the extraction yield was >0.06% (n = 22). Thus, the optimal conditions were 46.5–70.75, 255.45–288.30 W, and 74.35–81.18 s.

2.2.5. Effect of Process Variables on the Extraction Yield of Isorhamnetin

A regression analysis was performed using the experimental data, and the model coefficients were evaluated for significance. The liquid-to-solid ratio (X1), microwave power (X2), and time (X3) significantly affected the isorhamnetin extraction yield (Y5, Table 3), with corresponding contribution rates of 2.85, 2.44, and 2.45. The liquid-to-solid ratio had the largest impact on the isorhamnetin extraction yield.
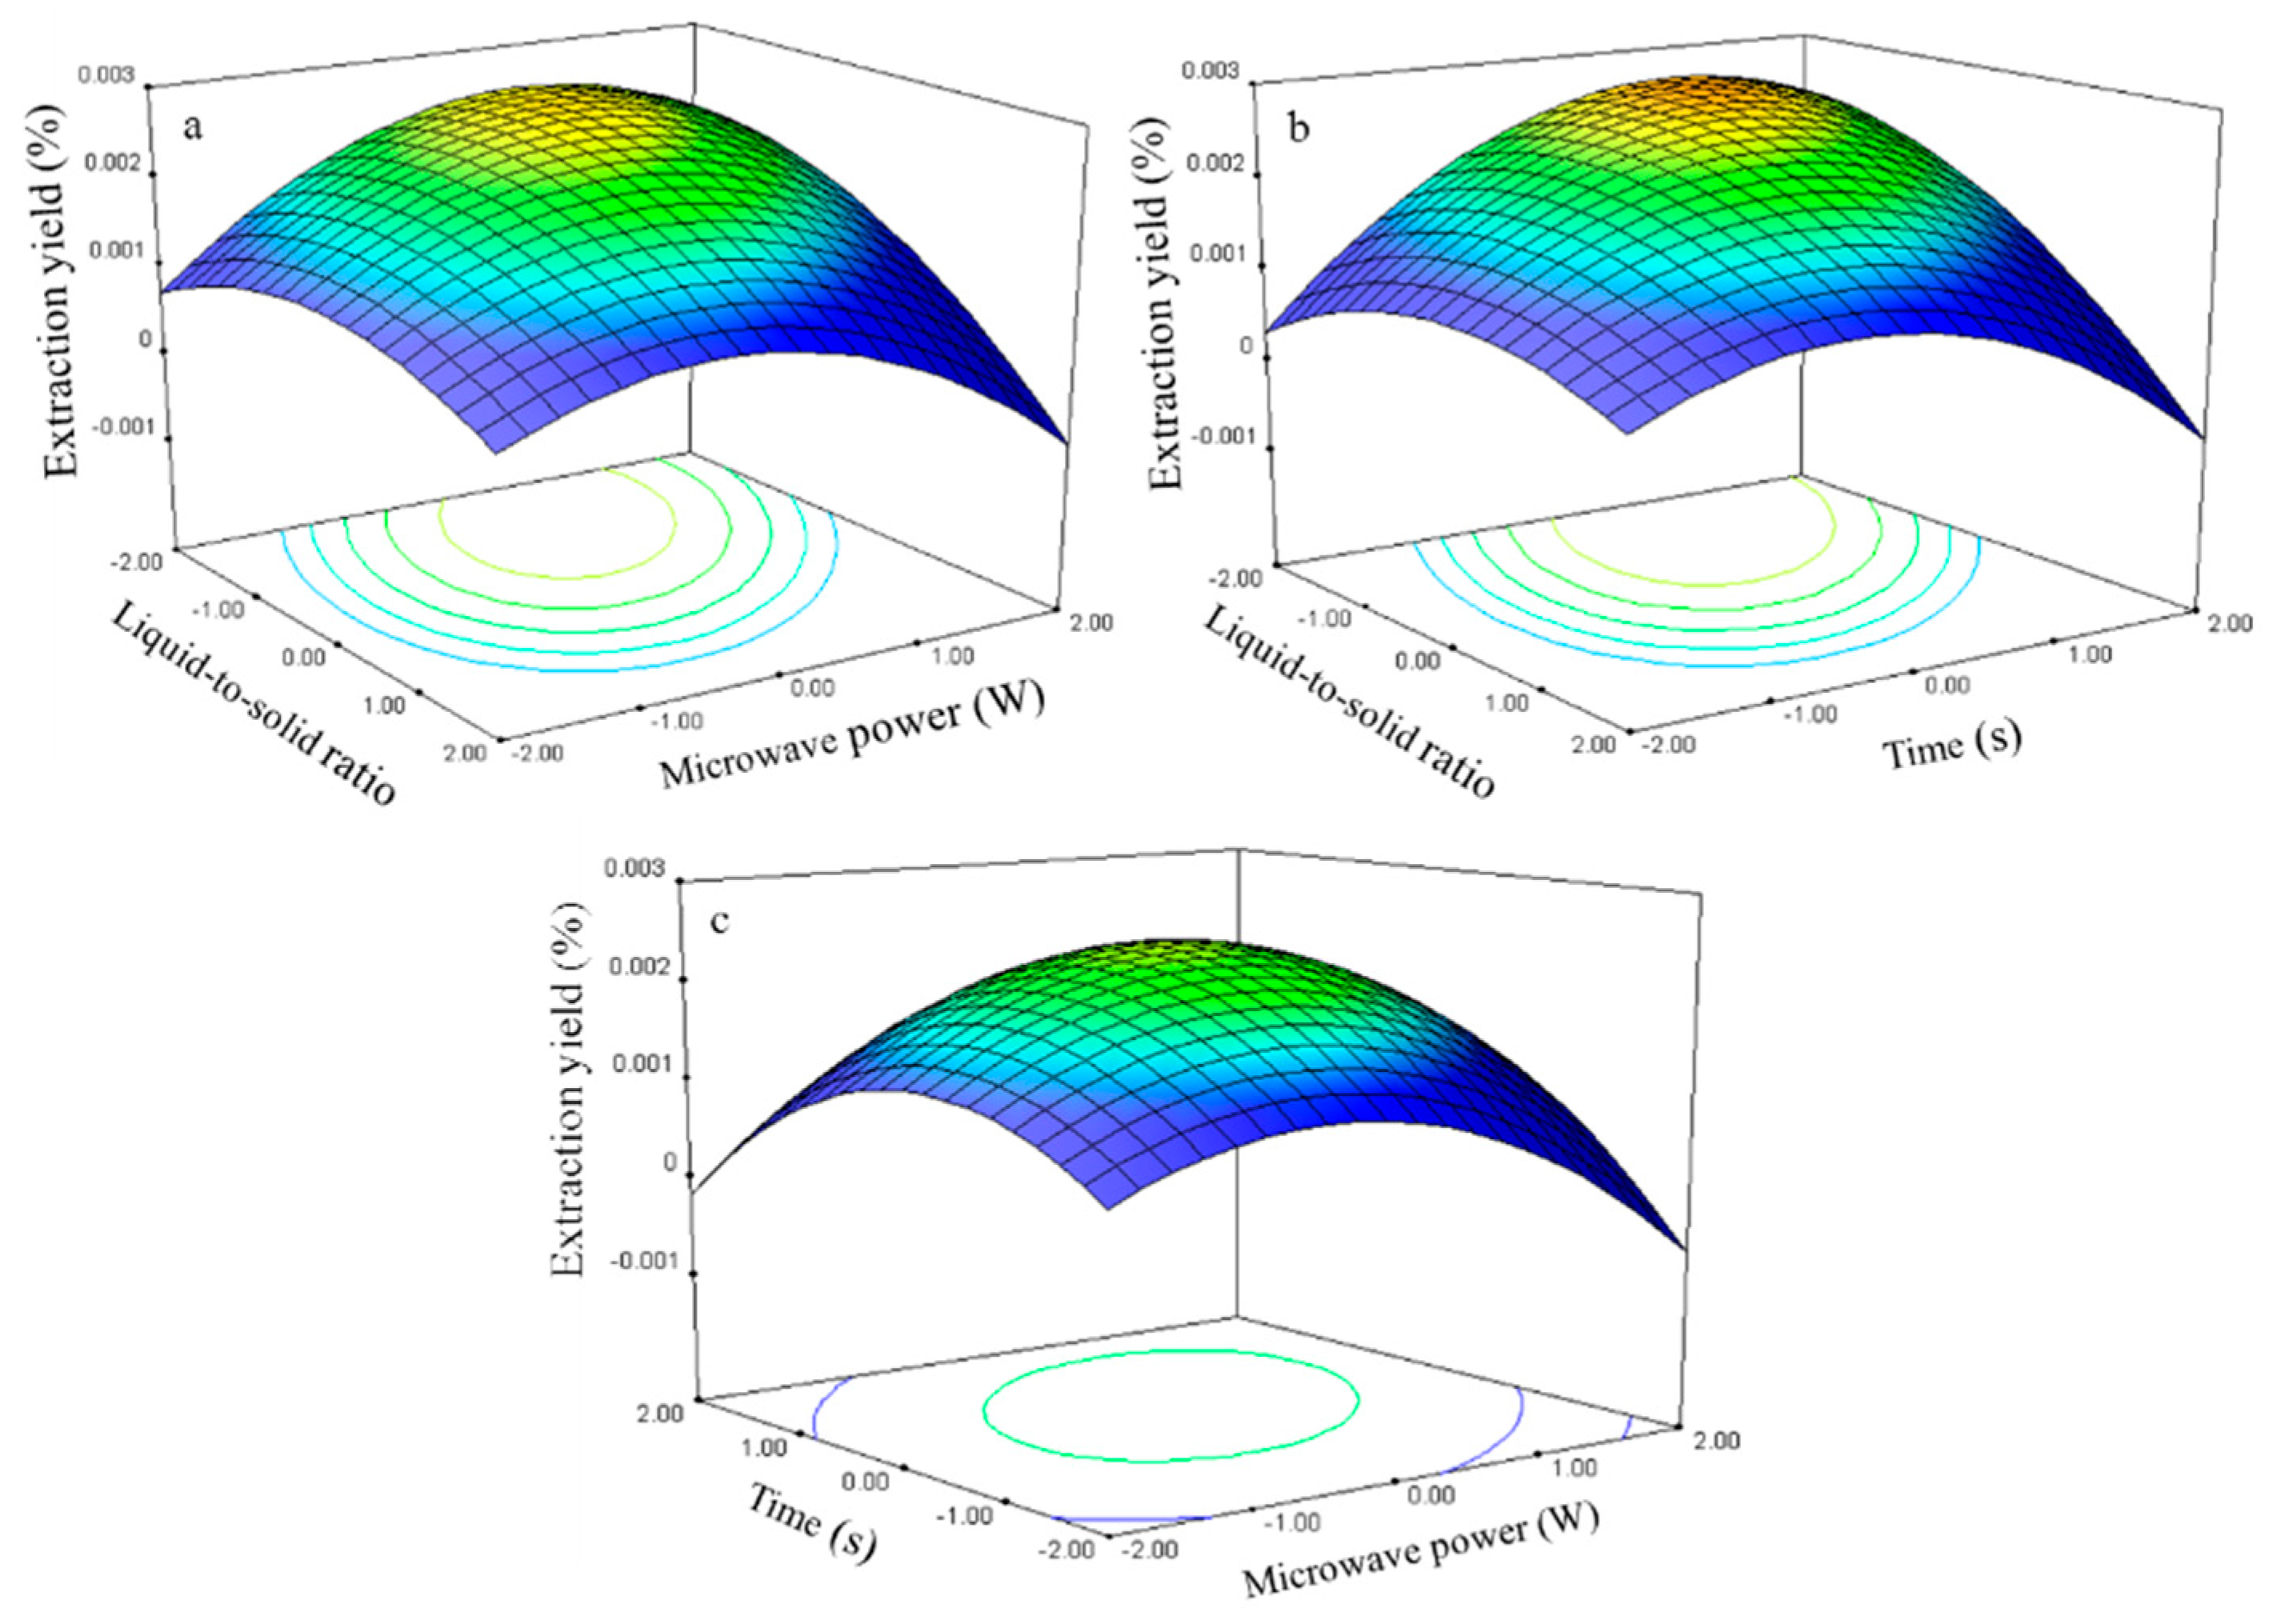
The three-dimensional response surface plots (Figure 11) illustrate the relationship between the isorhamnetin extraction yield and experimental variables. These plots present the response as a function of two factors with another variable constant at its 0 level. Figure 11a shows the interaction effect between the ratio and power when the time was set at its 0 level (70 s) in the isorhamnetin extraction. The isorhamnetin extraction yield gradually increased with the ratio and power and peaked at approximately 40–55 and 275–300 W.
The interaction effect between liquid-to-solid ratio and time at 0 level power (250 W) on isorhamnetin extraction is presented in Figure 11b. The response surface plot shows that the extraction yield of isorhamnetin increased and reached the maximum level at 50–60 for the time interval of 75–80 s.
The interaction effect between power and time at the 0 level liquid-to-solid ratio (75) on isorhamnetin extraction yield is presented in Figure 11c. Strong interaction was observed when the power was set from 250 W to 300 W and time ranged from 70 s to 80 s, which contributed to the increase in extraction yield.
The isorhamnetin regression model for the statistical frequency method of analysis with 95% confidence interval was obtained (X1: –1.33 to –0.81, X2: 0.58 to 1.15, and X3: 0.58 to 1.15) when the extraction yield was >0.16% (n = 21). Thus, the optimal conditions were 41.83–54.70, 278.80–307.35 W, and 75.76–81.47 s.

2.3. Optimization of the Extraction Process

Table 4 indicates the optimum microwave-assisted conditions for the extraction of the five major constituents from FSI using RSM. Thirty accurately weighed samples (i.e., 0.5 g samples filtered through a 100 mesh sieve) were added to 25 mL 100% MeOH and divided into six groups. A sample set was extracted under the optimum single ingredient conditions (obtained using statistical software), and the predicted results fitted well with the experimental results (Table 4).
The following optimum extraction conditions were obtained on the basis of the statistics frequency method: liquid-to-solid ratio, 50; microwave power, 287 W; and extraction time, 80 s. Six accurately weighed samples (i.e., 0.5 g samples filtered through a 100 mesh sieve) were added to 25 mL of extracted 100% MeOH. The optimum extraction conditions were obtained through the statistics frequency method (Table 4). The calculated extraction yields of the statistical frequency condition were compared with the actual extraction yields under optimum conditions.
The results show that the significant results obtained in the genistein extraction yields are insignificant unlike the other four constituents. Therefore, the optimum extraction conditions for the simultaneous extraction of the five ingredients can be obtained through the statistical frequency method. The optimum extraction condition for one ingredient can be obtained through the single-component method.
With the development of the “green chemistry” and “green extraction” concept during the past years, reduce energy consumption, safe, robust, and environmentally friendly extraction techniques are becoming more toward and popular [94,95]. Green extraction is based on the discovery and design of extraction processes, which will reduce energy consumption, allows use of alternative solvents and renewable natural products, and ensure a safe and high quality of extract/product [94,95]. The principles of green extraction are renewable plant resource instead of non-renewable resources, green and alternative solvents, reduce energy consumption and heat production, safe and robust to extraction processes [94]. In the present study, six factors, namely extraction solvent type, sample particle size, frequency, liquid-to-solid ratio, microwave power, and extraction time, were investigated first to optimize the extraction solvent type, sample particle size, and frequency. Additionally, the levels of the response surface experimental design factors (liquid-to-solid ratio, microwave power, and time) were determined according to the liquid-to-solid ratio, microwave power, and extraction time optimized in the single factor tests. Higher yields of the constituents were green extracted from FSI using a renewable raw material, green extraction solvent, less solvent, lower extraction power, reduce energy consumption, more economical, and simultaneously and considerably decreasing the extraction time. TCMM and natural product green extraction, according to the principle of green extraction, is a new concept to meet the future trends [94,95].

2.4. Optimization of UHPLC-ESI-Q-TOF MS/MS Conditions

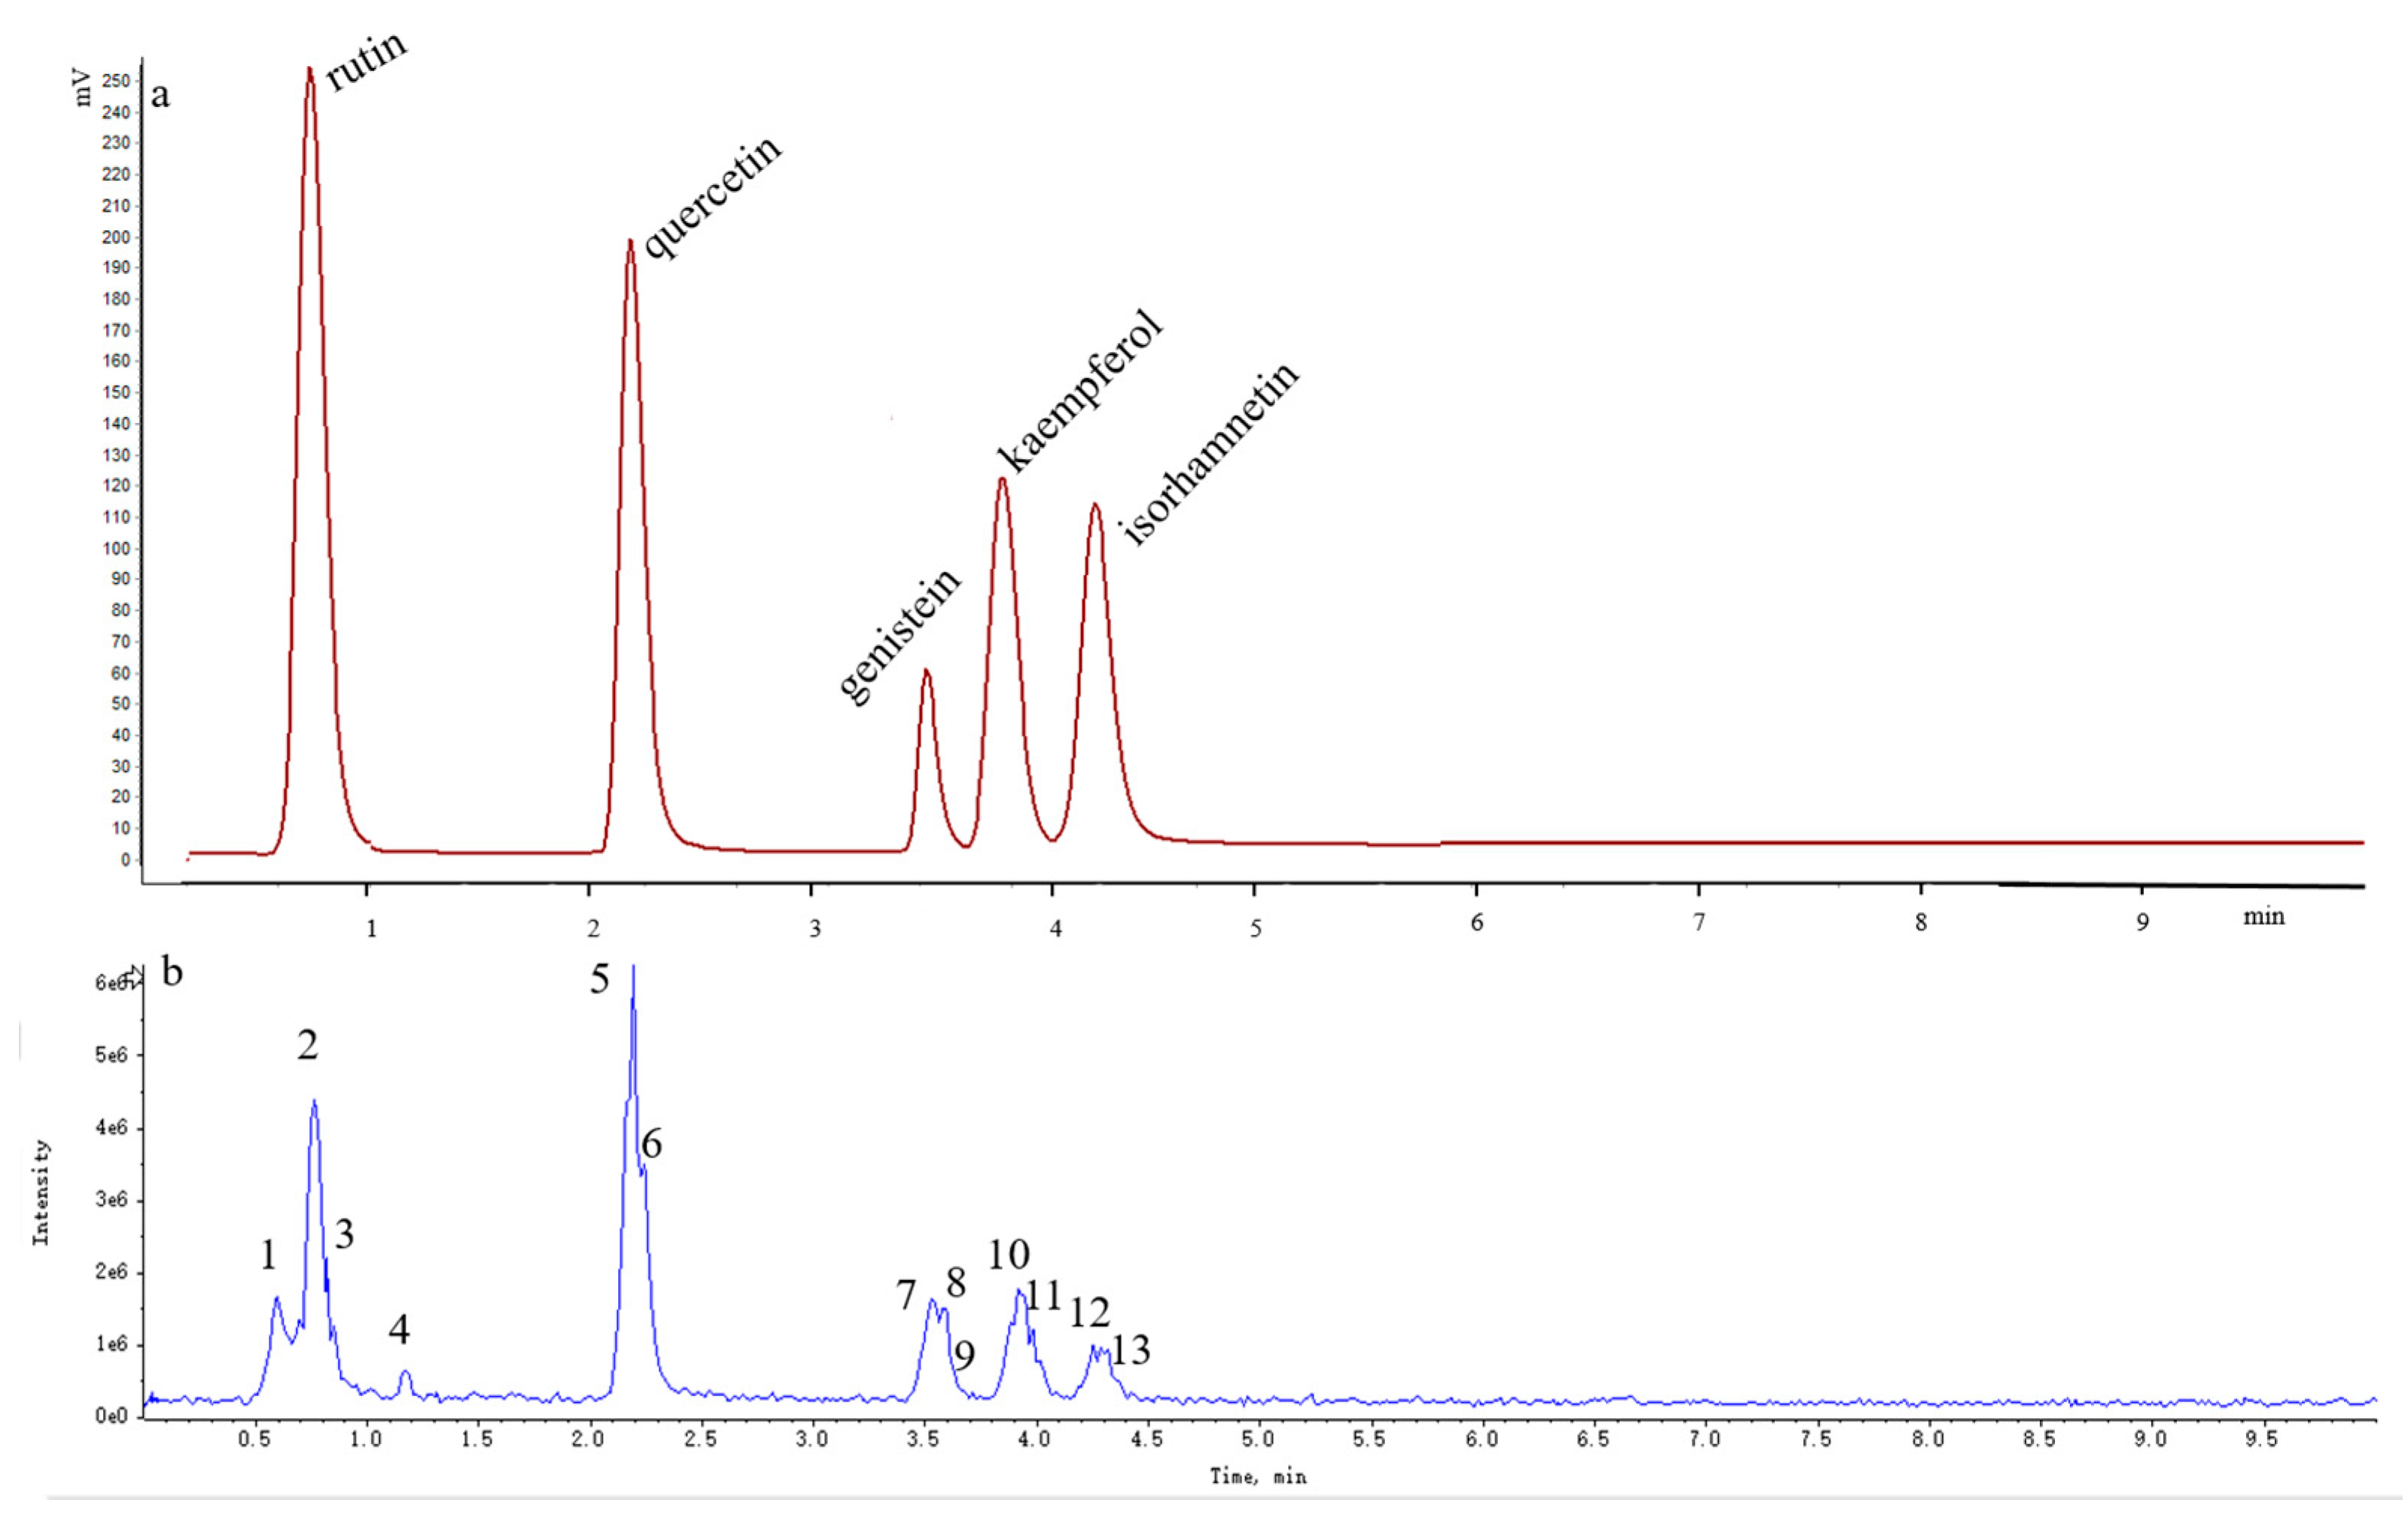
Isocratic and gradient LC were tested to optimize the separation conditions of all constituents. Various UHPLC conditions, such as mobile phase, gradient program, column, column temperature, and flow rate were optimized systematically in a preliminary test to improve the separation efficiency of analytes over short analysis times. Two analytical columns, namely, an Acquity UPLC® BEH C18 column (100 mm × 2.1 mm, 1.7 μm, Waters, Wexford, Ireland) and a Kinetex C18 column (100 mm × 2.1 mm, 2.6 μm, Phenomenex, Torrance, CA, USA), were compared. Results showed that although all of the compounds could be separated satisfactorily, chromatograms with better peak shapes and shorter analysis times were obtained with the Acquity UPLC® BEH C18 column (100 mm × 2.1 mm, 1.7 μm). Thus, this column was selected as the analytical column in subsequent experiments.
Different mobile phases (water/acetonitrile, water/methanol, 0.1% formic acid/acetonitrile, 0.1% formic acid/methanol, 0.2% phosphate/acetonitrile, 0.2% phosphate/methanol, 0.5% acetic acid/acetonitrile, 0.5% acetic acid/methanol), flow rates (0.10, 0.12, 0.15, 0.20, 0.25, 0.30, 0.35, 0.40, and 0.45 mL/min), and column temperatures (30, 35, 40, 45, 50, 55, and 60 °C) were also examined and compared. Considering the results obtained, we selected the isocratic mobile phase consisting of 0.1% aqueous formic acid and acetonitrile (71:29, v/v), column temperature of 40 °C, and flow rate of 0.35 mL/min (Figure 12) for subsequent investigations.

2.5. Qualitative Analysis

Over 13 peaks were detected within 10 min in the mass spectrometry total ion current (TIC) chromatograms obtained in positive and negative modes. The molecular weights of these 13 compounds were determined on the basis of their positive and negative ion mass spectra.
Thirteen peaks, including those of rutin, quercetin, genistein, kaempferol, isorhamnetin, and their isomers, were identified using authentic standards and simultaneously quantified in the FSI extracts. The retention times, formulas, and MS/MS fragmentation data of the 13 compounds are summarized in 
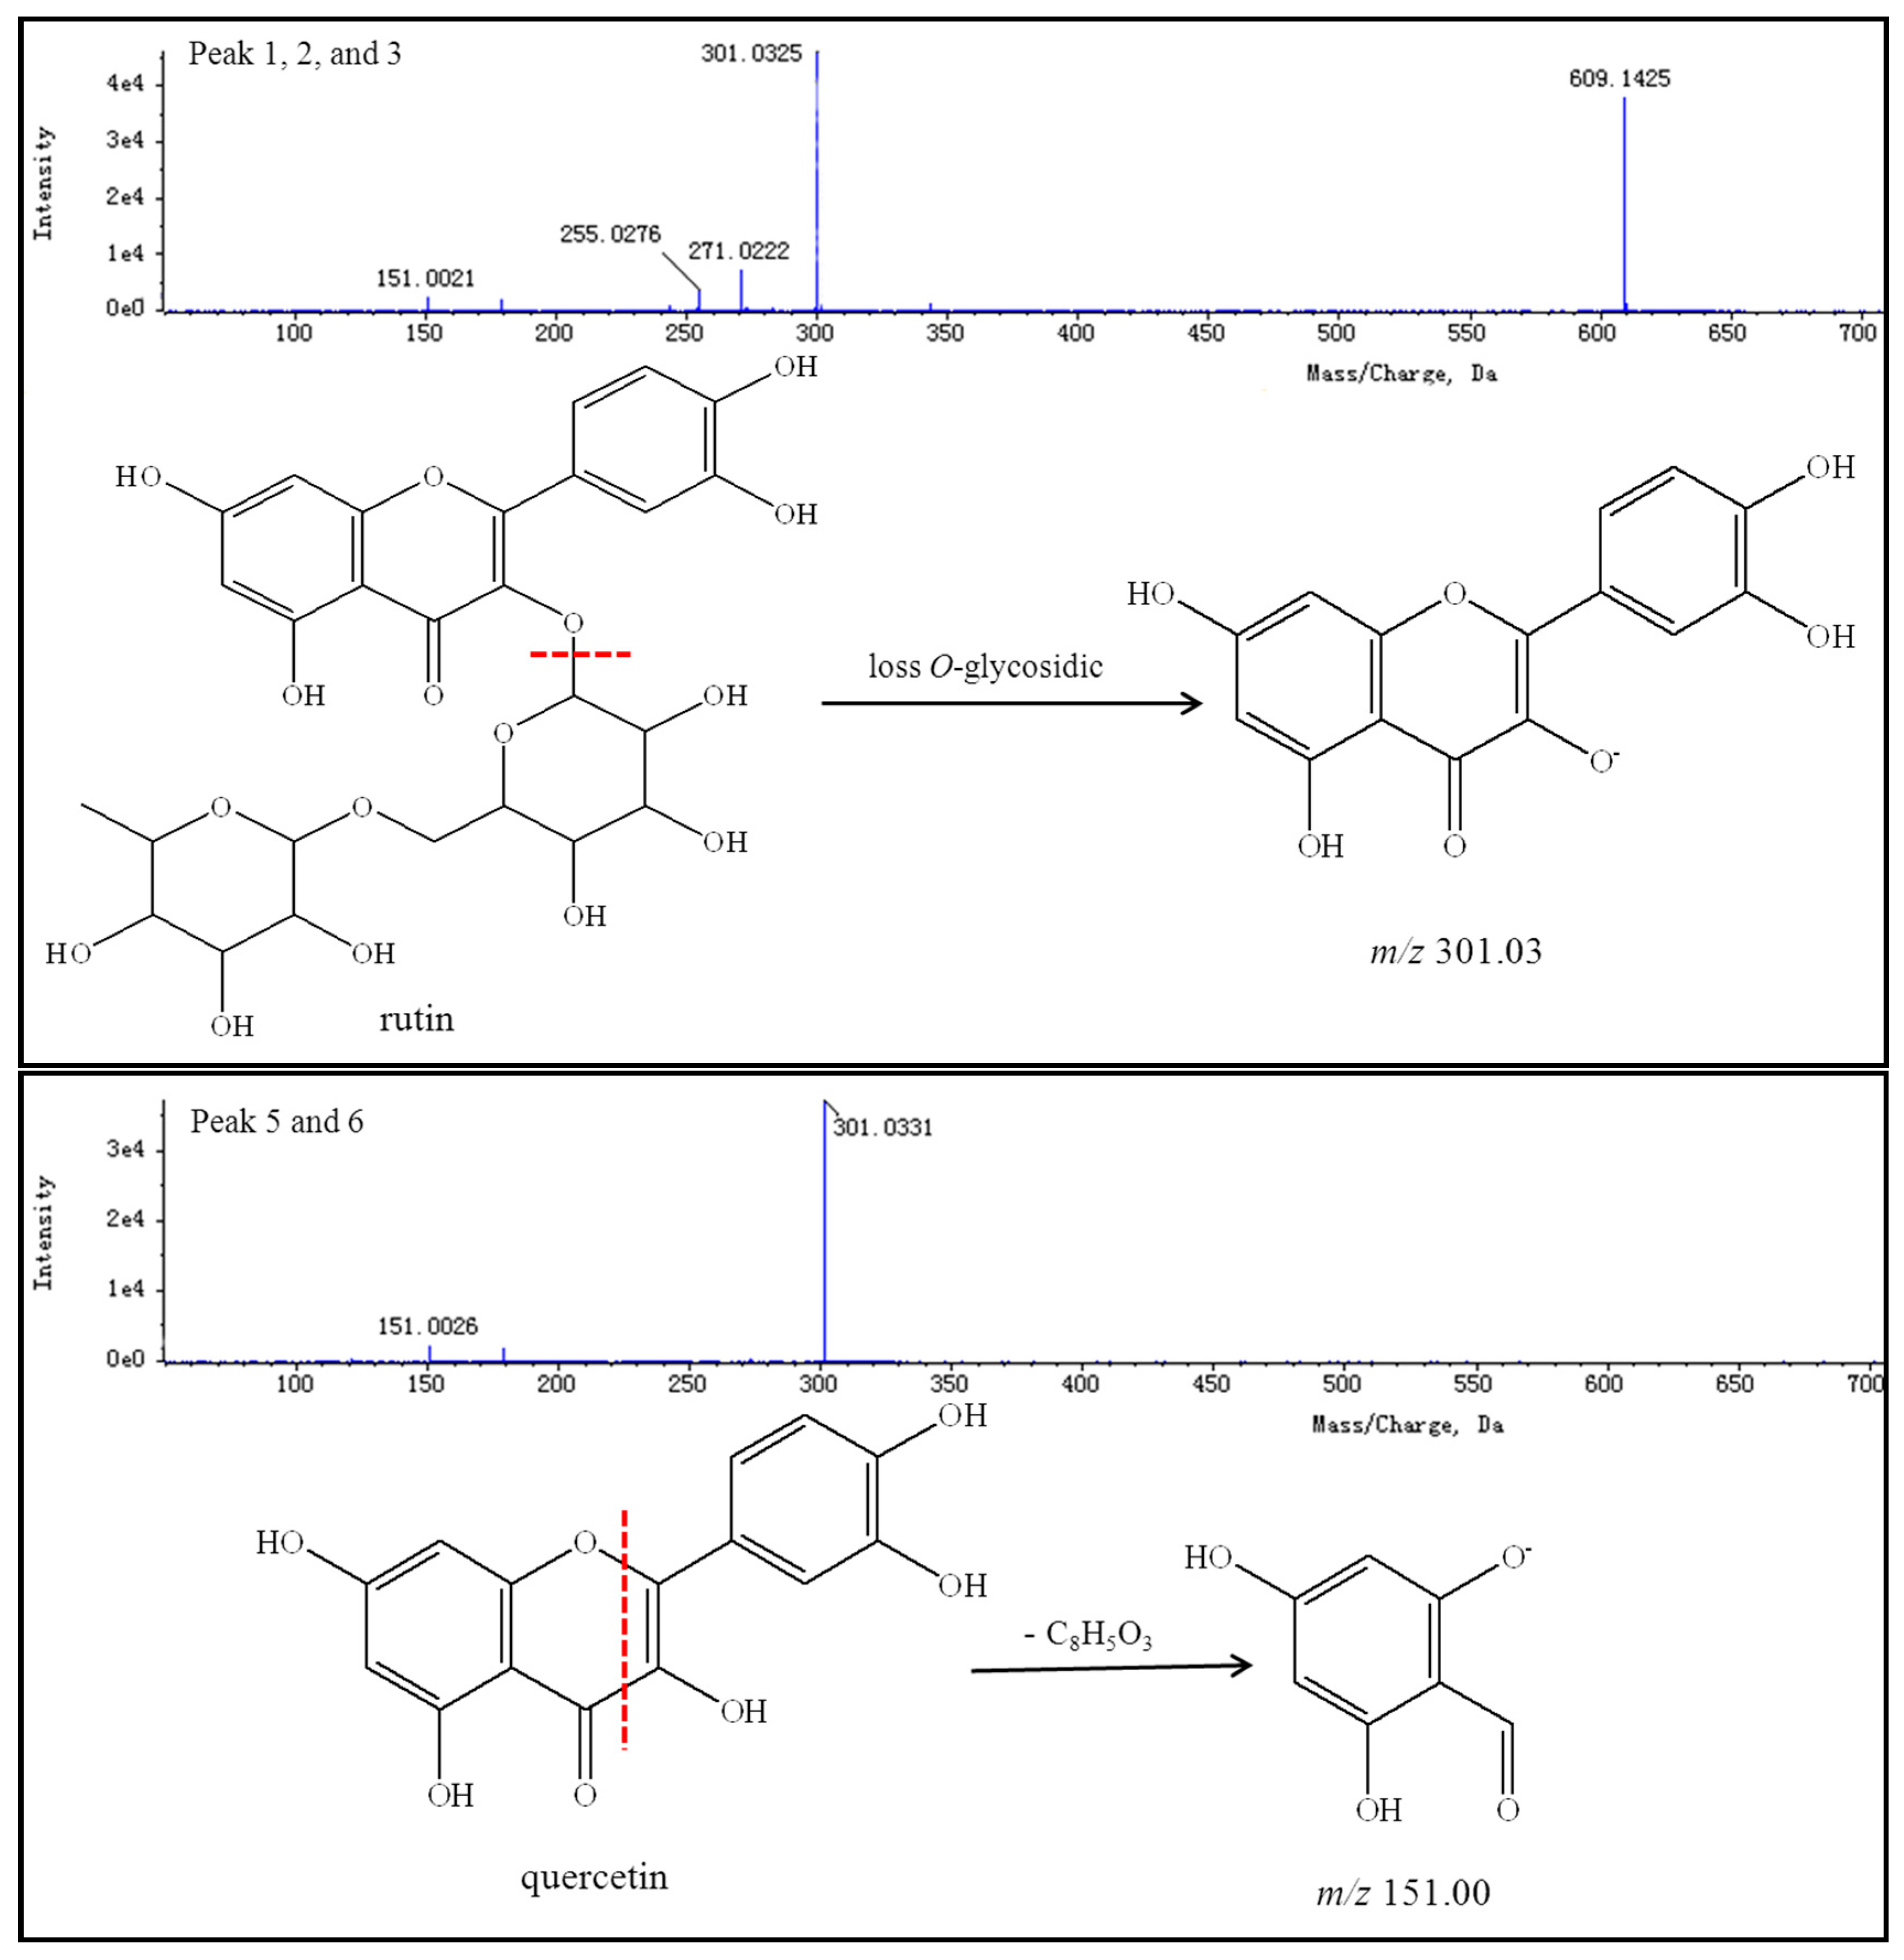
Table 5. Possible structures and fragmentation schemes are shown in Figure 13; this information was deduced by carefully studying the MS and MS/MS spectral data of each compound and comparing findings with literature values. Peaks 1–3 reveal a group of isomers with a molecular weight of 610 and chemical formula of C27H30O16. The MS2 spectra of compounds 13 showed that the most abundant fragment peak at m/z 301.03 may be attributed to elimination of O-glycosidic groups from the precursor ion at m/z 609.14. Peaks 1–3 were unambiguously identified as rutin (including its isomers) by comparison with literature values [92,96].
Peaks 5 and 6 indicate a group of isomers with a molecular weight of 302 and chemical formula of C15H10O7. The MS2 spectra of compounds 5 and 6 showed the most abundant fragment peaks at m/z 151.00 (negative ion mode) and m/z 153.02 (positive ion mode) were appeared. Peaks 5 and 6 were identified as quercetin (including its isomers) by comparison with literature values [83,92,96].
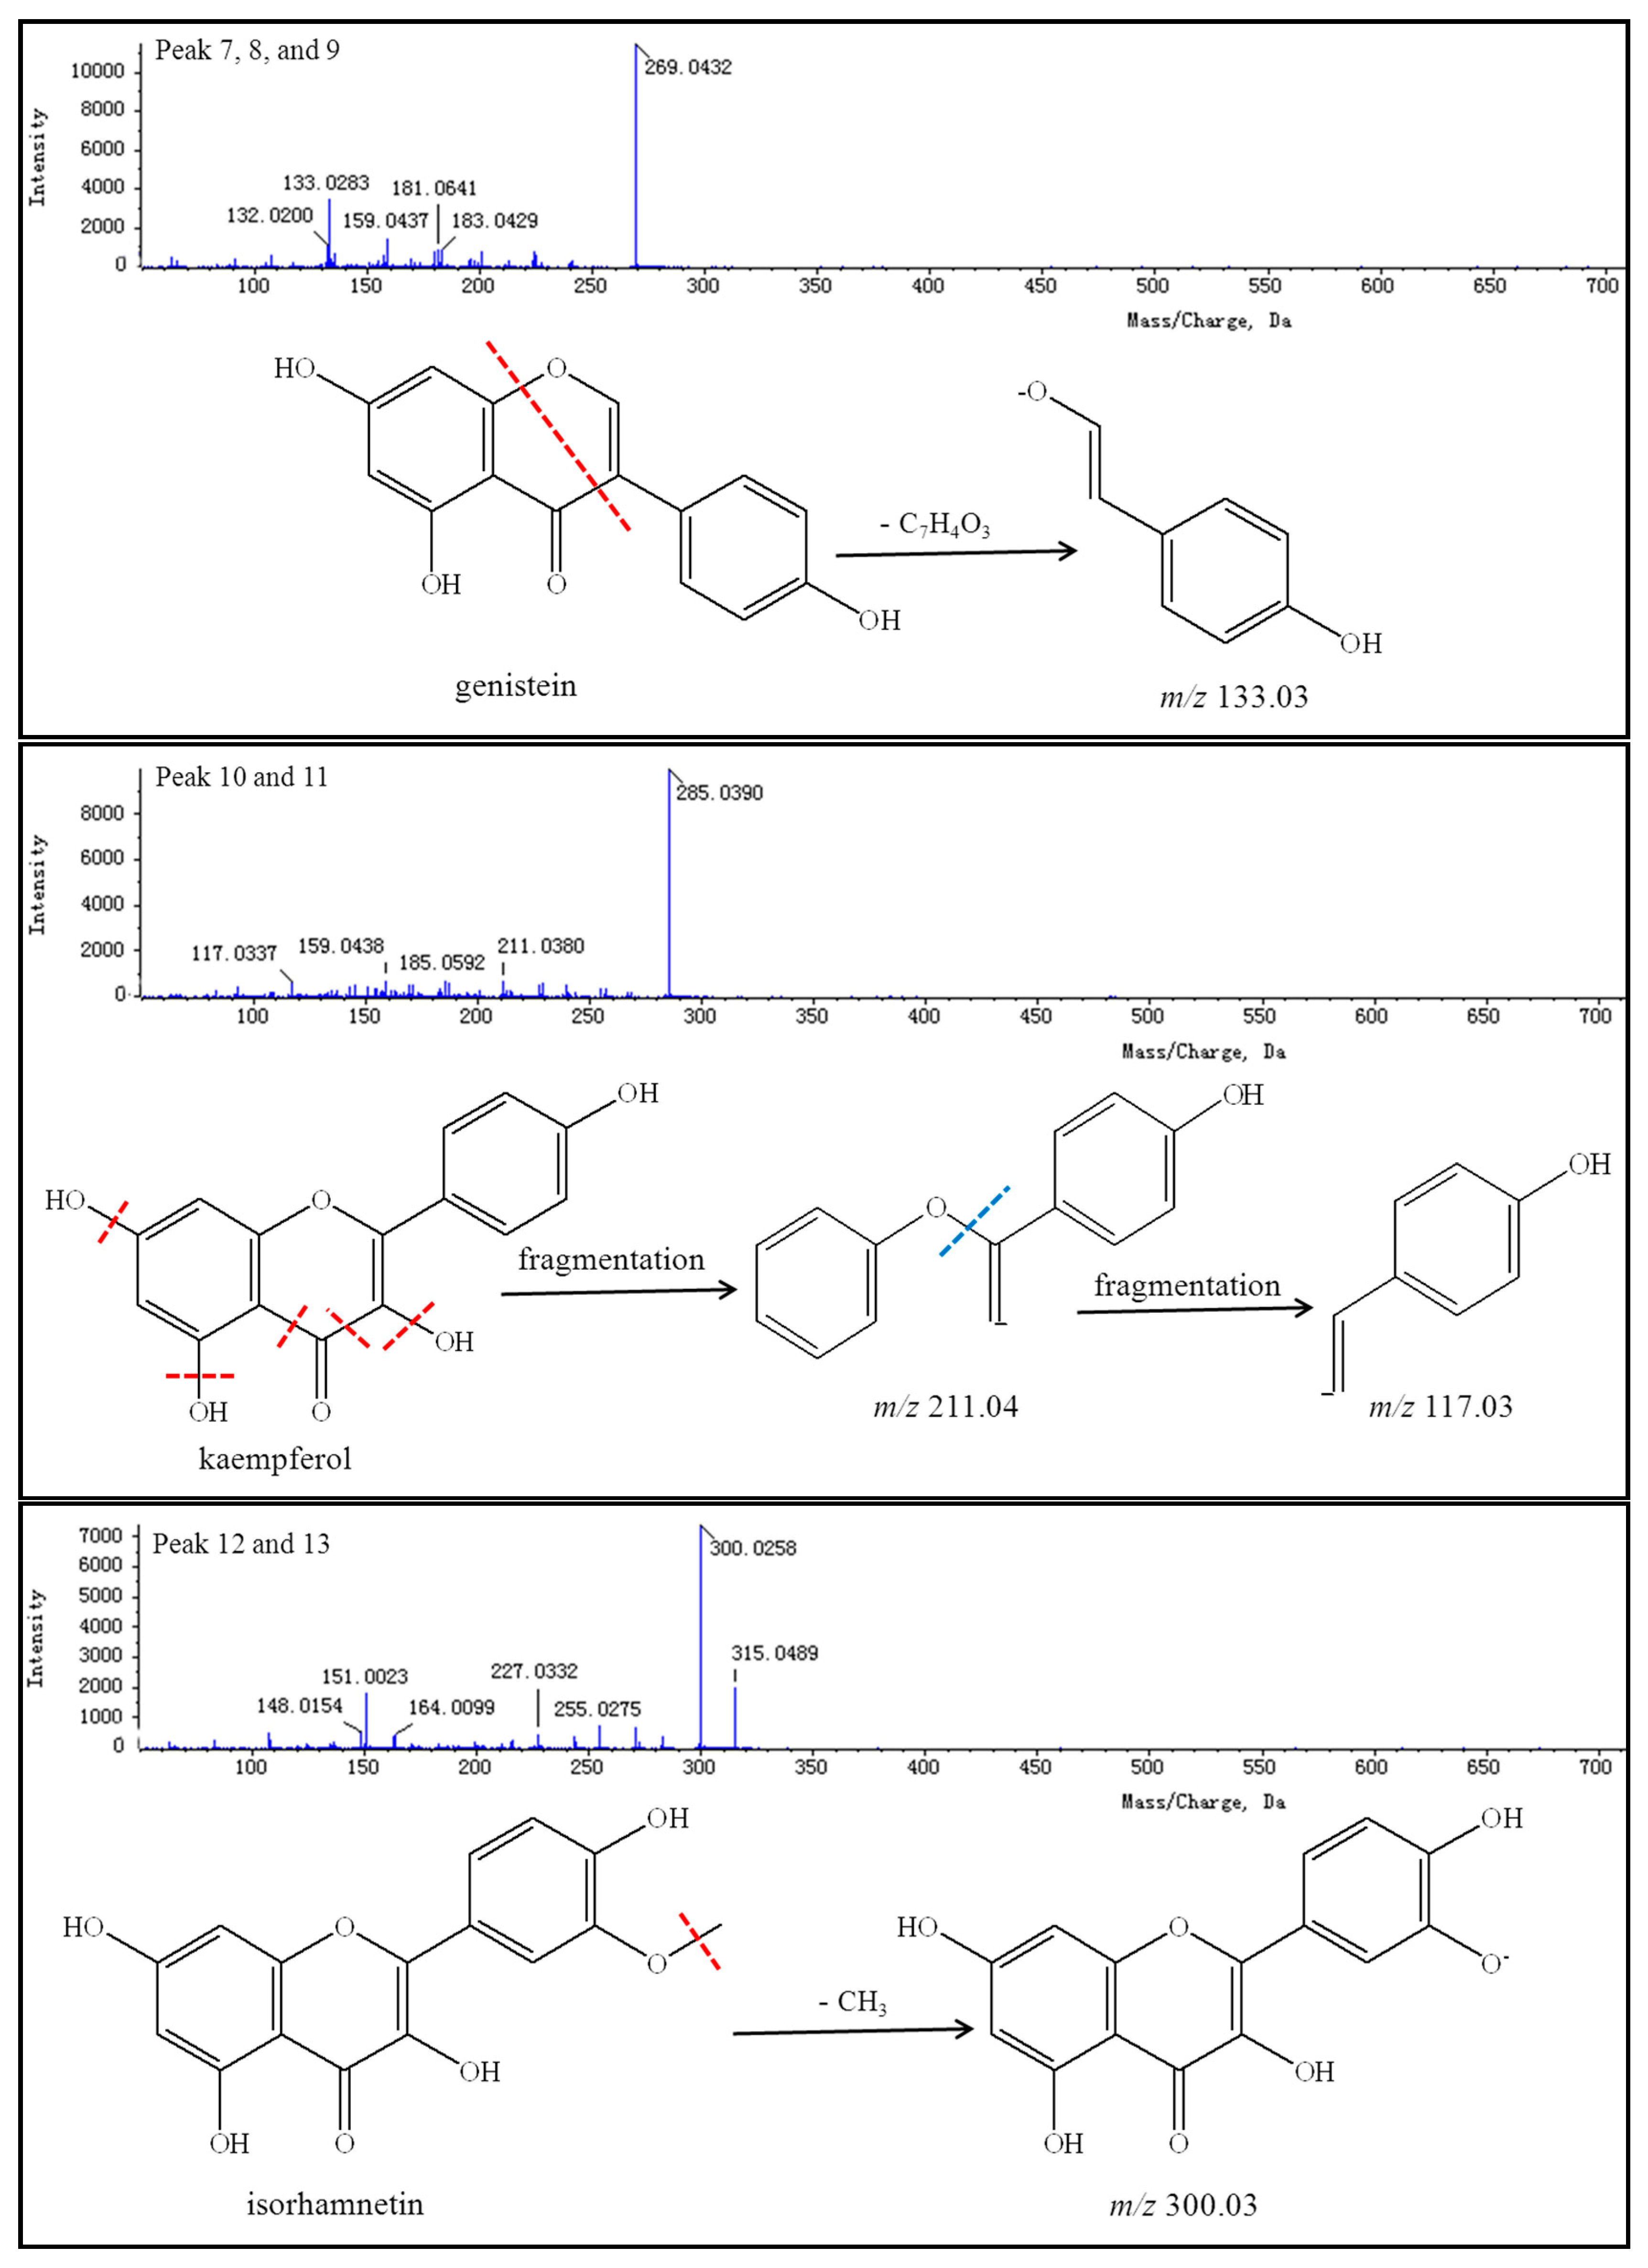
Peaks 7–9 reveal a group of isomers with a molecular weight of 270 and chemical formula of C15H10O5. The MS2 spectra of compounds 79 showed that most the abundant fragment peak at m/z 133.03 may be attributed to cleavage of C-O and C-C bonds from the precursor ion at m/z 269.04. Peaks 7–9 were finally identified as genistein (including its isomers) by comparison with literature values [96].
Peaks 10 and 11 reflect a group of isomers with a molecular weight of 286 and chemical formula of C15H10O6. The MS2 spectra of compounds 10 and 11 showed the most abundant fragment peaks at m/z 211.04 and m/z 117.03 (negative ion mode). Peaks 10 and 11 were subsequently identified as kaempferol (including its isomers) by comparison with literature values [96].
Peaks 12 and 13 demonstrate a group of isomers with a molecular weight of 316 and chemical formula of C16H12O7. The MS2 spectra of compounds 12 and 13 showed that the most abundant fragment peak at m/z 300.03 (negative ion mode) may be attributed to the loss of a methyl radical from the precursor ion at m/z 315.05. Peaks 12 and 13 were thus identified as isorhamnetin (including its isomers) by comparison with literature values [83,92].
Considering that rutin, quercetin, genistein, kaempferol, and isorhamnetin present extensive biological activities, developing a quality control method based on the content of these compounds is necessary.

2.6. Quantitative Analysis

The UHPLC method was fully validated for quantitative determination. Linear regression equations, correlation coefficients, and ranges of calibration curves for the listed compounds are shown in Table 6. Correlation coefficients R2 > 0.9990 indicated excellent correlations between the concentrations of the investigated compounds and their PAs within the tested ranges. Constituent contents were calculated using the relevant calibration curves. The LODs and LOQs of the five compounds were in the range of 13.7661–2684.4763 ng/mL and 24.2013–8948.2543 ng/mL, respectively. Analytical variations in intra- and inter-day (retention time and area) RSD% were less than 2.8330% for all five constituents, as shown in Table 7. The PA RSD% of all five constituents after 0, 1, 2, 4, 8, 12, 24, 48, 72, and 96 h was less than 0.4841%; these results imply that the extract solutions are very stable. The RSD% (retention time and area) of six samples from the same batch (repeatability) of material was less than 0.3748% for all five compounds (Table 7). The recoveries of the five compounds exceeded 95.1217%, and RSD% less than 1.8041% (Table 8). These results indicate that the proposed UHPLC method is sensitive, repeatable, and accurate for the quantitative analysis of active compounds in FSI.

3. Experimental Section

3.1. Chemicals and Materials

Acetonitrile (HPLC-grade), ethanol (HPLC-grade), and methanol (HPLC-grade) were purchased from Fisher Scientific, Inc. (Pittsburgh, PA, USA). Water (HPLC-grade) was purified using a Milli-Q Plus system (Millipore, Bedford, MA, USA). Standard samples of rutin, quercetin, genistein, kaempferol and isorhamnetin were obtained from the National Institutes for Food and Drug Control (Beijing, China). FSI was collected from an experimental field at Beibei District, Chongqing City, and Quanzhou County, Guilin City, Guangxi Autonomous Region in China during harvest time. Materials were confirmed based on morphological, microscopic, and physiochemical analyses according to the Chinese Pharmacopoeia [8]. Voucher specimens were deposited in the Institute of Material Medical Planting, Chongqing Academy of Chinese Materia Medica. Samples were sun-dried and ground into powder.

3.2. Experimental Design

3.2.1. Single Factor Tests

The extraction of the five major ingredients under different conditions was investigated by first employing single factor tests to determine the optimal extraction solvent, particle size, extraction frequency, liquid-to-solid ratio, microwave power, and extraction time. The five major ingredients of FSI were extracted using MARS 6 microwave reaction system (CEM Co., Ltd., Matthews, NC, USA). Each extracted solution was passed through a 0.22 μm syringe filter (Tianjin Jinteng Experimental Equipment Co., Ltd., Tianjin City, China) and collected into a 1.5 mL vial. An aliquot (1 μL) of each solution was injected into the UPLC system for analysis.

Solvent Selection

Each extract (0.5 g of dried powder sieved through 60 mesh) was mixed with extraction solvent (50 mL of 100% MeOH, 80% MeOH, 60% MeOH, 40% MeOH, 20% MeOH, 100% EtOH, 80% EtOH, 60% EtOH, 40% EtOH or 20% EtOH, pre-leaching 30 min) in a 100 mL-volume tube to determine the optimal extraction solvent. The working microwave power rating was 200 W, and extraction time was 40 s. Experiments were conducted in triplicate (30 experimental treatments), and extraction yield was expressed as a percentage using the following equation: extraction yield (%) = ingredient weight/sample weight × 100.

Particle Size Selection

Each extract [0.5 g of dried powder sieved through different meshes (20, 40, 60, 80, and 100 mesh)] was mixed with 100% MeOH (50 mL, based on the results from solvent selection section, pre-leaching 30 min) to determine the optimal particle size. The experiments were conducted in triplicate (15 experimental treatments). Extraction conditions were performed at working microwave power of 200 W and extraction time of 40 s.

Extraction Frequency

Each extract (0.5 g of dried powder and sieved through 100 mesh based on the results of particle size selection section) was mixed with 50 mL of 100% MeOH and experiments were conducted 1×, 2×, and 3× to determine the optimal extraction frequency. The working microwave power and time were 200 W and 40 s, respectively. The experiments were also performed in triplicate (9 experimental treatments).

Liquid-to-Solid Ratio Selection

Each extract (0.5 g of dried powder) was dissolved in different volumes of 100% MeOH (200, 100, 50, 25, 10 and 5 mL, pre-leaching 30 min) to determine the optimal liquid-to-solid ratio. Experiments were conducted in triplicate (18 experimental treatments) and extracted once (based on the results of extraction frequency section). The working microwave power was 200 W and extraction time was 40 s.

Microwave Power Selection

Each extract (0.5 g of dried powder) was mixed with 40% MeOH (25 mL, based on the results of liquid-to-solid ratio selection section, pre-leaching 30 min). Different microwave power levels of 100, 150, 200, 250, 300, and 350 W were applied to determine the best microwave power for extraction. The working time was 40 s. The experiments were performed in triplicate (18 experimental treatments), and extraction was performed once per experiment.

Extraction Time Selection

Each extract (0.5 g of dried powder) was mixed with 25 mL of 100% MeOH (pre-leaching 30 min). The working microwave power was 200 W, and extraction was performed once. Extractions were performed for 20, 30, 40, 50, 60, 70, 80, and 90 s to determine the optimal extraction time. Experiments were conducted in triplicate (24 experimental treatments).

Central Composite Design

Single-factor tests were employed to determine the preliminary range of the extraction variables, namely, liquid-to-solid ratio (X1), microwave power (X2), and extraction time (X3). A three-factor-five level rotatable central composite design was then employed to determine the combination of extraction variables that would yield the largest amount of five constituents [97,98,99,100]. The coded values of the experimental factors and factor levels were used in the response surface analysis that was run 20× (Table 2) and performed in triplicate. Extraction yields showed that the response variables were fitted to a quadratic polynomial model. The quadratic model for each response was as follows [68]:
Y = A 0 + i = 1 3 A i X i + i = 1 3 A i i X i 2 + i = 1 2 j = i + 1 3 A i j X i X j
where Y is the predicted response, A0 is a constant that fixes the response at the central point of the experiment, Ai is the regression coefficient for the linear effect of term, Xi is the independent variable, Aii is the quadratic effect term and Aij is the interaction effect term. The contribution rate was calculated using the following equation [69]:
Δ j = δ j + 1 2 i = 1 i j m δ i j + δ j j , ( j = 1 , 2 , , m ) ; δ = ( 0 F 1 1 1 F F 1 )
where Δj is the contribution rate, and F is the value for the linear effect terms (Fj), interaction effect terms (Fij), and quadratic effect terms (Fjj, regression coefficients significance test; if using F test, direct calculation is performed; if using t-test, Fj = tj2, Fij = tij2, and Fjj = tjj2, respectively); δj, δij, and δjj are the calculated F values of the independent variables, interaction effect terms, and quadratic effect terms, respectively.

3.3. UHPLC Analysis

3.3.1. Preparation of Standard Solution

A mixed standard stock solution of the selected analytes (rutin, 1.9 mg/mL; quercein, 3.8 mg/mL; genistein, 3.1 mg/mL; kaempferol, 3.5 mg/mL; and isorhamnetin, 2.8 mg/mL) was prepared in methanol. Working standard solutions were prepared by diluting mixed standard solutions with methanol to a series of concentrations within the range of 19–380 μg/mL; these solutions were used to plot the calibration curve. Calibration curves were obtained by plotting the peak area (PA) versus the amount of standards.

3.3.2. Instrumentation and Operating Conditions

UHPLC-ESI-Q-TOF MS/MS analysis was performed on a Shimadzu LC-30AD series UFLC system comprising a diode array detector, vacuum degasser, pump, autosampler, and thermostated column compartment (Shimadzu, Kyoto, Japan) and interfaced to a Triple TOF® 5600 mass analyzer (AB Sciex, Concord, CA, USA) operating in positive and negative ion modes. AB Sciex Analyst software was used to control the LC-MS system and for data acquisition (AB Sciex, Boston, MA, USA). Peakview® 2.2 software (AB Sciex, Boston, MA, USA) was used to process the obtained data.

3.3.3. UHPLC Conditions

Analysis was carried out on a Kinetex C18 column (100 mm × 2.1 mm, 2.6 μm, Phenomenex, Torrance, CA, USA). Standards and samples were separated using an isocratic mobile phase consisting of 0.1 % aqueous formic acid and acetonitrile (71:29, v/v). The detection wavelength was set to 260 nm, and on-line UV spectra were recorded within 200–400 nm. The column temperature was maintained at 40 °C, the flow rate was set to 0.35 mL/min, and the injection volume was 1 μL.

3.3.4. MS Conditions

The following operation parameters were used: ion source gas 1 and ion source gas 2, 55 psi; curtain gas, 25 psi; temperature, 600 °C; ion spray voltage floating, 5500 V; collision energy, 40 V; and collision energy spread, 15 V in positive ion mode (ESI+). The parameters in negative mode (ESI) were identical to those in ESI+, except for ion spray voltage floating, which was set to 4500 V. For full-scan TOF-MS analysis, a scan range of m/z 50–1000 with an accumulation time of 150 ms was selected; a scan range of m/z 50–1000 and accumulation time of 100 ms were used in TOF-MS/MS. MS/MS spectra were acquired in positive and negative ion modes from 0 min to 10 min. Accurate molecular masses of different compounds were obtained by measuring protonated and deprotonated molecules in positive and negative ion modes.

3.3.5. Method Validation for Quantitative Analysis

A calibration curve was generated to confirm the linear relationship between PA and the concentrations of the analytes. The limits of detection (LOD) and quantification (LOQ) were defined as the analyte concentrations producing signal-to-noise ratios (S/N) of about 3 and 10, respectively.
Precision and stability: The same mixed standard solution was analyzed through six replicates on the same day to assess intra-day variation and once each day for 3 consecutive days to assess inter-day variation. A sample of the medicinal material was prepared as described above and subjected to UHPLC analysis immediately and after 0, 1, 2, 4, 8, 12, 24, 36, 48, 72, and 96 h to detect the PA of all five standard compounds for the stability evaluation.
Repeatability: Six samples from the same batch (two times, two batches) of medicinal material were extracted and analyzed to evaluate the repeatability of the method.
Recovery: Standard constituent mixtures at three concentrations were added to untreated samples. The samples were allowed to settle for 60 min and then extracted and analyzed as described above to determine the recoveries of the five standard compounds. Spiked samples were prepared in triplicate. Recovery was calculated as follows: recovery (%) = (amount found − original amount)/amount spiked × 100.

4. Conclusions

RSM was successfully applied in this study to optimize the microwave-assisted extraction of the five major constituents from FSI. The extraction solvent type, sample particle size, times, liquid-to-solid ratio, microwave power, and extraction time played significant roles in the constituent extraction. Higher yields of the constituents were extracted from FSI using a green extraction solvent, less solvent, and lower extraction power, and simultaneously and considerably decreasing the extraction time. The statistical frequency method indicates that the optimum extraction conditions for the simultaneous extraction of the five components were 100% MeOH, 100 mesh, 50:1, 287 W, and 80 s.
The present study described the development and evaluation of a relatively simple UHPLC and LC-ESI-Q-TOF MS/MS method for the simultaneous analysis of rutin, quercetin, genistein, kaempferol, and isorhamnetin with high sensitivity. The proposed method is simple and rapid, provides high precision, sensitivity, accuracy, and reliability, and is appropriate for detection work. Separation of five compounds of interest was completed within 5 min, and well-resolved peaks were obtained. Run times were significantly shortened. The method developed in this project will be very useful for future studies.

Acknowledgments

Financial support from the following sources is gratefully acknowledged: Science and Technology Program for Public Wellbeing of China (No. 2013GS500102), Enhanced Capacity Building Program in Chongqing Sub-center of National Resource Center for Chinese Materia Medica (No. cstc2014ptyjd10001), Main Items of Budgetary Expenditure of Central and Local Governments (No. 2060302), and Chongqing Postdoctoral Foundation (No. Rc201529).

Author Contributions

The listed authors contributed to this work as described in the following. Jin-Liang Liu carried out the experiment and prepared the manuscript. Long-Yun Li and Guang-Hua He (corresponding author) conducted the experimental design and revised the manuscript. All authors helped preparing the manuscript and approved the final version.

Conflicts of Interest

The authors declare no conflict of interest.

References

  1. Chinese Pharmacopoeia Committee. Chinese Pharmacopoeia; part 1; People’s Medical Publishing House: Beijing, China, 1963; pp. 299–300. [Google Scholar]
  2. Chinese Pharmacopoeia Committee. Chinese Pharmacopoeia; part 1; People’s Medical Publishing House: Beijing, China, 1977; pp. 610–611. [Google Scholar]
  3. Chinese Pharmacopoeia Committee. Chinese Pharmacopoeia; part 1; People’s Medical Publishing House: Beijing, China, 1985; pp. 311–312. [Google Scholar]
  4. Chinese Pharmacopoeia Committee. Chinese Pharmacopoeia; part 1; People’s Medical Publishing House: Beijing, China, 1990; pp. 314–315. [Google Scholar]
  5. Chinese Pharmacopoeia Committee. Chinese Pharmacopoeia; part 1; People’s Medical Publishing House: Beijing, China, 1995; pp. 311–312. [Google Scholar]
  6. Chinese Pharmacopoeia Committee. Chinese Pharmacopoeid; part 1; Chemical Industry Press: Beijing, China, 2000; pp. 291–292. [Google Scholar]
  7. Chinese Pharmacopoeia Committee. Chinese Pharmacopoeia; part 1; Chemical Industry Press: Beijing, China, 2005; pp. 246–247. [Google Scholar]
  8. Chinese Pharmacopoeia Committee. Chinese Pharmacopoeia; part 1; China Medical Science Press: Beijing, China, 2010; pp. 333–334. [Google Scholar]
  9. Chinese Pharmacopoeia Committee. Chinese Pharmacopoeia; part 1; China Medical Science Press: Beijing, China, 2015; pp. 354–355. [Google Scholar]
  10. Li, M.J.; You, J.Y.; Yao, S.; Ding, L.; Liu, Z.Y.; Zhang, H.Q. Microwave-assisted extraction of rutin and quercetin from Flos Sophorae. Chem. Res. Chin. Univ. 2004, 20, 703–706. [Google Scholar]
  11. Li, Y.M. Simultaneous determination of five flavonoids during the growth of Fructus Sophorae by capillary electrophoresis. Arch. Pharm. Res. 2013, 36, 1311–1318. [Google Scholar] [CrossRef] [PubMed]
  12. Qi, Y.; Sun, A.; Liu, R.; Meng, Z.; Xie, H. Isolation and purification of flavonoid and isoflavonoid compounds from the pericarp of Sophora japonica L. by adsorption chromatography on 12% cross-linked agarose gel media. J. Chromatogr. A 2007, 1140, 219–224. [Google Scholar] [CrossRef] [PubMed]
  13. Scheidemann, P.; Wetzel, A. Identification and characterization of flavonoids in the root exudate of Robinia pseudoacacia. Trees-Struct. Funct. 1997, 11, 316–321. [Google Scholar] [CrossRef]
  14. Sun, A.; Sun, Q.; Liu, R. Preparative isolation and purification of flavone compounds from Sophora japonica L. by highspeed counter-current chromatography combined with macroporous resin column separation. J. Sep. Sci. 2007, 30, 1013–1018. [Google Scholar] [CrossRef] [PubMed]
  15. Jun, L.X.; Ping, Z.Y.; Bin, Y.Z. Separation and determination of rutin and quercetin in the flowers of Sophora japonica L. by capillary electrophoresis with electrochemical detection. Chromatographia 2002, 55, 243–246. [Google Scholar]
  16. Mihaylova, D.; Schalow, S. Antioxidant and Stabilization Activity of a Quercetin-Containing Flavonoid Extract Obtained from Bulgarian Sophora japonica L. Braz. Arch. Biol. Technol. 2013, 56, 431–438. [Google Scholar] [CrossRef]
  17. Xu, J.; Zhang, H.; Chen, G. Carbon nanotube/polystyrene composite electrode for microchip electrophoretic determination of rutin and quercetin in Flos Sophorae Immaturus. Talanta 2007, 73, 932–937. [Google Scholar] [CrossRef] [PubMed]
  18. Yao, W.; Wang, S.; Chen, Y.; Wang, H. Composition and Antibacterial Activity of Essential Oils of Flos sophorae Immaturus. Int. J. Food Prop. 2011, 14, 903–913. [Google Scholar] [CrossRef]
  19. Zeng, X.Y.; Zhao, L.Z.; Jiang, S.Y. Optimization of extraction technology of rutin from Sophora japonica based on BP neural network. Nat. Prod. Res. Dev. 2013, 25, 312–316. [Google Scholar]
  20. Li, P.F.; Zhang, H.; Xiao, L.; Jin, X.H. RP-HPLC determination of rutin in Flos sophorae from different habitats. Chin. Tradit. Herb. Drugs 2006, 37, 1419–1420. [Google Scholar]
  21. Li, Z.Z.; Zhu, H.; Xie, F.; Li, Z.Y. Determination of rutin in flos sophorae from different growing areas. World Chin. Med. 2013, 8, 952–954. [Google Scholar]
  22. Yang, M.H.; Chen, X.R.; Zheng, J.H. Determination of rutin in flower bud of Japanese Pagodatree by BP-HPLC. Chin. Pharm. Aff. 2000, 14, 34–35. [Google Scholar]
  23. Deng, F.L.; Chen, B.M.; Chen, G.H.; Liang, S.X.; Ping, Z.; Xia, L.W. HPLC determination rutin content from flos sophorae immaturus. Bull. Hun. Med. Univ. 2000, 25, 597–598. [Google Scholar]
  24. Gu, S.J.; Yang, N.; Zhu, K.M.; Yang, H.Y. Study on extraction technology of rutin from sophorae flos by microwave-assisted extraction. Chin. JMAP 2011, 28, 121–124. [Google Scholar]
  25. Guo, Y.; Tang, G.T.; Chen, S.X.; Liu, J.H.; Ye, X. Study on rutin extraction methods of flos sophorae Immaturus. Chin. Tradit. Pat. Med. 2007, 29, 1675–1677. [Google Scholar]
  26. Wang, S.L.; Sun, J.X.; Xi, G.Q.; Zhao, Z.F. Study on ultrasonic extraction and antioxidant activity of rutin from Sophora japonica. Sci. Technol. Food Ind. 2012, 32, 306–308. [Google Scholar]
  27. Liang, N.X.; Peng, Y.F. Determination of rutin in Flos sophorae by HPLC. J. Kunming Teach. Coll. 2000, 24, 51–52. [Google Scholar]
  28. Dong, X.N.; Zhao, Q.; Wang, J.F. Study on orthogonal design mode and antioxidant activity of rutin from Sophora japonica. Anim. Husb. Feed Sci. 2010, 31, 11–13. [Google Scholar]
  29. Ma, G.G.; Wang, J.Z.; Lu, X.R. Optimization of the ultrasonic wave extraction technology of the rutin from Sophara japonica L. using response surface analysis. Food Ferment Ind. 2007, 33, 167–172. [Google Scholar]
  30. Wei, C.X.; Xie, J.F.; Gao, Y.Y.; Yang, J.; Zhao, H.R. Ultrasonic-assisted extraction of rutin from Sophora Japonica. China Pharm. 2010, 19, 36–37. [Google Scholar]
  31. Liu, J.; Zhang, G.H.; Gao, M. Study on microwave-assisted extraction of rutin from Sophora rice. J. Shanxi Univ. Sci. Technol. 2007, 25, 40–43. [Google Scholar]
  32. Li, M.; Ma, X. Study on microwave-assisted extraction rutin of Flos Sophorae Immaturus. Mod Sci 2009, 06, 44–46. [Google Scholar]
  33. Zhang, H.Y.; Jiang, Q.; Jin, H.; He, L. Extraction of rutin from Sophora japonica L. by microwave irradiation. West Chin. J. Pham. Sci. 2004, 19, 39–41. [Google Scholar]
  34. Dong, Q.J.; Shao, S.X.; Ge, Q.; Jiao, P.P. Study on microwave-assisted extraction rutin from Flos Sophorae Immaturus. Chin. Tradit. Herb. Drugs 2006, 37, 1510–1511. [Google Scholar]
  35. Pan, Y.Y.; Wang, S.B.; Ao, H.W.; Liao, K.J.; Dai, Y.L. Study on extraction of rutin by microwave from bud of sophora japonica. Sci. Technol. Chem. Ind. 2009, 17, 25–26. [Google Scholar]
  36. Chen, Y.F.; Chen, L.J.; Yang, L. Study on extracion of rutin by microwave-assisted from Flos Sophorae Immaturus. J. Chin. Med. Mater. 2007, 30, 866–867. [Google Scholar]
  37. Xu, J.G.; Wang, X.D.; Hu, Q.P.; Duan, J.L.; Hou, H. Study on extraction technology of rutin from pagodatree flower by cellulase. Food Sci. 2011, 27, 315–318. [Google Scholar]
  38. Ma, G.G.; Wang, J.Z. Review on the extraction method of rutin from Sophara japonican L. Chin. Wild Plant Resour. 2007, 26, 5–8. [Google Scholar]
  39. Yan, J.; Gan, Y.; Gou, X.J.; Zhang, L.L.; Mei, B.Q.; Yao, Q. Optimization extraction of rutin from Flos Sophorae Immaturus using response surface methodology. J. Chin. Med. Mater. 2011, 34, 628–631. [Google Scholar]
  40. Peng, X.S.; Zhou, Y.F.; Wang, Q.; Zhou, Z.K. Optimization extraction of rutin from Sophorae flower using response surface methodology. Hunan J. Tradit. Chin. Med. 2010, 26, 102–103. [Google Scholar]
  41. Chen, S.L.; Chen, J. Experimental study on extraction of rutin from flower bud of pagoda tree with supercritical CO2. J. Jiangsu Univ. Sci. Technol. 1996, 17, 7–9. [Google Scholar]
  42. Fu, Q.; Wang, D.; Meng, F. Optimization of ultrasonic-assisted extraction rutin from Flos Sophorae Immaturus. Inf. Tradit. Chin. Med. 2012, 29, 49–52. [Google Scholar]
  43. Li, F.J.; Ning, S.L.; Li, Y.; Yu, Y.J.; Shen, C.D.; Duan, G.L. Optimisation of Infrared-assisted Extraction of Rutin from Crude Flos Sophorae Immaturus Using Response Surface Methodology and HPLC Analysis. Phytochem. Anal. 2012, 23, 292–298. [Google Scholar] [CrossRef] [PubMed]
  44. Huang, Q.; Liu, H.; Li, Y.; Li, J.; Zhu, W.; Zhao, Y. HPLC determination quercetin content of sophorae flower. Tianjin Pharm. 2007, 19, 10–11. [Google Scholar]
  45. Guo, L.; Zhong, S.; Wang, Z. Microwave-assisted extraction and HPLC determination quercetin content of Flos Sophorae Immaturus. China Foreign Med. Treat. 2008, 2, 20–21. [Google Scholar]
  46. Zong, S.; Wang, H.; Shen, L. Common extraction methods of extraction and quercetin content determination. Lishizhen Med. Mater. Med. Res. 2013, 24, 308–309. [Google Scholar]
  47. Meng, S.; Chen, D. Determination of quercetin in microwave assisted extraction of Flos Sophorae immaturus by HPLC. West Chin. J. Pham. Sci. 2005, 20, 561–562. [Google Scholar]
  48. Zhang, L.; Yao, Q.; Chen, K.; Yue, F.; Li, Q.; Gou, X. Optimization extraction quercetin of Flos Sophorae Immaturus using response surface methodology. Lishizhen Med. Mater. Med. Res. 2010, 21, 2068–2069. [Google Scholar]
  49. He, Q.; Xu, X.; Ke, Z.; Zhang, Z.; Li, L. Orthogonal test for optimization of quercetin extracting procedure from bud of Sophora japonica. Chin. Tradit. Herb. Drugs 2003, 34, 409–412. [Google Scholar]
  50. Lan, C.; Zhou, C.; Fan, B.; Zhou, Y. Research on ultrasonic ware extraction of flavone from bud of Sophora japonica. Nat. Prod. Res. Dev. 2005, 17, 55–58. [Google Scholar]
  51. Zhang, L.M.; Yin, D.J.; Zhao, X.; Gao, W.Y. Effects of ultrasound-assisted extraction conditions on the efficiency of isolation of flavonoids from the buds of Sophora japonica Linn. J. Tianjin Univ. Sci. Technol. 2009, 24, 18–21. [Google Scholar]
  52. Zhang, X.; Fan, Y.; Wang, X.; Wang, L. Determination of the total flavonoids extracted ultrasonically from Sophora Japonica L.: A methodological study. Eval. Anal. Drug-Use Hospit. China 2012, 12, 816–817. [Google Scholar]
  53. Ding, L.; Wu, Z.; Cai, C. Extraction of flavonoid from pagodatree flower. Trans. CSAE 2002, 18, 142–144. [Google Scholar]
  54. Huang, Q.; Zhao, W.; Yue, L.; Zhu, Q. Pressurized liquid extraction of flavonoids from pagodatree flower bud. J. Qingdao Univ. Sci. Technol. 2012, 33, 377–380. [Google Scholar]
  55. Tang, K.; Long, X.; Li, B. Study on extraction Flos Sophorae Immaturus using microwave and ultrasound. J. Xiangtan Norm. Univ. 2009, 31, 27–29. [Google Scholar]
  56. Zhao, D.; Bao, M.; Zhang, J.; Wang, L. Optimizing the extraction of flavonoids from Sophora Japonica by orthogonal design. J. Qingdao Univ. Sci. Technol. 2011, 32, 630–634. [Google Scholar]
  57. Yang, R. Optimization of extraction technology of total favonoids in Sophora japonica L. by orthogonal design test. Guangzhou Chem. Ind. 2012, 40, 75–76. [Google Scholar]
  58. Cheng, X.; Chen, X.; Gao, Y.; Ren, J. RP-HPLC determination rutin and quercetin content from Flos Sophorae Immaturus. Chin. Tradit. Pat. Med. 2004, 26, 680–682. [Google Scholar]
  59. Jueraiteti, B.; Yang, R.Z.; Ma, J.Y.; Yan, L.L.; Liu, W. Analysis of flavonoids in flos sophorae ultrasonic extraction and RP-HPLC chromatography. J. Yili Norm. Univ. 2013, 7, 61–63. [Google Scholar]
  60. Li, P.; Cheng, Y.; Hong, C.; Wang, L. Determination of rutin and quercetin of flos Sophorae in Xinjiang. J. Nongken Med. 2001, 23, 1–2. [Google Scholar]
  61. Yan, J.; Zhang, Z.; Liu, S. Separation and determination of five flavone compounds by RP-HPLC. J. Southwest Univ. 2007, 29, 41–44. [Google Scholar]
  62. Thirugnanasambandham, K.; Sivakumar, V.; Maran, J.P. Microwave-assisted extraction of polysaccharides from mulberry leaves. Int. J. Biol. Macromol. 2015, 72, 1–5. [Google Scholar] [CrossRef] [PubMed]
  63. Setyaningsih, W.; Saputro, I.E.; Palma, M.; Barroso, C.G. Optimisation and validation of the microwave-assisted extraction of phenolic compounds from rice grains. Food Chem. 2015, 169, 141–149. [Google Scholar] [CrossRef] [PubMed]
  64. Dahmoune, F.; Nayak, B.; Moussi, K.; Remini, H.; Madani, K. Optimization of microwave-assisted extraction of polyphenols from Myrtus communis L. leaves. Food Chem. 2015, 166, 585–595. [Google Scholar] [CrossRef] [PubMed]
  65. Taghvaei, M.; Jafari, S.M.; Assadpoor, E.; Nowrouzieh, S.; Alishah, O. Optimization of microwave-assisted extraction of cottonseed oil and evaluation of its oxidative stability and physicochemical properties. Food Chem. 2014, 160, 90–97. [Google Scholar] [CrossRef] [PubMed]
  66. Sinha, K.; Chowdhury, S.; Saha, P.D.; Datta, S. Modeling of microwave-assisted extraction of natural dye from seeds of Bixa orellana (Annatto) using response surface methodology (RSM) and artificial neural network (ANN). Ind. Crop Prod. 2013, 41, 165–171. [Google Scholar] [CrossRef]
  67. Li, Y.; Skouroumounis, G.K.; Elsey, G.M.; Taylor, D.K. Microwave-assistance provides very rapid and efficient extraction of grape seed polyphenols. Food Chem. 2011, 129, 570–576. [Google Scholar] [CrossRef]
  68. Liu, J.L.; Zheng, S.L.; Fan, Q.J.; Yuan, J.C.; Yang, S.M.; Kong, F.L. Optimisation of high-pressure ultrasonic-assisted extraction and antioxidant capacity of polysaccharides from the rhizome of Ligusticum chuanxiong. Int. J. Biol. Macromol. 2015, 76, 80–85. [Google Scholar] [CrossRef] [PubMed]
  69. Liu, J.L.; Zheng, S.L.; Fan, Q.J.; Yuan, J.C.; Yang, S.M.; Kong, F.L. Optimization of high-pressure ultrasonic-assisted simultaneous extraction of six major constituents from Ligusticum chuanxiong rhizome using response surface methodology. Molecules 2014, 19, 1887–1911. [Google Scholar] [CrossRef] [PubMed]
  70. Xiao, X.H.; Chen, S.L.; Huang, L.Q.; Xiao, P.G. Survy of investigations on Daodi Chinese medicinal materials in China since 1980s. China J. Chin. Mater. Med. 2009, 34, 519–523. [Google Scholar]
  71. Alaerts, G.; van Erps, J.; Pieters, S.; Dumarey, M.; van Nederkassel, A.M.; Goodarzi, M.; Smeyers-Verbeke, J.; Vander Heyden, Y. Similarity analyses of chromatographic fingerprints as tools for identification and quality control of green tea. J. Chromatogr. B 2012, 910, 61–70. [Google Scholar] [CrossRef] [PubMed]
  72. Chen, Y.; Zhu, S.B.; Xie, M.Y.; Nie, S.P.; Liu, W.; Li, C.; Gong, X.F.; Wang, Y.X. Quality control and original discrimination of Ganoderma lucidum based on high-performance liquid chromatographic fingerprints and combined chemometrics methods. Anal. Chim. Acta 2008, 623, 146–156. [Google Scholar] [CrossRef] [PubMed]
  73. Lian, H.; Wei, Y. Chromatographic fingerprints of industrial toluic acids established for their quality control. Talanta 2007, 71, 264–269. [Google Scholar] [CrossRef] [PubMed]
  74. Nguyen Hoai, N.; Dejaegher, B.; Tistaert, C.; Nguyen Thi Hong, V.; Riviere, C.; Chataigne, G.; Phan Van, K.; Chau Van, M.; Quetin-Leclercq, J.; Vander Heyden, Y. Development of HPLC fingerprints for Mallotus species extracts and evaluation of the peaks responsible for their antioxidant activity. J. Pharm. Biomed. Anal. 2009, 50, 753–763. [Google Scholar] [CrossRef] [PubMed]
  75. Qian, G.S.; Wang, Q.; Leung, K.S.; Qin, Y.; Zhao, Z.; Jiang, Z.H. Quality assessment of Rhizoma et Radix Notopterygii by HPTLC and HPLC fingerprinting and HPLC quantitative analysis. J. Pharm. Biomed. Anal. 2007, 44, 812–817. [Google Scholar] [CrossRef] [PubMed]
  76. Springfield, E.P.; Eagles, P.K.; Scott, G. Quality assessment of South African herbal medicines by means of HPLC fingerprinting. J. Ethnopharmacol. 2005, 101, 75–83. [Google Scholar] [CrossRef] [PubMed]
  77. Wang, Y.; Xian, J.; Xi, X.; Wei, X. Multi-fingerprint and quality control analysis of tea polysaccharides. Carbohydr. Polym. 2013, 92, 583–590. [Google Scholar] [CrossRef] [PubMed]
  78. Xu, C.J.; Liang, Y.Z.; Chau, F.T.; Heyden, Y.V. Pretreatments of chromatographic fingerprints for quality control of herbal medicines. J. Chromatogr. A 2006, 1134, 253–259. [Google Scholar] [CrossRef] [PubMed]
  79. Xu, S.; Yang, L.; Tian, R.; Wang, Z.; Liu, Z.; Xie, P.; Feng, Q. Species differentiation and quality assessment of Radix Paeoniae Rubra (Chi-shao) by means of high-performance liquid chromatographic fingerprint. J. Chromatogr. A 2009, 1216, 2163–2168. [Google Scholar] [CrossRef] [PubMed]
  80. Du, Y.R.; He, F.Y.; Zhou, Y.Q.; Xie, X.G.; Lian, S.J. Content determination of rutin and quercetin in different parts of Sophora japonica L. medicinal materials by HPLC. Chin. J. Inf. TCM 2012, 19, 43–45. [Google Scholar]
  81. Cheng, X.M.; Chen, X.L.; Gao, Y.H.; Jian, R. RP-HPLC determination content of rutin and quercetin from flos sophorae immaturus. Chin. Tradit. Pat. Med. 2004, 26, 380–382. [Google Scholar]
  82. Xu, X.L.; Zhang, Z.R.; Ke, Z.H.; Feng, T. Quantitative analysis of quercetin in bud of Sophora japonica by RP-HPLC. Chin. Tradit. Herb. Drugs 2003, 34, 565–567. [Google Scholar]
  83. Xie, Z.; Lam, S.; Wu, J.; Yang, D.; Xu, X. Chemical fingerprint and simultaneous determination of flavonoids in Flos Sophorae Immaturus by HPLC-DAD and HPLC-DAD-ESI-MS/MS combined with chemometrics analysis. Anal. Method 2014, 6, 4328–4335. [Google Scholar] [CrossRef]
  84. Gan, Z.; Chen, Q.; Fu, Y.; Chen, G. Determination of bioactive constituents in Flos Sophorae Immaturus and Cortex Fraxini by capillary electrophoresis in combination with far infrared-assisted solvent extraction. Food Chem. 2012, 130, 1122–1126. [Google Scholar] [CrossRef]
  85. Chu, Q.C.; Wu, T.; Fu, L.; Ye, J.N. Determination and comparison of phytoestrogens in both crude and parched Flos sophorae immaturus by capillary electrophoresis with electrochemical detection. Microchim. Acta 2004, 148, 311–315. [Google Scholar] [CrossRef]
  86. Weon, J.B.; Lee, J.; Yun, B.-R.; Eom, M.R.; Ma, C.J. Simultaneous determination of 14 bioactive compounds in Samchulkunbi-tang using HPLC-DAD and LC-MS. Anal. Method 2014, 6, 6023–6030. [Google Scholar] [CrossRef]
  87. Nageswara Rao, R.; Guru Prasad, K. LC-Q-TOF-MS/MS determination of darunavir and its metabolites in rat serum and urine: Application to pharmacokinetics. J. Pharm. Biomed. Anal. 2014, 94, 92–98. [Google Scholar] [CrossRef] [PubMed]
  88. Zhang, J.; Chu, C.J.; Li, X.L.; Yao, S.; Yan, B.; Ren, H.L.; Xu, N.Y.; Liang, Z.T.; Zhao, Z.Z. Isolation and identification of antioxidant compounds in Vaccinium bracteatum Thunb. by UHPLC-Q-TOF LC/MS and their kidney damage protection. J. Funct. Foods 2014, 11, 62–70. [Google Scholar] [CrossRef]
  89. He, Y.; Dong, X.; Jia, X.; Li, M.; Yuan, T.; Xu, H.; Qin, L.; Han, T.; Zhang, Q. Qualitative and quantitative analysis on chemical constituents from Curculigo orchioides using ultra high performance liquid chromatography coupled with electrospray ionization quadrupole time-of-flight tandem mass spectrometry. J. Pharm. Biomed. Anal. 2015, 102, 236–245. [Google Scholar] [CrossRef] [PubMed]
  90. La, M.; Zhang, F.; Gao, S.; Liu, X.; Wu, Z.; Sun, L.; Tao, X.; Chen, W. Constituent analysis and quality control of Lamiophlomis rotata by LC-TOF/MS and HPLC-UV. J. Pharm. Biomed. Anal. 2015, 102, 366–376. [Google Scholar] [CrossRef] [PubMed]
  91. Lai, C.J.S.; Tan, T.; Zeng, S.L.; Dong, X.; Liu, E.H.; Li, P. Relative quantification of multi-components in Panax notoginseng (Sanqi) by high-performance liquid chromatography with mass spectrometry using mobile phase compensation. J. Pharm. Biomed. Anal. 2015, 102, 150–156. [Google Scholar] [CrossRef] [PubMed]
  92. Pandey, R.; Chandra, P.; Arya, K.R.; Kumar, B. Development and validation of an ultra high performance liquid chromatography electrospray ionization tandem mass spectrometry method for the simultaneous determination of selected flavonoids in Ginkgo biloba. J. Sep. Sci. 2014, 37, 3610–3618. [Google Scholar] [CrossRef] [PubMed]
  93. Ming, D.X. Advanced Biostatistics; China Agriculture Press: Beijing, China, 2006; pp. 129–252. [Google Scholar]
  94. Chemat, F.; Vian, M.A.; Cravotto, G. Green extraction of natural products: Concept and principles. Int. J. Mol. Sci. 2012, 13, 8615–8627. [Google Scholar] [CrossRef] [PubMed]
  95. Rombaut, N.; Tixier, A.S.; Bily, A.; Chemat, F. Green extraction processes of natural products as tools for biorefinery. Biofuels Bioprod. Biorefin. 2014, 8, 530–544. [Google Scholar] [CrossRef]
  96. Chang, L.; Ren, Y.; Cao, L.; Sun, Y.; Sun, Q.; Sheng, N.; Yuan, L.; Zhi, X.; Zhang, L. Simultaneous determination and pharmacokinetic study of six flavonoids from Fructus Sophorae extract in rat plasma by LC–MS/MS. J. Chromatogr. B 2012, 904, 59–64. [Google Scholar] [CrossRef] [PubMed]
  97. Zou, T.B.; Xia, E.Q.; He, T.P.; Huang, M.Y.; Jia, Q.; Li, H.W. Ultrasound-assisted extraction of Mangiferin from Mango (Mangifera indica L.) leaves using response surface methodology. Molecules 2014, 19, 1411–1421. [Google Scholar] [CrossRef] [PubMed]
  98. Wang, T.; Li, C.Q.; Zhang, H.; Li, J.W. Response surface optimized extraction of 1-deoxynojirimycin from mulberry leaves (Morus alba L.) and preparative separation with resins. Molecules 2014, 19, 7040–7056. [Google Scholar] [CrossRef] [PubMed]
  99. Wang, H.J.; Pan, M.C.; Chang, C.K.; Chang, S.W.; Hsieh, C.W. Optimization of ultrasonic-assisted extraction of cordycepin from cordyceps militaris using orthogonal experimental design. Molecules 2014, 19, 20808–20820. [Google Scholar] [CrossRef] [PubMed]
  100. Tao, W.; Zhang, H.; Xue, W.; Ren, L.; Xia, B.; Zhou, X.; Wu, H.; Duan, J.; Chen, G. Optimization of supercritical fluid extraction of oil from the fruit of Gardenia jasminoides and its antidepressant activity. Molecules 2014, 19, 19350–19360. [Google Scholar] [CrossRef] [PubMed]
  • Sample Availability: Samples of the Flos Sophorae Immaturus are available from the authors.
Figure 1. Effects of solvent type on the extraction yields of the five constituents (the bar and lines graphs as referenced to the left and right axes, respectively; different letters stand for significant difference at 5% level).
Molecules 21 00296 g001
Figure 2. Effects of particle size on the extraction yields of the five constituents (the bar and lines graphs are referenced to the left and right axes, respectively; different letters stand for significant difference at 5% level).
Molecules 21 00296 g002
Figure 3. Effects of times on extraction yields of the five constituents (the bar and lines graphs are referenced to the left and right axes, respectively; different letters stand for significant difference at 5% level).
Molecules 21 00296 g003
Figure 4. Effects of liquid-to-solid ratio on the extraction yields of the five constituents (the bar and lines graphs are referenced to the left and right axes, respectively; different letters stand for significant difference at 5% level).
Molecules 21 00296 g004
Figure 5. Effect of microwave power on the extraction yields of the five constituents (the bar and lines graphs are referenced to the left and right axes, respectively; different letters stand for significant difference at 5% level).
Molecules 21 00296 g005
Figure 6. Effect of time on the extraction yields of the five constituents (the bar and lines graphs are referenced to the left and right axes, respectively; different letters stand for significant difference at 5% level).
Molecules 21 00296 g006
Figure 7. Response surface plots for the effects of: (a) liquid-to-solid ratio/power (b) liquid-to-solid/time (c) power/time on the extraction yield of rutin.
Molecules 21 00296 g007
Figure 8. Response surface plots for the effects of: (a) liquid-to-solid ratio/power (b) liquid-to-solid/time (c) power/time on the extraction yield of quercetin.
Molecules 21 00296 g008
Figure 9. Response surface plots for the effects of: (a) liquid-to-solid ratio/power (b) liquid-to-solid/time (c) power/time on the extraction yield of genistein.
Molecules 21 00296 g009
Figure 10. Response surface plots for the effects of: (a) liquid-to-solid ratio/power (b) liquid-to-solid/time (c) power/time on the extraction yield of kaempferol.
Molecules 21 00296 g010
Figure 11. Response surface plots for the effects of (a) liquid-to-solid ratio/power (b) liquid-to-solid/time (c) power/time on the extraction yield of isorhamnetin.
Molecules 21 00296 g011
Figure 12. UHPLC (a) and LC-ESI-Q-TOF/MS TIC (b) chromatography of FSI.
Molecules 21 00296 g012
Figure 13. Structure, MS/MS spectra and fragmentation scheme (negative ion mode) of 13 ingredients (the red lines and blue lines are cracking location and ion fragments figure, respectively).
Molecules 21 00296 g013aMolecules 21 00296 g013b
Table 1. Extracted conditions of different extraction methods in FSI.
No.ConstituentsMethodSolventRatioTime (No.)Time (min)Temperature (°C)Extraction Yield (%)
1RutinUnclear60% ethanol1:21187Unclear13.51
2RutinUntrasound100% methanol1:15130Unclear0.03~0.04
3RutinUntrasound100% methanol1:500130Unclear13.88~35.74
4RutinPercolation100% methanol1:400140Room temperature7.53~10.84
5RutinUntrasound70% ethanol1:400More405522.27~22.98
6RutinMicrowave55% ethanol1:20Unclear9Unclear30.83
7RutinReflux100% methanol1:901420~48010012.77
8RutinMicrowaveWater1:3034Unclear12.63
9RutinUntrasound70% ethanol1:30330Unclear12.81
10RutinUntrasound60% ethanol1:10Unclear20456.1
11RutinSoxhlet100% methanol1:250UnclearUnclear10019.25 and 26.27
12RutinPercolation80% ethanolUnclearUnclearUnclear4511.6
13RutinUntrasoundAlkaline solution1:1521020Unclear
14RutinUntrasoundAlkaline solution1:202306018.25
15RutinMicrowaveWater1:100116Unclear21.97
16RutinMicrowave100% methanolUnclear1UnclearUnclearUnclear
17RutinMicrowaveWaterUnclear424Unclear17
18RutinMicrowave100% ethanol1:2019UnclearUnclear
19RutinMicrowave65% ethanol1:1814UnclearUnclear
20RutinMicrowaveWater1:100310Unclear14.66
21RutinEnzymatic0.03% cellulase1:5511204519.82
22RutinUntrasoundAlkaline solution1:15210Room temperature19.16
23RutinBasicAlkaline solution1:251720Room temperature11
24RutinUnclear100% methanol1:30121090Unclear
25RutinSupercritical fluid CO2EtherUnclearUnclear420506.88
26RutinUntrasoundWater1:2022070Unclear
27RutinUntrasound100% methanol1:500130Unclear≥15%
28Rutininfrared-assisted70% methanol1:3014.8Unclear25.26
29QuercetinSoxhlet and RefluxEther and methanol1:203601000.87
30QuercetinMicrowave75% ethanol1:8110Unclear0.46~0.61
31QuercetinReflux80% ethanol1:12.5112010010.01~10.40
32QuercetinMicrowave100% ethanol1:4310Unclear0.57
33QuercetinBasicAlkaline solution1:3511440UnclearUnclear
34QuercetinDecoction0.05% NaOH1:10420100Unclear
35FlavonoidUntrasound60% ethanol1:15230758.46
36FlavonoidUntrasound99.8% borax1:102303518.8
37FlavonoidUntrasound60% ethanol1:2726060Unclear
38FlavonoidReflux40% ethanol1:2312010013.04
39FlavonoidHigh-Pressure50% ethanol1:4012013019.4
40FlavonoidMicrowave70% ethanol1:10130UnclearUnclear
41FlavonoidUntrasound70% ethanol1:50140Unclear46.31
42FlavonoidUntrasound60% ethanol1:83608015.03
43Rutin QuercetinUntrasound100% methanol1:500130Unclear24.42~24.51; 1.39~1.43
44Rutin QuercetinUntrasound60% ethanolUnclear1UnclearRoom temperatureUnclear
45Rutin QuercetinSoxhlet100% methanol1:101Unclear10013.88; 0.15; 10.48; 0.22
46Rutin Quercetin GenisteinUntrasound100% ethanolUnclearUnclear20UnclearUnclear
Table 2. Extraction yield of response surface CCD (n = 3) and expressed as means ± SD (units: %).
No.X1X2 (W)X3 (S)RutinQuercetinGenisteinKaempferolIsorhamnetin
1−1 (50)−1 (200)−1 (60)16.85 ± 0.282.04 ± 0.300.002 ± 0.000.059 ± 0.000.11 ± 0.01
2−1 (50)−1 (200)1 (80)21.05 ± 0.335.29 ± 0.160.002 ± 0.000.059 ± 0.000.15 ± 0.00
3−1 (50)1 (300)−1 (60)20.70 ± 1.204.78 ± 0.0780.002 ± 0.000.044 ± 0.000.13 ± 0.01
4−1 (50)1 (300)1 (80)33.76 ± 0.446.19 ± 0.090.003 ± 0.000.065 ± 0.000.18 ± 0.00
51 (100)−1 (200)−1 (60)16.00 ± 0.021.62 ± 0.120.002 ± 0.000.058 ± 0.000.12 ± 0.01
61 (100)−1 (200)1 (80)18.73 ± 0.384.46 ± 0.220.001 ± 0.000.058 ± 0.010.14 ± 0.01
71 (100)1 (300)−1 (60)18.81 ± 0.122.67 ± 0.100.001 ± 0.000.057 ± 0.000.13 ± 0.00
81 (100)1 (300)1 (80)23.25 ± 0.333.48 ± 0.210.001 ± 0.000.056 ± 0.000.15 ± 0.01
9−1.682 (32.95)0 (250)0 (70)23.24 ± 0.074.39 ± 0.190.002 ± 0.000.063 ± 0.000.16 ± 0.00
101.682 (117.05)0 (250)0 (70)18.93 ± 0.352.48 ± 0.190.001 ± 0.000.059 ± 0.000.13 ± 0.01
110 (75)−1.682 (165.9)0 (70)17.45 ± 0.282.71 ± 0.190.002 ± 0.000.057 ± 0.000.11 ± 0.01
120 (75)1.682 (334.1)0 (70)24.99 ± 0.434.80 ± 0.070.002 ± 0.000.056 ± 0.000.16 ± 0.00
130 (75)0 (250)−1.682 (53.18)12.54 ± 0.122.13 ± 0.260.001 ± 0.000.050 ± 0.000.11 ± 0.00
140 (75)0 (250)1.682 (86.82)24.50 ± 0.454.88 ± 0.110.002 ± 0.000.058 ± 0.000.15 ± 0.00
150 (75)0 (250)0 (70)29.10 ± 0.205.42 ± 0.360.002 ± 0.000.065 ± 0.000.17 ± 0.01
160 (75)0 (250)0 (70)29.14 ± 0.405.34 ± 0.120.002 ± 0.000.063 ± 0.000.16 ± 0.01
170 (75)0 (250)0 (70)27.29 ± 0.345.28 ± 0.080.002 ± 0.000.063 ± 0.000.16 ± 0.00
180 (75)0 (250)0 (70)27.15 ± 0.075.26 ± 0.140.002 ± 0.000.062 ± 0.000.16 ± 0.01
190 (75)0 (250)0 (70)28.29 ± 0.055.08 ± 0.030.002 ± 0.000.061 ± 0.000.16 ± 0.00
200 (75)0 (250)0 (70)27.08 ± 0.125.72 ± 0.180.003 ± 0.000.068 ± 0.000.17 ± 0.01
Table 3. Regression coefficients of predicted polynomial models for the investigated responses from FSI extracts.
CoefficientConstituents
RutinQuercetinGenisteinKaempferolIsorhamnetin
A027.9635 ***5.3376 ***0.0024 ***0.06380.1622 ***
A1−1.6697 **−0.6794 ***−3.164 × 10⁻⁴ ***−3.298 × 10⁻⁴−0.0056 **
A226783 ***0.5296 ***2.961 × 10⁻⁵−9.444 × 10−40.0113 ***
A33.2617 ***0.9475 ***1.222 × 10−4 *0.0024 *0.0143 ***
A11−2.1643−0.6022−1.529 × 10⁻⁴−9.858 × 10⁻⁴−0.0061
A22−2.1159−0.4883−2.569 × 10⁻⁴−0.0024−0.0092
A33−3.0719−0.5757−2.648 × 10⁻⁴−0.0036−0.0101
A12−1.1534 *−0.4454 **−1.505 × 10−4 *6.392 × 10−4−0.0056 *
A13−1.2602 *−0.1257−1.938 × 10⁻⁴ *−0.0028 *−0.0056 *
A231.3205 *−0.4827 **1.619 × 10−4 *0.0026 *0.001
Model***************
Lack of fitnsnsnsnsns
R20.9630.9740.9330.8280.957
R2adj0.9310.950.8720.6730.918
ns, Not significant at p ≤ 0.05; * Significant at p ≤ 0.05; ** Significant at p ≤ 0.01; *** Significant at p ≤ 0.0001.
Table 4. Estimated optimum conditions, predicted and experimental values of responses under these conditions.
Response VariablesOptimum Extraction Conditions (Obtained from Equation)Maximum Extraction Yields (%)Extraction Yields at Optimal Conditions from the Statistical Frequency Method (%)
Liquid-to-Solid RatioMicrowave Power (W)Time (s)PredictedActual
Rutin50 (50)310 (311)80 (80)32.0632.1732.11 ns
Quercetin54 (53.5)281 (280.5)77 (76.6)6.16.236.26 ns
Genistein33 (33)295 (295)81 (81.2)0.0030.0030.002 **
Kaempferol36 (36.3)258(257.5)80 (80.1)0.060.060.06 ns
Isorhamnetin40 (39.8)305 (305)81(81.2)0.180.180.17ns
** Compared with the significant for actual yield of optimum conditions and statistical frequency conditions at p ≤ 0.01; ns, Not significant at p ≤ 0.01 or p ≤ 0.05.
Table 5. Precursor and product ion of the ingredients in the methanol extract of FSI in UHPLC-ESI-Q-TOF MS/MS.
No. RT (min) Name Formula [M + H]+[M − H]Expected m/zExperimental m/zFragmentsError (ppm)
10.759rutinC27H30O16[M − H]609.1398609.1404301.0325, 270.0222, 255.02751.00
20.810rutinC27H30O16[M − H]609.1401609.1406301.03250.70
30.855rutinC27H30O16[M − H]609.1379609.1391301.0310, 270.0215, 255.02711.90
41.176unknown -[M − H]577.1495577.1497-0.40
[M + H]+579.1791579.1790147.0433, 119.0481−0.10
5 2.159quercetin C15H10O7[M − H]301.0317301.0316151.0029 −0.10
[M + H]+303.0519303.0521229.0505, 153.10690.70
62.256quercetinC15H10O7[M − H]301.0309301.0315151.0025 1.90
[M + H]+303.0515303.0519229.0501, 153.01741.40
73.447genisteinC15H10O5[M − H]269.0421269.0422133.02780.30
[M + H]+271.0618271.0619-0.40
83.510genisteinC15H10O5[M − H]269.0429269.0623133.0283−2.30
[M + H]+271.0613217.0616-0.80
93.614genisteinC15H10O5[M − H]269.0340269.0413133.02781.40
103.886kaempferolC15H10O6[M − H]285.0369285.0367211.0380, 117.0338−0.60
[M + H]+287.0569287.0568-−0.30
114.038kaempferolC15H10O6[M − H]285.0359285.0363-1.40
124.267isorhamnetinC16H12O7[M − H]315.0465315.0464300.0254, 151.0023−0.40
[M + H]+317.0680317.0679-−0.40
134.313isorhamnetinC16H12O7[M − H]315.0463315.0464300.0237, 151.00160.40
Table 6. Linear regression data, LOD, and LOQ of the investigated compounds.
Analytes Linear Regression DataLOD (ng/mL)LOQ (ng/mL)
Regression EquationsLinear Ranges (μg/mL)R2
Rutiny = 5114520.5x + 94252.7451.9–9500.999426.844789.4825
Quercetiny = 12527006x - 107866.63.8–19000.999940.214296.3997
Genisteiny = 16908433x + 523731.73.1–15500.999041.721098.3375
Kaempferoly = 12102061x − 18222.253.5–17501.000013.766124.2013
Isorhamnetiny = 12274446x − 30971.92.8–14001.000015.758128.7221
Table 7. Intra- and inter-day precision of constituents; results are shown as RSD % (n = 6).
AnalytesIntra-Day VariabilityInter-Day VariabilityRepeatability
Retention TimeAre Day 1 Time Day 1 AreaDay 2 Time Day 2 AreaDay 3 TimeDay 3 AreaTime Area
Rutin0.30850.68520.01280.00420.00490.01570.00560.01010.00270.2095
Quercetin0.09940.48920.02750.00830.01510.20640.01260.63220.00100.2085
Genistein0.15360.05260.02980.25020.01070.64640.01300.01790.00060.3748
Kaempferol0.13242.83300.02420.03200.01300.33550.01060.02330.00070.2086
Isorhamnetin0.09970.94020.02530.00490.00930.00580.00780.01930.00090.2430
Table 8. Recovery studies of rutin (1), quercetin (2), genistein (3), kaempferol (4), and isorhamnetin (5).
Series No.CompoundTheoretical (mg)Found (mg)Recovery (%)
1140.176140.1724 ± 0.121796.1951 ± 0.3029
20.32800.3276 ± 0.002199.8091 ± 0.6117
30.15590.1583 ± 0.0028101.5719 ± 1.8041
40.18970.1829 ± 0.002196.1354 ± 1.1425
50.16320.1636 ± 0.0018100.2918 ± 1.1584
2140.271140.2654 ± 0.149697.0428 ± 0.3715
20.51800.5181 ± 0.0012100.0234 ± 0.24505
30.31090.3158 ± 0.0027101.6114 ± 0.8989
40.36470.3476 ± 0.002395.1217 ± 0.6555
50.30320.2958 ± 0.001397.3578 ± 0.4417
3140.461140.4707 ± 0.2773102.5346 ± 0.6855
20.89800.9018 ± 0.0099100.5011 ± 1.1056
30.62090.6208 ± 0.002399.9971 ± 0.3787
40.71470.6923 ± 0.003996.8074 ± 0.5489
50.58320.5711 ± 0.002197.8323 ± 0.3439
Average1 98.5908636
2 100.1112057
3 101.0601425
4 96.02157394
5 98.49388817

