
Predicting Protein-Protein Interactions Using BiGGER: Case Studies

 , ,
, , 
Abstract
:
1. Introduction
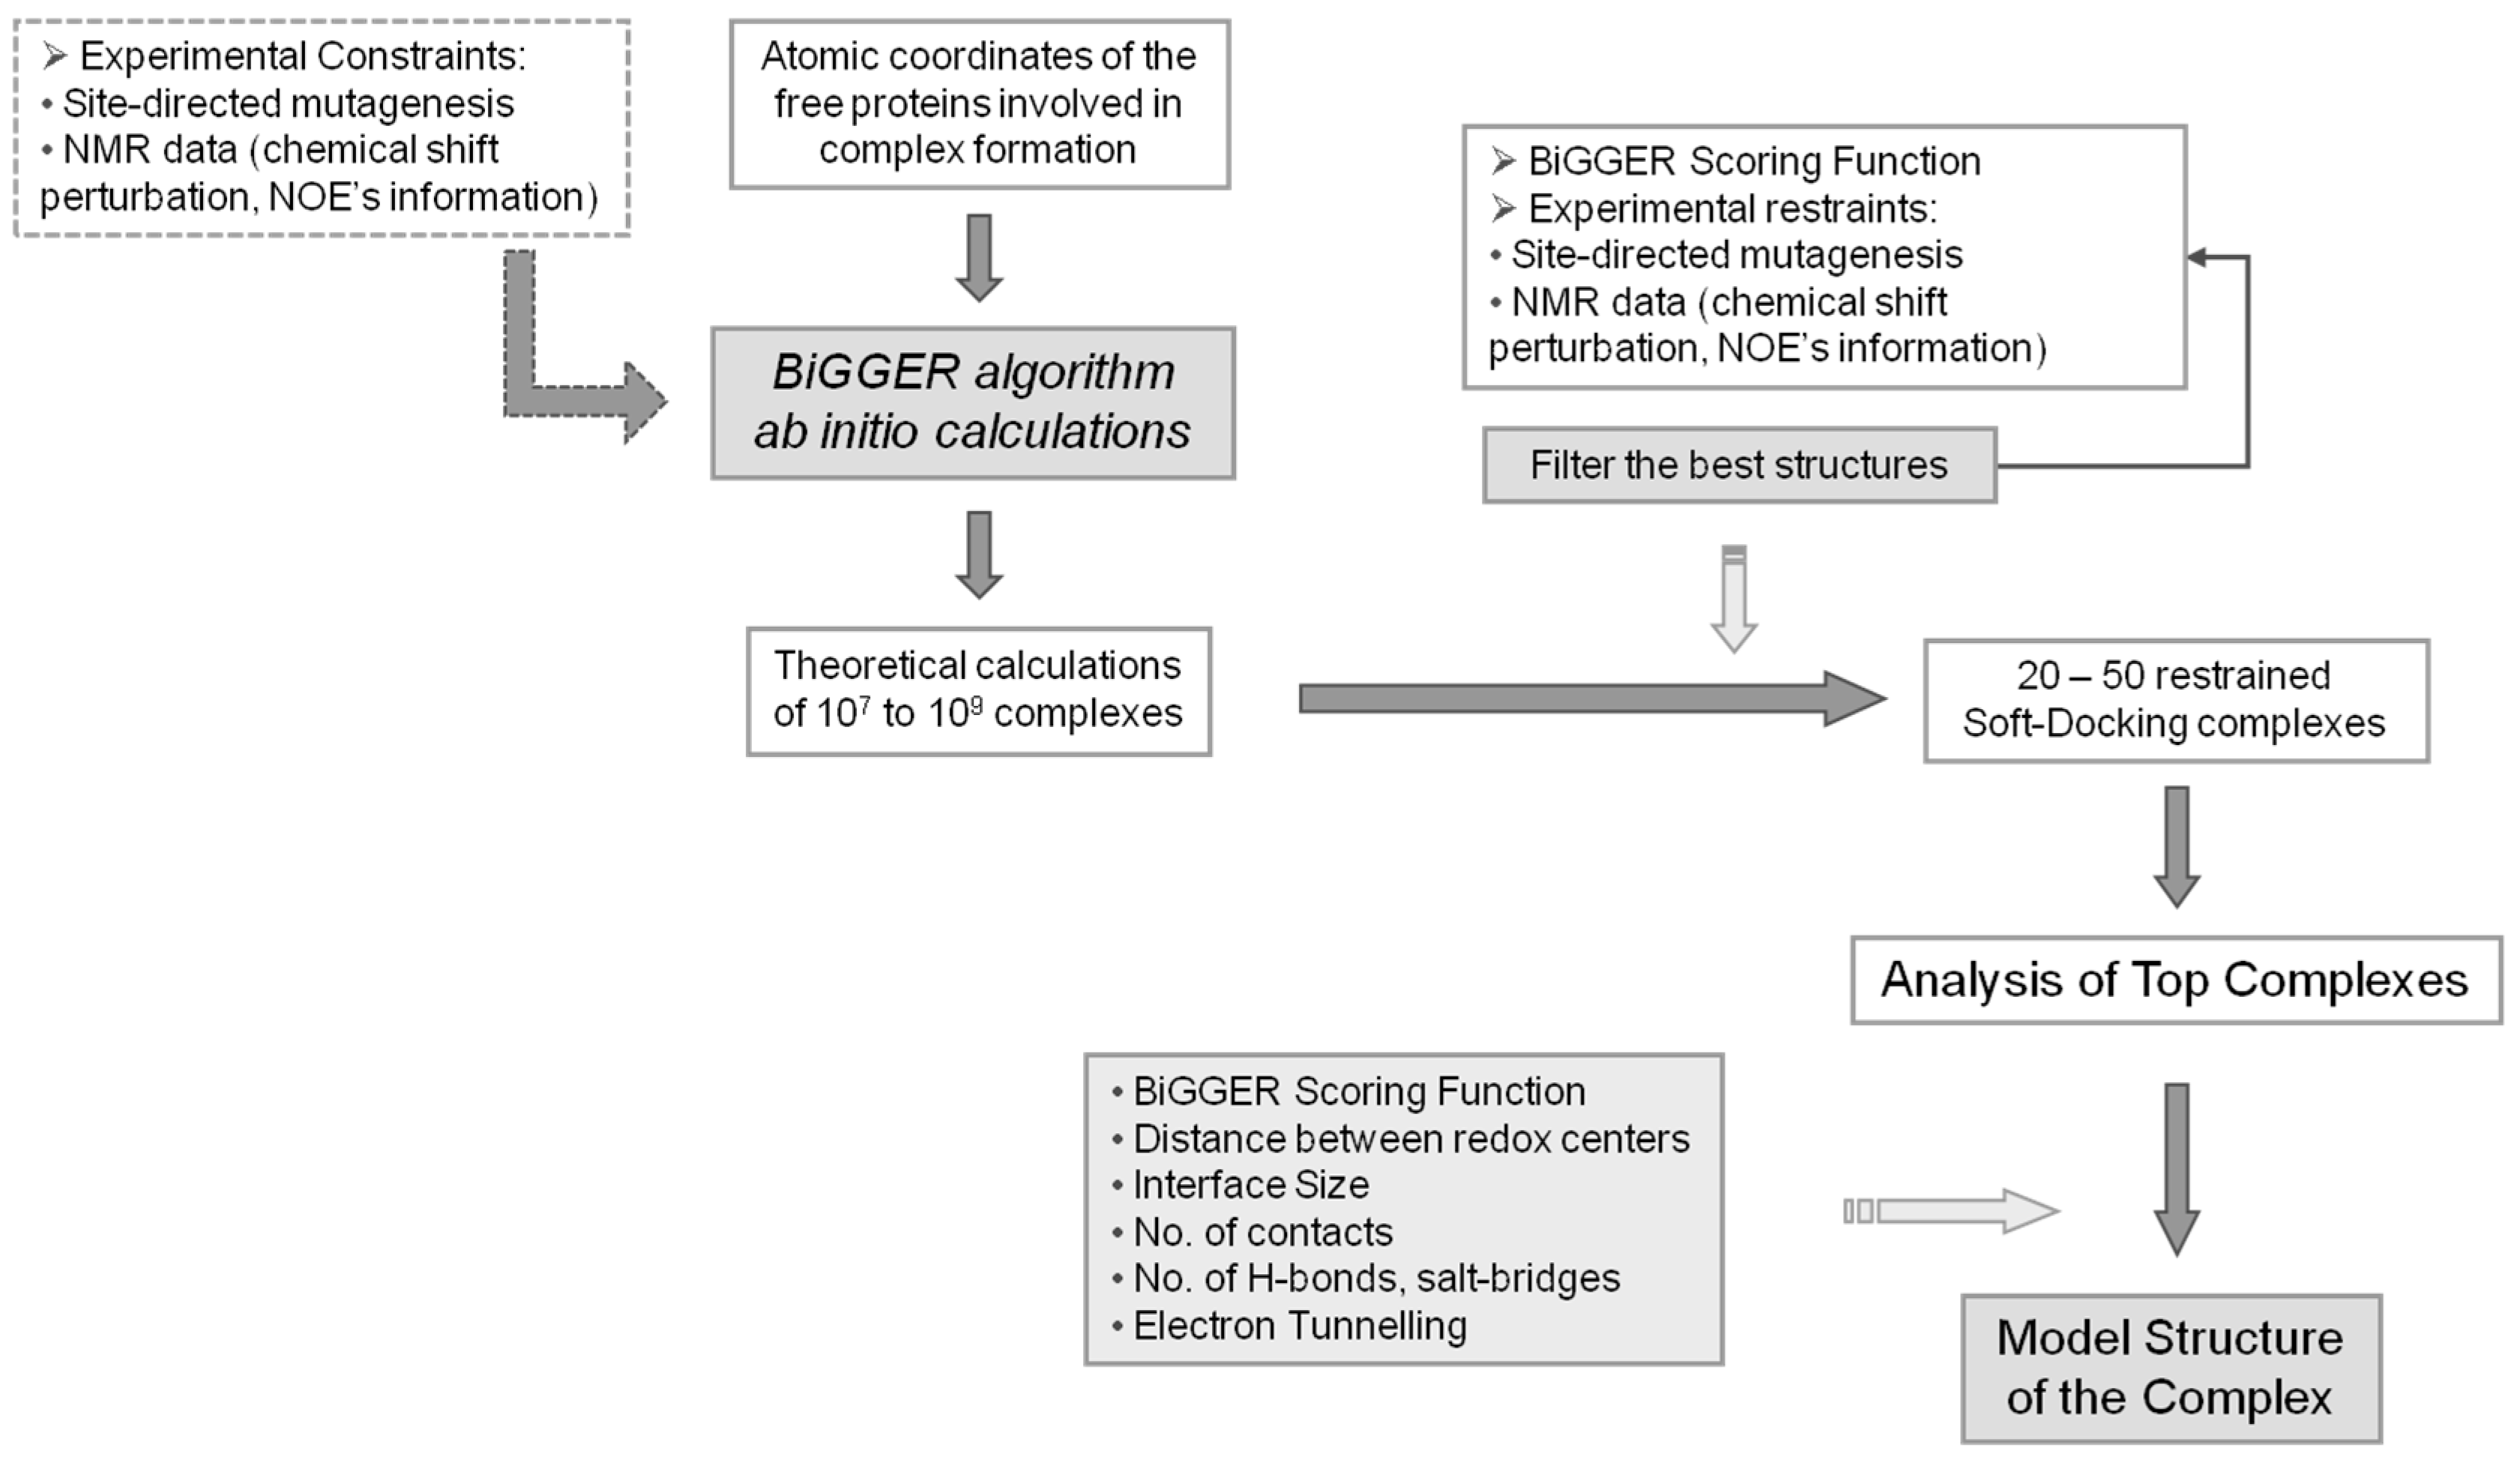
2. Methodology
2.1. Search Stage
2.2. Scoring Stage
3. Data Analysis
3.1. Properties of the Complex
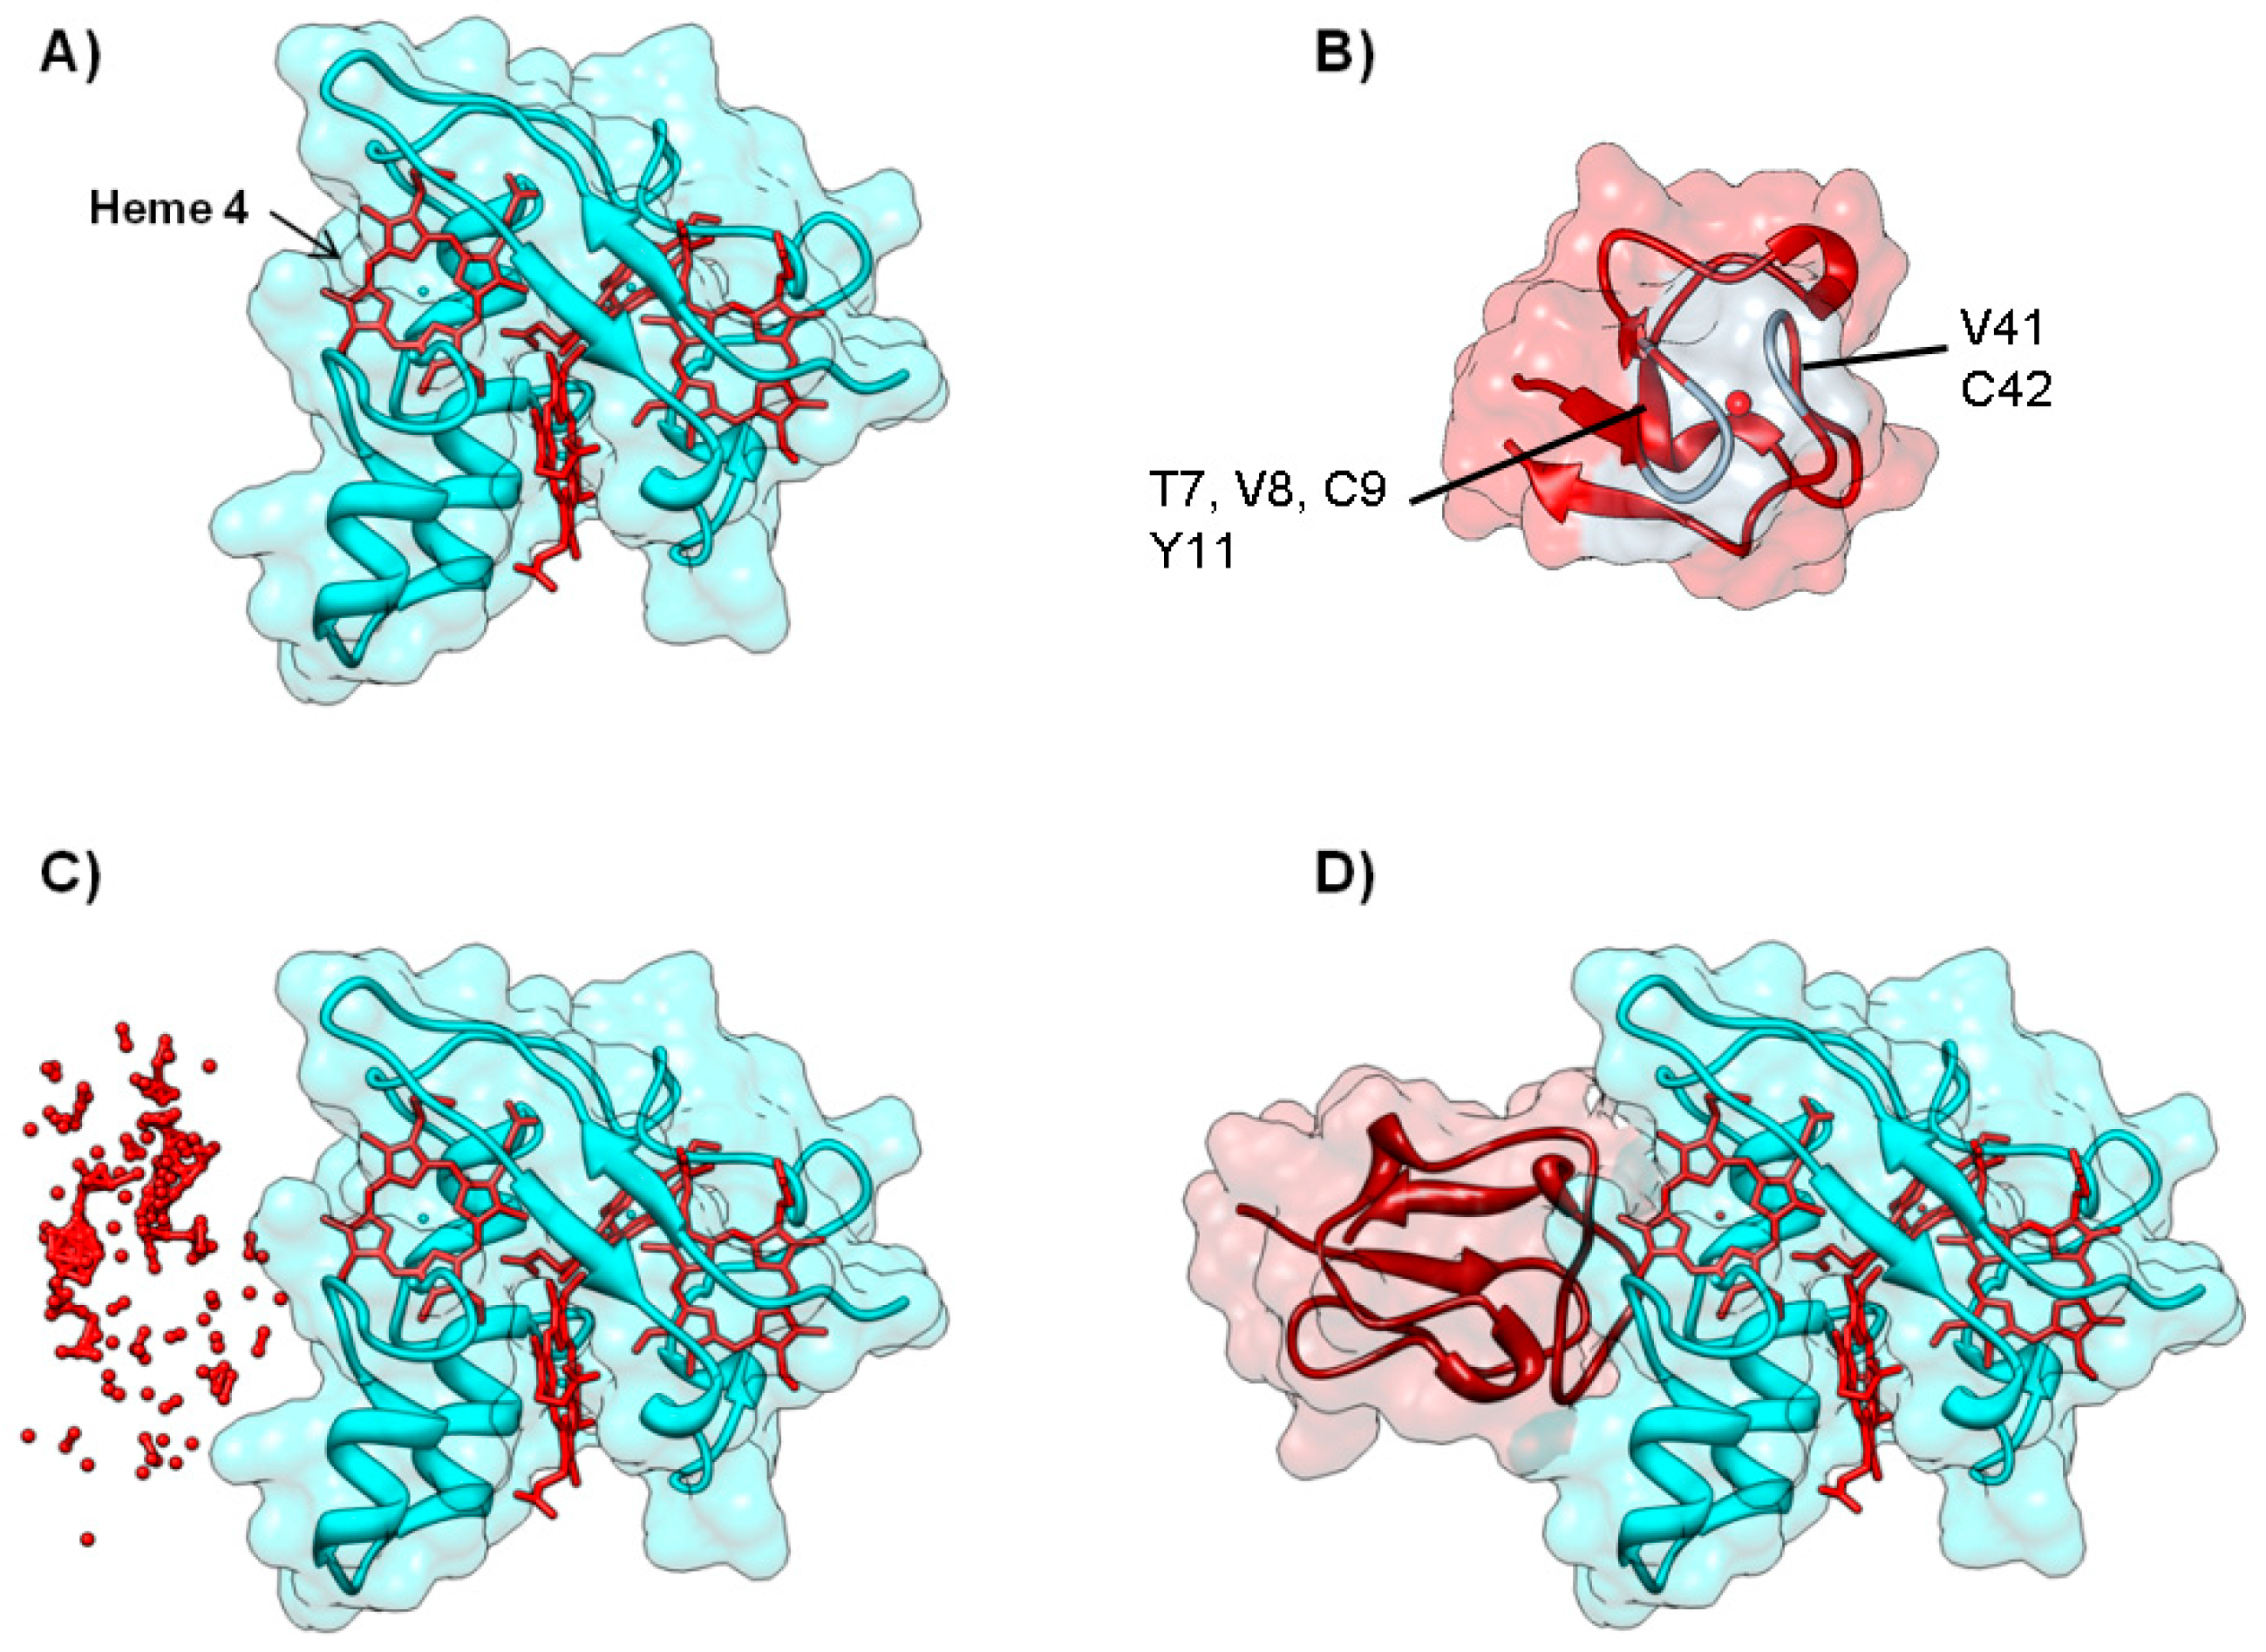
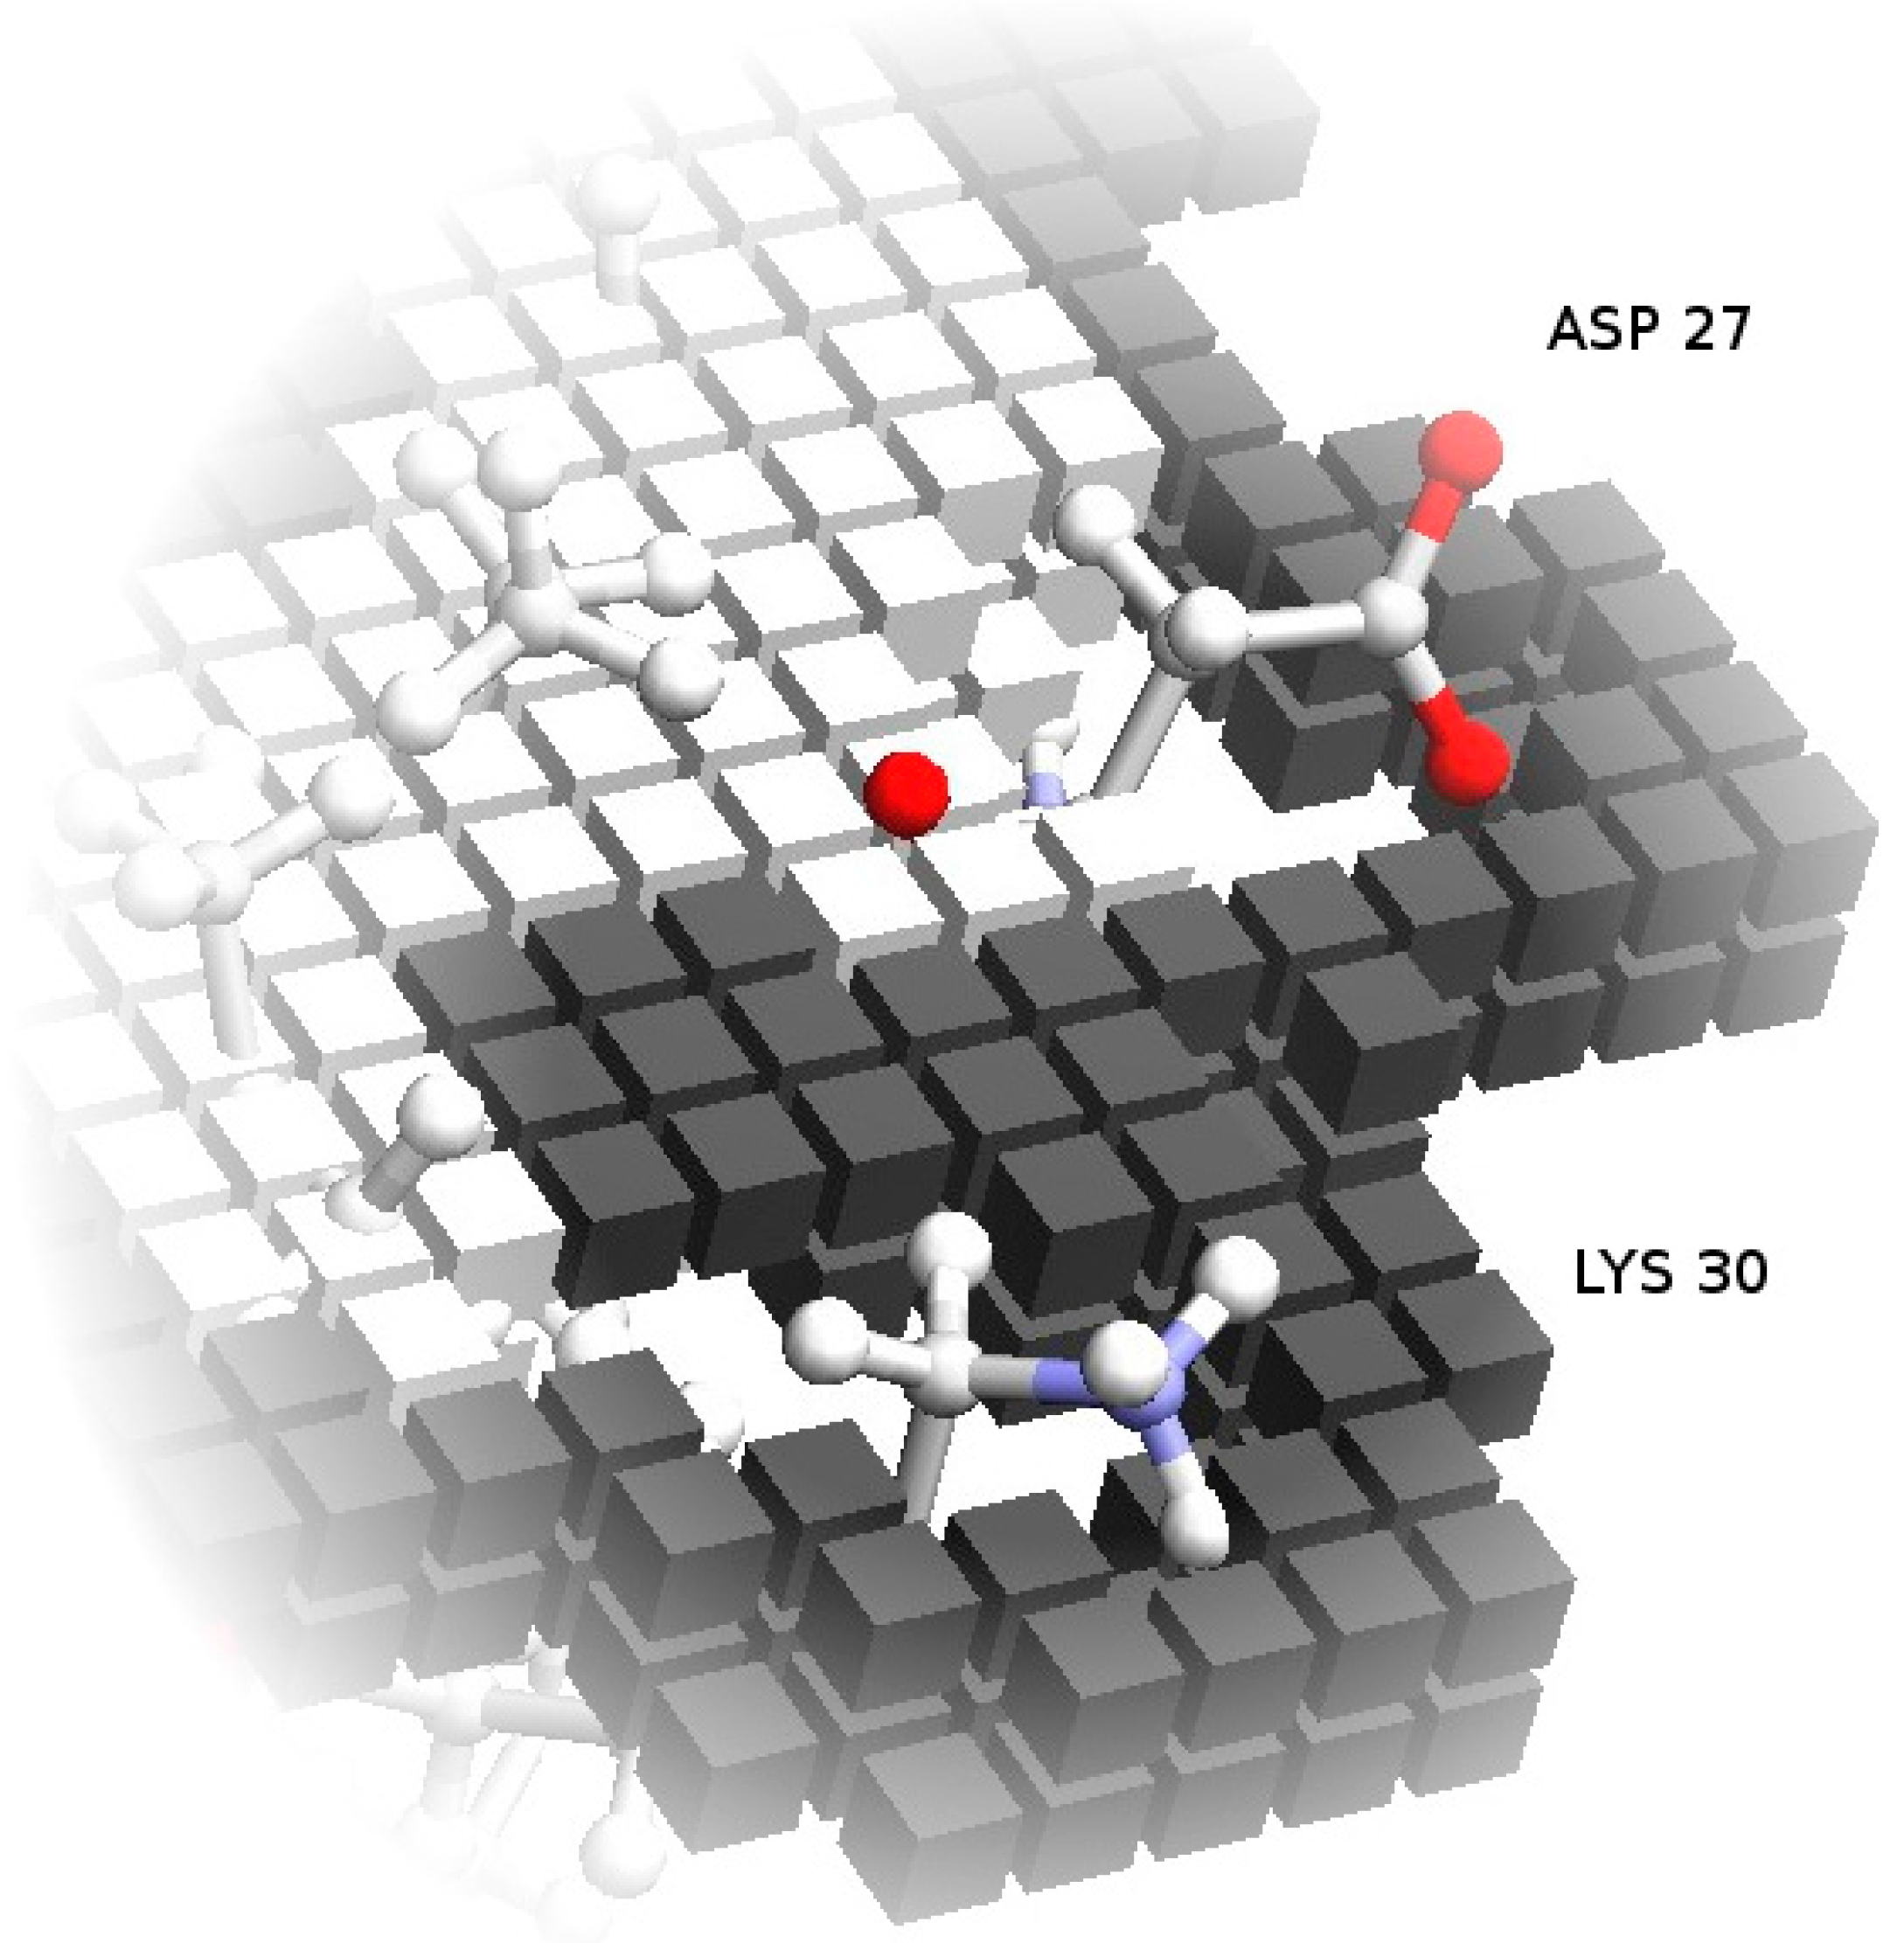
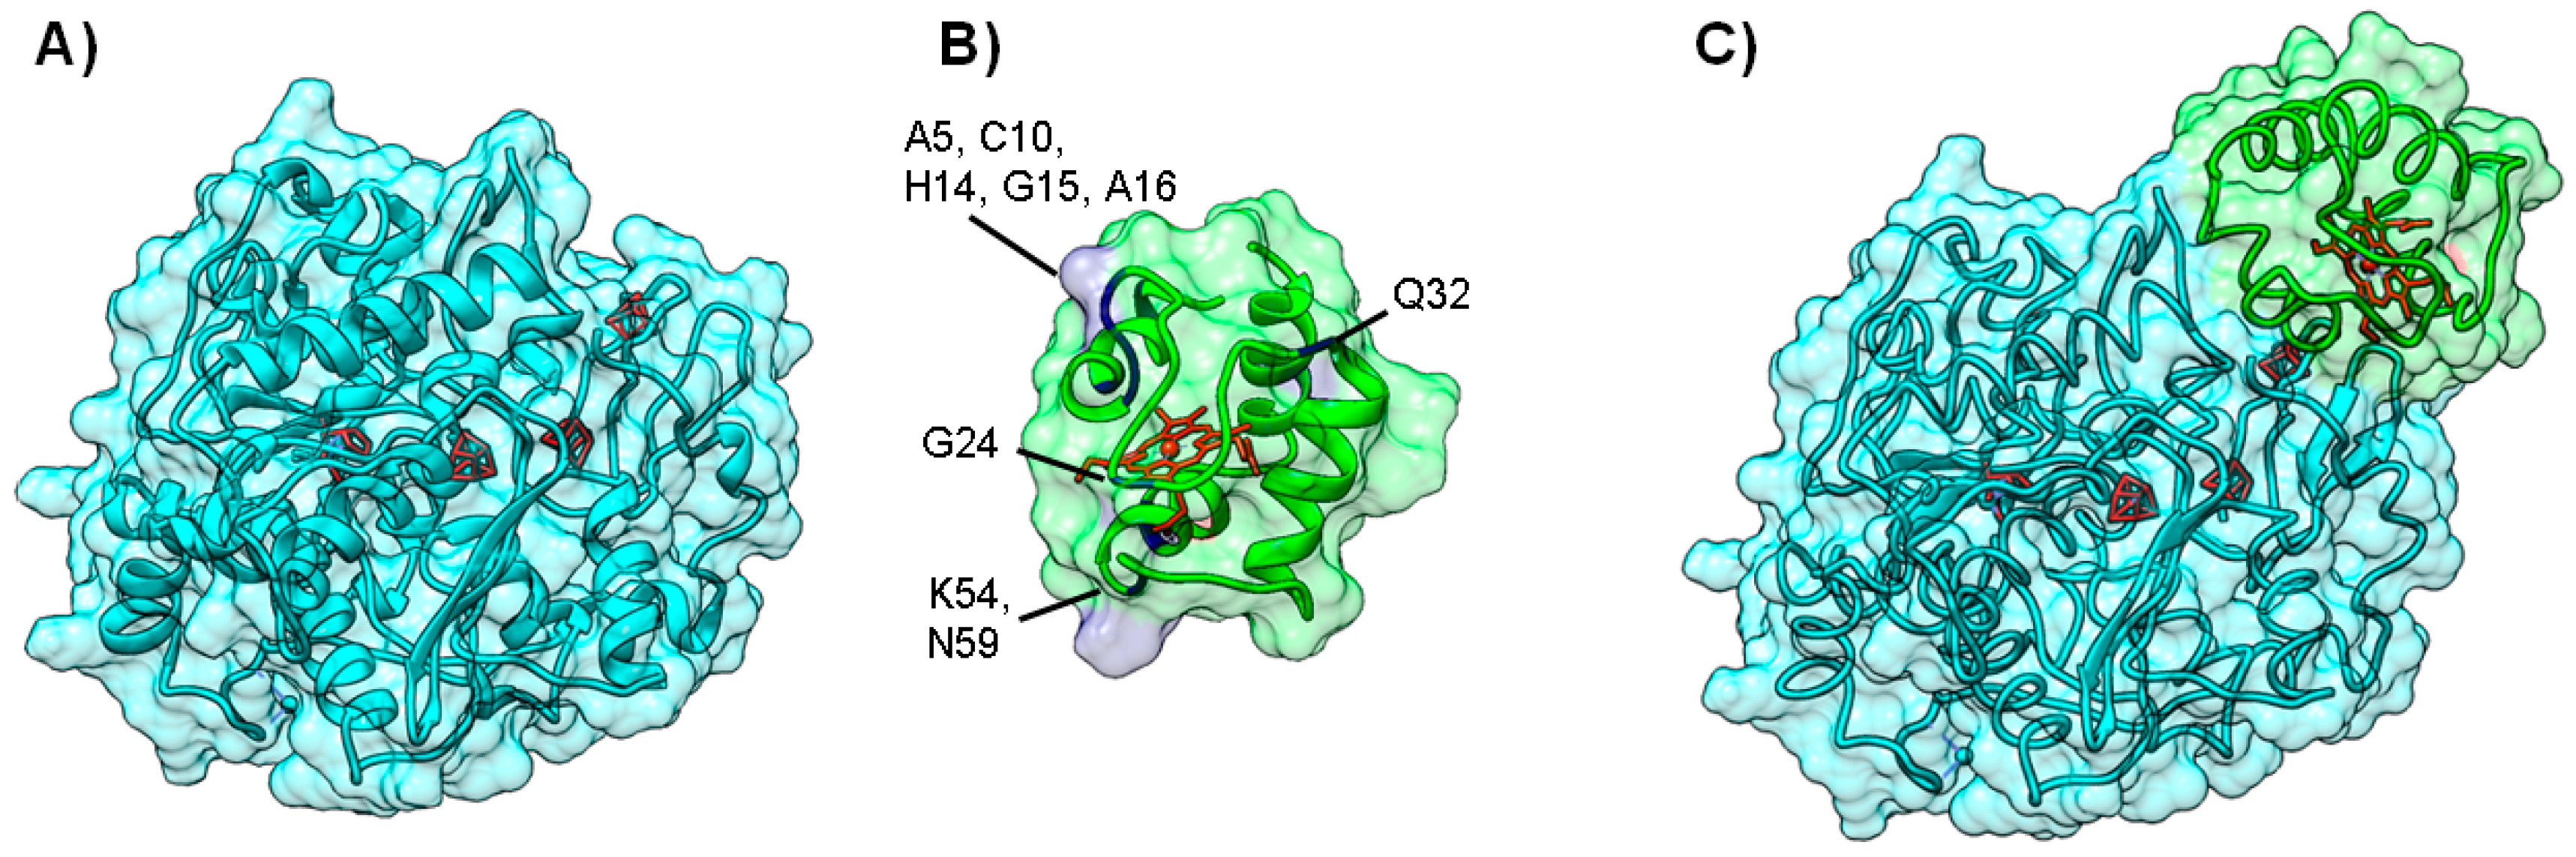
3.2. Important Residues in Complex Formation
3.3. Distance between Redox Centers
4. Case Studies
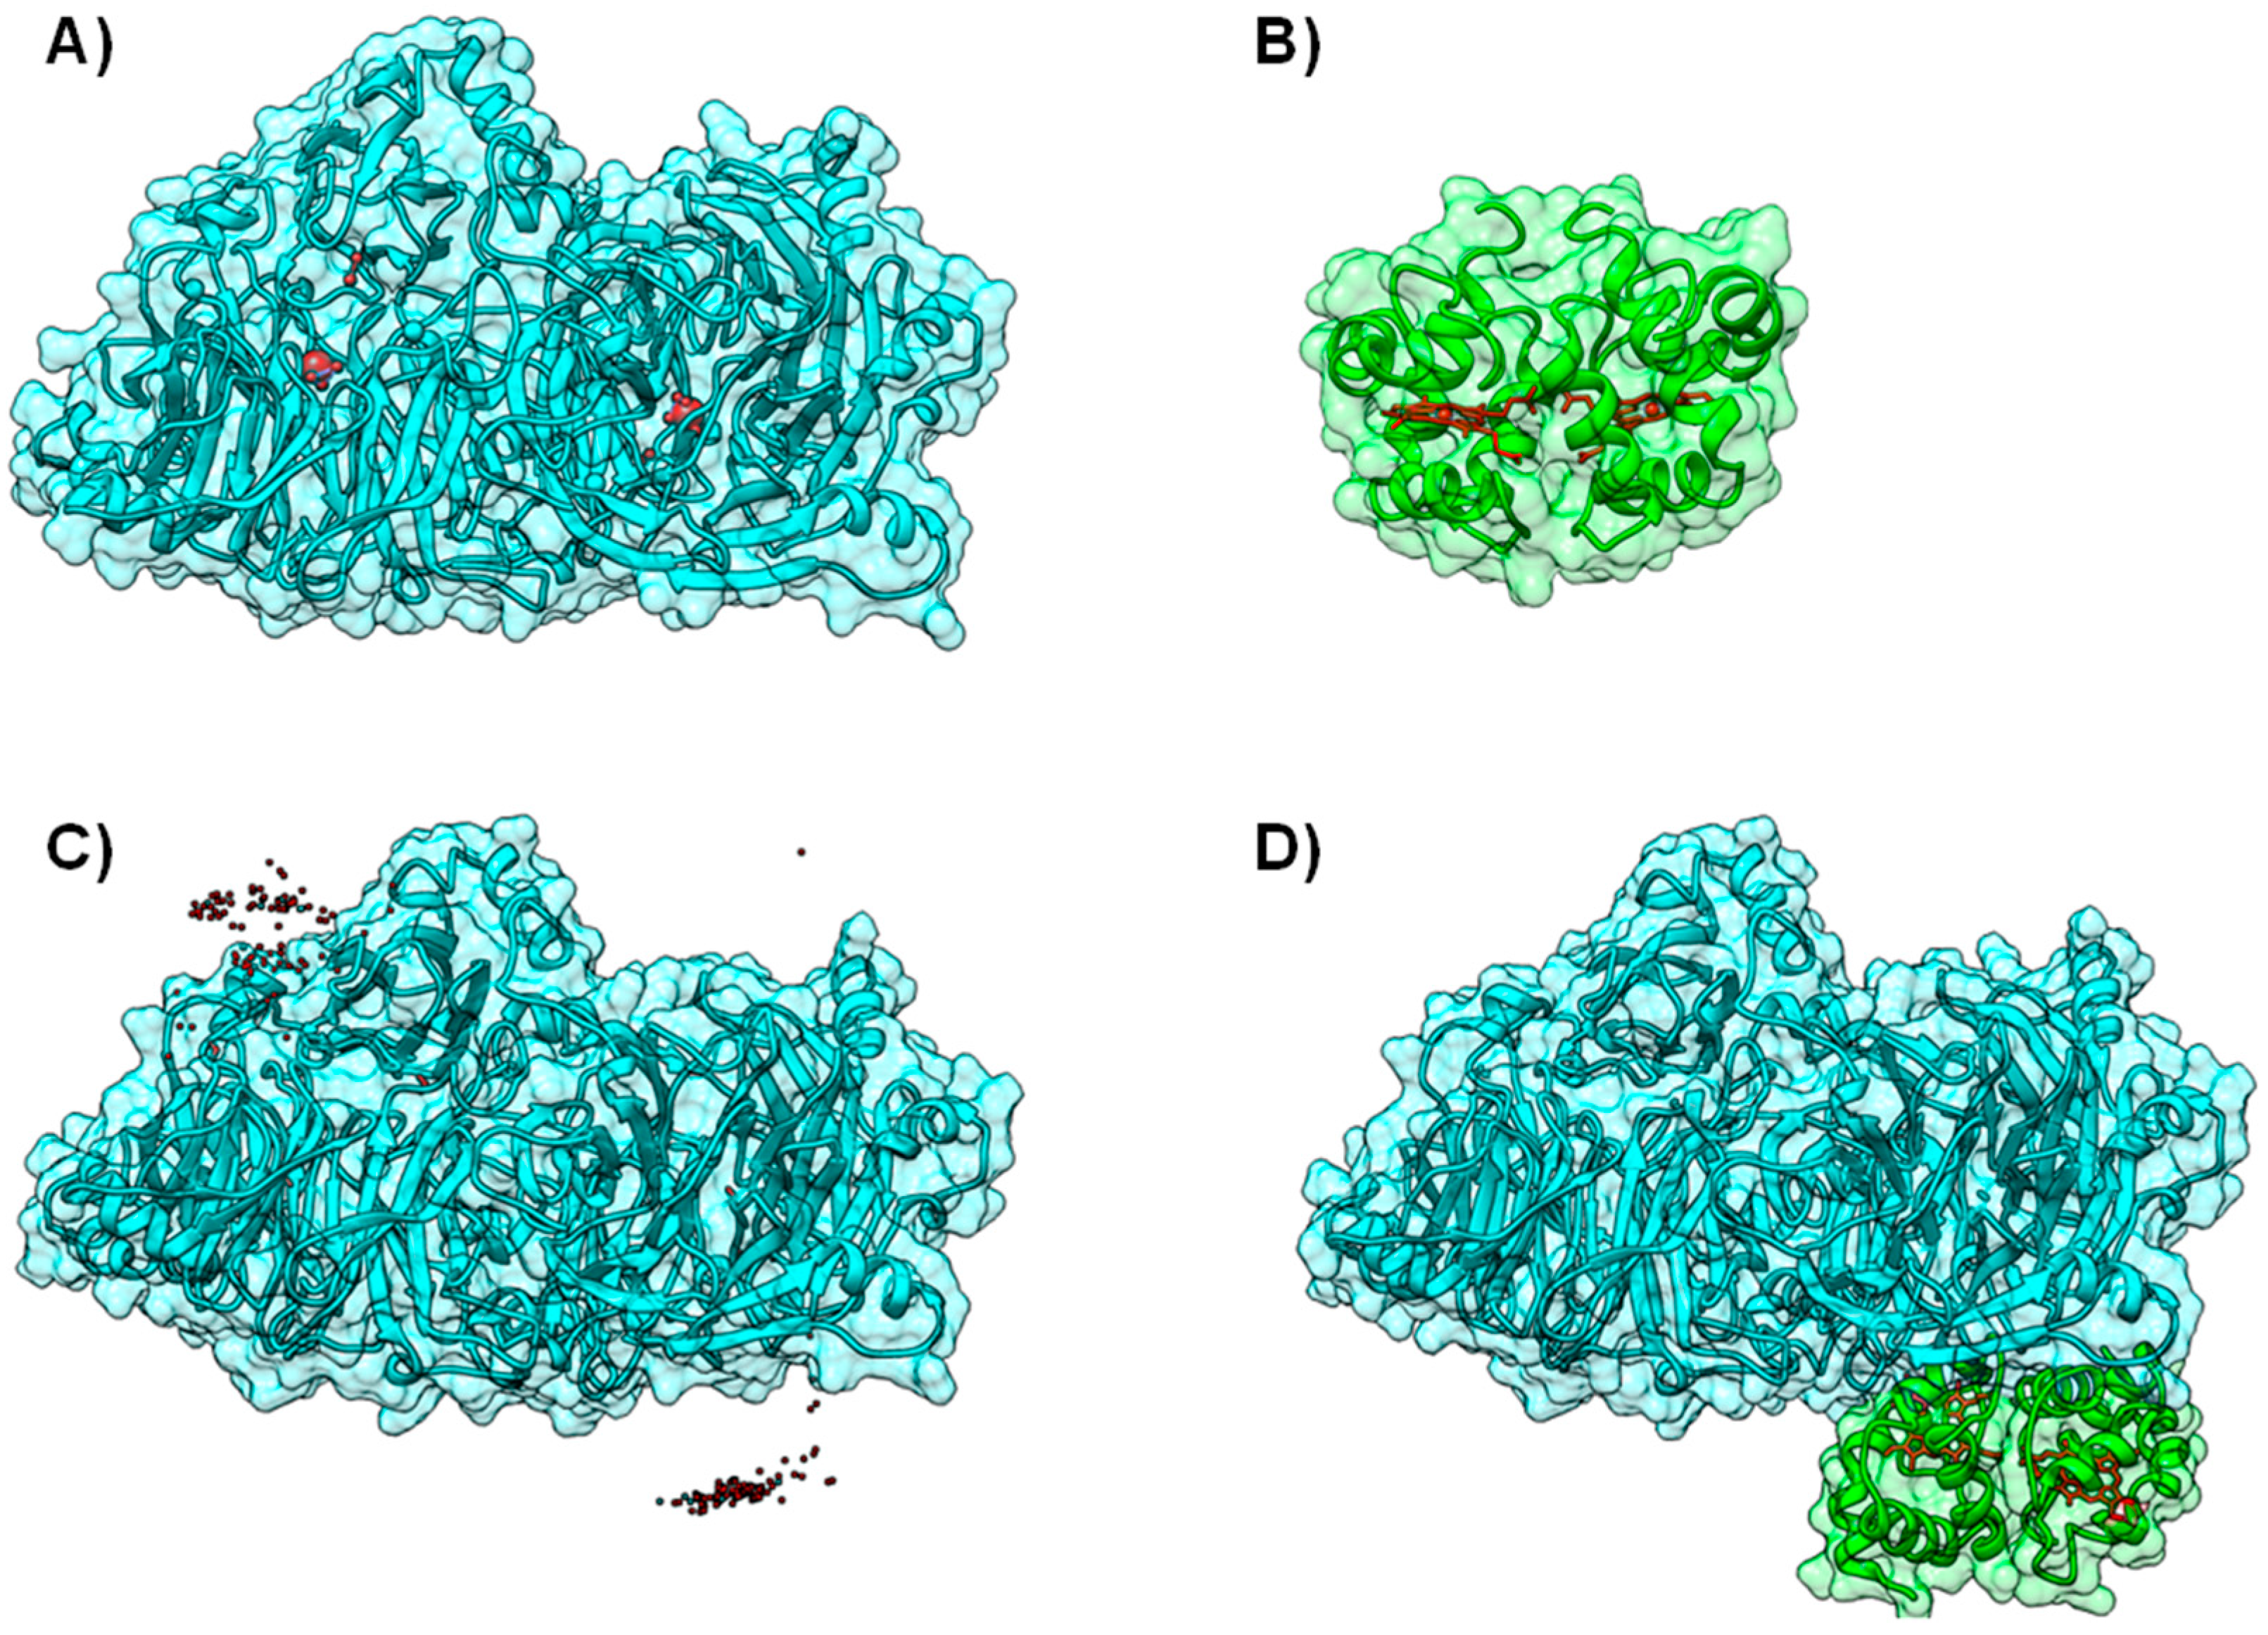
4.1. Case A—Docking without or Little Filtering
4.2. Case B—Solutions Filtered by Experimental Data
4.3. Case C—Information on the Interacting Surface from Both Partners
5. Discussion and Final Remarks
Supplementary Materials
Acknowledgments
Author Contributions
Conflicts of Interest
References
- Michaud, G.A.; Snyder, M. Proteomic approaches for the global analysis of proteins. Biotechniques 2002, 33, 1308–1316. [Google Scholar] [PubMed]
- Schwikowski, B.; Uetz, P.; Fields, S. A network of protein-protein interactions in yeast. Nat. Biotechnol. 2000, 18, 1257–1261. [Google Scholar] [CrossRef] [PubMed]
- Cagney, G.; Uetz, P.; Fields, S. High-throughput screening for protein-protein interactions using two-hybrid assay. Methods Enzymol. 2000, 328, 3–14. [Google Scholar] [PubMed]
- Uetz, P. Two-hybrid arrays. Curr. Opin. Chem. Biol. 2002, 6, 57–62. [Google Scholar] [CrossRef]
- Sowmya, G.; Ranganathan, S. Protein-protein interactions and prediction: A comprehensive overview. Protein Pept. Lett. 2013, 21, 779–789. [Google Scholar] [CrossRef]
- Cochran, A.G. Antagonists of protein-protein interactions. Chem. Biol. 2000, 7, R85–R94. [Google Scholar] [CrossRef]
- Wilson, A.J. Inhibition of protein-protein interactions using designed molecules. Chem. Soc. Rev. 2009, 38, 3289–3300. [Google Scholar] [CrossRef] [PubMed]
- Higueruelo, A.P.; Jubb, H.; Blundell, T.L. Protein-protein interactions as druggable targets: Recent technological advances. Curr. Opin. Pharmacol. 2013, 13, 791–796. [Google Scholar] [CrossRef] [PubMed]
- Fletcher, S.; Hamilton, A.D. Protein surface recognition and proteomimetics: Mimics of protein surface structure and function. Curr. Opin. Chem. Biol. 2005, 9, 632–638. [Google Scholar] [CrossRef] [PubMed]
- Janin, J. Principles of protein-protein recognition from structure to thermodynamics. Biochimie 1995, 77, 497–505. [Google Scholar] [CrossRef]
- Lo Conte, L.; Chothia, C.; Janin, J. The atomic structure of protein-protein recognition sites. J. Mol. Biol. 1999, 285, 2177–2198. [Google Scholar] [CrossRef] [PubMed]
- Bendall, D.S. Interprotein electron transfer. In Protein Electron Transfer; Bendall, D.S., Ed.; BIOS Scientific Publishers Ltd.: Oxford, UK, 1996; pp. 43–68. [Google Scholar]
- Smith, G.R.; Sternberg, M.J. Prediction of protein-protein interactions by docking methods. Curr. Opin. Struct. Biol. 2002, 12, 28–35. [Google Scholar] [CrossRef]
- Halperin, I.; Ma, B.; Wolfson, H.; Nussinov, R. Principles of docking: An overview of search algorithms and a guide to scoring functions. Proteins 2002, 47, 409–443. [Google Scholar] [CrossRef] [PubMed]
- Moal, I.H.; Moretti, R.; Baker, D.; Fernandez-Recio, J. Scoring functions for protein-protein interactions. Curr. Opin. Struct. Biol. 2013, 23, 862–867. [Google Scholar] [CrossRef] [PubMed]
- Moreira, I.S.; Fernandes, P.A.; Ramos, M.J. Protein-protein docking dealing with the unknown. J. Comput. Chem. 2010, 31, 317–342. [Google Scholar] [CrossRef] [PubMed]
- Huang, S.Y. Search strategies and evaluation in protein-protein docking: Principles, advances and challenges. Drug Discov. Today 2014, 19, 1081–1096. [Google Scholar] [CrossRef] [PubMed]
- Vakser, I.A. Protein-protein docking: From interaction to interactome. Biophys. J. 2014, 107, 1785–1793. [Google Scholar] [CrossRef] [PubMed]
- Huang, S.Y. Exploring the potential of global protein-protein docking: An overview and critical assessment of current programs for automatic ab initio docking. Drug Discov. Today 2015, 20, 969–977. [Google Scholar] [CrossRef] [PubMed]
- Ofran, Y.; Rost, B. Analysing six types of protein-protein interfaces. J. Mol. Biol. 2003, 325, 377–387. [Google Scholar] [CrossRef]
- Nooren, I.M.; Thornton, J.M. Structural characterisation and functional significance of transient protein-protein interactions. J. Mol. Biol. 2003, 325, 991–1018. [Google Scholar] [CrossRef]
- Guiles, R.D.; Sarma, S.; DiGate, R.J.; Banville, D.; Basus, V.J.; Kuntz, I.D.; Waskell, L. Pseudocontact shifts used in the restraint of the solution structures of electron transfer complexes. Nat. Struct. Biol. 1996, 3, 333–339. [Google Scholar] [CrossRef] [PubMed]
- Camacho, C.J.; Kimura, S.R.; DeLisi, C.; Vajda, S. Kinetics of desolvation-mediated protein-protein binding. Biophys. J. 2000, 78, 1094–1105. [Google Scholar] [CrossRef]
- Palma, P.N.; Krippahl, L.; Wampler, J.E.; Moura, J.J. Bigger: A new (soft) docking algorithm for predicting protein interactions. Proteins 2000, 39, 372–384. [Google Scholar] [CrossRef]
- Victor, B.L.; Vicente, J.B.; Rodrigues, R.; Oliveira, S.; Rodrigues-Pousada, C.; Frazao, C.; Gomes, C.M.; Teixeira, M.; Soares, C.M. Docking and electron transfer studies between rubredoxin and rubredoxin: Oxygen oxidoreductase. J. Biol. Inorg. Chem. 2003, 8, 475–488. [Google Scholar] [PubMed]
- Cunha, C.A.; Romao, M.J.; Sadeghi, S.J.; Valetti, F.; Gilardi, G.; Soares, C.M. Effects of protein-protein interactions on electron transfer: Docking and electron transfer calculations for complexes between flavodoxin and c-type cytochromes. J. Biol. Inorg. Chem. 1999, 4, 360–374. [Google Scholar] [PubMed]
- De Vries, S.J.; van Dijk, M.; Bonvin, A.M. The haddock web server for data-driven biomolecular docking. Nat. Protoc. 2010, 5, 883–897. [Google Scholar] [CrossRef] [PubMed]
- Park, H.; Lee, H.S.; Kim, S.J. Virtual screening with docking simulations and biochemical evaluation of vhy phosphatase inhibitors. Chem. Pharm. Bull. (Tokyo) 2015, 63, 807–811. [Google Scholar] [CrossRef] [PubMed]
- BiGGER. Available online: http://centria.di.fct.unl.pt/~ludi/chemera/index.html (accessed on 10 June 2016).
- Krippahl, L.; Barahona, P. Applying constraint programming to rigid body protein docking. Lect. Notes Comput. Sci. 2005, 3709, 373–387. [Google Scholar]
- Krippahl, L.; Madeira, F.; Barahona, P. Constraining protein docking with coevolution data for medical research. In Artificial Intelligence in Medicine; Peek, N., Marín Morales, R., Peleg, M., Eds.; Springer: Berlin, Germany, 2013; Volume 7885, pp. 110–114. [Google Scholar]
- Bourquard, T.; Bernauer, J.; Aze, J.; Poupon, A. A collaborative filtering approach for protein-protein docking scoring functions. PLoS ONE 2011, 6, e18541. [Google Scholar] [CrossRef] [PubMed]
- Janin, J. Assessing predictions of protein-protein interaction: The capri experiment. Protein Sci. 2005, 14, 278–283. [Google Scholar] [CrossRef] [PubMed]
- Fernández-Recio, J.; Sternberg, M.J.E. The 4th meeting on the critical assessment of predicted interaction (CAPRI) held at the mare nostrum, barcelona. Proteins Struct. Funct. Bioinform. 2010, 78, 3065–3066. [Google Scholar] [CrossRef]
- Krippahl, L.; Moura, J.J.; Palma, P.N. Modeling protein complexes with bigger. Proteins 2003, 52, 19–23. [Google Scholar] [CrossRef] [PubMed]
- Krippahl, L.; Barahona, P. Protein docking with predicted constraints. Algorithms Mol. Biol. 2015, 10, 9. [Google Scholar] [CrossRef] [PubMed]
- Krippahl, L.; Barahona, P. Improving protein docking with redundancy constraints. In Lecture Notes in Computer Science; Springer: Berlin, Germany, 2016; Volume CP-2016, in press. [Google Scholar]
- Hofmann, A.; Proust, J.; Dorowski, A.; Schantz, R.; Huber, R. Annexin 24 from capsicum annuum. X-ray structure and biochemical characterization. J. Biol. Chem. 2000, 275, 8072–8082. [Google Scholar] [CrossRef] [PubMed]
- Monaco, S.; Gioia, M.; Rodriguez, J.; Fasciglione, G.F.; di Pierro, D.; Lupidi, G.; Krippahl, L.; Marini, S.; Coletta, M. Modulation of the proteolytic activity of matrix metalloproteinase-2 (gelatinase A) on fibrinogen. Biochem. J. 2007, 402, 503–513. [Google Scholar] [CrossRef] [PubMed]
- Morelli, X.; Czjzek, M.; Hatchikian, C.E.; Bornet, O.; Fontecilla-Camps, J.C.; Palma, N.P.; Moura, J.J.; Guerlesquin, F. Structural model of the Fe-hydrogenase/cytochrome c553 complex combining transverse relaxation-optimized spectroscopy experiments and soft docking calculations. J. Biol. Chem. 2000, 275, 23204–23210. [Google Scholar] [CrossRef] [PubMed]
- Impagliazzo, A.; Krippahl, L.; Ubbink, M. Pseudoazurin-nitrite reductase interactions. Chembiochem 2005, 6, 1648–1653. [Google Scholar] [CrossRef] [PubMed]
- Banci, L.; Bertini, I.; Felli, I.C.; Krippahl, L.; Kubicek, K.; Moura, J.J.G.; Rosato, A. A further investigation of the cytochrome b5-cytochrome c complex. J. Biol. Inorg. Chem. 2003, 8, 777–786. [Google Scholar] [CrossRef] [PubMed]
- Palma, P.N.; Lagoutte, B.; Krippahl, L.; Moura, J.J.G.; Guerlesquin, F. Synechocystis ferredoxin/ferredoxin-NADP(+)-reductase/NADP(+) complex: Structural model obtained by NMR-restrained docking. Febs Lett. 2005, 579, 4585–4590. [Google Scholar] [CrossRef] [PubMed]
- Betts, J.N.; Beratan, D.N.; Onuchic, J.N. Mapping electron tunneling pathways: An algorithm that finds the ‘minimum length’/maximum coupling pathway between electron donors and acceptors in proteins. J. Am. Chem. Soc. 1992, 114, 4043–4046. [Google Scholar] [CrossRef]
- Regan, J.J.; Risser, S.M.; Beratan, D.N.; Onuchic, J.N. Protein electron transport: Single versus multiple pathways. J. Phys. Chem. 1992, 97, 13083–13088. [Google Scholar] [CrossRef]
- Nussinov, R.; Panchenko, A.R.; Przytycka, T. Physics approaches to protein interactions and gene regulation. Phys. Biol. 2011, 8. [Google Scholar] [CrossRef] [PubMed]
- Fong, J.H.; Shoemaker, B.A.; Panchenko, A.R. Intrinsic protein disorder in human pathways. Mol. Biosyst. 2012, 8, 320–326. [Google Scholar] [CrossRef] [PubMed]
- Morelli, X.J.; Palma, P.N.; Guerlesquin, F.; Rigby, A.C. A novel approach for assessing macromolecular complexes combining soft-docking calculations with nmr data. Protein Sci. 2001, 10, 2131–2137. [Google Scholar] [CrossRef] [PubMed]
- Krippahl, L.; Palma, P.N.; Moura, I.; Moura, J.J.G. Modelling the electron-transfer complex between aldehyde oxidoreductase and flavodoxin. Eur. J. Inorg. Chem. 2006, 3835–3840. [Google Scholar] [CrossRef]
- De la Rosa, M.A.; Navarro, J.A.; Diaz-Quintana, A.; de la Cerda, B.; Molina-Heredia, F.P.; Balme, A.; Murdoch Pdel, S.; Diaz-Moreno, I.; Duran, R.V.; Hervas, M. An evolutionary analysis of the reaction mechanisms of photosystem I reduction by cytochrome c6 and plastocyanin. Bioelectrochemistry 2002, 55, 41–45. [Google Scholar] [CrossRef]
- Hart, S.E.; Schlarb-Ridley, B.G.; Delon, C.; Bendall, D.S.; Howe, C.J. Role of charges on cytochrome f from the cyanobacterium phormidium laminosum in its interaction with plastocyanin. Biochemistry 2003, 42, 4829–4836. [Google Scholar] [CrossRef] [PubMed]
- Pauleta, S.R.; Guerlesquin, F.; Goodhew, C.F.; Devreese, B.; van Beeumen, J.; Pereira, A.S.; Moura, I.; Pettigrew, G.W. Paracoccus pantotrophus pseudoazurin is an electron donor to cytochrome c peroxidase. Biochemistry 2004, 43, 11214–11225. [Google Scholar] [CrossRef] [PubMed]
- Alves, T.; Besson, S.; Duarte, L.C.; Pettigrew, G.W.; Girio, F.M.; Devreese, B.; Vandenberghe, I.; van Beeumen, J.; Fauque, G.; Moura, I. A cytochrome c peroxidase from pseudomonas nautica 617 active at high ionic strength: Expression, purification and characterization. Biochim. Biophys. Acta 1999, 1434, 248–259. [Google Scholar] [CrossRef]
- Dell’Acqua, S.; Pauleta, S.R.; Monzani, E.; Pereira, A.S.; Casella, L.; Moura, J.J.G.; Moura, I. Electron transfer complex between nitrous oxide reductase and cytochrome c552 from pseudomonas nautica: Kinetic, nuclear magnetic resonance, and docking studies. Biochemistry 2008, 47, 10852–10862. [Google Scholar] [CrossRef] [PubMed]
- Czjzek, M.; ElAntak, L.; Zamboni, V.; Morelli, X.; Dolla, A.; Guerlesquin, F.; Bruschi, M. The crystal structure of the hexadeca-heme cytochrome hmc and a structural model of its complex with cytochrome c3. Structure 2002, 10, 1677–1686. [Google Scholar] [CrossRef]
- ElAntak, L.; Morelli, X.; Bornet, O.; Hatchikian, C.; Czjzek, M.; Alain, D.A.; Guerlesquin, F. The cytochrome c3-[Fe]-hydrogenase electron-transfer complex: Structural model by nmr restrained docking. Febs Lett. 2003, 548, 1–4. [Google Scholar] [CrossRef]
- Giron-Monzon, L.; Manelyte, L.; Ahrends, R.; Kirsch, D.; Spengler, B.; Friedhoff, P. Mapping protein-protein interactions between mutl and muth by cross-linking. J. Biol. Chem. 2004, 279, 49338–49345. [Google Scholar] [CrossRef] [PubMed]
- Winkler, M.; Kuhlgert, S.; Hippler, M.; Happe, T. Characterization of the key step for light-driven hydrogen evolution in green algae. J. Biol. Chem. 2009, 284, 36620–36627. [Google Scholar] [CrossRef] [PubMed]
- Winkler, J.R. Electron tunneling pathways in proteins. Curr. Opin. Chem. Biol. 2000, 4, 192–198. [Google Scholar] [CrossRef]
- Gray, H.B.; Winkler, J.R. Long-range electron transfer. Proc. Natl. Acad. Sci. USA 2005, 102, 3534–3539. [Google Scholar] [CrossRef] [PubMed]
- Enroth, C.; Eger, B.T.; Okamoto, K.; Nishino, T.; Nishino, T.; Pai, E.F. Crystal structures of bovine milk xanthine dehydrogenase and xanthine oxidase: Structure-based mechanism of conversion. Proc. Natl. Acad. Sci. USA 2000, 97, 10723–10728. [Google Scholar] [CrossRef] [PubMed]
- Dobbek, H.; Gremer, L.; Meyer, O.; Huber, R. Crystal structure and mechanism of co dehydrogenase, a molybdo iron-sulfur flavoprotein containing S-selanylcysteine. Proc. Natl. Acad. Sci. USA 1999, 96, 8884–8889. [Google Scholar] [CrossRef] [PubMed]
- Truglio, J.J.; Theis, K.; Leimkuhler, S.; Rappa, R.; Rajagopalan, K.V.; Kisker, C. Crystal structures of the active and alloxanthine-inhibited forms of xanthine dehydrogenase from rhodobacter capsulatus. Structure 2002, 10, 115–125. [Google Scholar] [CrossRef]
- Moura, J.J.; Barata, B.A. Aldehyde oxidoreductases and other molybdenum-containing enzymes. Methods Enzymol. 1994, 243, 24–42. [Google Scholar] [PubMed]
- Rebelo, J.M.; Dias, J.M.; Huber, R.; Moura, J.J.; Romao, M.J. Structure refinement of the aldehyde oxidoreductase from Desulfovibrio gigas (MOP) at 1.28 Å. J. Biol. Inorg. Chem. 2001, 6, 791–800. [Google Scholar] [CrossRef] [PubMed]
- Romao, M.J.; Archer, M.; Moura, I.; Moura, J.J.; LeGall, J.; Engh, R.; Schneider, M.; Hof, P.; Huber, R. Crystal structure of the xanthine oxidase-related aldehyde oxido-reductase from d. Gigas. Science (New York) 1995, 270, 1170–1176. [Google Scholar] [CrossRef]
- Breese, K.; Fuchs, G. 4-hydroxybenzoyl-coa reductase (dehydroxylating) from the denitrifying bacterium thauera aromatica—Prosthetic groups, electron donor, and genes of a member of the molybdenum-flavin-iron-sulfur proteins. Eur. J. Biochem. FEBS 1998, 251, 916–923. [Google Scholar] [CrossRef]
- Unciuleac, M.; Warkentin, E.; Page, C.C.; Boll, M.; Ermler, U. Structure of a xanthine oxidase-related 4-hydroxybenzoyl-coa reductase with an additional [4Fe-4S] cluster and an inverted electron flow. Structure 2004, 12, 2249–2256. [Google Scholar] [CrossRef] [PubMed]
- Pettersen, E.F.; Goddard, T.D.; Huang, C.C.; Couch, G.S.; Greenblatt, D.M.; Meng, E.C.; Ferrin, T.E. UCSF chimera—A visualization system for exploratory research and analysis. J. Comput. Chem. 2004, 25, 1605–1612. [Google Scholar] [CrossRef] [PubMed]
- Barata, B.A.; LeGall, J.; Moura, J.J. Aldehyde oxidoreductase activity in desulfovibrio gigas: In vitro reconstitution of an electron-transfer chain from aldehydes to the production of molecular hydrogen. Biochemistry 1993, 32, 11559–11568. [Google Scholar] [CrossRef] [PubMed]
- Watenpaugh, K.D.; Sieker, L.C.; Jensen, L.H.; Legall, J.; Dubourdieu, M. Structure of the oxidized form of a flavodoxin at 2.5-angstrom resolution: Resolution of the phase ambiguity by anomalous scattering. Proc. Natl. Acad. Sci. USA 1972, 69, 3185–3188. [Google Scholar] [CrossRef] [PubMed]
- Hsieh, Y.C.; Chia, T.S.; Fun, H.K.; Chen, C.J. Crystal structure of dimeric flavodoxin from desulfovibrio gigas suggests a potential binding region for the electron-transferring partner. Int. J. Mol. Sci. 2013, 14, 1667–1683. [Google Scholar] [CrossRef] [PubMed]
- Pauleta, S.R.; Dell’Acqua, S.; Moura, I. Nitrous oxide reductase. Coord. Chem. Rev. 2013, 257, 332–349. [Google Scholar] [CrossRef]
- Zumft, W.G.; Kroneck, P.M. Respiratory transformation of nitrous oxide (N2O) to dinitrogen by bacteria and archaea. Adv. Microb. Physiol. 2007, 52, 107–227. [Google Scholar] [PubMed]
- Dell’Acqua, S.; Moura, I.; Moura, J.J.G.; Pauleta, S.R. The electron transfer complex between nitrous oxide reductase and its electron donors. J. Biol. Inorg. Chem. 2011, 16, 1241–1254. [Google Scholar] [CrossRef] [PubMed]
- Brown, K.; Tegoni, M.; Prudencio, M.; Pereira, A.S.; Besson, S.; Moura, J.J.; Moura, I.; Cambillau, C. A novel type of catalytic copper cluster in nitrous oxide reductase. Nat. Struct. Biol. 2000, 7, 191–195. [Google Scholar] [CrossRef] [PubMed]
- Brown, K.; Djinovic-Carugo, K.; Haltia, T.; Cabrito, I.; Saraste, M.; Moura, J.J.; Moura, I.; Tegoni, M.; Cambillau, C. Revisiting the catalytic cuz cluster of nitrous oxide (N2O) reductase. Evidence of a bridging inorganic sulfur. J. Biol. Chem. 2000, 275, 41133–41136. [Google Scholar] [CrossRef] [PubMed]
- Paraskevopoulos, K.; Antonyuk, S.V.; Sawers, R.G.; Eady, R.R.; Hasnain, S.S. Insight into catalysis of nitrous oxide reductase from high-resolution structures of resting and inhibitor-bound enzyme from achromobacter cycloclastes. J. Mol. Biol. 2006, 362, 55–65. [Google Scholar] [CrossRef] [PubMed]
- Brown, K.; Nurizzo, D.; Besson, S.; Shepard, W.; Moura, J.; Moura, I.; Tegoni, M.; Cambillau, C. Mad structure of pseudomonas nautica dimeric cytochrome c552 mimicks the c4 dihemic cytochrome domain association. J. Mol. Biol. 1999, 289, 1017–1028. [Google Scholar] [CrossRef] [PubMed]
- Pettigrew, G.W.; Goodhew, C.F.; Cooper, A.; Nutley, M.; Jumel, K.; Harding, S.E. The electron transfer complexes of cytochrome c peroxidase from paracoccus denitrificans. Biochemistry 2003, 42, 2046–2055. [Google Scholar] [CrossRef] [PubMed]
- Kataoka, K.; Yamaguchi, K.; Kobayashi, M.; Mori, T.; Bokui, N.; Suzuki, S. Structure-based engineering of alcaligenes xylosoxidans copper-containing nitrite reductase enhances intermolecular electron transfer reaction with pseudoazurin. J. Biol. Chem. 2004, 279, 53374–53378. [Google Scholar] [CrossRef] [PubMed]
- Pettigrew, G.W.; Echalier, A.; Pauleta, S.R. Structure and mechanism in the bacterial dihaem cytochrome c peroxidases. J. Inorg. Biochem. 2006, 100, 551–567. [Google Scholar] [CrossRef] [PubMed]
- Traore, A.S.; Fardeau, M.L.; Hatchikian, C.E.; Le Gall, J.; Belaich, J.P. Energetics of growth of a defined mixed culture of desulfovibrio vulgaris and methanosarcina barkeri: Interspecies hydrogen transfer in batch and continuous cultures. Appl. Environ. Microbiol. 1983, 46, 1152–1156. [Google Scholar] [PubMed]
- Widdel, F.; Hansen, T.A. The dissimilatory sulphate and sulphur-reducing bacteria. In The Prokaryotes; Springer: New York, NY, USA, 1991; Volume 2, pp. 583–624. [Google Scholar]
- Shafaat, H.S.; Rudiger, O.; Ogata, H.; Lubitz, W. [NiFe] hydrogenases: A common active site for hydrogen metabolism under diverse conditions. Biochim. Biophys. Acta 2013, 1827, 986–1002. [Google Scholar] [CrossRef] [PubMed]
- Tran, P.D.; Barber, J. Proton reduction to hydrogen in biological and chemical systems. Phys. Chem. Chem. Phys. 2012, 14, 13772–13784. [Google Scholar] [CrossRef] [PubMed]
- Nicolet, Y.; Piras, C.; Legrand, P.; Hatchikian, C.E.; Fontecilla-Camps, J.C. Desulfovibrio desulfuricans iron hydrogenase: The structure shows unusual coordination to an active site fe binuclear center. Structure 1999, 7, 13–23. [Google Scholar] [CrossRef]
- Verhagen, M.F.; Wolbert, R.B.; Hagen, W.R. Cytochrome c553 from desulfovibrio vulgaris (hildenborough). Electrochemical properties and electron transfer with hydrogenase. Eur. J. Biochem. FEBS 1994, 221, 821–829. [Google Scholar] [CrossRef]
- Blackledge, M.J.; Guerlesquin, F.; Marion, D. Comparison of low oxidoreduction potential cytochrome c553 from desulfovibrio vulgaris with the class i cytochrome c family. Proteins 1996, 24, 178–194. [Google Scholar] [CrossRef]
- Blackledge, M.J.; Medvedeva, S.; Poncin, M.; Guerlesquin, F.; Bruschi, M.; Marion, D. Structure and dynamics of ferrocytochrome c553 from desulfovibrio vulgaris studied by nmr spectroscopy and restrained molecular dynamics. J. Mol. Biol. 1995, 245, 661–681. [Google Scholar] [CrossRef] [PubMed]
- Pervushin, K.; Riek, R.; Wider, G.; Wuthrich, K. Attenuated T2 relaxation by mutual cancellation of dipole-dipole coupling and chemical shift anisotropy indicates an avenue to NMR structures of very large biological macromolecules in solution. Proc. Natl. Acad. Sci. USA 1997, 94, 12366–12371. [Google Scholar] [CrossRef] [PubMed]
- Zuiderweg, E.R. Mapping protein-protein interactions in Solution by nmr spectroscopy. Biochemistry 2002, 41, 1–7. [Google Scholar] [CrossRef] [PubMed]
- Sebban-Kreuzer, C.; Blackledge, M.; Dolla, A.; Marion, D.; Guerlesquin, F. Tyrosine 64 of cytochrome c553 is required for electron exchange with formate dehydrogenase in desulfovibrio vulgaris hildenborough. Biochemistry 1998, 37, 8331–8340. [Google Scholar] [CrossRef] [PubMed]
- Almeida, R.M.; Pauleta, S.R.; Moura, I.; Moura, J.J.G. Rubredoxin as a paramagnetic relaxation-inducing probe. J. Inorg. Biochem. 2009, 103, 1245–1253. [Google Scholar] [CrossRef] [PubMed]
- Pieulle, L.; Morelli, X.; Gallice, P.; Lojou, E.; Barbier, P.; Czjzek, M.; Bianco, P.; Guerlesquin, F.; Hatchikian, E.C. The type I/type II cytochrome c3 complex: An electron transfer link in the hydrogen-sulfate reduction pathway. J. Mol. Biol. 2005, 354, 73–90. [Google Scholar] [CrossRef] [PubMed]
- Meyer, J.; Moulis, J.M. Rubredoxin. In Handbook of Metalloproteins; Messerschmidt, A., Huber, R., Wieghardt, K., Poulos, T., Eds.; John Wiley and Sons, Inc.: New York, NY, USA, 2001. [Google Scholar]
- Bertini, I.; Luchinat, C.; Parigi, G.; Pierattelli, R. NMR spectroscopy of paramagnetic metalloproteins. Chembiochem 2005, 6, 1536–1549. [Google Scholar] [CrossRef] [PubMed]
- Kukimoto, M.; Nishiyama, M.; Ohnuki, T.; Turley, S.; Adman, E.T.; Horinouchi, S.; Beppu, T. Identification of interaction site of pseudoazurin with its redox partner, copper-containing nitrite reductase from alcaligenes faecalis s-6. Protein Eng. 1995, 8, 153–158. [Google Scholar] [CrossRef] [PubMed]
- Kukimoto, M.; Nishiyama, M.; Tanokura, M.; Adman, E.T.; Horinouchi, S. Studies on protein-protein interaction between copper-containing nitrite reductase and pseudoazurin from alcaligenes faecalis s-6. J. Biol. Chem. 1996, 271, 13680–13683. [Google Scholar] [PubMed]
- Dominguez, C.; Boelens, R.; Bonvin, A.M. Haddock: A protein-protein docking approach based on biochemical or biophysical information. J. Am. Chem. Soc. 2003, 125, 1731–1737. [Google Scholar] [CrossRef] [PubMed]
- Van Zundert, G.C.; Bonvin, A.M. Modeling protein-protein complexes using the haddock webserver “modeling protein complexes with haddock”. Methods Mol. Biol. 2014, 1137, 163–179. [Google Scholar] [PubMed]
- Jonker, H.R.A.; Wechselberger, R.W.; Boelens, R.; Folkers, G.E.; Kaptein, R. Structural properties of the promiscuous VP16 activation domain. Biochemistry 2005, 44, 827–839. [Google Scholar] [CrossRef] [PubMed]
- Xu, X.; Schuermann, P.; Chung, J.-S.; Hass, M.A.S.; Kim, S.-K.; Hirasawa, M.; Tripathy, J.N.; Knaff, D.B.; Ubbink, M. Ternary protein complex of ferredoxin, ferredoxin:Thioredoxin reductase, and thioredoxin studied by paramagnetic nmr spectroscopy. J. Am. Chem. Soc. 2009, 131, 17576–17582. [Google Scholar] [CrossRef] [PubMed]
- Monini, P.; Cafaro, A.; Srivastava, I.K.; Moretti, S.; Sharma, V.A.; Andreini, C.; Chiozzini, C.; Ferrantelli, F.; Cossut, M.R.; Tripiciano, A.; et al. HIV-1 tat promotes integrin-mediated hiv transmission to dendritic cells by binding env spikes and competes neutralization by anti-hiv antibodies. PLoS ONE 2012, 7, e48781. [Google Scholar] [CrossRef] [PubMed]
- Sample Availability: Not available.


© 2016 by the authors. Licensee MDPI, Basel, Switzerland. This article is an open access article distributed under the terms and conditions of the Creative Commons Attribution (CC-BY) license ( http://creativecommons.org/licenses/by/4.0/).
Share and Cite
Almeida, R.M.; Dell’Acqua, S.; Krippahl, L.; Moura, J.J.G.; Pauleta, S.R. Predicting Protein-Protein Interactions Using BiGGER: Case Studies. Molecules 2016, 21, 1037. https://doi.org/10.3390/molecules21081037
Almeida RM, Dell’Acqua S, Krippahl L, Moura JJG, Pauleta SR. Predicting Protein-Protein Interactions Using BiGGER: Case Studies. Molecules. 2016; 21(8):1037. https://doi.org/10.3390/molecules21081037
Chicago/Turabian StyleAlmeida, Rui M., Simone Dell’Acqua, Ludwig Krippahl, José J. G. Moura, and Sofia R. Pauleta. 2016. "Predicting Protein-Protein Interactions Using BiGGER: Case Studies" Molecules 21, no. 8: 1037. https://doi.org/10.3390/molecules21081037