
GADD45a Regulates Olaquindox-Induced DNA Damage and S-Phase Arrest in Human Hepatoma G2 Cells via JNK/p38 Pathways

Abstract
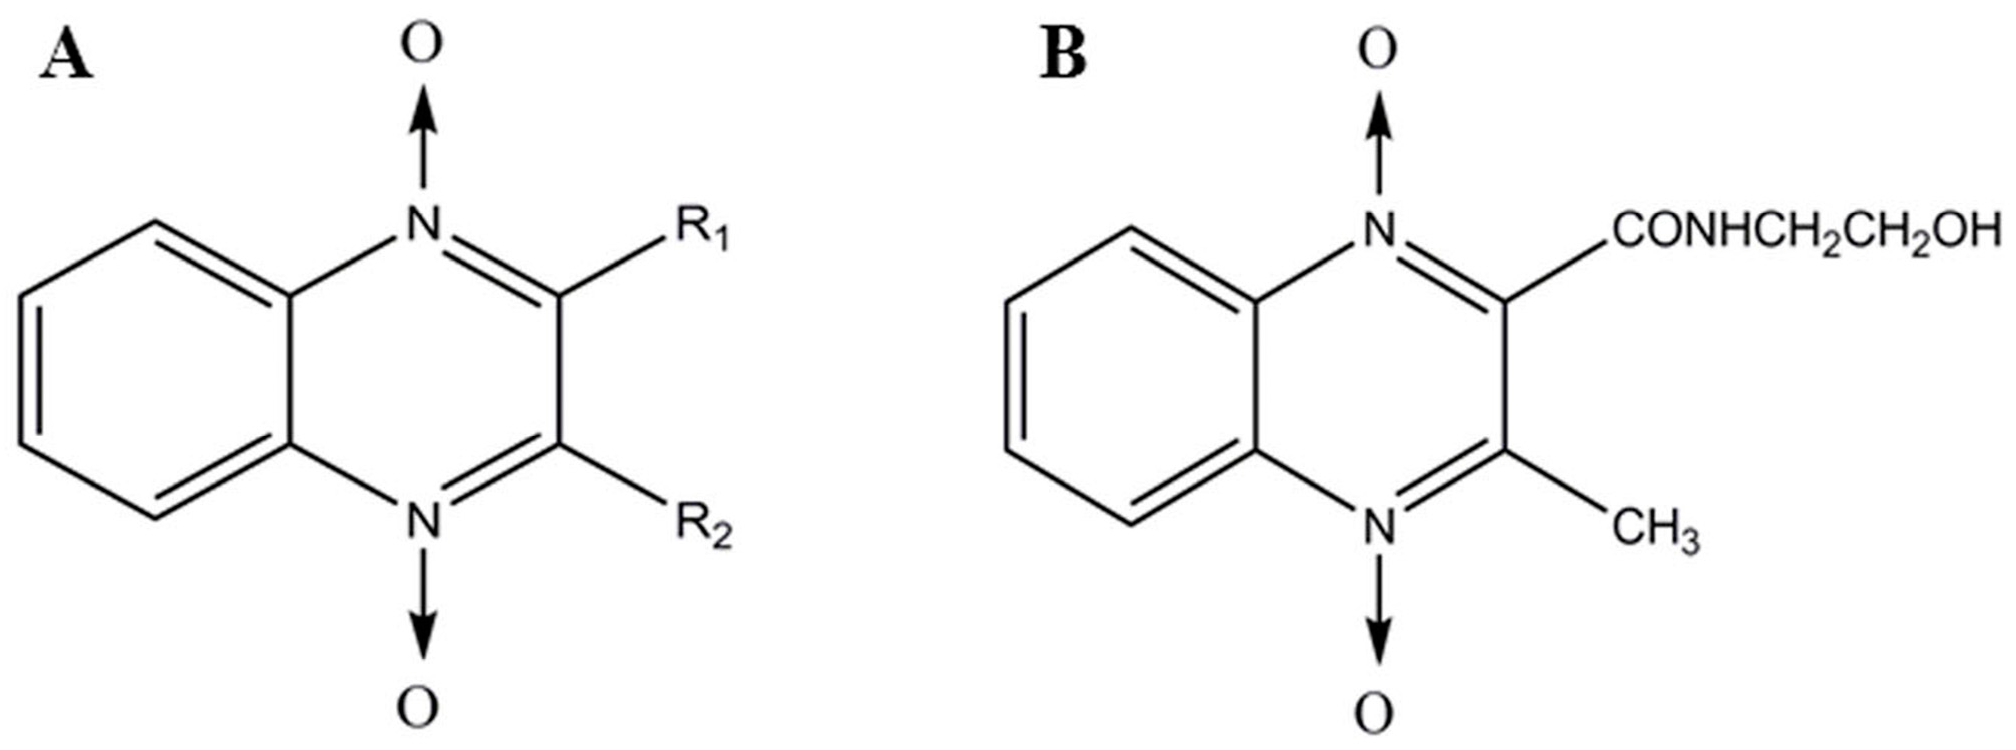
:1. Introduction
2. Results
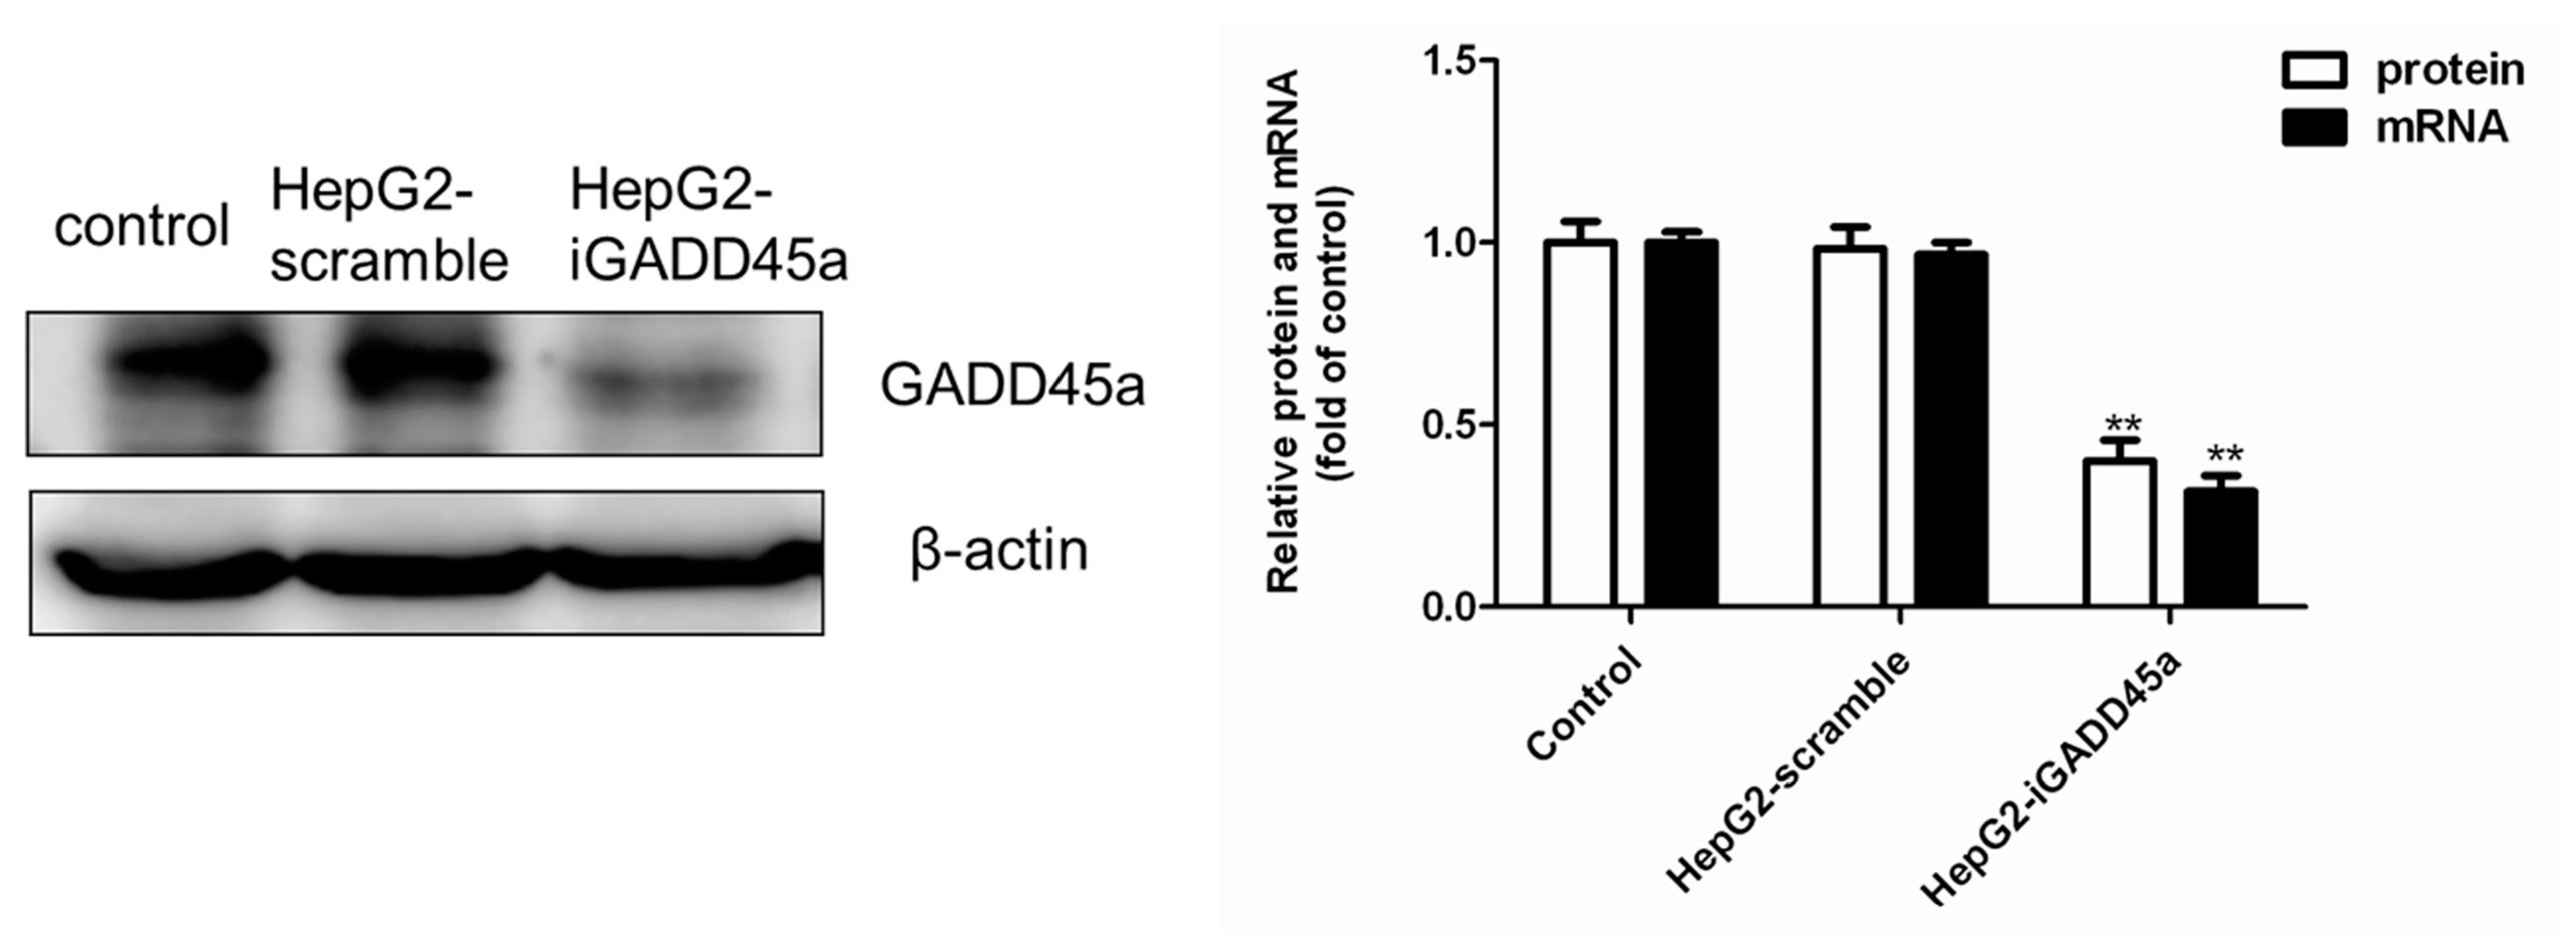
2.1. GADD45a Knockdown Cell Line Identification
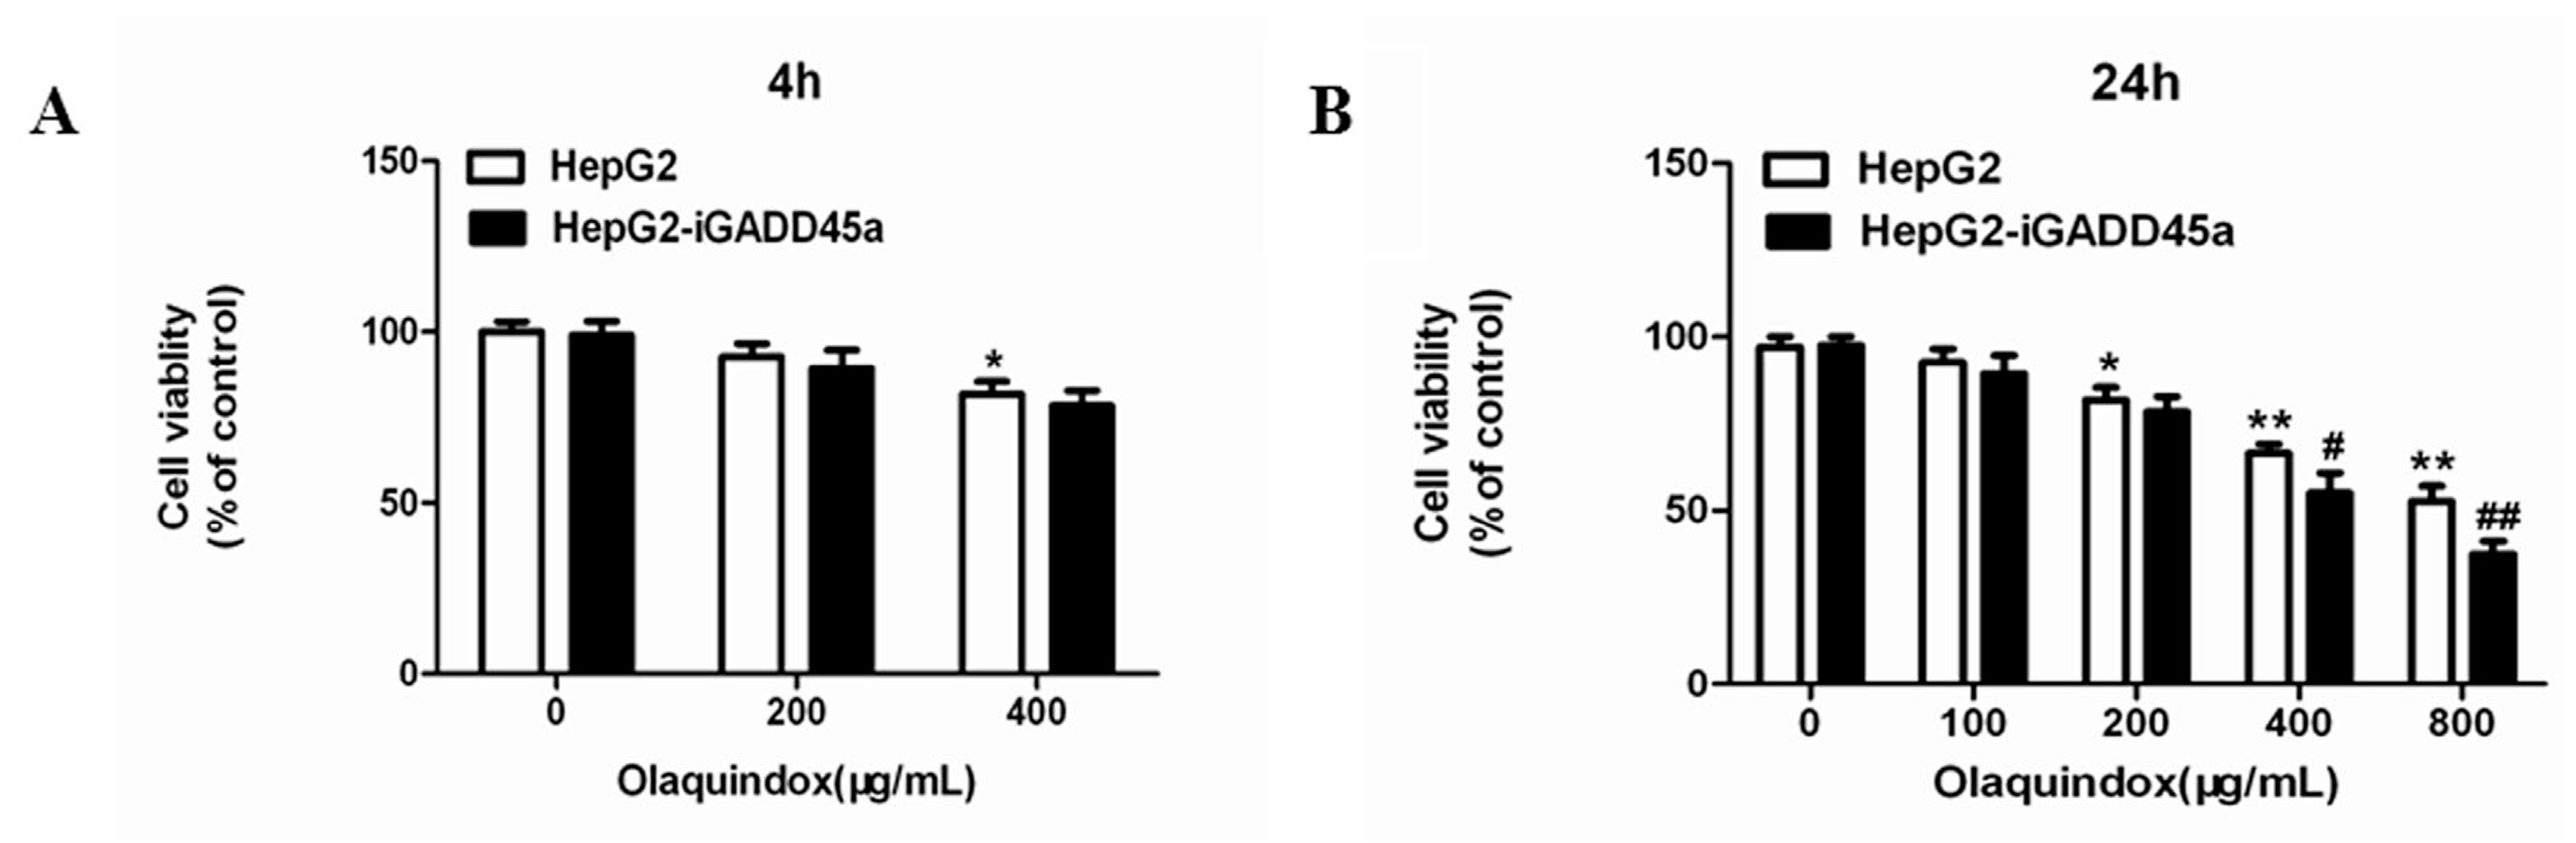
2.2. Effects of Olaquindox-Induced Cytotoxicity in HepG2 and HepG2-iGADD45a Cells
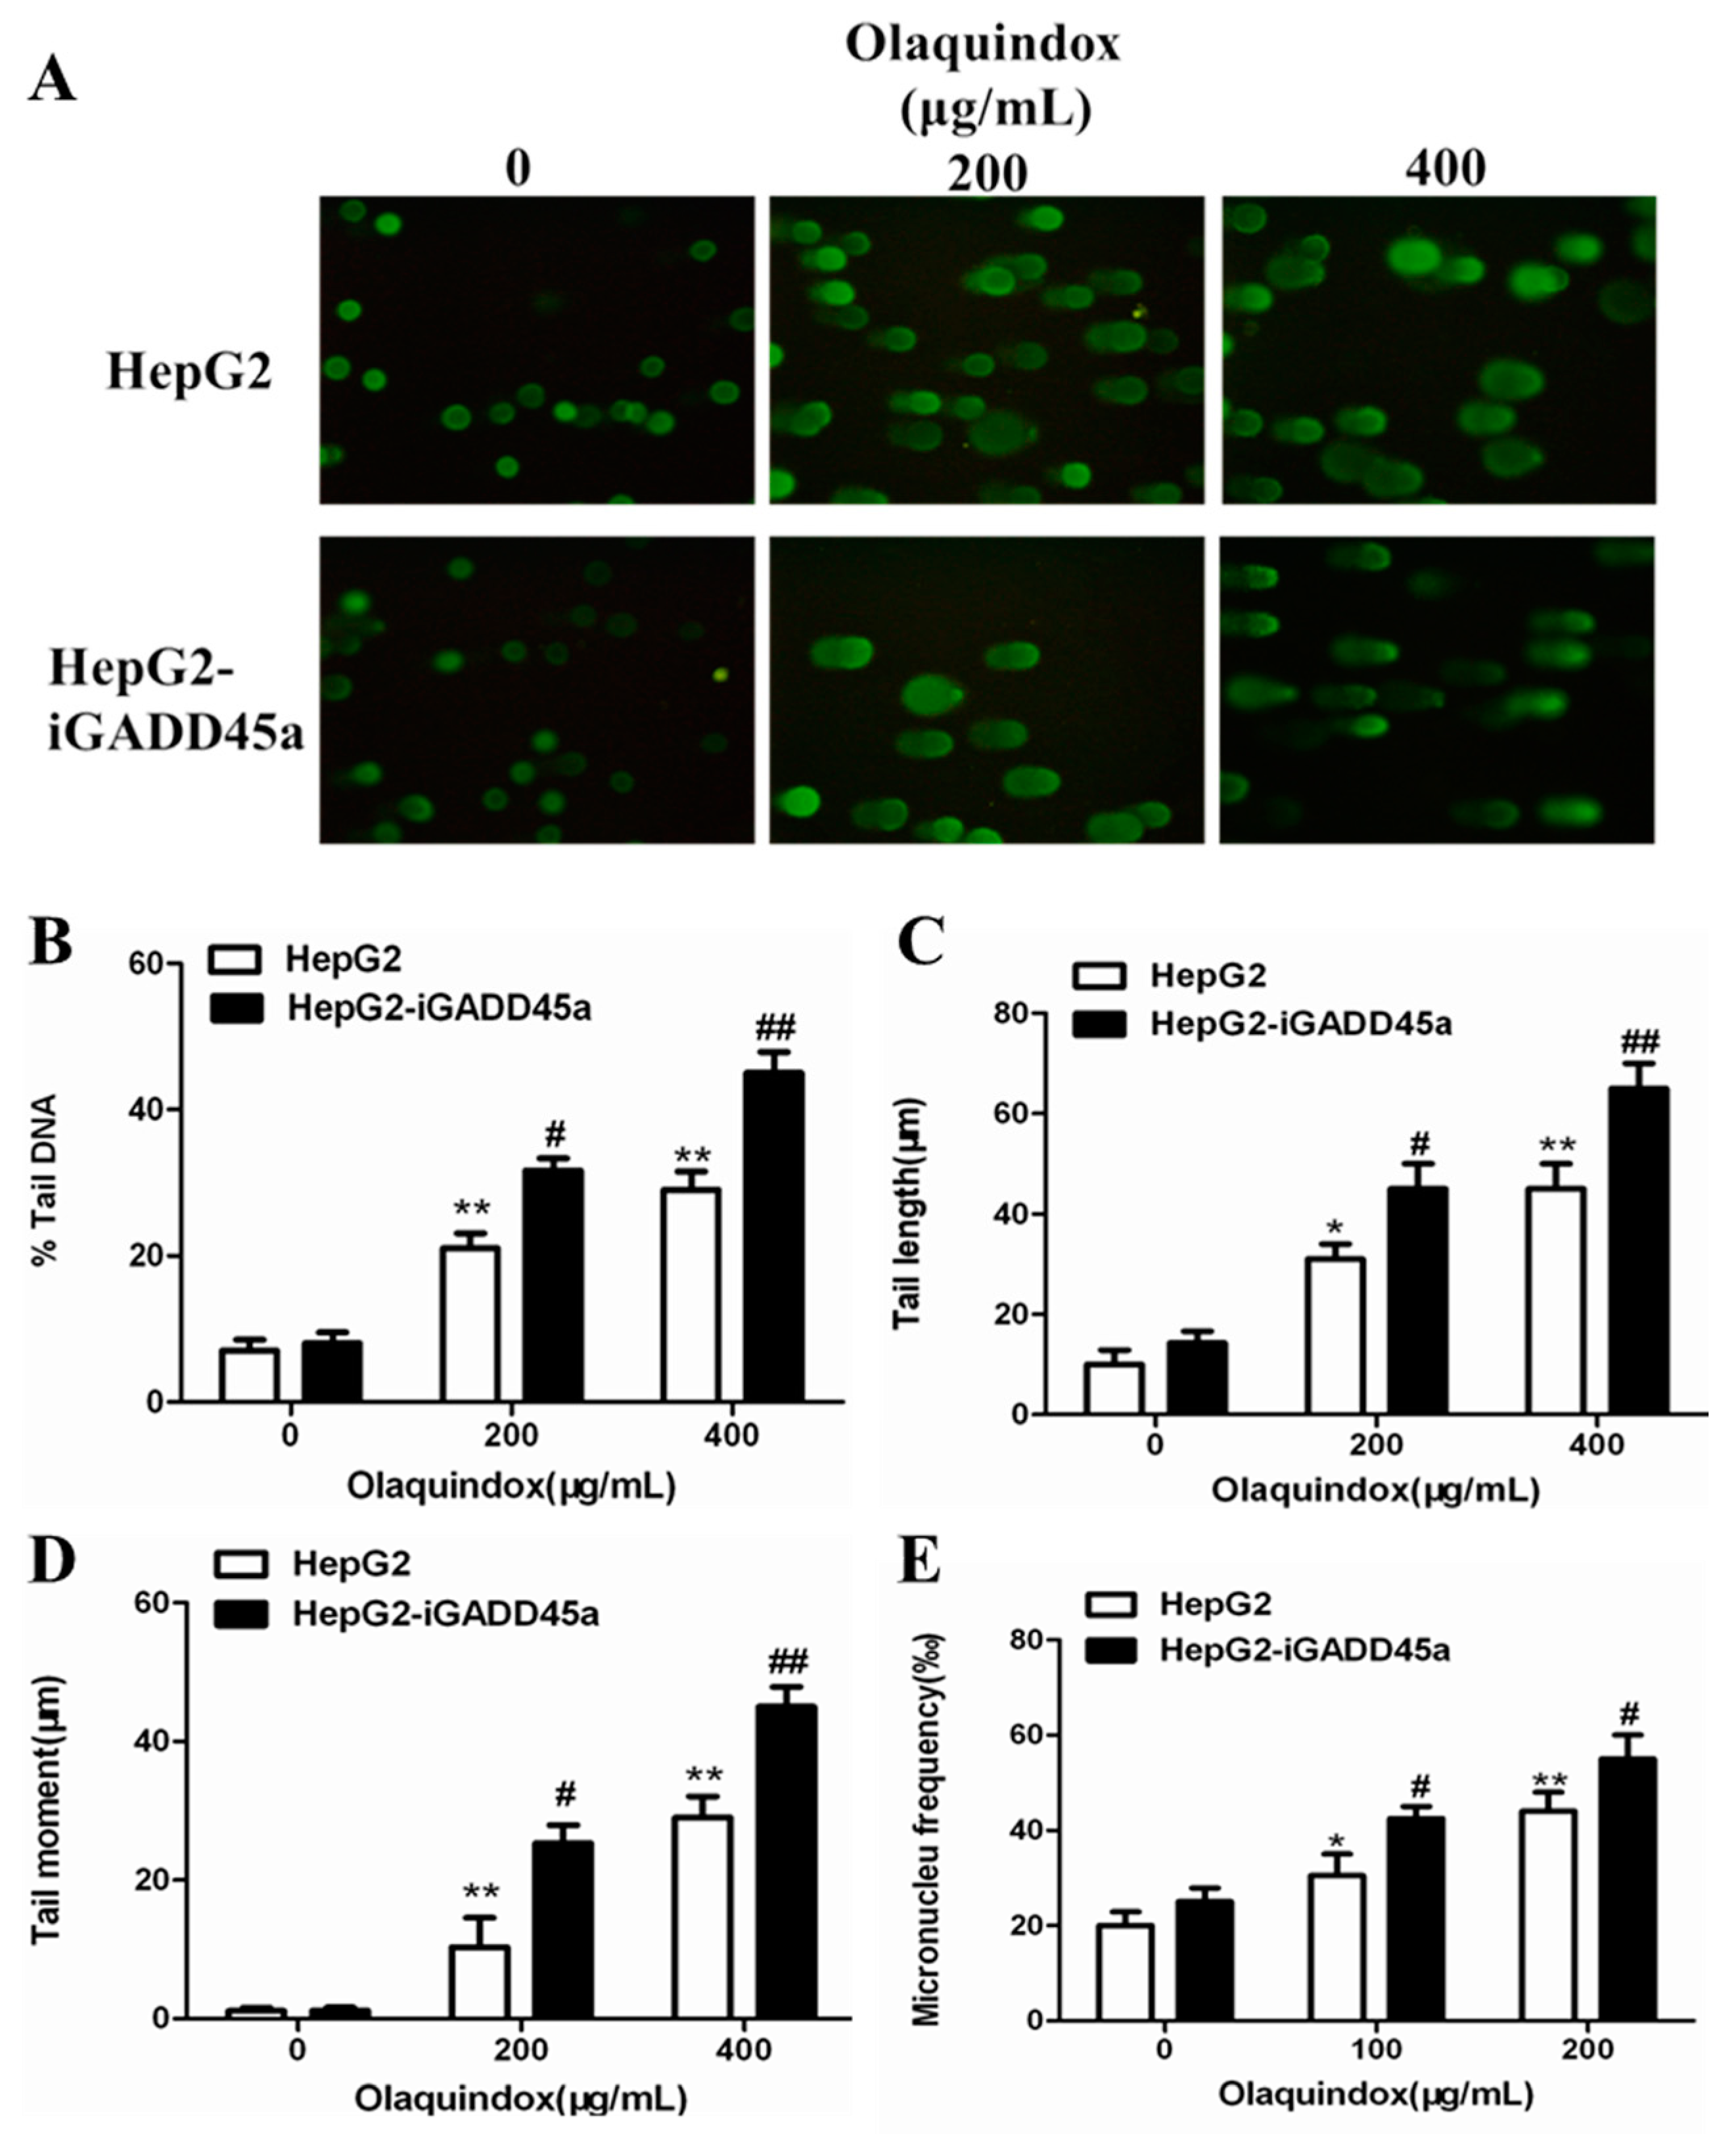
2.3. Effects of GADD45a on Olaquindox-Induced DNA Damage in HepG2 Cells
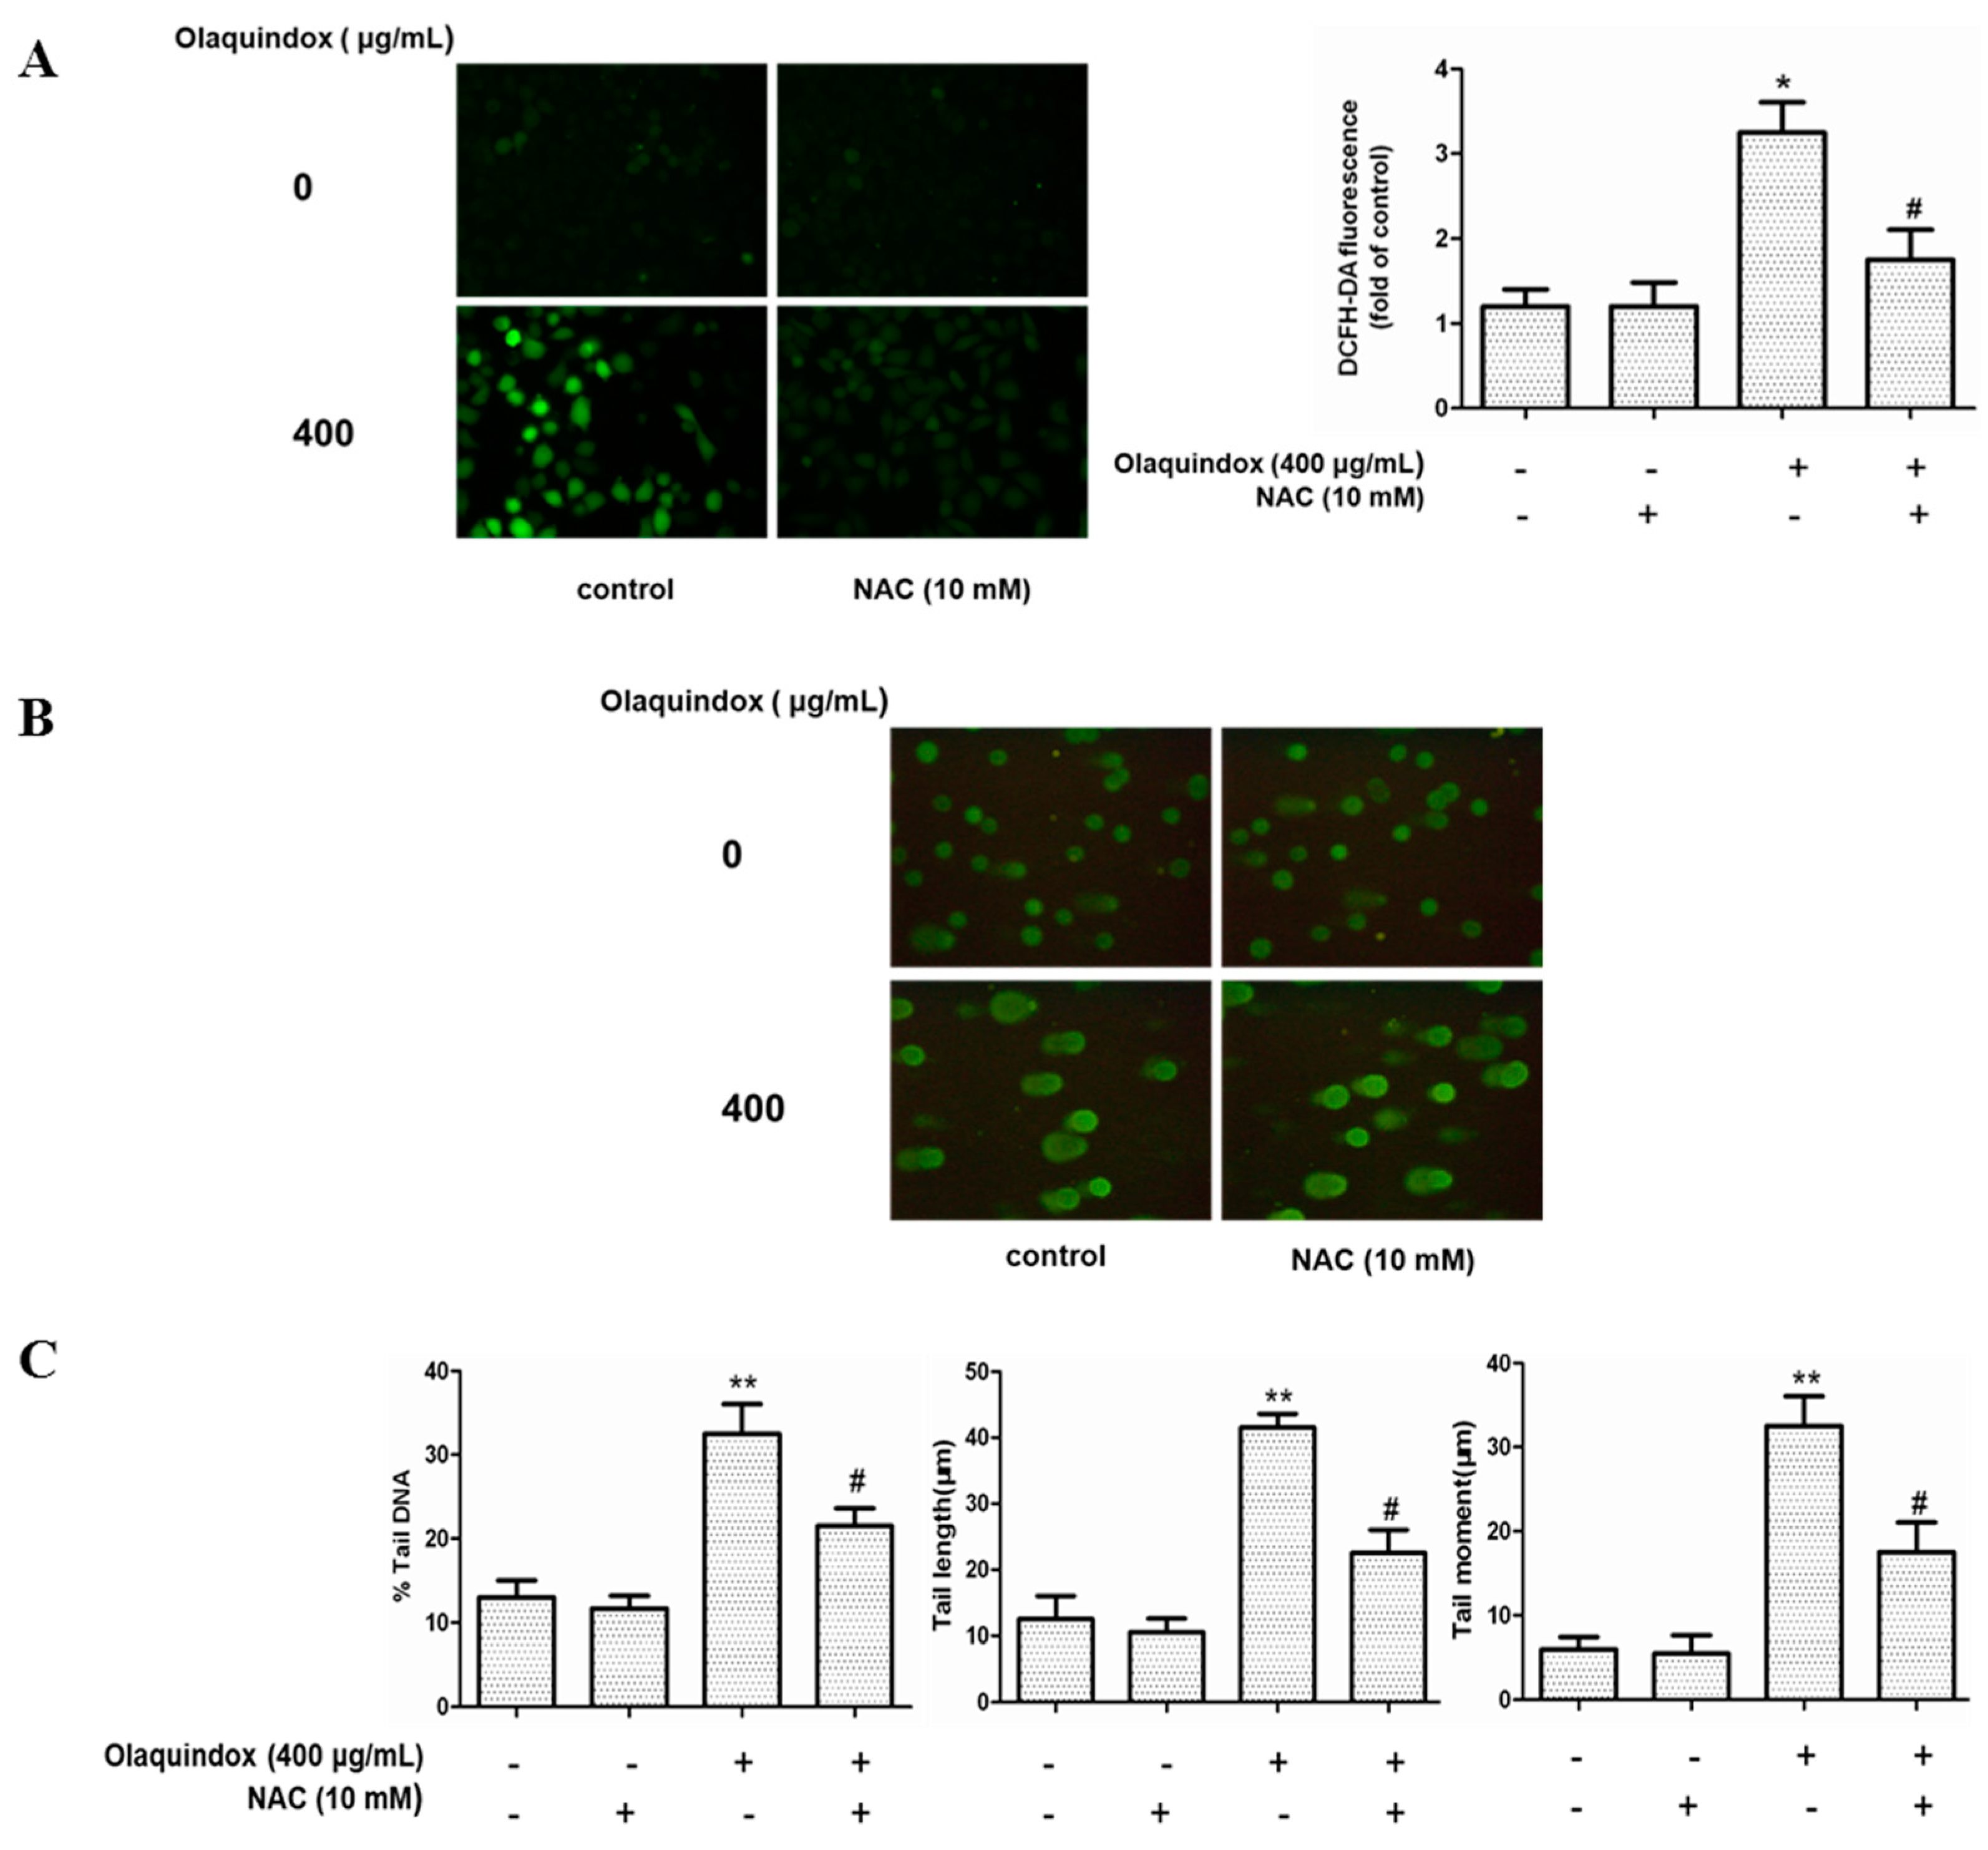
2.4. The Role of ROS in Olaquindox-Induced DNA Damage
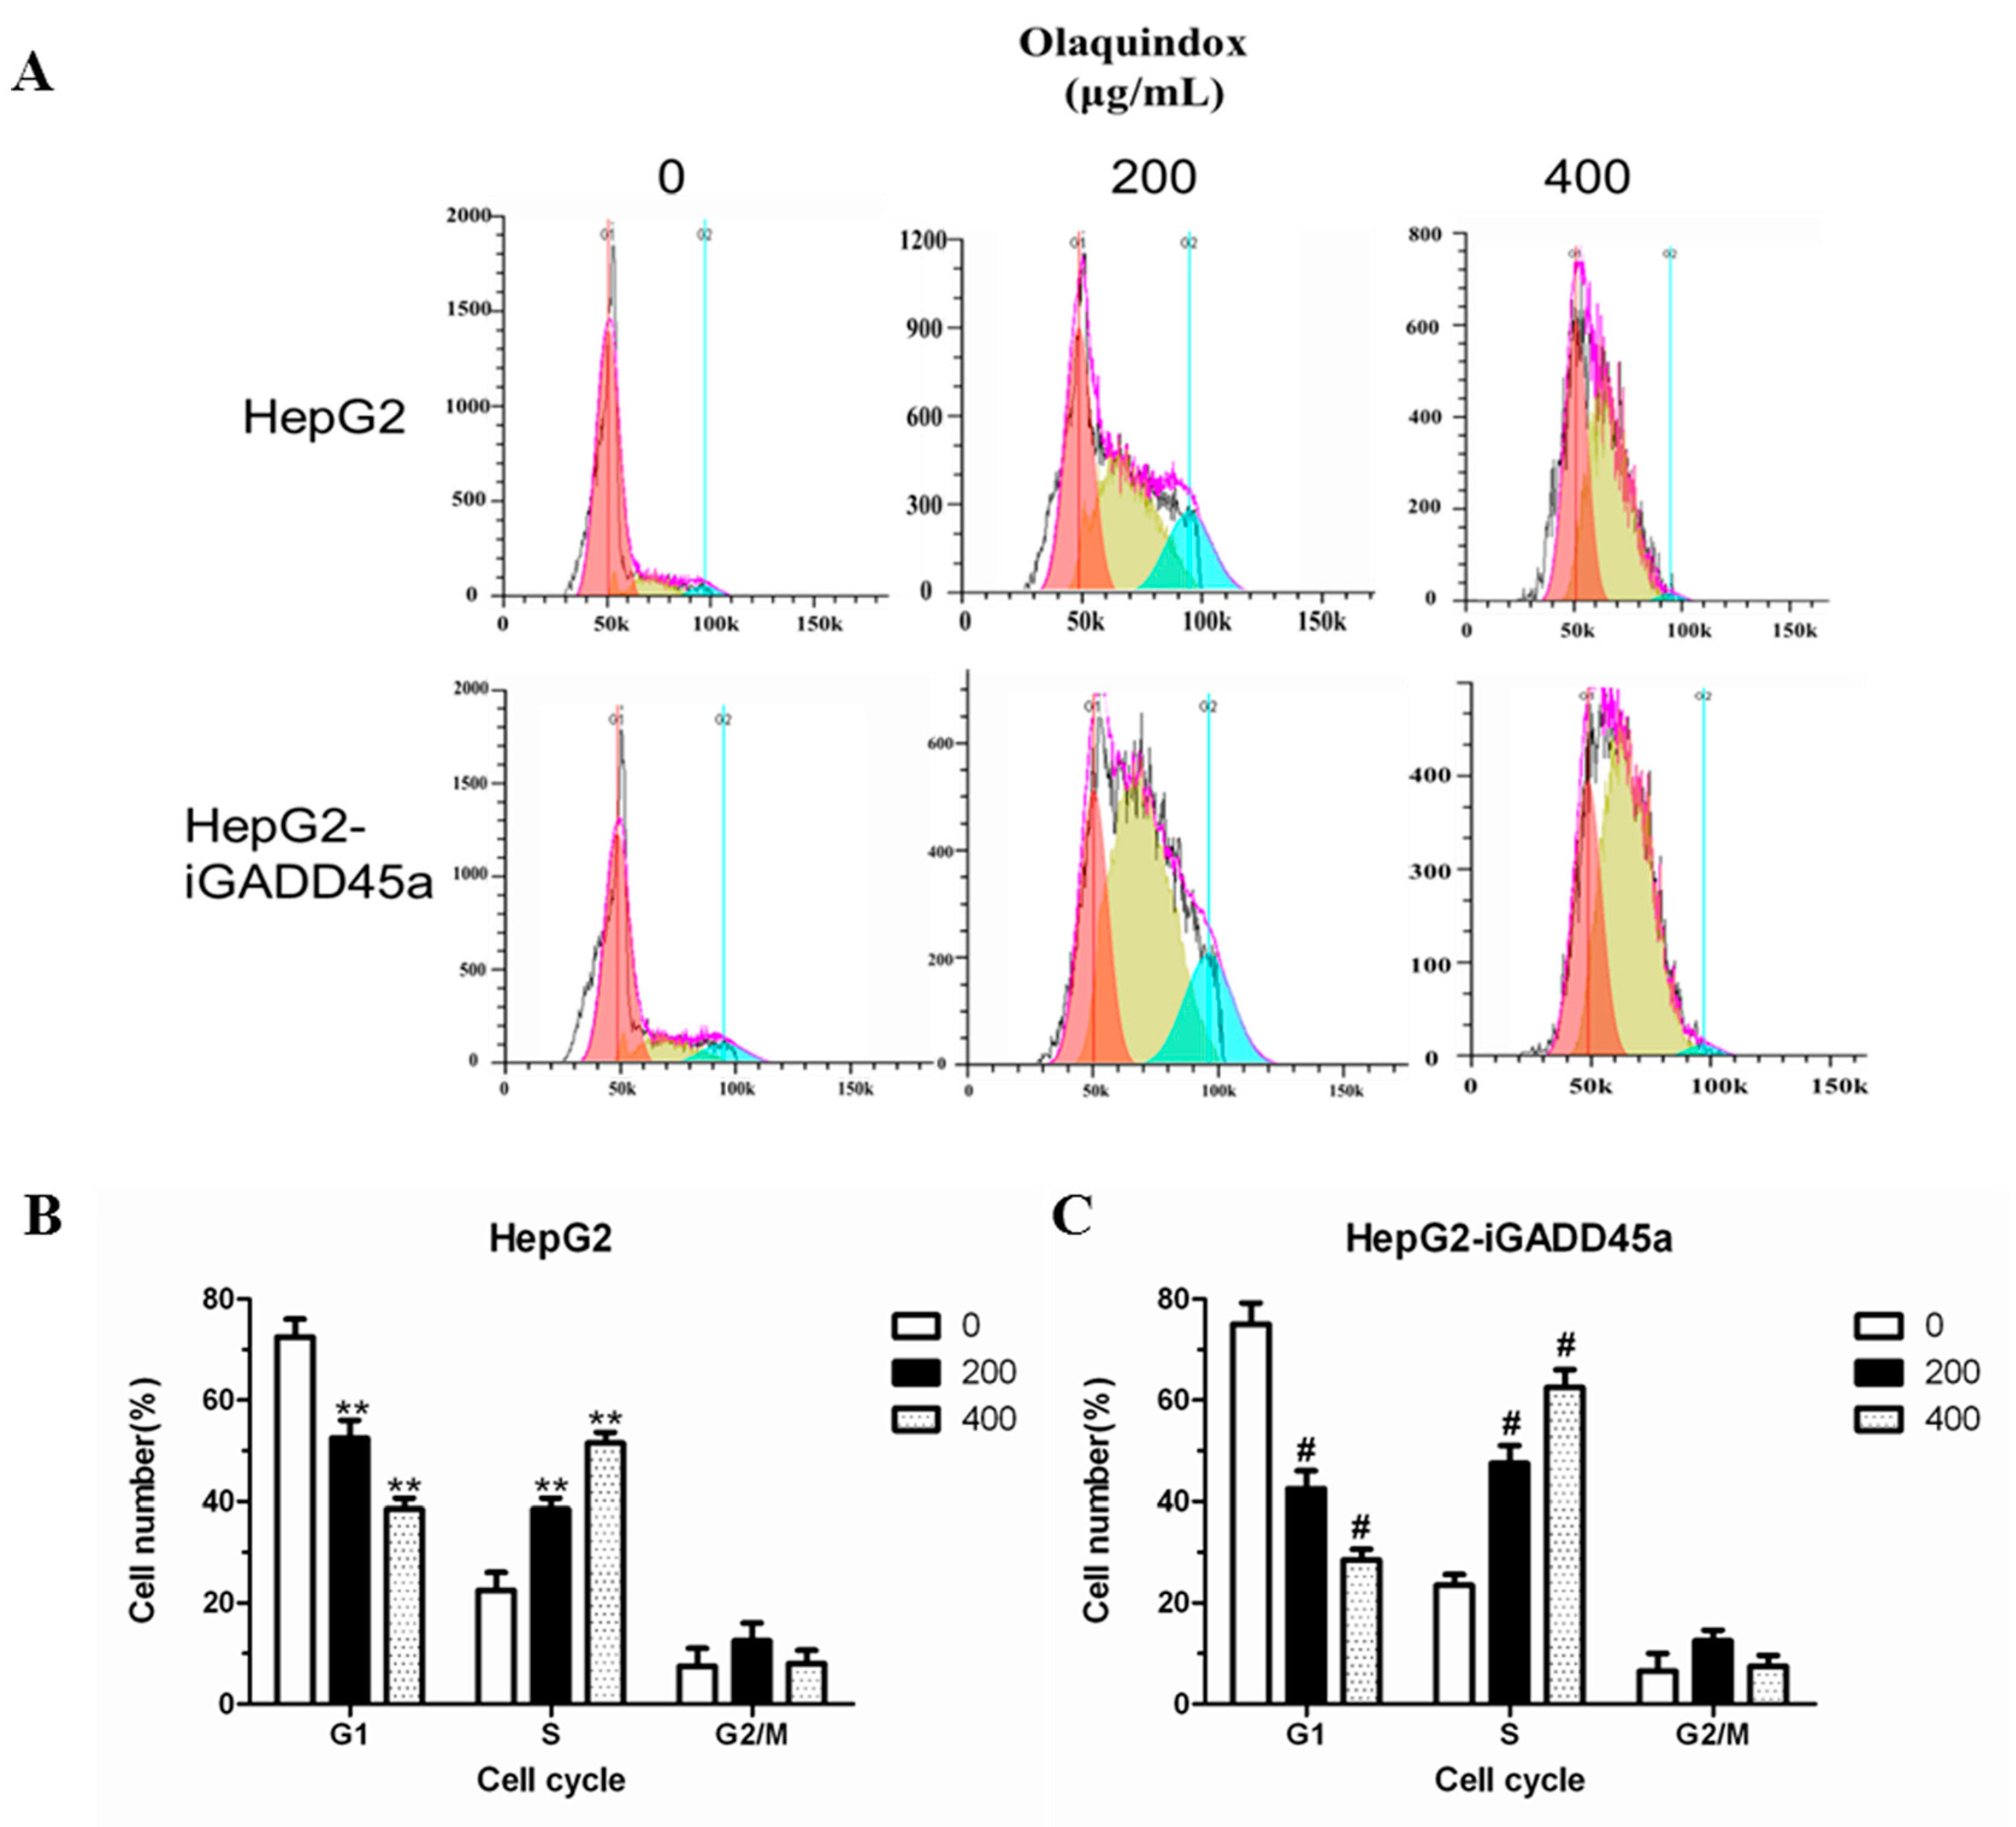
2.5. Effects of GADD45a on the Olaquindox-Induced Cell Cycle Arrest in HepG2 Cells
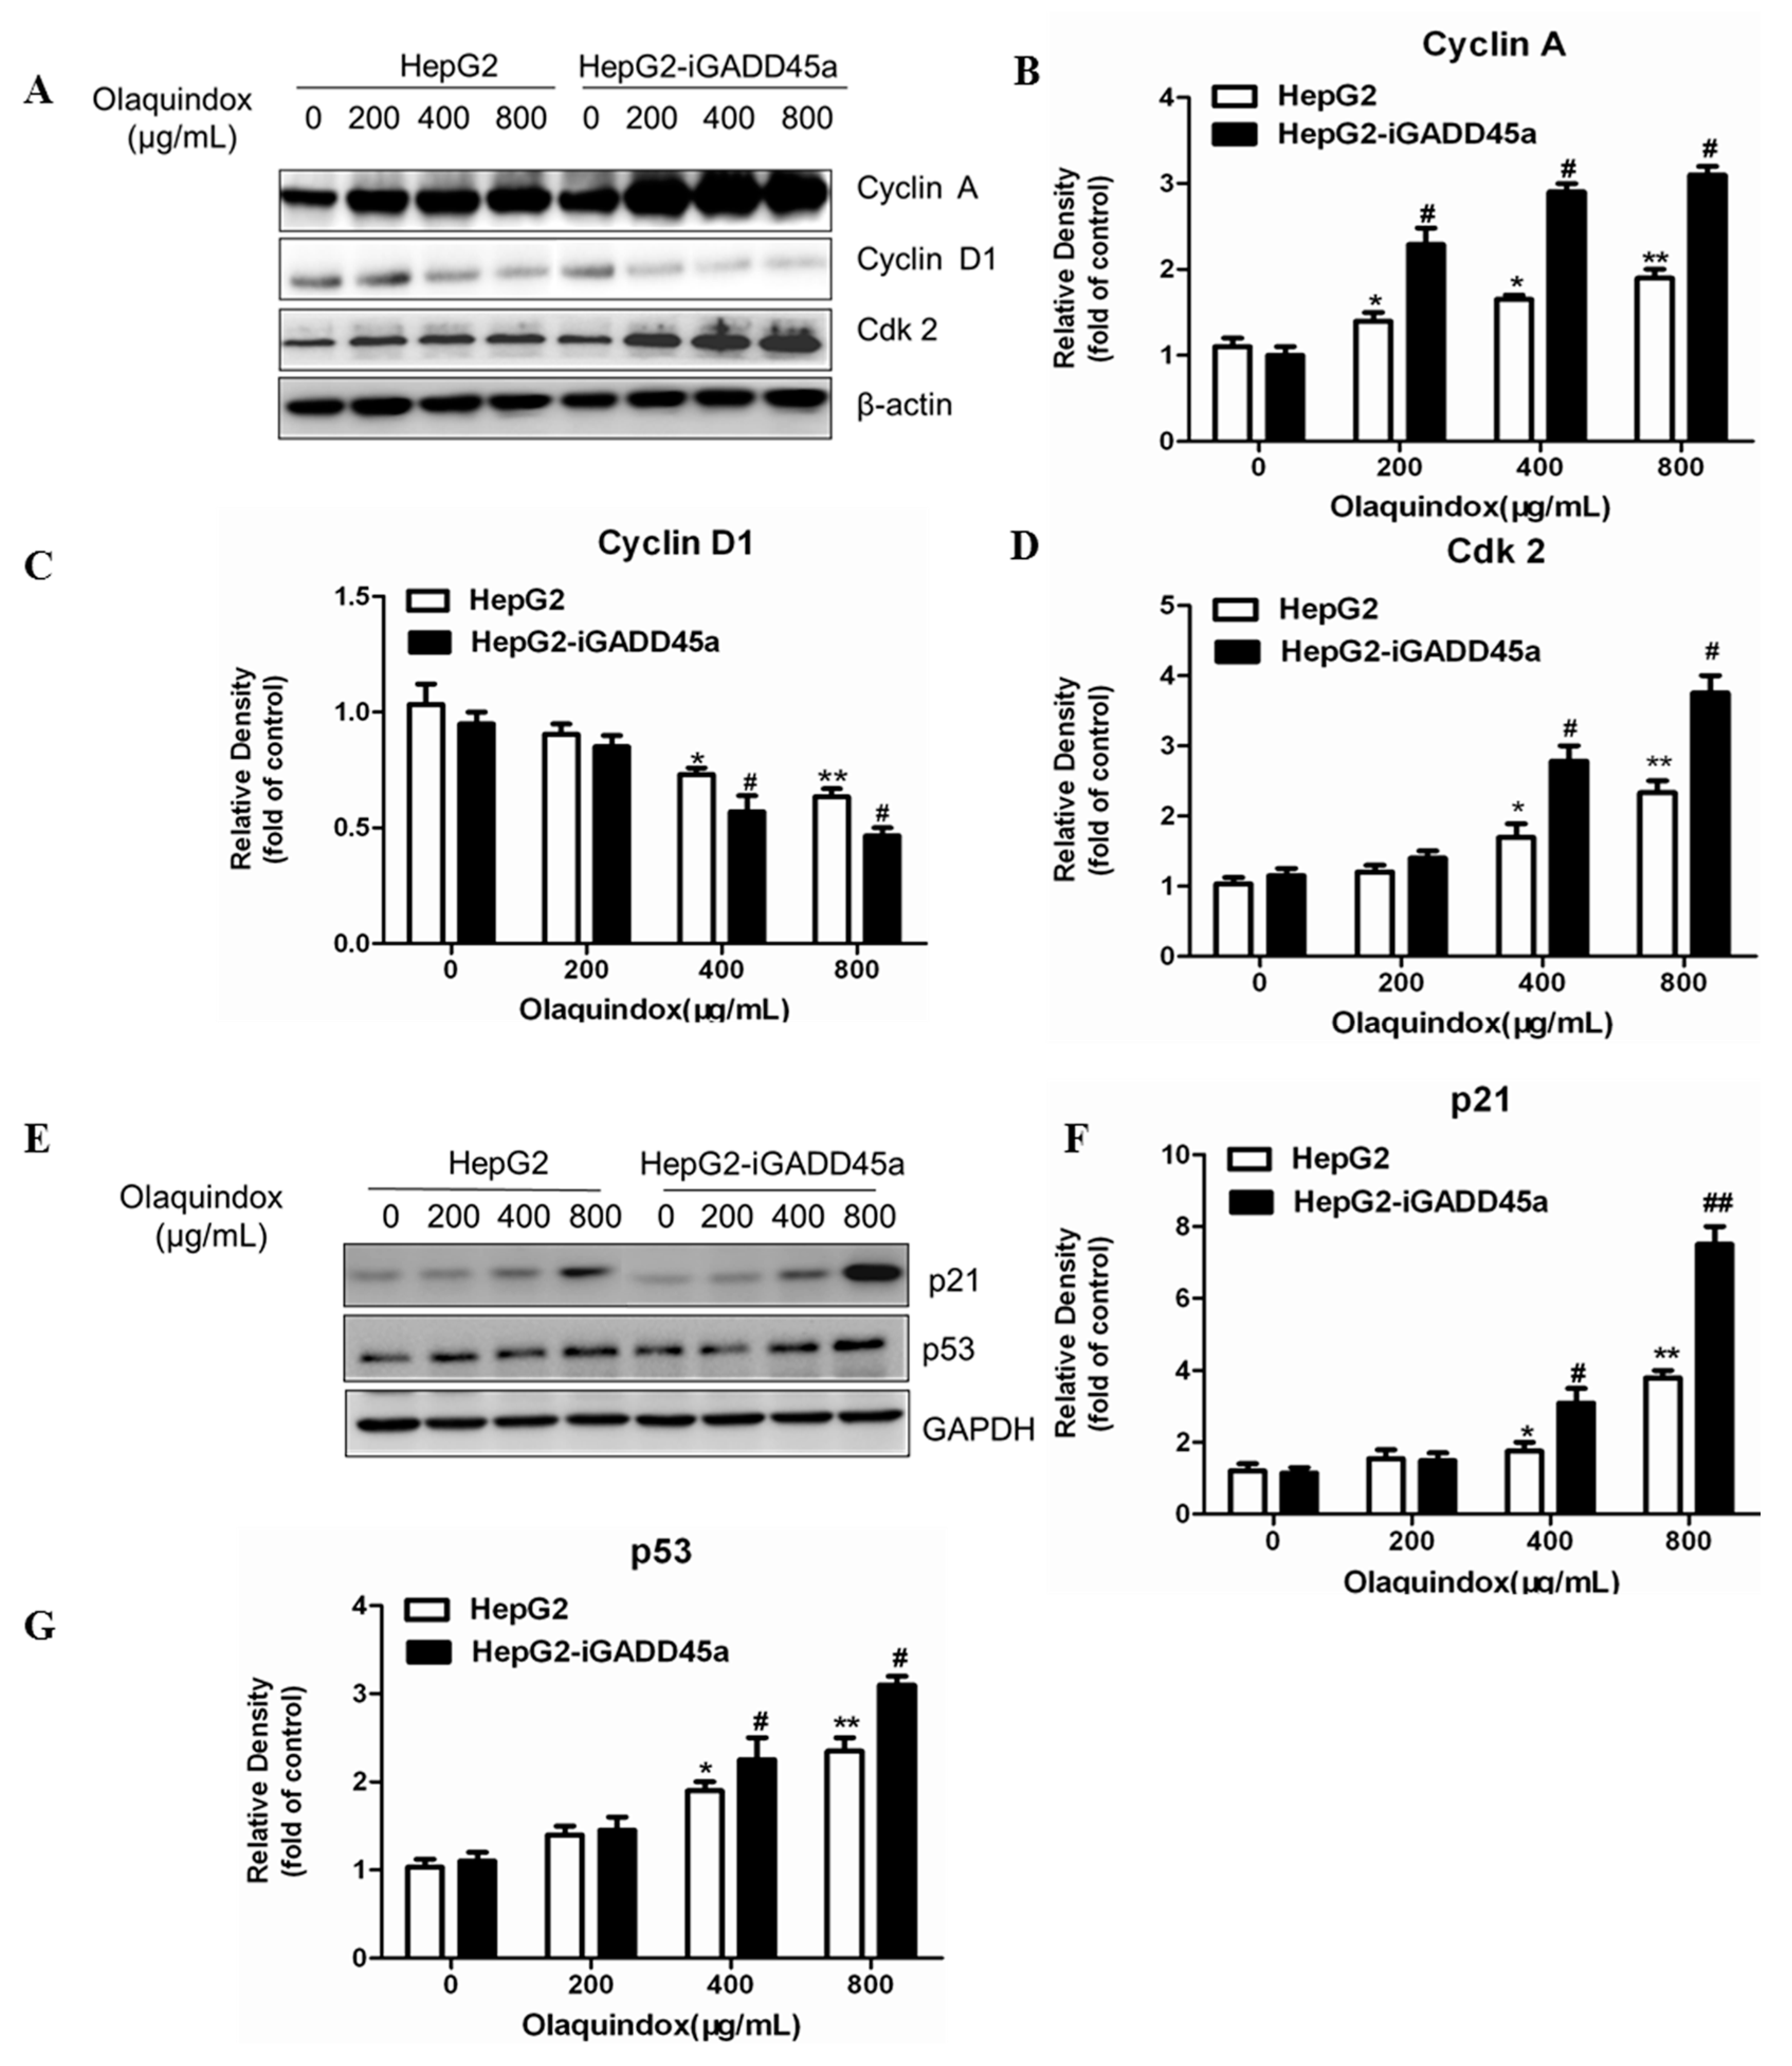
2.6. Effects of GADD45a on the Olaquindox-Induced Cell Cycle Relative Protein Expression
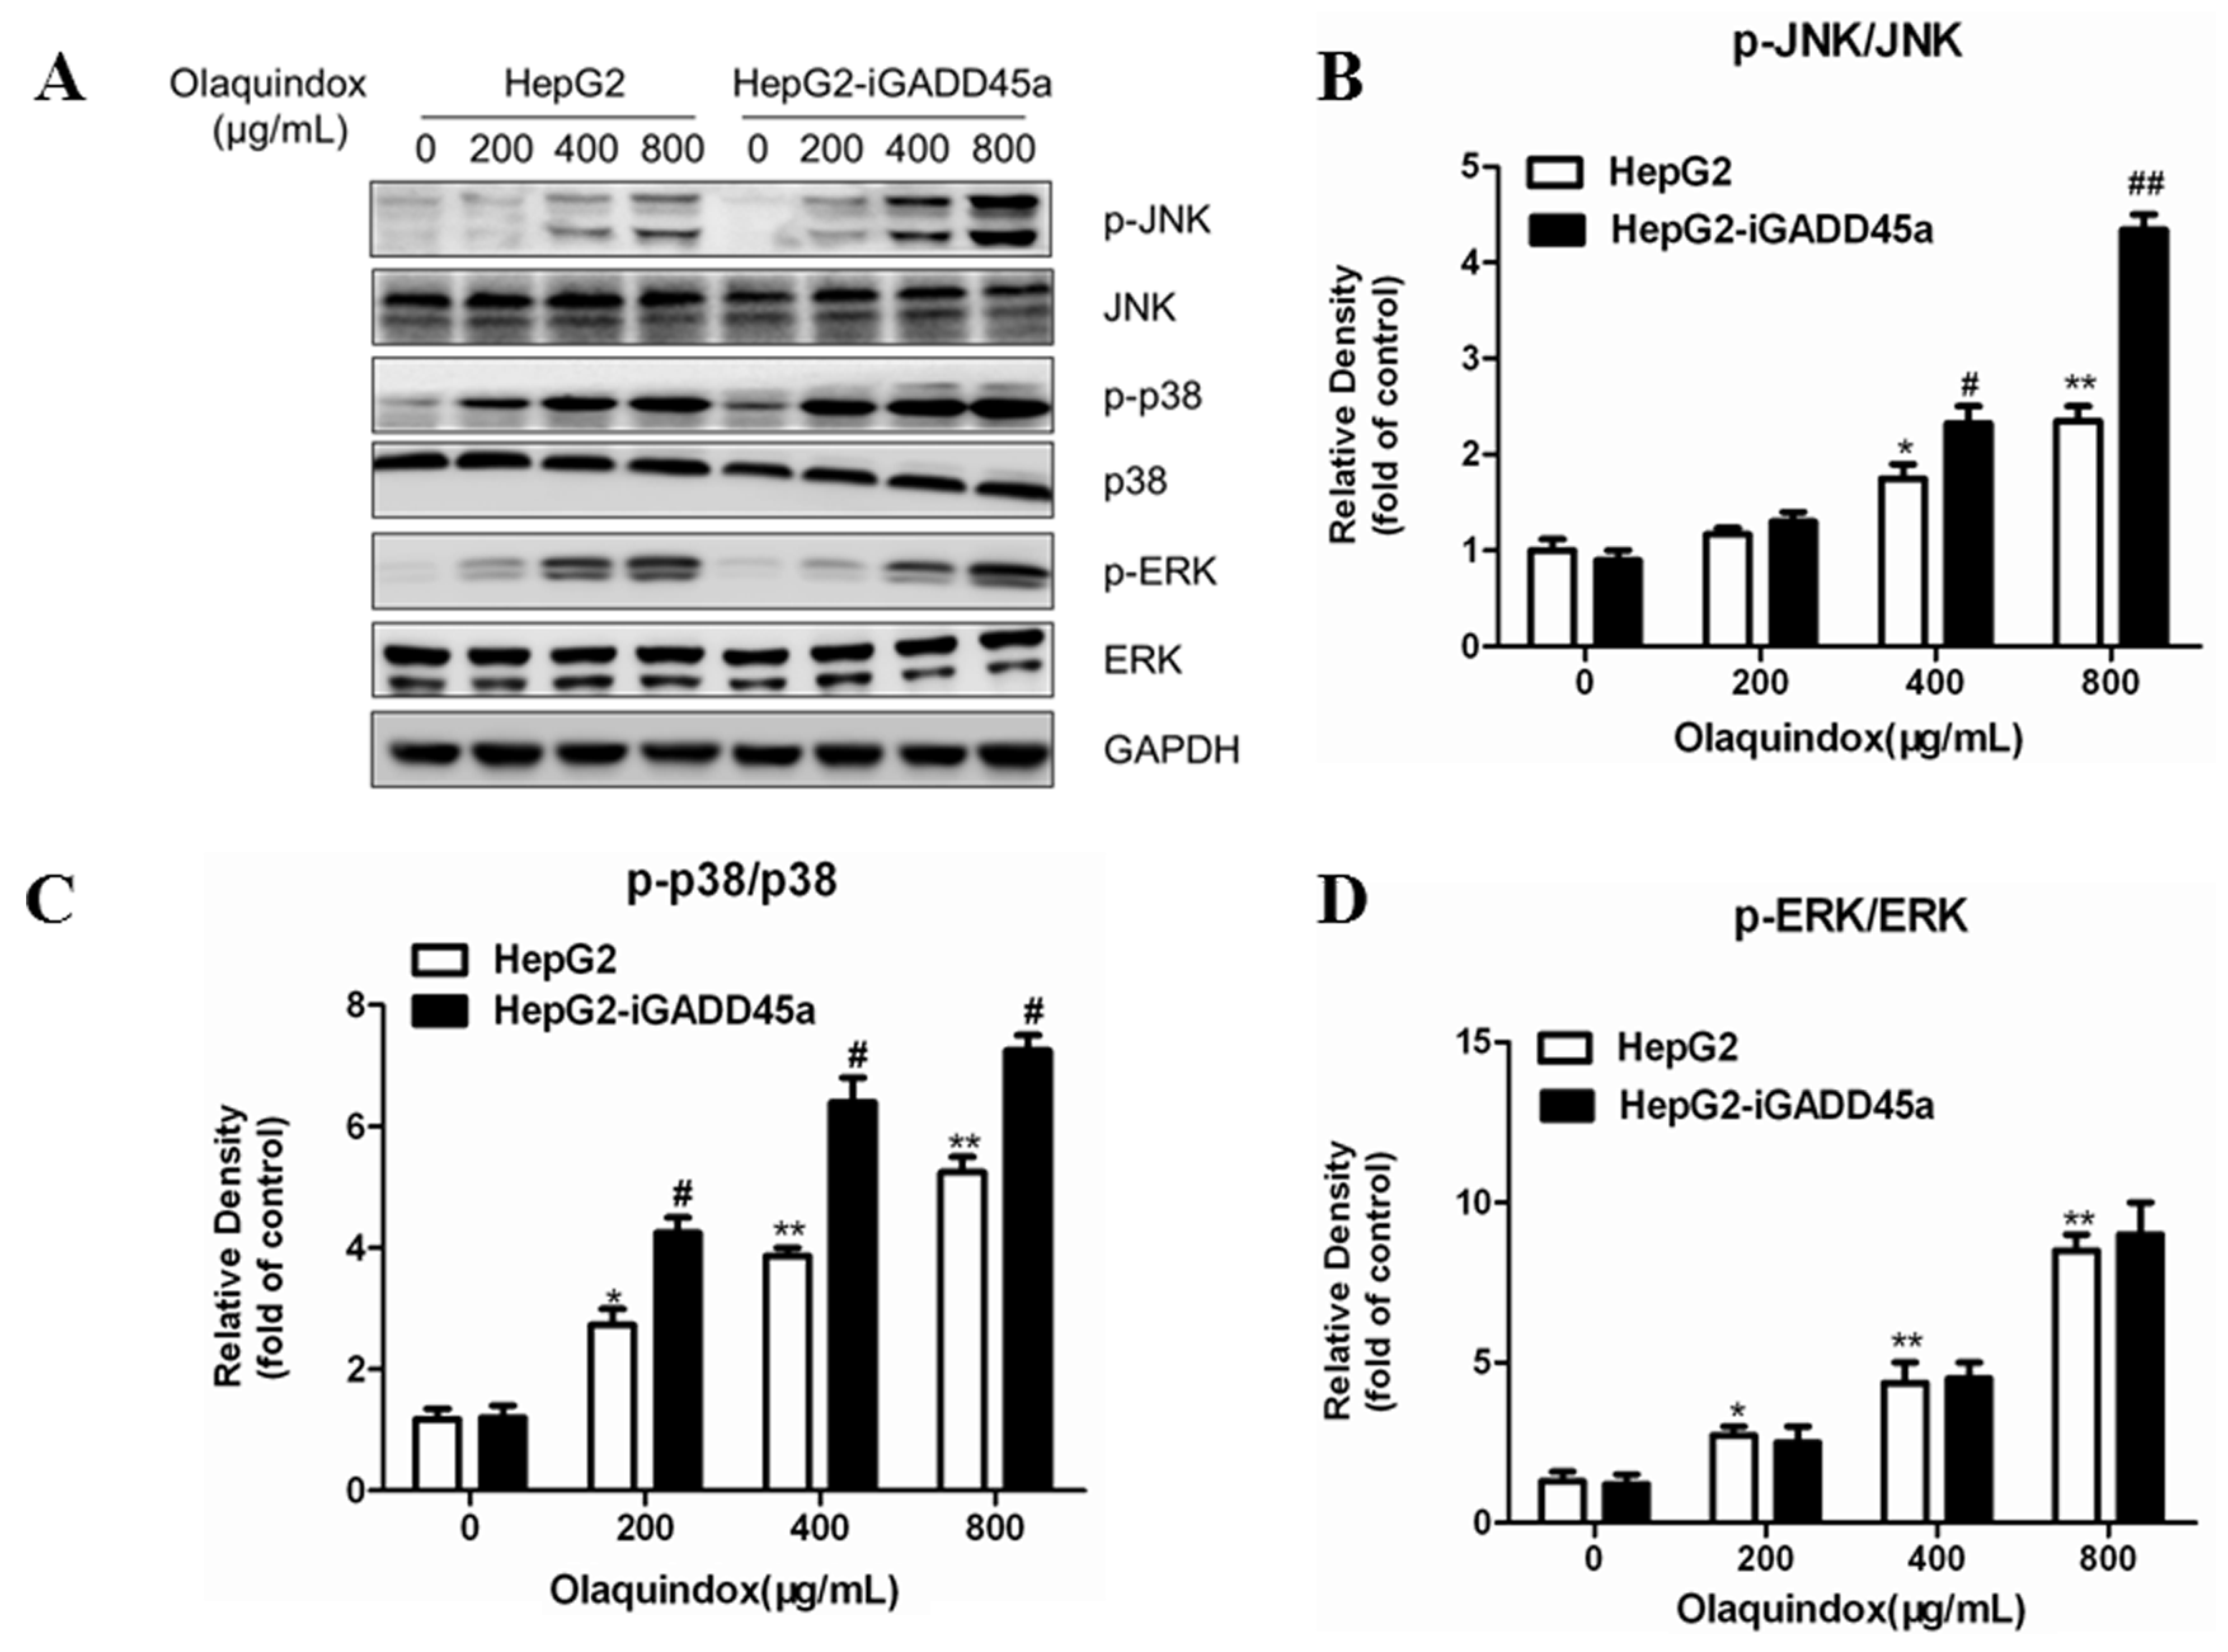
2.7. Effects of GADD45a on the Olaquindox-Induced MAPKs Pathways
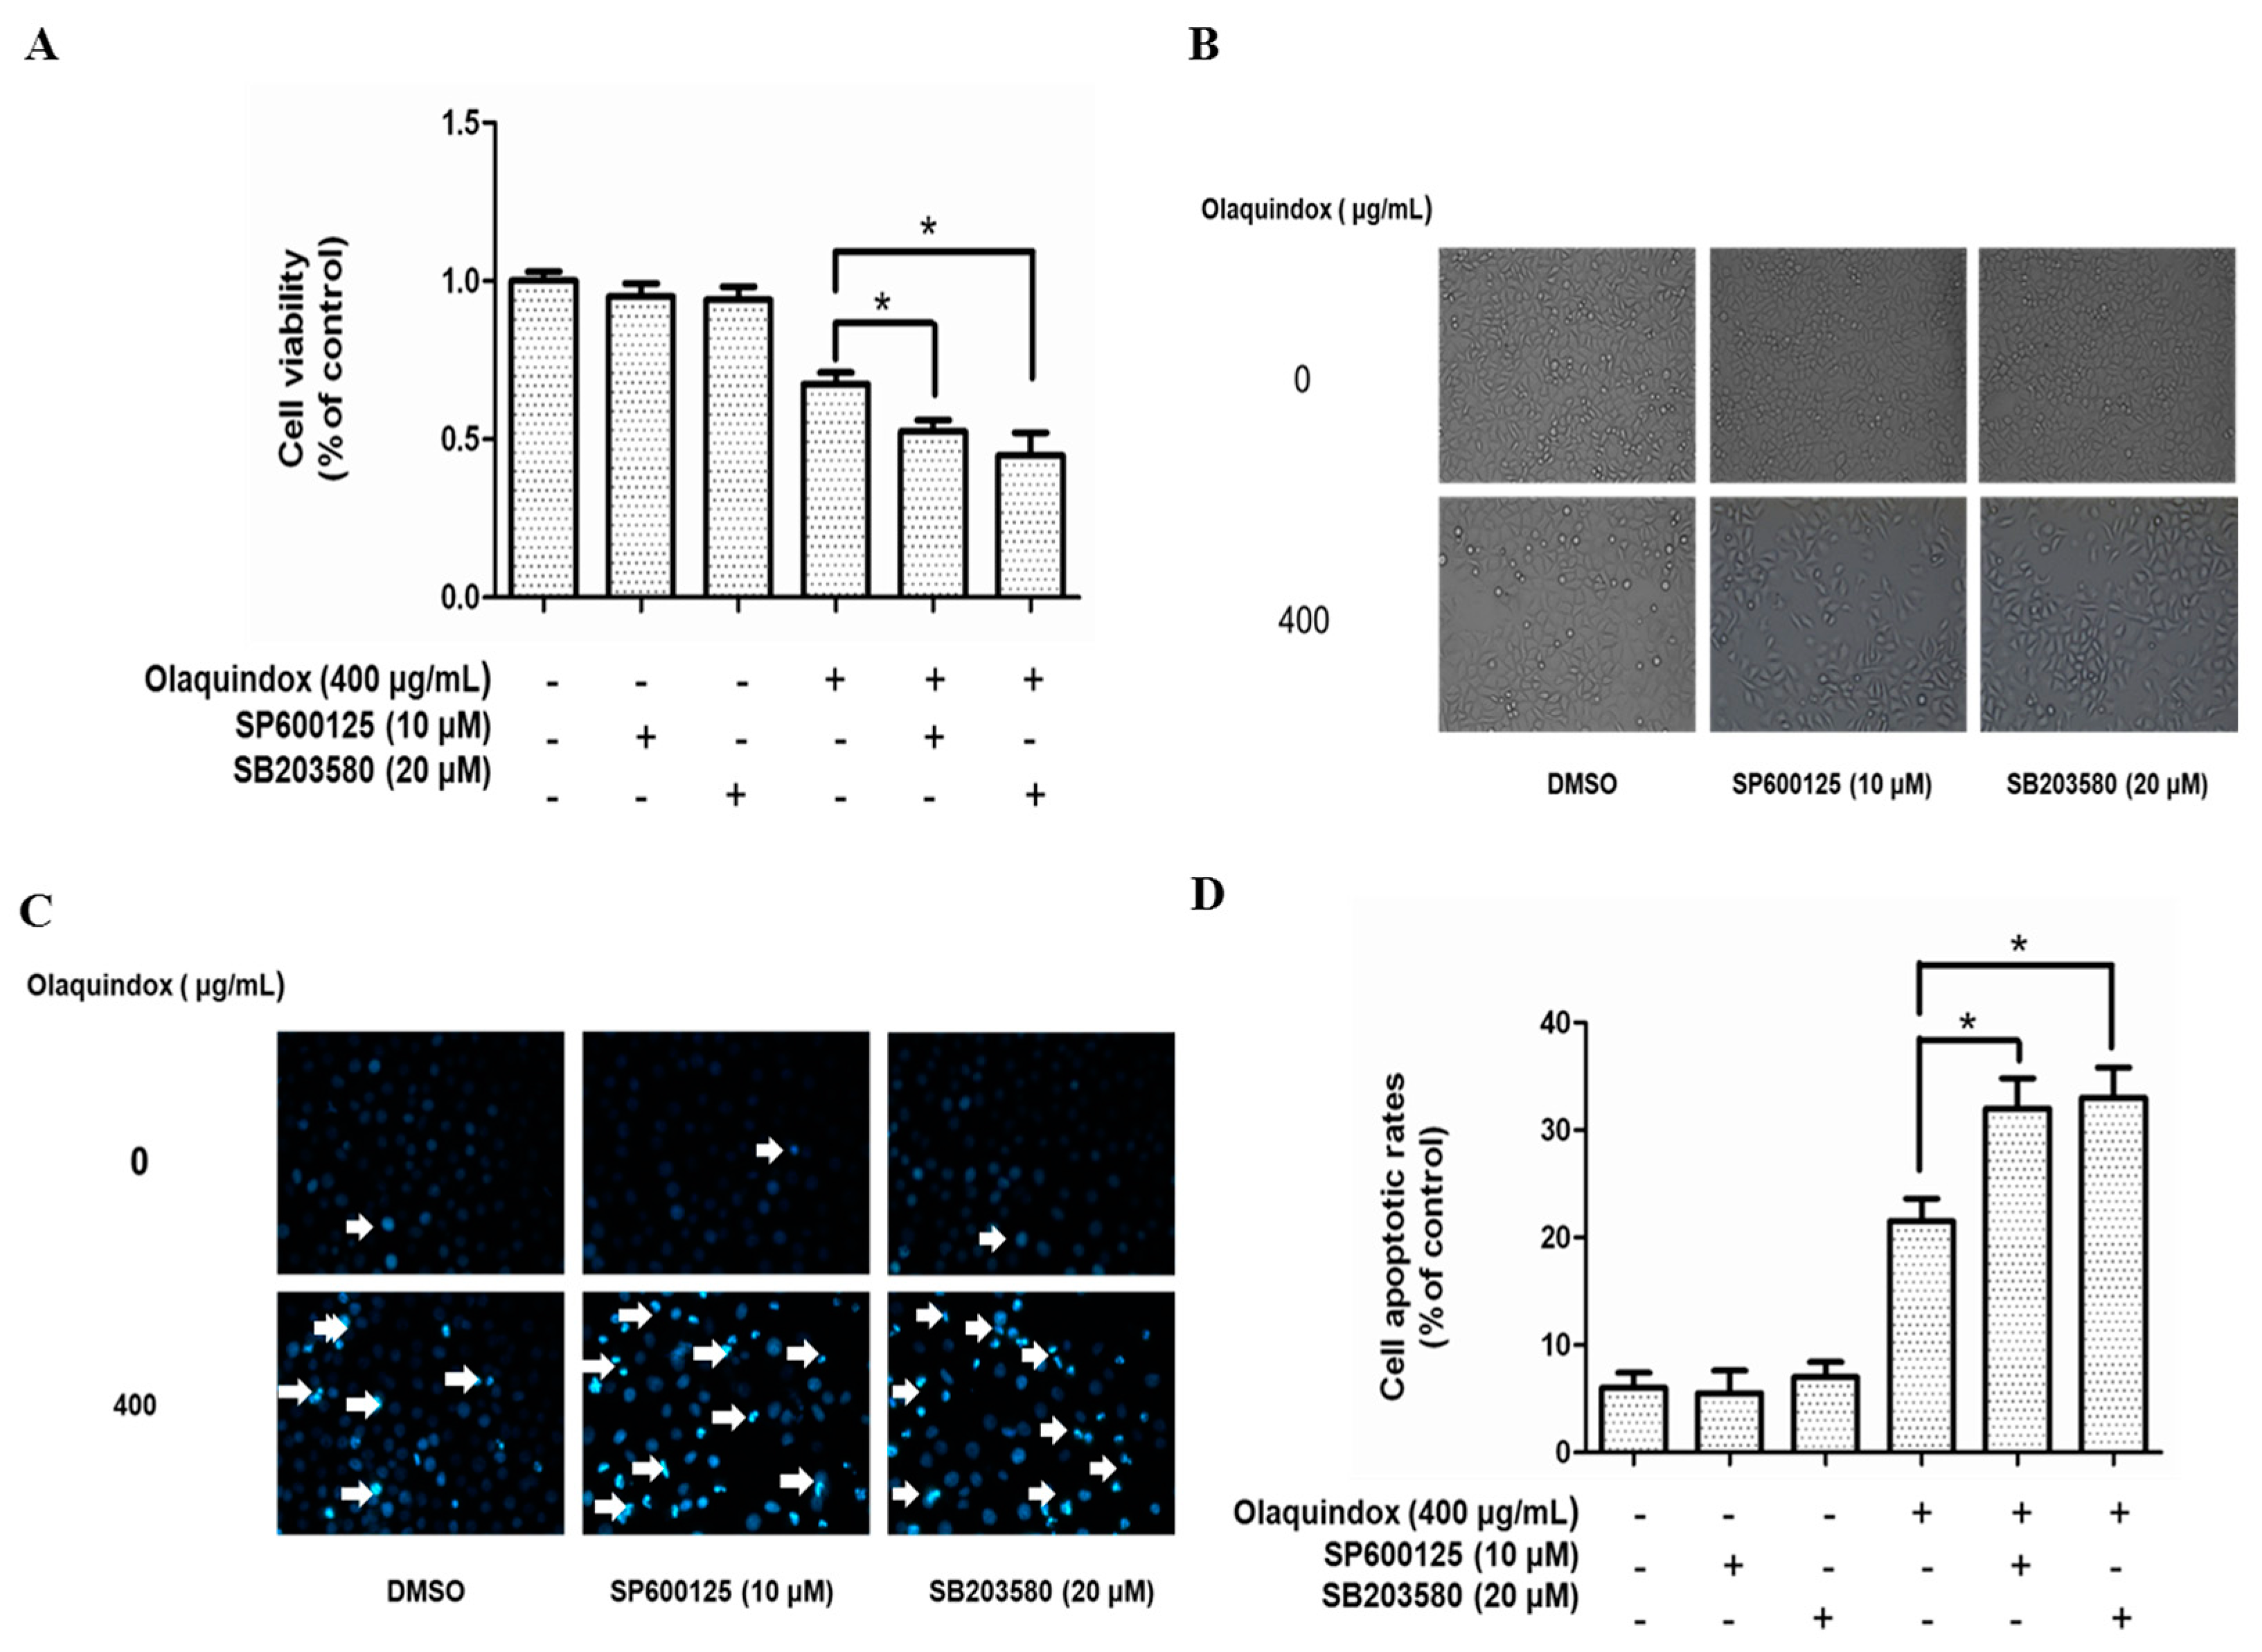
2.8. Effects of JNK/p38 Pathways on Olaquindox-Induced Cell Death
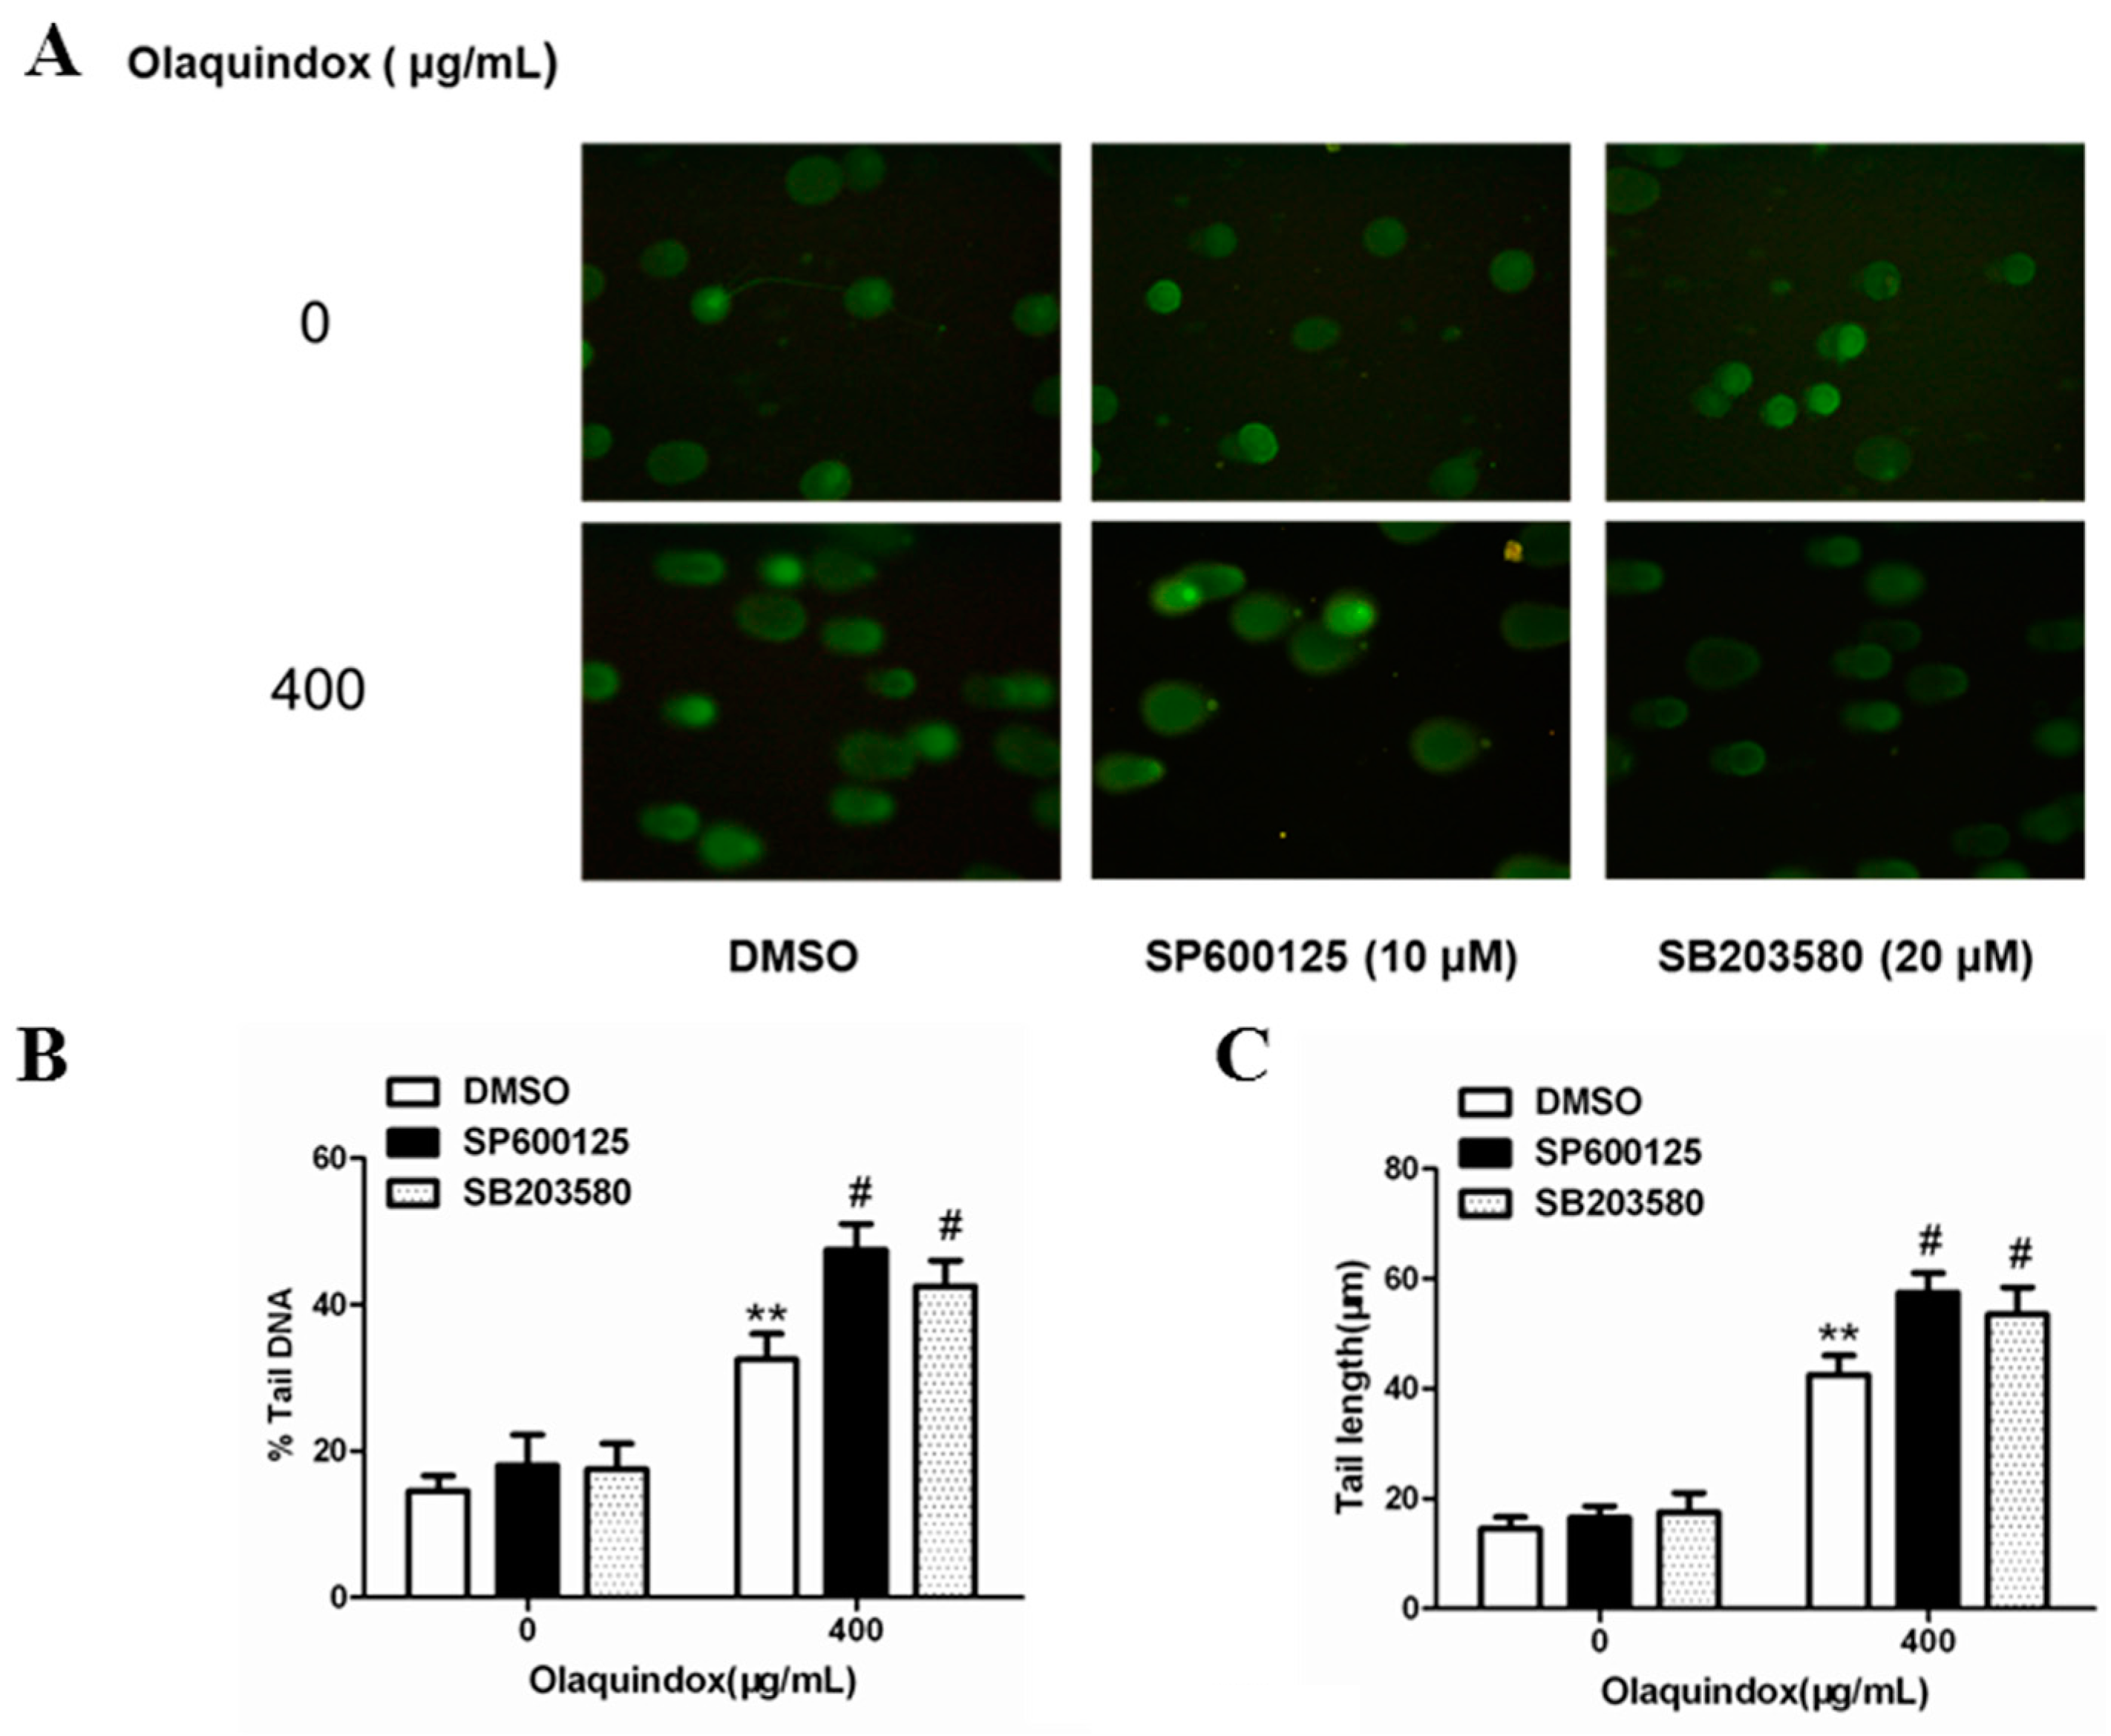
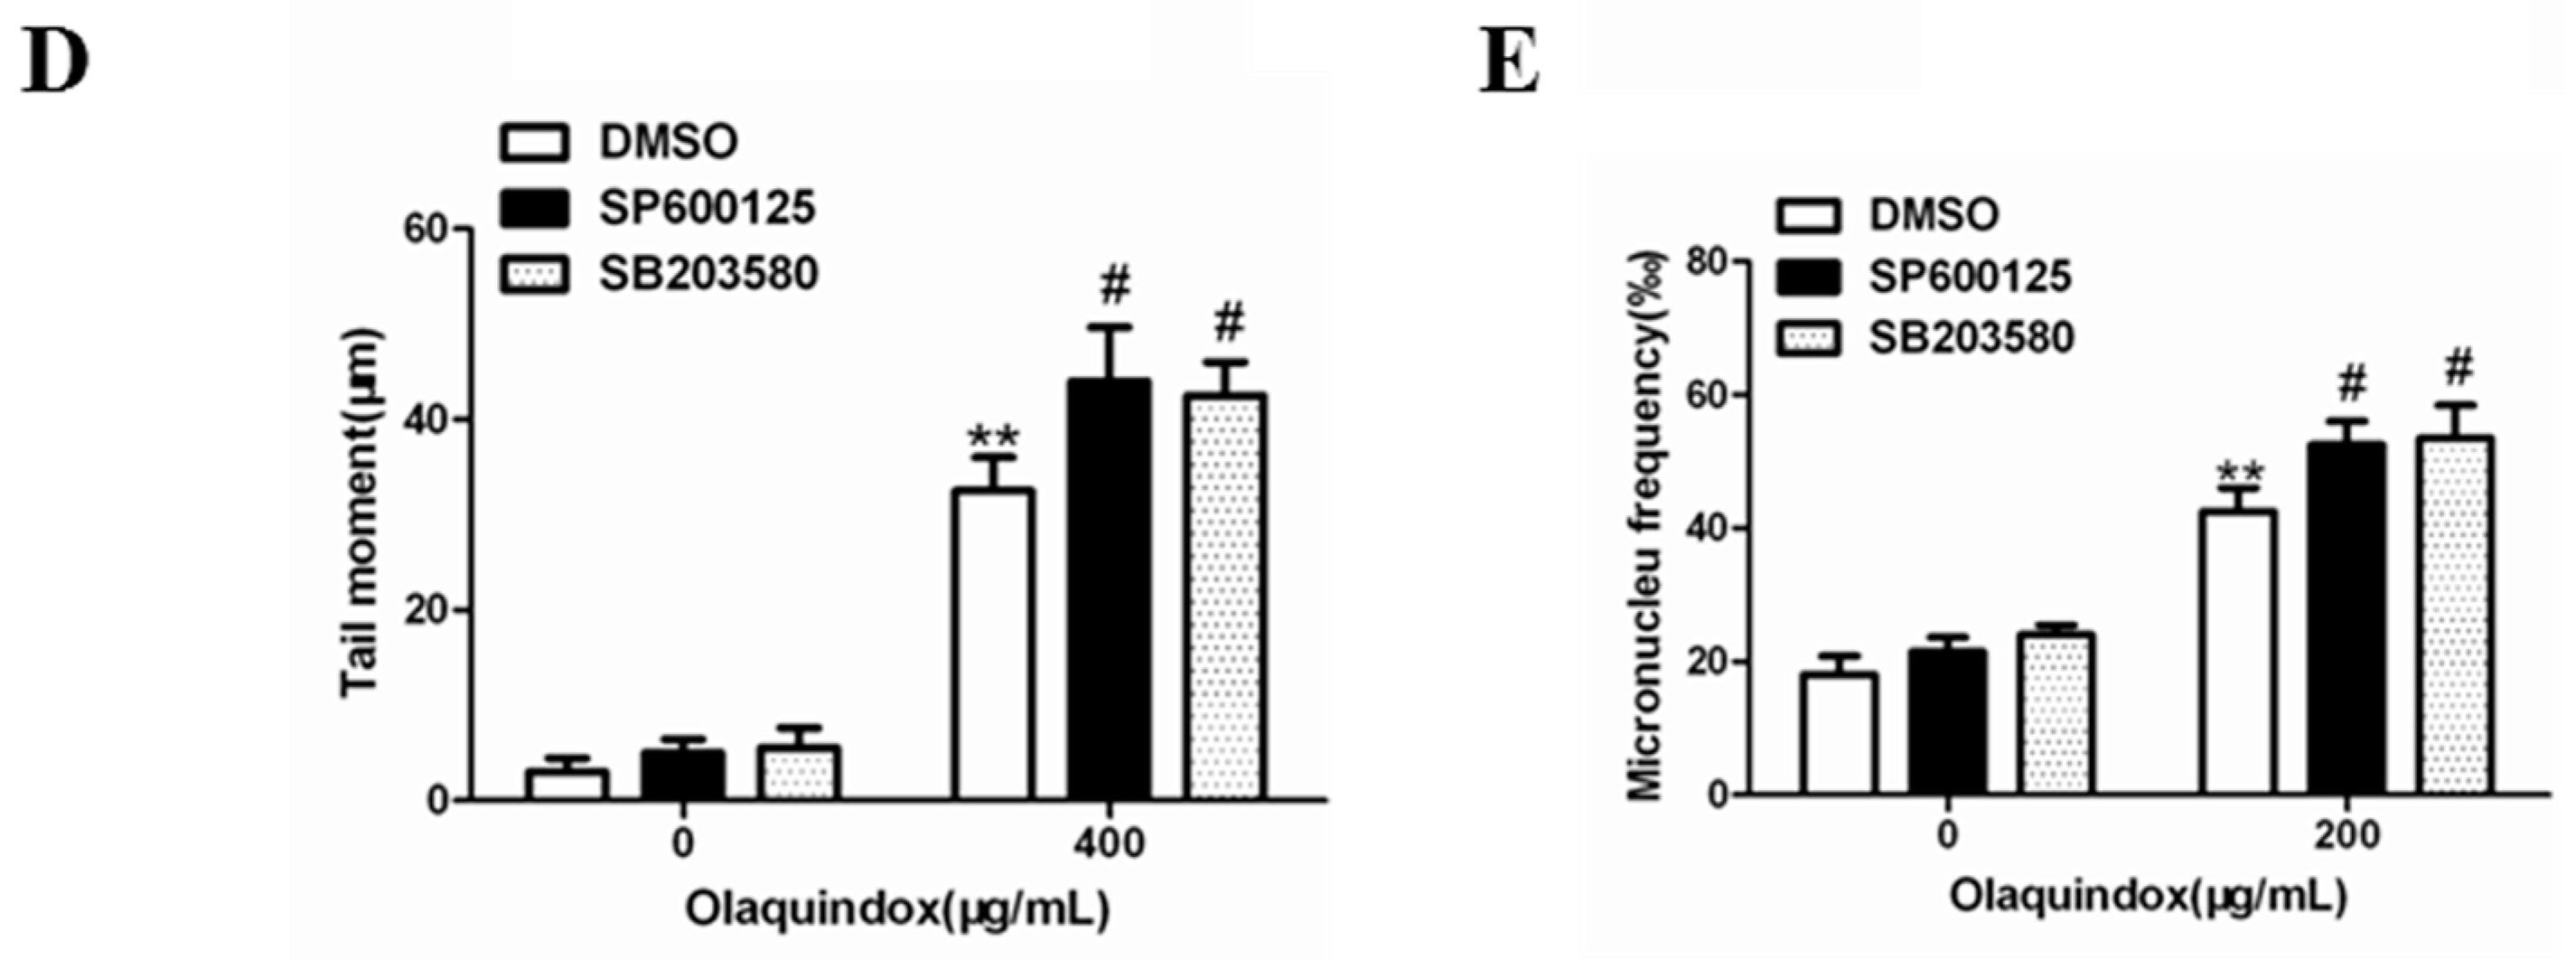
2.9. JNK/p38 Pathways Played Protective Role in Olaquindox-Induced DNA Damage
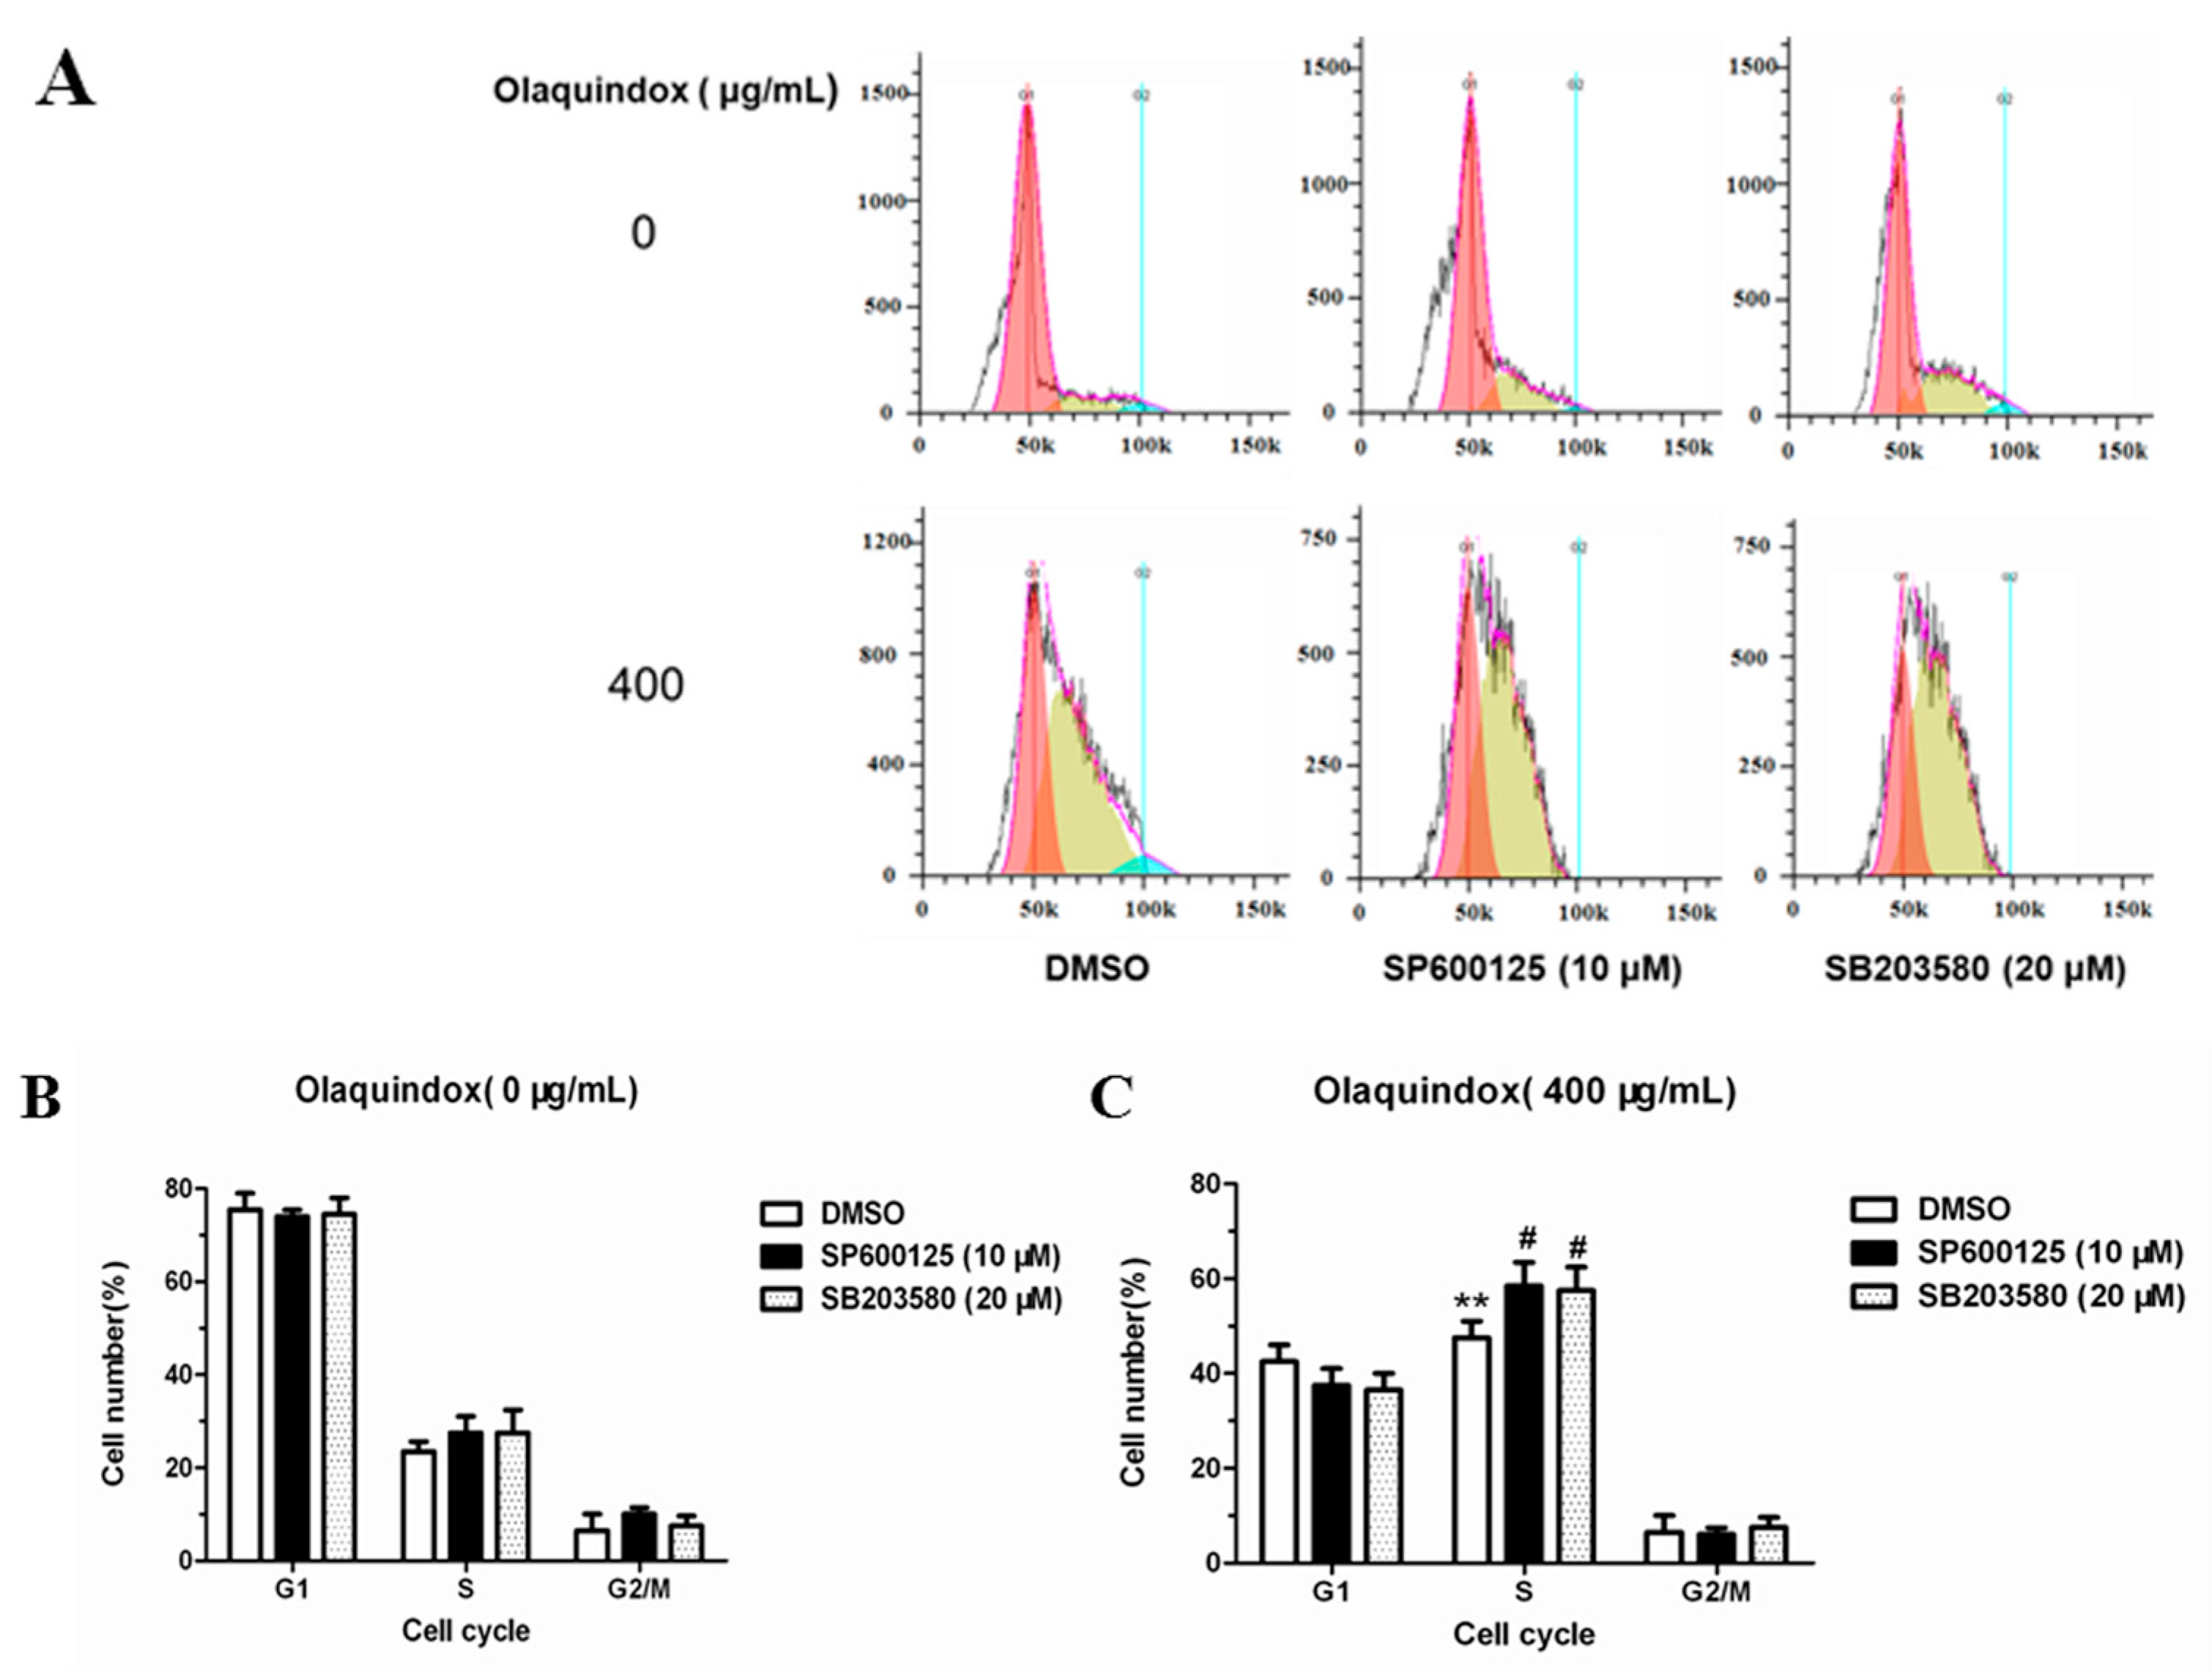
2.10. JNK/p38 Pathways Inhibited Olaquindox-Induced S-Phase Arrest
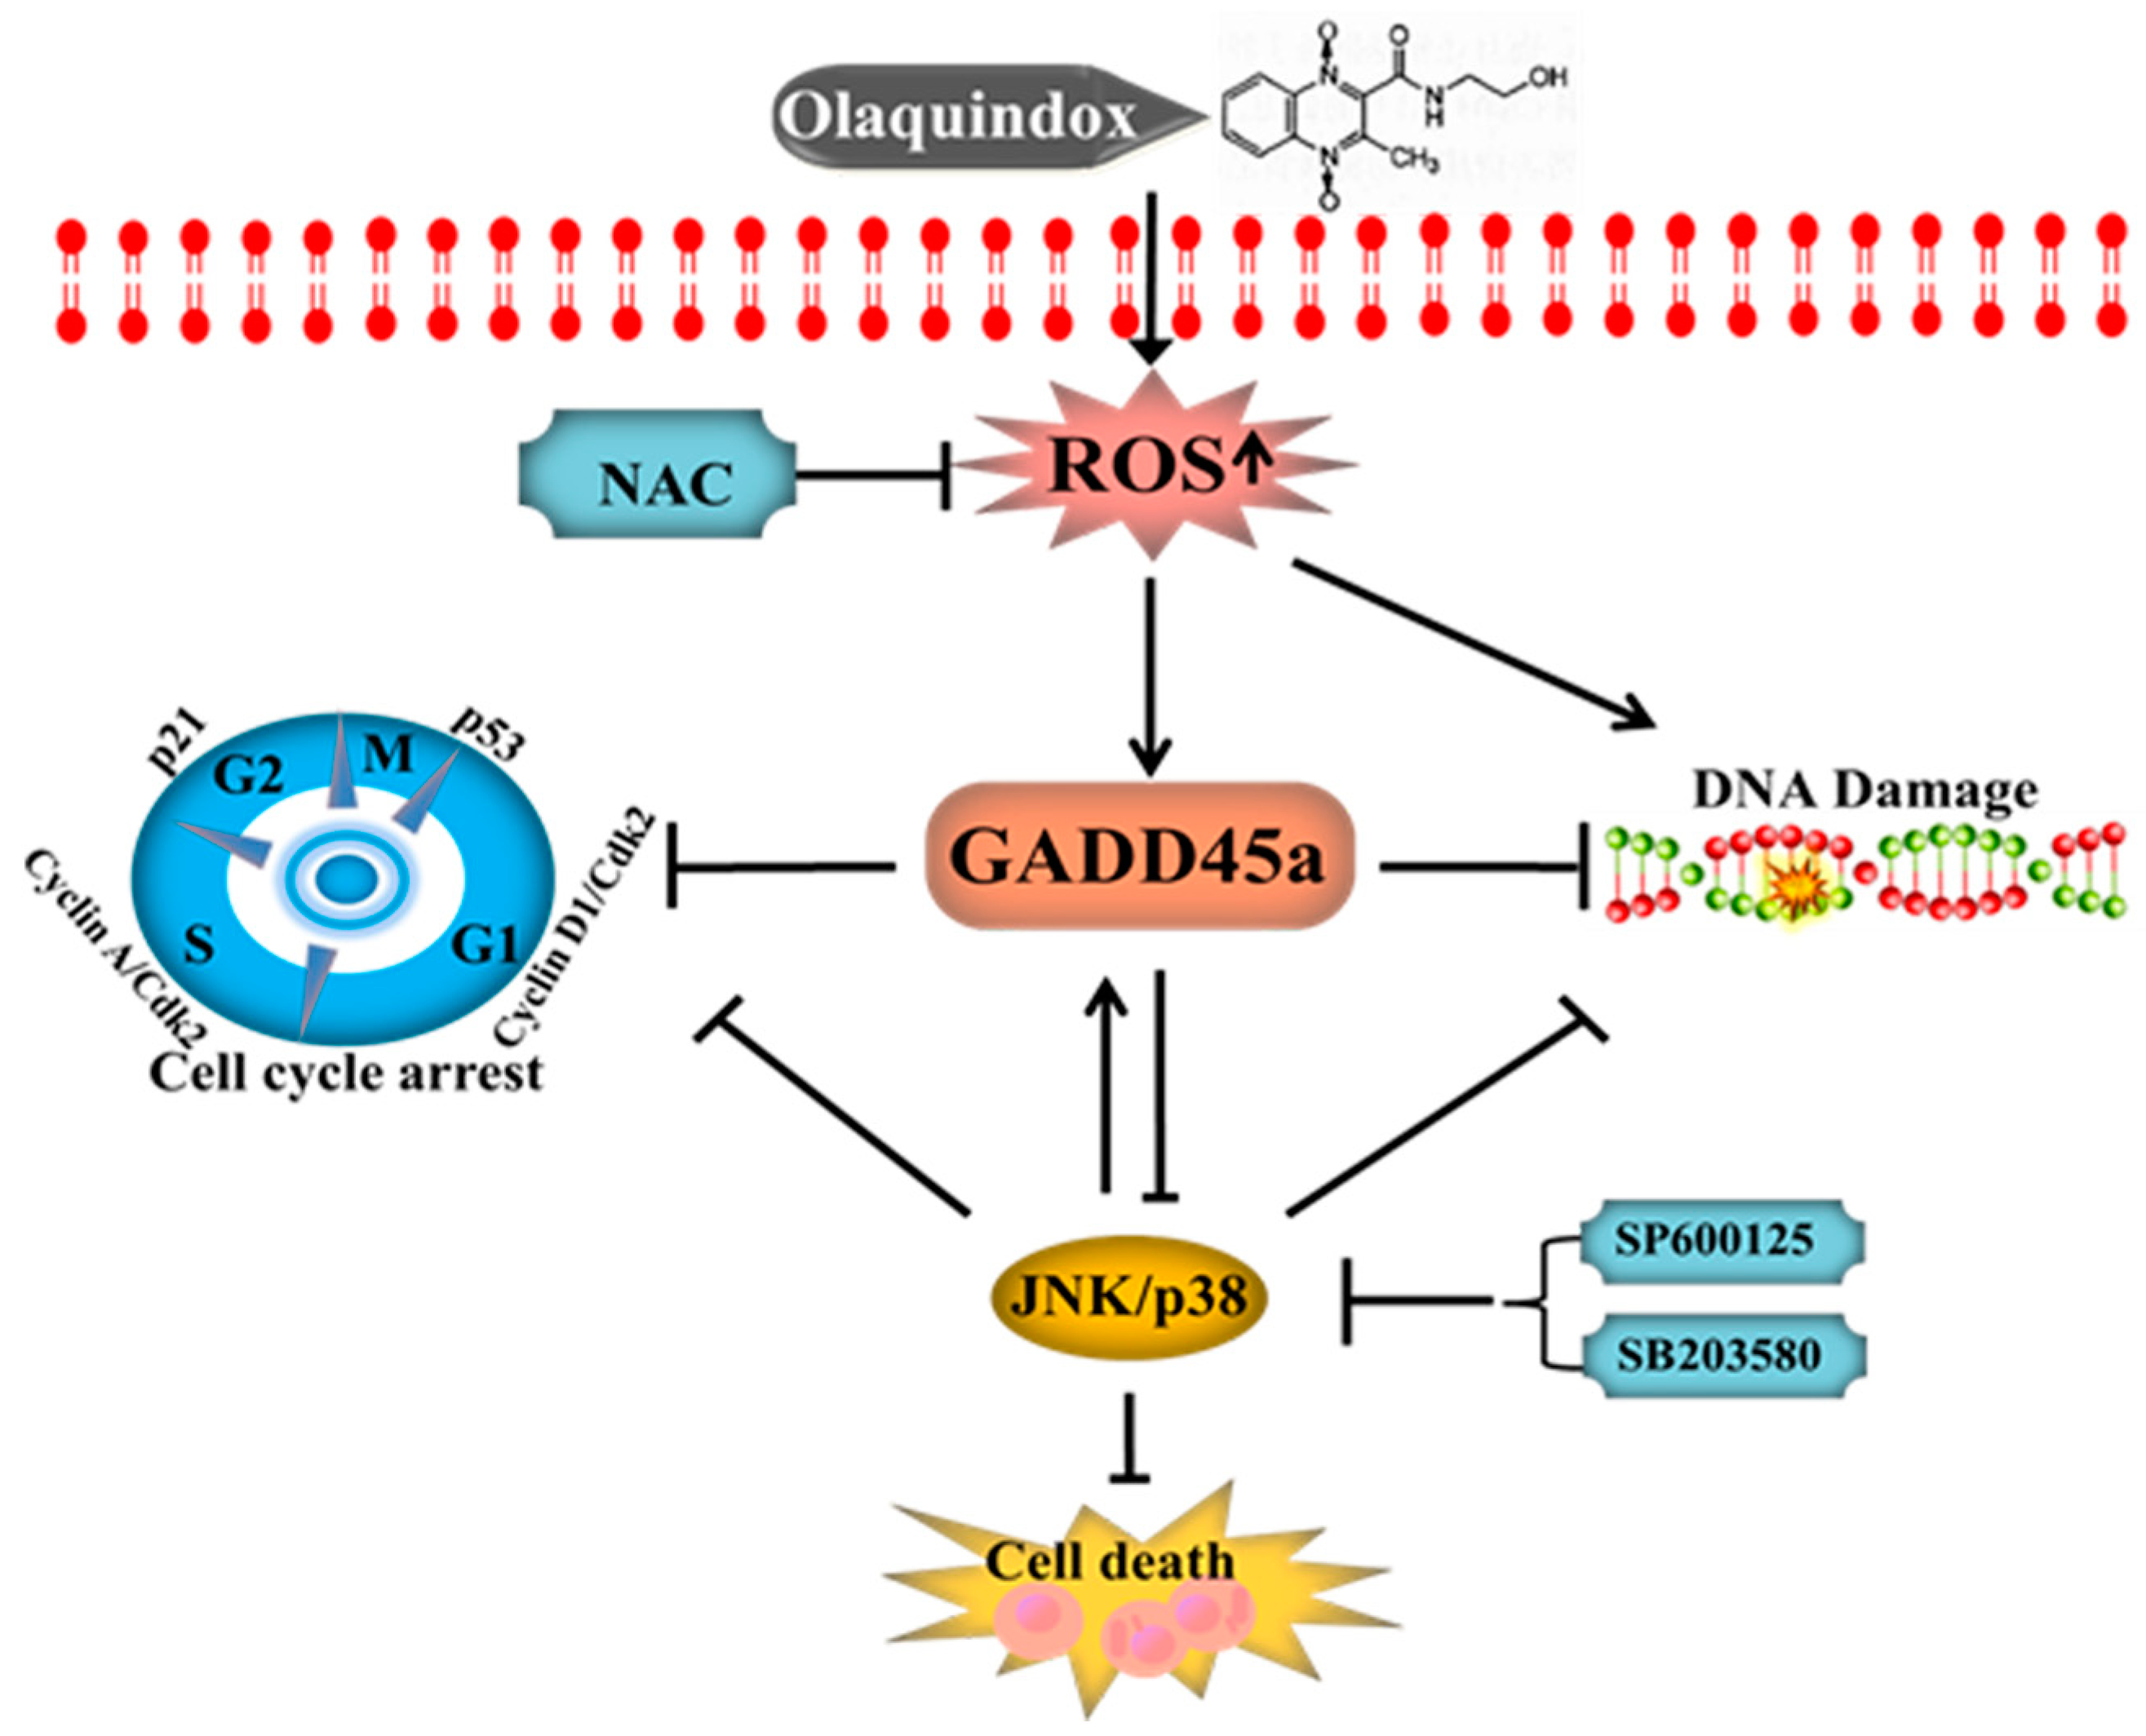
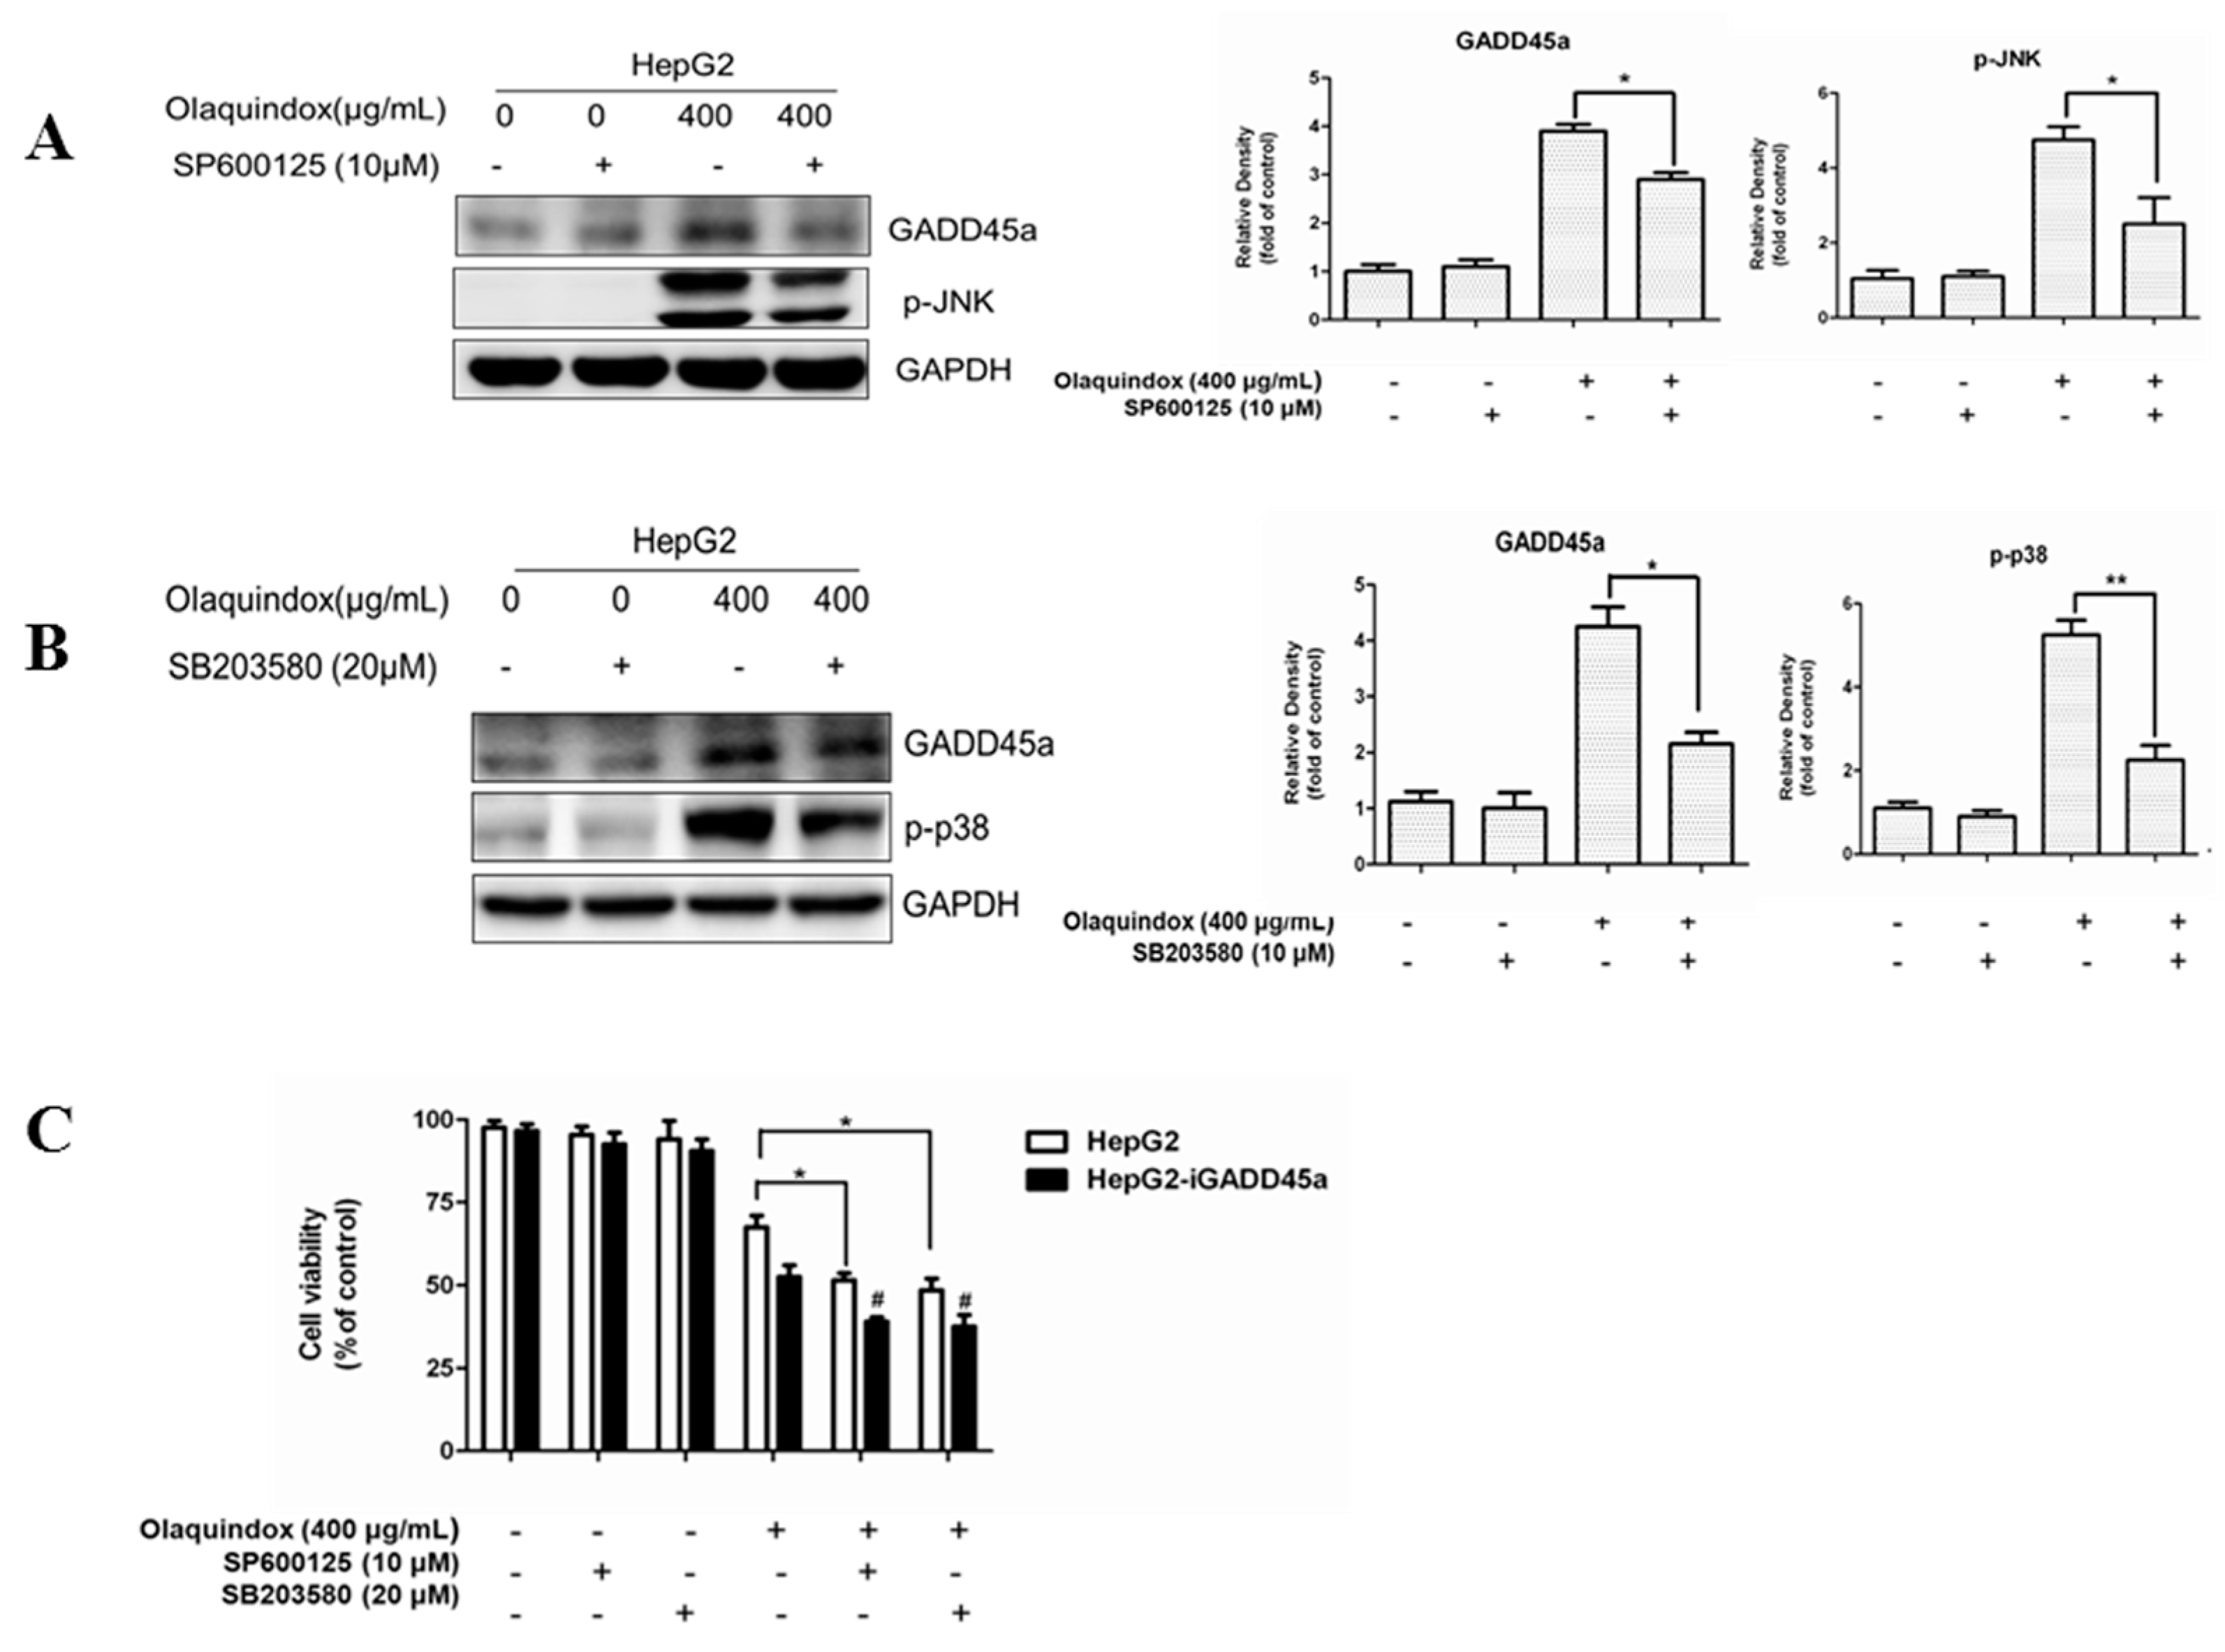
2.11. The Relationship between GADD45a and JNK/p38 Pathways in Olaquindox Response in HepG2 Cells
3. Discussion
4. Materials and Methods
4.1. Materials
4.2. Cell Culture and Olaquindox Treatment
4.3. Measurement of Cell Viability
4.4. Comet Assay
4.5. Cytokinesis Blocked Micronucleus Assay
4.6. Cell Cycle Assay
4.7. Western Blotting Assay
4.8. Quantitative Real-Time (qRT)-PCR Analysis
4.9. Measurement of Intracellular ROS Generation
4.10. Measurement of Apoptosis
4.11. Statistic Analysis
Acknowledgments
Author Contributions
Conflicts of Interest
References
- Carta, A.; Paglietti, G.; Rahbar Nikookar, M.E.; Sanna, P.; Sechi, L.; Zanetti, S. Novel substituted quinoxaline 1,4-dioxides with in vitro antimycobacterial and anticandida activity. Eur. J. Med. Chem. 2002, 37, 355–366. [Google Scholar] [CrossRef]
- Cheng, G.Y.; Sa, W.; Cao, C.; Guo, L.L.; Hao, H.H.; Liu, Z.L.; Wang, X.; Yuan, Z.H. Quinoxaline 1,4-di-N-Oxides: Biological Activities and Mechanisms of Actions. Front. Pharmacol. 2016, 7, 64. [Google Scholar] [CrossRef] [PubMed]
- Guo, W.T.; Hao, H.H.; Dai, M.H.; Wang, Y.L.; Huang, L.L.; Peng, D.P.; Wang, X.; Wang, H.L.; Yao, M.; Sun, Y.W.; et al. Development of Quinoxaline 1,4-Dioxides Resistance in Escherichia coli and Molecular Change under Resistance Selection. PLoS ONE 2012, 7. [Google Scholar] [CrossRef]
- Ihsan, A.; Wang, X.; Zhang, W.; Tu, H.G.; Wang, Y.L.; Huang, L.L.; Iqbal, Z.; Cheng, G.Y.; Pan, Y.H.; Liu, Z.L.; et al. Genotoxicity of quinocetone, cyadox and olaquindox in vitro and in vivo. Food Chem. Toxicol. 2013, 59, 207–214. [Google Scholar] [CrossRef] [PubMed]
- Liu, Z.Y.; Sun, Z.L. The Metabolism of Carbadox, Olaquindox, Mequindox, Quinocetone and Cyadox: An Overview. Med. Chem. 2013, 9, 1017–1027. [Google Scholar] [CrossRef] [PubMed]
- Li, D.; Dai, C.; Zhou, Y.; Yang, X.; Zhao, K.; Xiao, X.; Tang, S. Effect of GADD45a on olaquindox-induced apoptosis in human hepatoma G2 cells: Involvement of mitochondrial dysfunction. Environ. Toxicol. Pharmacol. 2016, 46, 140–146. [Google Scholar] [CrossRef] [PubMed]
- Chen, Q.; Tang, S.; Jin, X.; Zou, J.; Chen, K.; Zhang, T.; Xiao, X. Investigation of the genotoxicity of quinocetone, carbadox and olaquindox in vitro using Vero cells. Food Chem. Toxicol. 2009, 47, 328–334. [Google Scholar] [CrossRef] [PubMed]
- Hao, L.H.; Chen, Q.; Xiao, X.L. Molecular mechanism of mutagenesis induced by olaquindox using a shuttle vector pSP189/mammalian cell system. Mutat. Res. 2006, 599, 21–25. [Google Scholar] [CrossRef] [PubMed]
- Belhadjali, H.; Marguery, M.C.; Journe, F.; Giordano-Labadie, F.; Lefebvre, H.; Bazex, J. Allergic and photoallergic contact dermatitis to Olaquindox in a pig breeder with prolonged photosensitivity. Photodermatol. Photoimmunol. Photomed. 2002, 18, 52–53. [Google Scholar] [CrossRef] [PubMed]
- Wang, X.; Zhang, W.; Wang, Y.L.; Ihsan, A.; Dai, M.H.; Huang, L.L.; Chen, D.M.; Tao, Y.F.; Peng, D.P.; Liu, Z.L.; et al. Two generation reproduction and teratogenicity studies of feeding quinocetone fed to Wistar rats. Food Chem. Toxicol. 2012, 50, 1600–1609. [Google Scholar] [CrossRef] [PubMed]
- Xu, L.H.; Zhao, D.Y.; Song, J.M.; Xu, Z.X.; Zhou, J. Preparation of Epichlorohydrine-Modified Chitosan Microsphere Functionalized Materials and Adsorption Characterization Toward Olaquindox. Int. J. Polym. Anal. Charact. 2011, 16, 118–126. [Google Scholar] [CrossRef]
- Li, Z.; Yu, C.; Chen, X.; Zhang, B.; Cao, P.; Li, B.; Xiao, J. Research on olaquindox induced endoplasmic reticulum stress related apoptosis on nephrotoxicity. J. Hyg. Res. 2015, 44, 444–450. [Google Scholar]
- Wang, X.; Martinez, M.A.; Cheng, G.Y.; Liu, Z.Y.; Huang, L.L.; Dai, M.H.; Chen, D.M.; Martinez-Larranaga, M.R.; Anadon, A.; Yuan, Z.H. The critical role of oxidative stress in the toxicity and metabolism of quinoxaline 1,4-di-N-oxides in vitro and in vivo. Drug Metab. Rev. 2016, 48, 159–182. [Google Scholar] [CrossRef] [PubMed]
- Jin, X.; Tang, S.S.; Chen, Q.A.; Zou, J.J.; Zhang, T.; Liu, F.Y.; Zhang, S.; Sun, C.D.; Xiao, X.L. Furazolidone induced oxidative DNA damage via up-regulating ROS that caused cell cycle arrest in human hepatoma G2 cells. Toxicol. Lett. 2011, 201, 205–212. [Google Scholar] [CrossRef] [PubMed]
- Yang, Y.; Jiang, L.P.; She, Y.; Chen, M.; Li, Q.J.; Yang, G.; Geng, C.Y.; Tang, L.Y.; Zhong, L.F.; Jiang, L.J.; et al. Olaquindox induces DNA damage via the lysosomal and mitochondrial pathway involving ROS production and p53 activation in HEK293 cells. Environ. Toxicol. Pharmacol. 2015, 40, 792–799. [Google Scholar] [CrossRef] [PubMed]
- Maluf, S.W.; Marroni, N.P.; Heuser, V.D.; Pra, D. DNA Damage and Oxidative Stress in Human Disease. BioMed Res. Int. 2013. [Google Scholar] [CrossRef] [PubMed]
- Yu, M.; Wang, D.; Xu, M.; Liu, Y.; Wang, X.; Liu, J.; Yang, X.; Yao, P.; Yan, H.; Liu, L. Quinocetone-induced Nrf2/HO-1 pathway suppression aggravates hepatocyte damage of Sprague-Dawley rats. Food Chem. Toxicol. 2014, 69, 210–219. [Google Scholar] [CrossRef] [PubMed]
- Zou, J.; Chen, Q.; Tang, S.; Jin, X.; Chen, K.; Zhang, T.; Xiao, X. Olaquindox-induced genotoxicity and oxidative DNA damage in human hepatoma G2 (HepG2) cells. Mutat. Res. 2009, 676, 27–33. [Google Scholar] [CrossRef] [PubMed]
- Sun, Y.; Tang, S.S.; Xiao, X.L. The Effect of GADD45a on Furazolidone-Induced S-Phase Cell-Cycle Arrest in Human Hepatoma G2 Cells. J. Biochem. Mol. Toxicol. 2015, 29, 489–495. [Google Scholar] [CrossRef] [PubMed]
- Tamura, R.E.; de Vasconcellos, J.F.; Sarkar, D.; Libermann, T.A.; Fisher, P.B.; Zerbini, L.F. GADD45 proteins: Central players in tumorigenesis. Curr. Mol. Med. 2012, 12, 634–651. [Google Scholar] [CrossRef] [PubMed]
- Hollander, M.C.; Sheikh, M.S.; Bulavin, D.V.; Lundgren, K.; Augeri-Henmueller, L.; Shehee, R.; Molinaro, T.A.; Kim, K.E.; Tolosa, E.; Ashwell, J.D.; et al. Genomic instability in Gadd45a-deficient mice. Nat. Genet. 1999, 23, 176–184. [Google Scholar] [PubMed]
- Smith, M.L.; Ford, J.M.; Hollander, M.C.; Bortnick, R.A.; Amundson, S.A.; Seo, Y.R.; Deng, C.X.; Hanawalt, P.C.; Fornace, A.J., Jr. p53-mediated DNA repair responses to UV radiation: Studies of mouse cells lacking p53, p21, and/or gadd45 genes. Mol. Cell. Biol. 2000, 20, 3705–3714. [Google Scholar] [CrossRef] [PubMed]
- Zhan, Q.M. Gadd45a, a p53-and BRCA1-regulated stress protein, in cellular response to DNA damage. Mutat. Res. 2005, 569, 133–143. [Google Scholar] [CrossRef] [PubMed]
- Qiu, W.H.; David, D.; Zhou, B.S.; Chu, P.G.G.; Zhang, B.H.; Wu, M.C.; Xiao, J.C.; Han, T.Q.; Zhu, Z.G.; Wang, T.X.; et al. Down-regulation of growth arrest DNA damage-inducible gene 45 beta expression is associated with human hepatocellular carcinoma. Am. J. Pathol. 2003, 162, 1961–1974. [Google Scholar] [CrossRef]
- Zhao, W.X.; Tang, S.S.; Jin, X.; Zhang, C.M.; Zhang, T.; Wang, C.C.; Sun, Y.; Xiao, X.L. Olaquindox-induced apoptosis is suppressed through p38 MAPK and ROS-mediated JNK pathways in HepG2 cells. Cell Biol. Toxicol. 2013, 29, 229–238. [Google Scholar] [CrossRef] [PubMed]
- Sahu, R.P.; Zhang, R.F.; Batra, S.; Shi, Y.; Srivastava, S.K. Benzyl isothiocyanate-mediated generation of reactive oxygen species causes cell cycle arrest and induces apoptosis via activation of MAPK in human pancreatic cancer cells. Carcinogenesis 2009, 30, 1744–1753. [Google Scholar] [CrossRef] [PubMed]
- Kang, Y.H.; Lee, S.J. The role of p38 MAPK and JNK in arsenic trioxide-induced mitochondrial cell death in human cervical cancer cells. J. Cell. Physiol. 2008, 217, 23–33. [Google Scholar] [CrossRef] [PubMed]
- Yu, Y.H.; Li, J.X.; Wan, Y.; Lu, J.Y.; Gao, J.M.; Huang, C.S. GADD45 alpha Induction by Nickel Negatively Regulates JNKs/p38 Activation via Promoting PP2C alpha Expression. PLoS ONE 2013, 8. [Google Scholar] [CrossRef]
- Knowles, B.B.; Howe, C.C.; Aden, D.P. Human Hepatocellular-Carcinoma Cell-Lines Secrete the Major Plasma-Proteins and Hepatitis-B Surface-Antigen. Science 1980, 209, 497–499. [Google Scholar] [CrossRef] [PubMed]
- Zhang, X.J.; Zheng, B.; Zhang, H.; Chen, X.C.; Mei, G.M. Determination of marker residue of Olaquindox in fish tissue by ultra performance liquid chromatography-tandem mass spectrometry. J. Sep. Sci. 2011, 34, 469–474. [Google Scholar] [CrossRef] [PubMed]
- Smith, M.L.; Kontny, H.U.; Zhan, Q.; Sreenath, A.; O’Connor, P.M.; Fornace, A.J., Jr. Antisense GADD45 expression results in decreased DNA repair and sensitizes cells to U.V.-irradiation or cisplatin. Oncogene 1996, 13, 2255–2263. [Google Scholar] [PubMed]
- Essers, J.; Theil, A.F.; Baldeyron, C.; van Cappellen, W.A.; Houtsmuller, A.B.; Kanaar, R.; Vermeulen, W. Nuclear dynamics of PCNA in DNA replication and repair. Mol. Cell. Biol. 2005, 25, 9350–9359. [Google Scholar] [CrossRef] [PubMed]
- Orrenius, S.; Gogvadze, A.; Zhivotovsky, B. Mitochondrial oxidative stress: Implications for cell death. Annu. Rev. Pharmacol. 2007, 47, 143–183. [Google Scholar] [CrossRef] [PubMed]
- Wang, X.; Zhang, H.; Huang, L.; Pan, Y.; Li, J.; Chen, D.; Cheng, G.; Hao, H.; Tao, Y.; Liu, Z.; et al. Deoxidation rates play a critical role in DNA damage mediated by important synthetic drugs, quinoxaline 1,4-dioxides. Chem. Res. Toxicol. 2015, 28, 470–481. [Google Scholar] [CrossRef] [PubMed]
- Santra, M.K.; Wajapeyee, N.; Green, M.R. F-box protein FBXO31 mediates cyclin D1 degradation to induce G1 arrest after DNA damage. Nature 2009, 459, 722–725. [Google Scholar] [CrossRef] [PubMed]
- Shackelford, R.E.; Kaufmann, W.K.; Paules, R.S. Cell cycle control, checkpoint mechanisms, and genotoxic stress. Environ. Health Perspect. 1999, 107 (Suppl. 1), 5–24. [Google Scholar] [CrossRef] [PubMed]
- Maeda, T.; Hanna, A.N.; Sim, A.B.; Chua, P.P.; Chong, M.T.; Tron, V.A. GADD45 regulates G2/M arrest, DNA repair, and cell death in keratinocytes following ultraviolet exposure. J. Investig. Dermatol. 2002, 119, 22–26. [Google Scholar] [CrossRef] [PubMed]
- Zou, J.J.; Chen, Q.; Jin, X.; Tang, S.S.; Chen, K.P.; Zhang, T.; Xiao, X.L. Olaquindox induces apoptosis through the mitochondrial pathway in HepG2 cells. Toxicology 2011, 285, 104–113. [Google Scholar] [CrossRef] [PubMed]
- Liu, Q.; Liu, X.; Gao, J.L.; Shi, X.Y.; Hu, X.H.; Wang, S.S.; Luo, Y. Overexpression of DOC-1R Inhibits Cell Cycle G1/S Transition by Repressing CDK2 Expression and Activation. Int. J. Biol. Sci. 2013, 9, 541–549. [Google Scholar] [CrossRef] [PubMed]
- Liu, S.X.; Bishop, W.R.; Liu, M. Differential effects of cell cycle regulatory protein p21(WAF1/Cip1) on apoptosis and sensitivity to cancer chemotherapy. Drug Resist. Update 2003, 6, 183–195. [Google Scholar] [CrossRef]
- Rao, S.; Lowe, M.; Herliczek, T.W.; Keyomarsi, K. Lovastatin mediated G1 arrest in normal and tumor breast cells is through inhibition of CDK2 activity and redistribution of p21 and p27, independent of p53. Oncogene 1998, 17, 2393–2402. [Google Scholar] [CrossRef] [PubMed]
- Salerno, D.M.; Tront, J.S.; Hoffman, B.; Liebermann, D.A. Gadd45a and Gadd45b modulate innate immune functions of granulocytes and macrophages by differential regulation of p38 and JNK signaling. J. Cell. Physiol. 2012, 227, 3613–3620. [Google Scholar] [CrossRef] [PubMed]
- Wu, T.F.; Li, Y.T.; Liu, B.H.; Zhang, S.Q.; Wu, L.Q.; Zhu, X.N.; Chen, Q.X. Expression of Ferritin Light Chain (FTL) Is Elevated in Glioblastoma, and FTL Silencing Inhibits Glioblastoma Cell Proliferation via the GADD45/JNK Pathway. PLoS ONE 2016, 11, e0149361. [Google Scholar] [CrossRef] [PubMed]
- Sharma, V.; Anderson, D.; Dhawan, A. Zinc oxide nanoparticles induce oxidative DNA damage and ROS-triggered mitochondria mediated apoptosis in human liver cells (HepG2). Apoptosis 2012, 17, 852–870. [Google Scholar] [CrossRef] [PubMed]
- Yu, C.F.; Minemoto, Y.; Zhang, J.Y.; Liu, J.; Tang, F.M.; Bui, T.N.; Xiang, J.L.; Lin, A.N. JNK suppresses apoptosis via phosphorylation of the proapoptotic Bcl-2 family protein BAD. Mol. Cell 2004, 13, 329–340. [Google Scholar] [CrossRef]
- Wen, J.; Zhang, Y.W.; Chen, X.Q.; Shen, L.B.; Li, G.C.; Xu, M. Enhancement of diallyl disulfide-induced apoptosis by inhibitors of MAPKs in human HepG2 hepatoma cells. Biochem. Pharmacol. 2004, 68, 323–331. [Google Scholar] [CrossRef] [PubMed]
- Zhu, N.; Shao, Y.; Xu, L.; Yu, L.; Sun, L.H. Gadd45-alpha and Gadd45-gamma utilize p38 and JNK signaling pathways to induce cell cycle G2/M arrest in Hep-G2 hepatoma cells. Mol. Biol. Rep. 2009, 36, 2075–2085. [Google Scholar] [CrossRef] [PubMed]
- Vairapandi, M.; Balliet, A.G.; Hoffman, B.; Liebermann, D.A. GADD45b and GADD45g are cdc2/cyclinB1 kinase inhibitors with a role in S and G2/M cell cycle checkpoints induced by genotoxic stress. J. Cell. Physiol. 2002, 192, 327–338. [Google Scholar] [CrossRef] [PubMed]
- Dai, C.S.; Tang, S.S.; Velkov, T.; Xiao, X.L. Colistin-Induced Apoptosis of Neuroblastoma-2a Cells Involves the Generation of Reactive Oxygen Species, Mitochondrial Dysfunction, and Autophagy. Mol. Neurobiol. 2016, 53, 4685–4700. [Google Scholar] [CrossRef] [PubMed]
- Dai, C.; Li, D.; Gong, L.; Xiao, X.; Tang, S. Curcumin Ameliorates Furazolidone-Induced DNA Damage and Apoptosis in Human Hepatocyte L02 Cells by Inhibiting ROS Production and Mitochondrial Pathway. Molecules 2016, 21, 1061. [Google Scholar] [CrossRef] [PubMed]
- Gonzalez-Arias, C.A.; Benitez-Trinidad, A.B.; Sordo, M.; Robledo-Marenco, L.; Medina-Diaz, I.M.; Barron-Vivanco, B.S.; Marin, S.; Sanchis, V.; Ramos, A.J.; Rojas-Garcia, A.E. Low doses of ochratoxin A induce micronucleus formation and delay DNA repair in human lymphocytes. Food Chem. Toxicol. 2014, 74, 249–254. [Google Scholar] [CrossRef] [PubMed]
- Sample Availability: Samples of the compounds are available from the authors.


© 2017 by the authors. Licensee MDPI, Basel, Switzerland. This article is an open access article distributed under the terms and conditions of the Creative Commons Attribution (CC-BY) license ( http://creativecommons.org/licenses/by/4.0/).
Share and Cite
Li, D.; Dai, C.; Yang, X.; Li, B.; Xiao, X.; Tang, S. GADD45a Regulates Olaquindox-Induced DNA Damage and S-Phase Arrest in Human Hepatoma G2 Cells via JNK/p38 Pathways. Molecules 2017, 22, 124. https://doi.org/10.3390/molecules22010124
Li D, Dai C, Yang X, Li B, Xiao X, Tang S. GADD45a Regulates Olaquindox-Induced DNA Damage and S-Phase Arrest in Human Hepatoma G2 Cells via JNK/p38 Pathways. Molecules. 2017; 22(1):124. https://doi.org/10.3390/molecules22010124
Chicago/Turabian StyleLi, Daowen, Chongshan Dai, Xiayun Yang, Bin Li, Xilong Xiao, and Shusheng Tang. 2017. "GADD45a Regulates Olaquindox-Induced DNA Damage and S-Phase Arrest in Human Hepatoma G2 Cells via JNK/p38 Pathways" Molecules 22, no. 1: 124. https://doi.org/10.3390/molecules22010124