Article

A Method for LC-MS/MS Profiling of Coumarins in Zanthoxylum zanthoxyloides (Lam.) B. Zepernich and Timler Extracts and Essential Oils

1
Université de Corse, UMR CNRS 6134 SPE, Laboratoire de Chimie des Produits Naturels, Campus Grimaldi, BP 52, F-20250 Corte, France
2
Laboratoire de Chimie Organique et Thérapeutique, Faculté de Médecine, Pharmacie et Odontologie, Université Cheikh Anta Diop, BP 5005 Dakar-Fann, Senegal
*
Author to whom correspondence should be addressed.
Molecules 2017, 22(1), 174; https://doi.org/10.3390/molecules22010174
Submission received: 18 November 2016 / Revised: 26 December 2016 / Accepted: 9 January 2017 / Published: 22 January 2017

Abstract

:
The metabolites from the coumarin class, present in tissues of plants belonging mainly to the Rutaceae and Apiaceae families, included compounds with high chemical diversity such as simple coumarins and furocoumarins. These health-promoting components are recognized for their valuable biological activities in herbal preparations but also for their phototoxic effects. In this work, a targeted liquid chromatography (LC) coupled with tandem mass spectrometry (MS2) was developed for the screening of 39 reference standards of coumarins and furocoumarins in essential oils and plant extracts. Chromatographic separation was accomplished on reversed phase column using water/acetonitrile as the mobile phase and detection was performed on a hybrid QqQ/linear ion trap spectrometer fitted with an atmospheric pressure chemical ionization (APCI) source operating in positive ion mode. This analytical approach was applied to investigate the coumarin compositions of fruit essential oils and methanolic extracts obtained from separated parts (fruit, leaf, stem, trunk, and root) of Zanthoxylum zanthoxyloides. Ten coumarins and six furanocoumarins were reported in this species and data analyses were used to assess the suitability of these compounds to the metabolomics-based differentiation of plant organs. The quantification criteria of the metabolites in extract samples included linearity, limit of quantification, limit of detection, and matrix effect were validated. As reported for other species of the Rutaceae family, the concentration of coumarins was drastically higher in Z. zanthoxyloides fruits than in other plant organs.

Graphical Abstract

1. Introduction

Within plant metabolites, coumarins and furanocoumarins represent a wide group of structurally highly diverse compounds, present in tissues of plants belonging mainly to the Rutaceae [1,2,3,4], Apiaceae [4], and Fabaceae families [5]. This compound class is increasingly recognized as a valuable health-promoting constituent of edible plants and herbal plant preparations due to their wide spectrum of biological activities [6,7,8,9]. However, coumarins and furanocoumarins have also been linked to phototoxic [10], mutagenic [11], carcinogenic [12], and hepatotoxic [13] effects and inhibitory properties of cytochrome P450s [14]. Thus, the European Cosmetics Directive 76/768/EEC was recently modified, introducing for the first time a limit on the presence and use of the photosensitizing furocoumarins in cosmetics [15]. The Commission Directive 95/34/EC has also added a new restriction to annex II (entry N°358) as follows; “In sun protection and bronzing products, furocoumarines shall be below 1 mg/kg”. In a more recent proposal SCCNFP/0392/00 (Scientific Committee on Cosmetic and Non-Food-Products), this 1 mg/kg limit is proposed to be generalized to all cosmetic products [16]. In 2004, the European Food Safety Authority (EFSA) established a tolerable daily intake of coumarin of 0.1 mg/kg body weight based on its hepatotoxicity [17].
Plants of the Zanthoxylum genus, belonging to the Rutaceae family, are deciduous aromatic shrubs and trees, comprising about 200 species native to warm temperate and subtropical regions of the world [1]. From the Zanthoxylum species, over 76 coumarins have been isolated up to date. Xanthotoxin, a methoxylated furocoumarin, was first isolated in 1911 from an alcoholic extract of Zanthoxylum zanthoxyloides fruits [18] and their physicochemical properties were characterized by Thoms et al. (1911) [19]. Furthermore, two xanthotoxin and bergapten were reported in the fruits by Paris and Moyse-Mignon (1947) [20]. Thereafter, three simple coumarins (umbelliferone, 6,7-dimethylesculetin, and scopoletin) and five furocoumarins (imperatorin, xanthotoxin, bergapten, marmesin, and psoralen) were identified and quantified by gas chromatography coupled with mass spectrometry (GC-MS) in dichloromethane extracts of dried fruits [21]. In a more recent paper [22], the presence of coumarin-type compounds (6,7-dimethylesculetin, herniarin, psoralen, xanthotoxin, bergapten, isopimpinellin, and imperatorin) has been reported in the essential oils of Z. zanthoxyloides fruits. Other phytochemical studies on Z. zanthoxyloides revealed the presence of essential oils [22,23,24,25,26,27,28], alkaloids [29,30,31], flavonoids [32], and amides [21,29,33].
Although GC-MS is not the best choice for compounds that contain relatively polar or heat-labile substituents, one can make use of derivatization to get a better result [4]. Several high performance liquid chromatography (HPLC) based methods targeting commercial and isolated components were developed in order to monitor coumarins. Reversed phase HPLC coupled with UV detection (HPLC-UV) [3,4,34,35,36,37] or MS (LC-MS and LC-MS/MS) [2,3,4,34,35,37,38,39,40,41,42,43] are the most sensitive and selective methods for detecting coumarin derivatives. However, LC-UV does not allow the quantification of concentrations of less than 10 mg/L [36], such as those encountered in the analysis of complex mixtures, while LC-MS is used to quantify concentrations ranging from μg/L to 10 mg/L. One of the problems of working with LC-MS of natural products is the choice of the ionization technique. Thus, electrospray ionization (ESI) [2,34,35,37,38,39,40,41,42,43] or atmospheric pressure chemical ionization (APCI) [2,3,4,35,38] are the ionization sources commonly used for characterizing mass spectrometry coumarins. ESI is the technique of choice for polar and higher molecular weight compounds, while APCI is suitable for less polar compounds and those of lower molecular weight than ESI. Dugo et al. (2000) reported that coumarins and psoralens give a better response with APCI, while ions were not observed in ESI mode [38].
In the present study, an LC-MS2-based method was developed to dereplicate the possible presence of 39 commercially available coumarins and furocoumarins in Z. zanthoxyloides extracts. Following these results, this work was designed to validate a highly sensitive and selective method for the qualitative and quantitative determination of these components in the fruit essential oils and solvent extracts (fruits, leaves, and barks) of Senegalese Z. zanthoxyloides specie. LC-MS/MS data were also processed using Principal Component Analysis and Discriminant Analysis (PCA-DA) to assess the suitability of coumarin compounds to a metabolomics-based differentiation of plant organs. The application of this analytical approach led to the quality control of this commercial drug, traditionally used throughout Central and West Africa in abdominal and dental problems, sickle-cell disease, and skin disorders such as psoriasis and vitiligo [44,45].

2. Results and Discussion

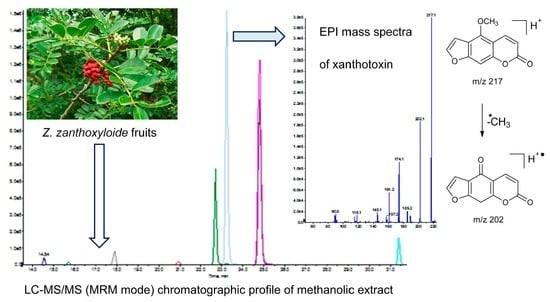
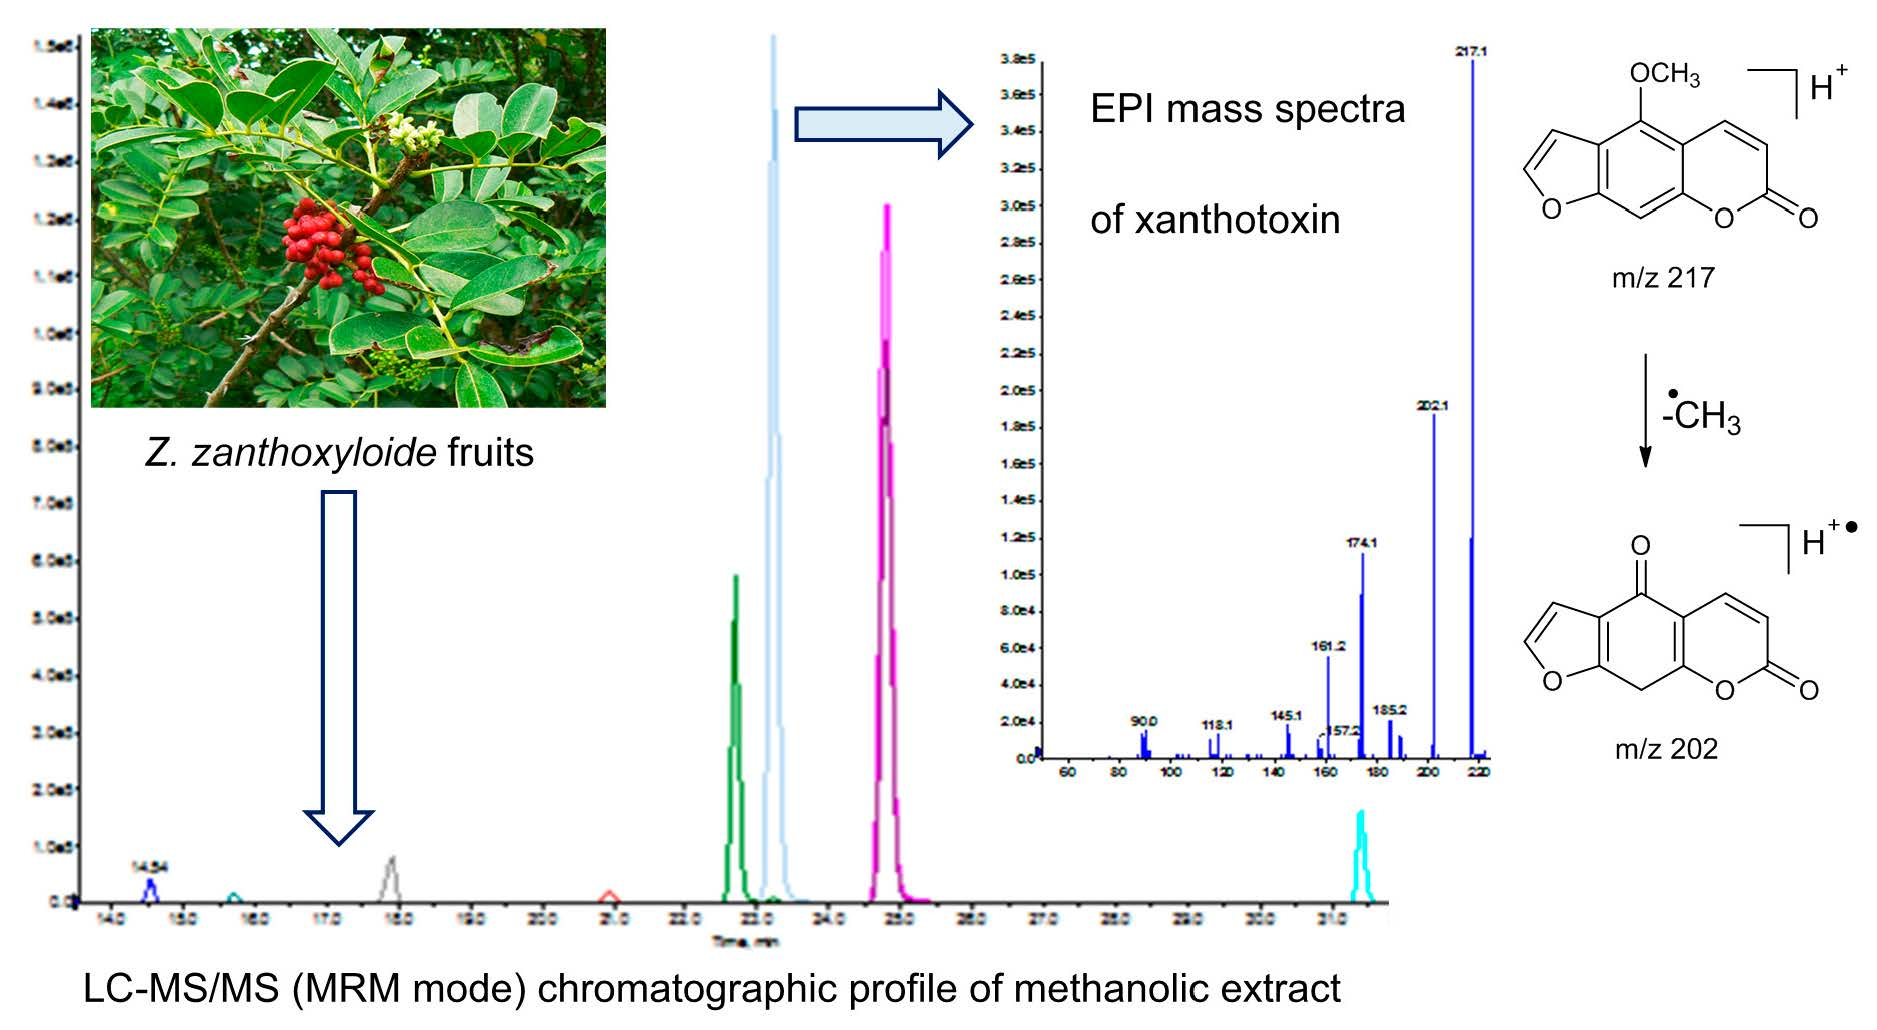
2.1. Targeted LC-MS2 Method

To obtain results on the structural diversity of coumarin-type components in plant extracts, an LC-MS2-based method was developed to detect the possible presence of 39 commercially available coumarins (31 standard compounds) and furocoumarins (8 standard compounds), which are characteristic of species from the Rutaceae family [1,2,3,4,14]. For each reference compound, a relevant transition of the precursor-to-product ions were detected with the utilization of the multiple reaction monitoring (MRM) mode. Using APCI source operating in positive mode, the precursor ion [M + H]+ for each of the 39 analytes was determined in MS1 full scan tests and the product ions in MS/MS experiments. MRM transitions of each analyte were optimized using direct infusion with the following MS/MS parameters; declustering potential (DP), entrance potential (EP), collision cell entrance potential (CEP), collision energy (CE), and collision cell exit potential (CXP) (Table 1). Retention times of reference compounds were determined by LC-MS2 analysis in the multiple reaction monitoring (MRM). Retention times of the 39 coumarin-type components are also indicated in Table 1. Mass spectra of standard components were performed by the MRM mode followed by an enhanced product ion (EPI) scan, triggered by information dependent acquisition (IDA) criteria. The fragmentation behavior of coumarins and furocoumarins was consistent with previous data reported in the literature [34,35,38,39,41,46]. Under collision-induced dissociation (CID), these compounds undergo neutral loss from pseudo-molecular ions [M + H]+, producing the corresponding high-abundance fragment ions: [M + H − CO]+, [M + H – CO − CO]+, [M + H − CO2]+, [M + H − C5H9O]+, [M + H − C5H8]+, [M + H − C5H8 − CO2]+, [M + H − CH3]+, and [M + H − 2CH3]+. For instance, the main ions (base peak) found on the mass spectra of the furocoumarin xanthotoxin was seen at m/z 217 [M + H]+ in Q1 and the predominant ion at m/z 202 ([M + H − CH3]+ (Figure 1).

2.2. Analysis of Z. zanthoxyloides Extracts Using LC-MS2 Method

The identification of coumarins in Z. zanthoxyloides oils and extracts was allowed by the comparison of retention times, the observation of characteristic MRM transitions, and by matching the MS2 spectra of reference compounds (Table 1). The mobile phase, consisting of ACN/H2O (1:1 v/v), allowed the separation of targeted compounds of Z. zanthoxyloides extracts. Ten simple coumarins (110) and six furocoumarins (1116) were unambiguously identified in all plant extracts (fruit, root bark, stem, and trunk bark) such as isoscopoletin 1, daphnetin-7-methylether 2, umbelliferone 3, scopoletin 4, 6,7-dimethylesculetin 5, coumarin 6, herniarin 7, 4-methoxycoumarin 8, 7-methylcoumarin 9, 6-methylcoumarin 10, psoralen 11, xanthotoxin 12, bergapten 13, isopimpinellin 14, isobergapten 15, and imperatorin 16 (Figure 2). In addition to the detection of these sixteen components, no other standard compound was detected in the Z. zanthoxyloides oil and extracts.
In order to provide an evaluation of the variability of in Z. zanthoxyloides samples, essential oils and solvent extracts of each plant part were analyzed by LC-MS/MS, and MRM chromatograms were processed using PCA-DA. Targeted LC-MS profiles of the data set revealed separate clusters for essential oils and extracts, on the one hand, and differences associated with the plant parts, on the other hand. The PCA-DA analyses were based on calculations of intensity mean and standard deviation among the three replicates (methanolic extraction of each plant part collected on three distinct trees) of each peak, detected using scheduled MRM (Table S1). Using this statistical analysis, the scores plots of different Z. zanthoxyloides samples are displayed in Figure 3a. The principal factorial plane (constructed using D1 and D2) accounted for 50.6% of the entire variance of coumarins in plant samples. The fruit samples (essential oils and extracts) are correlated positively with the D1 axis (25.4%), whereas the extract samples of all other plant parts are negatively located on the D1 axis. Note that the trunk and stem samples are located in the same PCA space region, positively correlated with the D2 axis (25.2%), whereas the stem and root extract samples (located in the same quadrant) are negatively correlated with this axis. This indicates a potential differentiation of coumarin composition according to the Z. zanthoxyloides plant parts. The corresponding loading plot in Figure 3b shows the coumarins that make the most difference in separating samples. Characteristic marker components were identified to be responsible for clustering samples such as furocoumarins for fruit samples (essential oils and extracts) or scopoletin and isoscopoletin for trunk extracts.
From these results, it appeared that targeted LC-MS/MS, associated with statistical analysis using PCA-DA, is a rapid and effective approach to obtain similarities and/or differences in metabolic content among extraction methods and/or plant organs. In order to confirm PCA results and to obtain additional data for the differentiation of Z. zanthoxyloides plant parts according to coumarin-type metabolites, the quantification of these marker compounds was carried out by monitoring precursor-to-product ion transition MRM at specific retention times and by a comparison of peak areas in solvent extracts with those of calibration curves from corresponding standard compounds.
The calibration curves of most coumarins exhibited linearity in the concentration ranges (0.01–5 mg/L) with correlation coefficients higher than r2 ≥ 0.9934. The limit of quantification (LOQ) and limit of detection (LOD) of each compound were less than 0.1 mg/L and 0.03 mg/L. The detailed results of the regression equations, corresponding correlation coefficients, linear ranges, and LOQ are shown in Table 2. The matrix effect for 8-Acetyl-6-hydroxy-7-methoxycoumarin, used as the internal standard in plant extracts, ranged from −4.76% to +2.3% and fulfilled the criteria (≤15%).
The concentration of coumarins was much higher in Z. zanthoxyloides fruits as compared to other plant organs (Table 3). Indeed, five furocoumarins were found in high concentrations in the fruit extract, particularly xanthotoxin (12) and imperatorin (16) (39,522.3 mg/kg and 29,607.0 mg/kg respectively), followed by psoralen (11), bergapten (13), and isopimpinellin (14) (5192.6 mg/kg, 8786.8 mg/kg and 8439.3 mg/kg, respectively); this is in comparison with the main simple coumarins such as daphnetin-7-methyl ether (2), umbelliferone (3), and 6,7-dimethylesculetin (5) (1116.0 mg/kg, 1243.1 mg/kg and 1074.3 mg/kg, respectively). Seven other coumarin-type components (1, 4, 710, 15) were reported in low amounts in the fruit extract. In comparison with the fruit extract, the contents of coumarins in other plant parts (leaves, roots, stems, and trunks) were very low (<3600 mg/kg) and umbelliferone (3), 7-methylcoumarin (9), and 6-methylcoumarin (10) were not found in these sample extracts. The presence of coumarin (6) was only reported in low amounts in the stem and trunk extracts. Finally, the coumarin composition of the trunk extracts exhibited relative high concentrations of simple coumarins, isoscopoletin (1), daphnetin-7-methylether (2), and scopoletin (4) in comparison to other plant organs. The amounts of coumarins and furocoumarins were drastically reduced by hydrodistillation, in comparison with methanolic extraction. For instance, the concentrations in the fruit essential oils of xanthotoxin (12) and imperatorin (16) (mg/kg dry plant) were 4.2 mg/kg and 2.8 mg/kg, respectively. The four main coumarin compounds in essential oils (mg/kg fruit oil) were xanthotoxin (12), imperatorin (16), psoralen (11), and bergapten (13); at 421.4 mg/kg, 284.4 mg/kg, 226.7 mg/kg, and 198.1 mg/kg, respectively.
These results are somewhat in agreement with previous studies conducted on fruit extracts of this species, which reported the presence of xanthotoxin, imperatorin, psoralen, bergapten, 6,7-dimethylesculetin, scopoletin, and umbelliferone using GC/MS [21]. Furthermore, the presence of two coumarins, xanthotoxin and bergapten, was detected by Paris and Moyse-Mignon in fruit extract (1947) [20]. It should be noted that all coumarin compounds identified in this study have been previously reported in the essential oils of other plants from the Rutaceae family, especially the Citrus species [2,3,35,38,40,43]. As indicated in the literature for other species of Rutaceae family such as Ruta graveolens [47], the concentration of these metabolites was drastically higher in Z. zanthoxyloides fruits than in other plant parts. To conclude, the use of the LC-MS/MS method, coupled with data analysis, is an effective analytical approach to obtain qualitative and quantitative results on the coumarin and furocoumarin compositions of plant extracts and essential oils. This study reported for the first time 9 coumarins (isoscopoletin, daphnetin-7-methylether, coumarin, herniarin, 4-methoxycoumarin, 7-methylcoumarin, 6-methylcoumarin, isopimpinellin, and isobergapten) in Z. zanthoxyloides. Finally, it appeared that the Zanthoxylum species, commonly used as health supplements in traditional medicine, are attractive for further investigations on coumarin-type compounds, particularly in terms of biological activity and the toxicity of plant extracts.

3. Materials and Methods

3.1. Solvents

Methanol (HPLC grade) and hexane (HPLC grade), used for sample extraction, were purchased from Fisher Scientific (Illkirch, France). The solvents used for liquid chromatography were LC-MS grade acetonitrile (ACN), obtained from Fisher Scientific. Deionized water was purified using a Milli-Q water (Millipore, Bedford, MA, USA) purification system.

3.2. Plant Material

The fruit, leaf, stem, and bark (root and trunk) samples of Z. zanthoxyloides were harvested in May 2015 (fruit ripening period) from three trees, growing wild in one Senegalese locality, Kafountine (12°56′5.49926″ N, 16°44′45.28315″ W). The botanical identification of the plant material was performed by Dr. William Diatta from the Department of botanical and pharmacognosy of University Cheikh Anta Diop of Dakar. A voucher specimen was deposited at the herbarium of that institution under number 001299.

3.3. Plant Extract and Essential Oil Preparation

Each plant organ (fruit, leaf, root bark, stem, and trunk bark) of each tree has been extracted separately. Plant samples were air dried for a period of four weeks at ambient temperature. The plant material was powdered with an average particle size of 0.2 mm using a blade miller (Polymix PX-MFC 90D, KINEMATICA AG, Luzern, Switzerland). 50 g of powder samples were extracted with 3 × 200 mL of methanol over 48 h each time, at room temperature under magnetic stirring. The solutions were combined, filtered through filter paper (PRATDUMAS, Couze-St-Front, France) and evaporated to dryness using a rotary evaporator (Laborota 4000, Heidolph, Schwabach, Germany). The methanolic solution was evaporated to dryness using a rotary evaporator and the extract yields (w/w, calculated on a dry weight plant) were 27.8%, 16.3%, 20.6%, 5.2%, and 14.2% for fruit, leaf, root bark, stem, and trunk bark, respectively. All dried extracts were stored at 4 °C until analysis. Fruit samples were also hydrodistillated (6 h) using a Clevenger-type apparatus (Midisciences, Fuveau, France) according to the method recommended in the European Pharmacopoeia [48]. The yield of essential oil (w/w, calculated on a dry weight basis) was 1.0% and the density was 0.86. Prior to LC-MS2 analysis, 10 mg of each sample extract was dissolved in ACN/H2O (1:1 v/v) to obtain a solution at a final concentration of 100 mg/L. The fruit oil was diluted to 1/100 in acetonitrile. Finally, the solutions were filtered on a 0.2 μm polytetrafluoroethylene (PTFE) filter (Whatman, Maidstone, UK). 1.4 mL of leaf, root, stem, and trunk extract solutions and essential oil solutions were supplemented with 0.1 mL of 8-Acetyl-6-hydroxy-7-methoxycoumarin, used as the internal standard at a concentration of 20 mg/L. For fruit extract, 0.3 mL of the solution was supplemented with 1.1 mL ACN/H2O (1:1 v/v) and 0.1 mL of the internal standard.

3.4. References Compounds and Preparation of Standard Solutions

All references of coumarins 4-methyldaphnetin, esculetin, 6-hydroxycoumarin, isoscopoletin, 6,7-dihydroxy-4-methylcoumarin, daphnetin-7-methylether, umbelliferone, scopoletin, 5,7-dihydroxy-4-methylcoumarin, 8-acetyl-6-hydroxy-7-methoxycoumarin, fraxidin, xanthotoxol, 6,7-dimethylesculetin, coumarin, 8-acetyl-7-methoxycoumarin, herniarin, 4-methoxycoumarin, 8-acetyl-6,7-dimethoxycoumarin, 3-acetylcoumarin, 7-methylcoumarin, psoralen, nordalbergin, 6-methoxy-4-methylcoumarin, 7-methoxy-4-methylcoumarin, xanthotoxin, 6-methylcoumarin, dalbergin, citropten, bergapten, isopimpinllin, 7-ethoxycoumarin, 4-hydroxycoumarin, 4-ethoxycoumarin, 4-methylumbelliferone, 4-methyl-7-ethoxycoumarin, isobergapten, bergaptol, imperatorin, and osthol (98% purity determined by HPLC) were purchased from Extrasynthese (Geney, France). Solutions of each standard were prepared by dissolving the reference compound in ACN/H2O (1:1 v/v) at a final concentration of 5 mg/L, which was then filtered on a 0.2 μm PTFE filter. These standard solutions were diluted with ACN/H2O (1:1 v/v) to obtain calibration curves with seven points in the concentration range of 0.01–5 mg/L. The calibration solutions were stored at 4 °C until LC-MS2 analysis. A blending solution, which contained the 39 reference components at a concentration of 0.1 mg/L in ACN/H2O (1:1 v/v), was used as positive control of LC-MS2 analysis of the plant extracts (before and after sample injections).

3.5. MS2 Conditions

MS2 conditions were carried on an AB Sciex (Toronto, ON, Canada) 3200 QTRAP linear triple quadrupole fitted with an atmospheric pressure chemical ionization (APCI) ion source operating in positive mode. High purity nitrogen was used as both a nebulizer and turbo gas. The APCI source was operated with following settings in positive mode; curtain gas (CUR) 25 psi, nebulizer gas (GS1) 31 psi, heater gas (GS2) 65 psi, ion spray voltage (IS) 5000 V, and temperature 450 °C. Standard solutions (component concentration: 0.1 mg/L) were directly infused at the flow rate of 10 μL/min in the MS/MS apparatus. Multiple EPI mass spectra of each compound were recorded in the range of m/z = 50–500 at 4000 Da/s. IDA properties were set to select 1 to 2 peaks above 300 counts with an exclusion filter after 5 occurrences for 30 s with dynamic background subtraction. The software used for data acquisition and data analysis was Analyst 1.5.2 (AB Sciex, Framingham, MA, USA).

3.6. LC Conditions

The LC system consisted of a Flexar LC Perkin-Elmer (Waltham, MA, USA) with two Flexar FX-10 LC pumps, a Flexar solvent manager, a 275-Flexar autosampler, and a Flexar LC PE200 column oven. LC analyses were performed on a 100 mm × 2.1 mm i.d. 3 μm, LUNA 3U C18 column (Phenomenex, Torrance, CA, USA) and the column temperature was set at 25 °C. A volume of 10 μL of sample was injected using an injection loop of 15 μL in partial loop mode. The mobile phase consisted of MilliQ water (solvent A) and ACN (solvent B). The flow rate was set at 500 μL/min. The column was equilibrated (A:B; v/v) in 90:10 (5 min), and elution was carried out with the following steps; 90:10 (5 min), 80:20 (5 min), 70:30 (5 min), 60:40 (5 min), 50:50 (5 min), a linear gradient increasing from 50% B to 100% (5 min), and 100% B (7 min).

3.7. LC-MS2 Quantification

The LC-MS2 method was validated according to the US Food and Drug Administration (FDA) guidance for bioanalytical method validation by assessing linearity, limit of quantification (LOQ), limit of detection (LOD), and matrix effect [49]. External standard calibration lines were generated by three repeated injections of standard solutions at seven concentration levels (0.01; 0.1; 0.25; 0.5; 1; 2.5; and 5 mg/L) at 1 day. A plot of peak area with respect to the corresponding concentration was used to demonstrate linearity. The linear regression equation and correlation coefficient were calculated by weighted (1/x2) least-squares linear regression analysis. Linearity was considered to be acceptable when correlation coefficients were 0.99 or better and calibrators had accuracies of 85%–115% and precisions within ± 15% RSD (relative standard deviation). The LOD (signal-to-noise <3) was defined as the amount that could be detected, while the LOQ (signal-to-noise >10) was the lowest concentration point of calibration curve at which accuracy (relative error, RE) within 20% and precision below 20% can be considered acceptable. The absolute matrix effect was evaluated by comparing the chromatographic peak areas of 8-Acetyl-6-hydroxy-7-methoxycoumarin (internal standard) in real sample extracts with those of 8-Acetyl-6-hydroxy-7-methoxycoumarin present in the “neat” mobile phase. The matrix effect is considered to be obvious if the ratio is less than ±15% [50].

3.8. Statistical Analysis

The triplicates of each methanol extract (fruit, leaf, stem, root, and trunk barks) and the essential oil from the fruit were analyzed by LC-MS/MS in the multiple reaction monitoring (MRM). MRM-MS chromatographic profiles of each sample were performed using PCA and DA in Marked View™ software (Sciex, Toronto, ON, Canada). PCA (principal components analysis) performs plans (principal components, PCs) where both objects (plant samples) and variables (coumarins components) are plotted according to the variance present in the data set. Discriminant analysis (DA) is performed in order to sharpen the separation between groups of observations, by hopefully rotating PCA components such that a maximum separation among plant samples is obtained, and to understand which coumarin variables carry the sample separating information.

Supplementary Materials

Supplementary materials can be accessed at: https://www.mdpi.com/1420-3049/22/1/174/s1. Table S1 Targeted LC-MS/MS profiles of Z. zanthoxyloides extracts.

Acknowledgments

We thank the Ministry of Higher Education and Scientific Research of Senegal, the Embassy of France in Senegal, and the Territorial Authority of Corsica for their financial support.

Author Contributions

Y.T., J.P., A.W., and J.C., conceived and coordinated the study. Y.T., F.R., and J.P. designed, performed, and analyzed the experiments shown in the text. All authors reviewed the results and approved the final version of the manuscript.

Conflicts of Interest

These authors declare no conflict of interest.

References

  1. Miyake, Y.; Murakami, A.; Sugiyama, Y.; Isobe, M.; Koshimizu, K.; Ohigashi, H. Identification of coumarins from lemon fruit (Citrus limon) as inhibitors of in vitro tumor promotion and superoxide and nitric oxide generation. J. Agric. Food Chem. 1999, 47, 3151–3157. [Google Scholar] [CrossRef] [PubMed]
  2. Dugrand, A.; Olry, A.; Duval, T.; Hehn, A.; Froelicher, Y.; Bourgaud, F. Coumarin and Furanocoumarin Quantitation in Citrus Peel via Ultraperformance Liquid Chromatography Coupled with Mass Spectrometry (UPLC-MS). J. Agric. Food Chem. 2013, 61, 10677–10684. [Google Scholar] [CrossRef] [PubMed]
  3. Frérot, E.; Decorzant, E. Quantification of Total Furocoumarins in Citrus Oils by HPLC Coupled with UV, Fluorescence, and Mass Detection. J. Agric. Food Chem. 2004, 52, 6879–6886. [Google Scholar] [CrossRef] [PubMed]
  4. Peroutka, R.; Schulzová, V.; Botek, P.; Hajšlová, J. Analysis of furanocoumarins in vegetables (Apiaceae) and Citrus fruits (Rutaceae). J. Sci. Food Agric. 2007, 87, 2152–2163. [Google Scholar] [CrossRef]
  5. Rios, M.Y. Terpenes, Coumarins, and Flavones from Acacia pennatula. Chem. Nat. Compd. 2005, 41, 297–298. [Google Scholar] [CrossRef]
  6. Luo, K.; Sun, J.; Chan, J.Y.-W.; Yang, L.; Wu, S.; Fung, K.-P.; Liu, F. Anticancer effects of imperatorin isolated from Angelica dahurica: Induction of apoptosis in HepG2 cells through both death-receptor- and mitochondria-mediated pathways. Chemotherapy 2011, 57, 449–459. [Google Scholar] [CrossRef] [PubMed]
  7. Olomola, T.O.; Mosebi, S.; Klein, R.; Traut-Johnstone, T.; Coates, J.; Hewer, R.; Kaye, P.T. Novel furocoumarins as potential HIV-1 integrase inhibitors. Bioorg. Chem. 2014, 57, 1–4. [Google Scholar] [CrossRef] [PubMed]
  8. Golfakhrabadi, F.; Abdollahi, M.; Ardakani, M.R.S.; Saeidnia, S.; Akbarzadeh, T.; Ahmadabadi, A.N.; Ebrahimi, A.; Yousefbeyk, F.; Hassanzadeh, A.; Khanavi, M. Anticoagulant activity of isolated coumarins (suberosin and suberenol) and toxicity evaluation of Ferulago carduchorum in rats. Pharm. Biol. 2014, 52, 1335–1340. [Google Scholar] [CrossRef] [PubMed]
  9. Prabakaran, D.; Ashokkumar, N. Antihyperglycemic effect of esculetin modulated carbohydrate metabolic enzymes activities in streptozotocin induced diabetic rats. J. Funct. Foods 2012, 4, 776–783. [Google Scholar] [CrossRef]
  10. Schlatter, J.; Zimmerli, B.; Dick, R.; Panizzon, R.; Schlatter, C. Dietary intake and risk assessment of phototoxic furocoumarins in humans. Food Chem. Toxicol. 1991, 29, 523–530. [Google Scholar] [CrossRef]
  11. Belogurov, A.A.; Zavilgelsky, G.B. Mutagenic effect of furocoumarin monoadducts and cross-links on bacteriophage lambda. Mutat. Res. 1981, 84, 11–15. [Google Scholar] [CrossRef]
  12. Lake, B.G. Coumarin Metabolism, Toxicity and Carcinogenicity: Relevance for Human Risk Assessment. Food Chem. Toxicol. 1999, 37, 423–453. [Google Scholar] [CrossRef]
  13. Lake, B.G.; Grasso, P. Comparison of the hepatotoxicity of coumarin in the rat, mouse, and Syrian hamster: A dose and time response study. Toxicol. Sci. 1996, 34, 105–117. [Google Scholar] [CrossRef]
  14. Guo, L.; Yamazoe, Y. Inhibition of cytochrome P450 by furanocoumarins in grapefruit juice and herbal medicines. Acta Pharmacol. Sin. 2004, 25, 129–136. [Google Scholar] [PubMed]
  15. European Union/European Council. Directive, 200315/EC of the European Parliament and of the Council of 27 February 2003 amending Council Directive 76/768/EEC on the approximation of the laws of the Member States relating to cosmetic products. Off. J. Eur. Union 2003, 66, 26–35. [Google Scholar]
  16. Scientific Committee on Consumer Products (SCCP); Opinion on Furocoumarins in Cosmetic Products. SCCP/0942/05. 13 December 2005. Available online: https://ec.europa.eu/health/ph_risk/committees/04_sccp/docs/sccp_o_036.pdf (accessed on 19 January 2017).
  17. Panel, E. Opinion of the Scientific Panel on Food Additives, Flavourings, Processing Aids and Materials in Contacts with Food (AFC) on a request from the Commission related to Coumarin. EFSA J. 2004, 104, 1–36. [Google Scholar]
  18. Priess, H.W. Zur Kenntnis der Inhaltsstoffe von Fagara xanthoxyloides Lam. Berichte Dtsch. Pharm. Ges. 1911, 21, 227–267. [Google Scholar]
  19. Thoms, H. Über die Konstitution des Xanthotoxins und seine Beziehungen zum Bergapten. Berichte Dtsch. Chem. Ges. 1911, 44, 3325–3332. [Google Scholar] [CrossRef]
  20. Paris, R.; Moyse Mignon, H. Etude Préliminaire du Fagara Xanthoxyloides Lam. Ann. Pharm. Fr. 1947, 5, 410–420. [Google Scholar]
  21. Adesina, S.K. Further novel constituents of Zanthoxylum zanthoxyloides root and pericarp. J. Nat. Prod. 1986, 49, 715–716. [Google Scholar] [CrossRef]
  22. Tine, Y.; Diop, A.; Diatta, W.; Desjobert, J.-M.; Boye, C.S.B.; Wélé, A.; Costa, J.; Paolini, J. Chemical diversity and antimicrobial activity of volatile compounds from Zanthoxylum zanthoxyloides Lam. according to compound classes, plant organs and Senegalese sample locations. Chem. Biodivers. 2016. [Google Scholar] [CrossRef] [PubMed]
  23. Menut, C.; Lamaty, G.; Bessière, J.-M.; Molangui, T.; Ayedoun, M.A.; Sossou, P.V.; Sohounhloue, K.D.; Djossou, L.; Houenon, J.G. Aromatic plants of tropical West Africa. X. Volatile constituents of Zanthoxylum zanthoxyloides Lam. leaves and fruit pericarps from Benin. J. Essent. Oil Res. 2000, 12, 33–35. [Google Scholar] [CrossRef]
  24. Gardini, F.; Belletti, N.; Ndagijimana, M.; Guerzoni, M.E.; Tchoumbougnang, F.; Zollo, P.H.A.; Micci, C.; Lanciotti, R.; Kamdem, S.L.S. Composition of four essential oils obtained from plants from Cameroon, and their bactericidal and bacteriostatic activity against Listeria monocytogenes, Salmonella enteritidis and Staphylococcus aureus. Afr. J. Microbiol. Res. 2009, 3, 264–271. [Google Scholar]
  25. Dongmo, P.M.; Tchoumbougnang, F.; Sonwa, E.T.; Kenfack, S.M.; Zollo, P.H.; Menut, C. Antioxidant and anti-inflammatory potential of essential oils of some Zanthoxylum (Rutaceae) of Cameroon. Int. J. Essent. Oil Ther. 2008, 2, 82–88. [Google Scholar]
  26. Tatsadjieu, L.N.; Essia Ngang, J.J.; Ngassoum, M.B.; Etoa, F.-X. Antibacterial and antifungal activity of Xylopia aethiopica, Monodora myristica, Zanthoxylum xanthoxyloides and Zanthoxylum leprieurii from Cameroon. Fitoterapia 2003, 74, 469–472. [Google Scholar] [CrossRef]
  27. Ngassoum, M.B.; Essia-Ngang, J.J.; Tatsadjieu, L.N.; Jirovetz, L.; Buchbauer, G.; Adjoudji, O. Antimicrobial study of essential oils of Ocimum gratissimum leaves and Zanthoxylum xanthoxyloides fruits from Cameroon. Fitoterapia 2003, 74, 284–287. [Google Scholar] [CrossRef]
  28. Fogang, H.P.D.; Tapondjou, L.A.; Womeni, H.M.; Quassinti, L.; Bramucci, M.; Vitali, L.A.; Petrelli, D.; Lupidi, G.; Maggi, F.; Papa, F.; et al. Characterization and biological activity of essential oils from fruits of Zanthoxylum xanthoxyloides Lam. and Z. leprieurii Guill. & Perr., two culinary plants from Cameroon. Flavour Fragr. J. 2012, 27, 171–179. [Google Scholar]
  29. Adesina, S.K. The Nigerian Zanthoxylum; chemical and biological values. Afr. J. Tradit. Complement. Altern. Med. 2005, 2, 282–301. [Google Scholar] [CrossRef]
  30. Couillerot, E.; Caron, C.; Comoe, L.; Audran, J.-C.; Molinatti, P.; Zeches, M.; Le Men-Olivier, L.; Jardillier, J.-C.; Chenieux, J.-C. Benzophenanthridine and furoquinoline accumulation in cell suspension cultures of Fagara zanthoxyloides. Phytochemistry 1994, 37, 425–428. [Google Scholar] [CrossRef]
  31. Messmer, W.M.; Tin-wa, M.; Fong, H.H.S.; Bevelle, C.; Farnsworth, N.R.; Abraham, D.J.; Trojánek, J. Fagaronine, a New Tumor Inhibitor Isolated from Fagara zanthoxyloides Lam. (Rutaceae). J. Pharm. Sci. 1972, 61, 1858–1859. [Google Scholar] [CrossRef] [PubMed]
  32. Azando, E.V.B.; Hounzangbé-Adoté, M.S.; Olounladé, P.A.; Brunet, S.; Fabre, N.; Valentin, A.; Hoste, H. Involvement of tannins and flavonoids in the in vitro effects of Newbouldia laevis and Zanthoxylum zanthoxyloïdes extracts on the exsheathment of third-stage infective larvae of gastrointestinal nematodes. Vet. Parasitol. 2011, 180, 292–297. [Google Scholar] [CrossRef] [PubMed]
  33. Bowden, K.; Ross, W.J. The local anæsthetic in Fagara xanthoxyloides. J. Chem. Soc. 1963, 3503–3505. [Google Scholar] [CrossRef]
  34. Kang, J.; Zhou, L.; Sun, J.; Han, J.; Guo, D.-A. Chromatographic fingerprint analysis and characterization of furocoumarins in the roots of Angelica dahurica by HPLC/DAD/ESI-MSn technique. J. Pharm. Biomed. Anal. 2008, 47, 778–785. [Google Scholar] [CrossRef] [PubMed]
  35. Prosen, H.; Kočar, D. Different sample preparation methods combined with LC–MS/MS and LC–UV for determination of some furocoumarin compounds in products containing citruses. Flavour Fragr. J. 2008, 23, 263–271. [Google Scholar] [CrossRef]
  36. Macmaster, A.P.; Owen, N.; Brussaux, S.; Brevard, H.; Hiserodt, R.; Leijs, H.; Bast, N.; Weber, B.; Loesing, G.; Sherlock, A.; et al. Quantification of selected furocoumarins by high-performance liquid chromatography and UV-detection: Capabilities and limits. J. Chromatogr. A 2012, 1257, 34–40. [Google Scholar] [CrossRef] [PubMed]
  37. Park, A.Y.; Park, S.-Y.; Lee, J.; Jung, M.; Kim, J.; Kang, S.S.; Youm, J.-R.; Han, S.B. Simultaneous determination of five coumarins in Angelicae dahuricae Radix by HPLC/UV and LC-ESI-MS/MS. Biomed. Chromatogr. 2009, 23, 1034–1043. [Google Scholar] [CrossRef] [PubMed]
  38. Dugo, P.; Mondello, L.; Dugo, L.; Stancanelli, R.; Dugo, G. LC-MS for the identification of oxygen heterocyclic compounds in Citrus essential oils. J. Pharm. Biomed. Anal. 2000, 24, 147–154. [Google Scholar] [CrossRef]
  39. Li, B.; Zhang, X.; Wang, J.; Zhang, L.; Gao, B.; Shi, S.; Wang, X.; Li, J.; Tu, P. Simultaneous characterisation of fifty coumarins from the roots of Angelica dahurica by off-line two-dimensional high-performance liquid chromatography coupled with electrospray ionisation tandem mass spectrometry. Phytochem. Anal. 2014, 25, 229–240. [Google Scholar] [CrossRef] [PubMed]
  40. Regueiro, J.; Vallverdú-Queralt, A.; Negreira, N.; Simal-Gándara, J.; Lamuela-Raventós, R.M. Identification and quantification of grapefruit juice furanocoumarin metabolites in urine: An approach based on ultraperformance liquid chromatography coupled to linear ion trap-Orbitrap mass spectrometry and solid-phase extraction coupled to ultraperformance liquid chromatography coupled to triple quadrupole-tandem mass spectrometry. J. Agric. Food Chem. 2014, 62, 2134–2140. [Google Scholar] [PubMed]
  41. Wei, L.; Wang, X.; Zhang, P.; Sun, Y.; Jia, L.; Zhao, J.; Dong, S.; Sun, L. An UPLC-MS/MS method for simultaneous quantitation of two coumarins and two flavonoids in rat plasma and its application to a pharmacokinetic study of Wikstroemia indica extract. J. Chromatogr. B Anal. Technol. Biomed. Life Sci. 2016, 1008, 139–145. [Google Scholar] [CrossRef] [PubMed]
  42. Zhao, A.-H.; Zhang, Y.-B.; Yang, X.-W. Simultaneous determination and pharmacokinetics of sixteen Angelicae dahurica coumarins in vivo by LC–ESI-MS/MS following oral delivery in rats. Phytomedicine 2016, 23, 1029–1036. [Google Scholar] [CrossRef] [PubMed]
  43. Messer, A.; Nieborowski, A.; Strasser, C.; Lohr, C.; Schrenk, D. Major furocoumarins in grapefruit juice I: Levels and urinary metabolite(s). Food Chem. Toxicol. 2011, 49, 3224–3231. [Google Scholar] [CrossRef] [PubMed]
  44. Matu, E.N. Zanthoxylum zanthoxyloides (Lam.) Zepern. & Timler. Record from Protabase. Schmelzer, G.H., Gurib-Fakim, A., Eds.; PROTA (Plant Resources of Tropical Africa/Ressources Végétales de l’Afrique Tropicale): Wageningen, The Netherlands. Available online: http://www.prota4u.org/protav8.asp?p=Zanthoxylum+zanthoxyloides (accessed on 28 April 2016).
  45. Kerharo, J.; Adam, J.G. La Pharmacopée Sénégalaise Traditionnelle; Vigot Frères: Paris, France, 1974. [Google Scholar]
  46. Yang, W.; Ye, M.; Liu, M.; Kong, D.; Shi, R.; Shi, X.; Zhang, K.; Wang, Q.; Lantong, Z. A practical strategy for the characterization of coumarins in Radix glehniae by liquid chromatography coupled with triple quadrupole-linear ion trap mass spectrometry. J. Chromatogr. A 2010, 1217, 4587–4600. [Google Scholar] [CrossRef] [PubMed]
  47. Milesi, S.; Massot, B.; Gontier, E.; Bourgaud, F.; Guckert, A. Ruta graveolens L.: A promising species for the production of furanocoumarins. Plant Sci. 2001, 161, 189–199. [Google Scholar] [CrossRef]
  48. Council of Europe. European Pharmacopoeia, 3rd ed.; Council of Europe: Strasbourg, France, 1997. [Google Scholar]
  49. Bioanalytical Method Validation. Available online: http://www.fda.gov/downloads/drugs/guidancecomplianceregulatoryinformation/guidances/ucm368107.pdf (accessed on 22 June 2016).
  50. Taylor, P.J. Matrix effects: The Achilles heel of quantitative high-performance liquid chromatography–electrospray–tandem mass spectrometry. Clin. Biochem. 2005, 38, 328–334. [Google Scholar] [CrossRef] [PubMed]
  • Sample Availability: Not available.
Figure 1. Enhanced product ion (EPI) mass spectrum of xanthotoxin with the atmospheric pressure chemical ionization (APCI) source in positive ion mode.
Molecules 22 00174 g001
Figure 2. Chemical structures of coumarins (110) and furocoumarins (1116) of Z. zanthoxyloides samples.
Molecules 22 00174 g002
Figure 3. (a) Scores plot of principal component analysis and discriminant analysis (PCA-DA) of the Z. zanthoxyloides extracts (fruit, leaf, stem, root, trunk) and fruit essential oils analyzed using LC-MS/MS in the MRM mode; (b) Scores plot of PCA-DA of coumarins and furocoumarins detected in Z. zanthoxyloides samples using LC-MS/MS in the MRM mode.
Molecules 22 00174 g003aMolecules 22 00174 g003b
Table 1. Retention times (Tr), multiple reaction monitoring (MRM) transition, and optimized tandem mass spectrometry (MS/MS) detection parameters of 39 coumarins.
CompoundsTr (min)TransitionMS Parameters (V)
Q1 Mass (Da)Q3 Mass (Da)DPEPCEPCECXP
4-Methyldaphnetin9.5193.1119.2568.012314
Esculetin11.7179.0123.1719.010274
6-Hydroxycoumarin13.6163.0107.2515.516314
Isoscopoletin14.1193.1133.15612.012254
6,7-Dihydroxy-4-methylcoumarin14.3193.191.27610.510374
Daphnetin 7-methylether14.4193.1178.16610.012274
Umbelliferone14.5163.0107.2569.512294
Scopoletin14.5193.1133.2768.510254
5,7-Dihydroxy-4-methylcoumarin14.6193.191.16611.010394
8-Acetyl-6-hydroxy-7-methoxycoumarin15.6235.1189.1567.514174
Fraxidin15.7223.1190.1619.514194
Xanthotoxol17.9203.1147.17610.512274
6,7-Dimethylesculetin17.9207.1151.2614.512294
Coumarin18.9147.091.1464.512294
8-Acetyl-7-methoxycoumarin18.9219.1115.2618.512434
Herniarin20.8177.1121.1564.012274
4-Methoxycoumarin20.9177.1118.1613.012274
8-Acetyl-6,7-dimethoxycoumarin21.4249.1115.25610.514434
3-Acetylcoumarin21.6189.1115.1418.512374
7-Methylcoumarin22.7161.1105.1518.512294
Psoralen22.7187.1131.15610.512334
Nordalbergin22.7255.1152.27610.014554
6-Methoxy-4-methylcoumarin22.8191.191.2715.012514
7-Methoxy-4-methylcoumarin23.2191.191.2714.012534
Xanthotoxin23.2217.1202.07112.014614
6-Methylcoumarin23.7161.0105.1469.010274
Dalbergin24.2269.1152.29110.516594
Citropten24.6207.1121.36110.512334
Bergapten24.7217.1202.0618.514274
Isopimpinllin24.9247.1217.17110.514234
7-Ethoxycoumarin25.0191.1163.1564.512254
4-Hydroxycoumarin25.1163.0121.1819.010254
4-Ethoxycoumarin25.2191.1163.0469.012214
4-Methylumbelliferone26.3177.177.19112.012454
4-Methyl-7-ethoxycoumarin26.8205.1177.1618.512194
Isobergapten28.7217.1202.1618.512334
Bergaptol29.6203.1147.2664.512294
Imperatorin31.5271.2203.1515.014174
Osthol32.3245.1189.1564.514174
DP = declustering potential, EP = entrance potential, CEP = collision cell entrance potential, CE = collison energy, CXP = collision cell exit potential.
Table 2. Regression equations, correlation coefficients, and linear ranges of 16 coumarins (116) identified in the Z. zanthoxyloides samples.
No.CompoundsRegression Equationr2Linear Range (mg/L)LOQ (mg/L)LOD (mg/L)
1Isoscopoletiny = 112,000x + 32700.99700.10–2.50.100.03
2Daphnetin-7-methylethery = 27,200x + 12600.99340.10–1.00.100.03
3Umbelliferoney = 705,000x + 15800.99910.01–5.00.010.003
4Scopoletiny = 119,000x + 24500.99610.10–5.00.100.03
56,7-Dimethylesculetiny = 2,090,000x − 21,0000.99740.10–5.00.100.03
6Coumariny = 241,000x − 23000.99790.01–5.00.010.003
7Herniariny = 4,080,000x − 31400.99890.01–5.00.010.003
84-Methoxycoumariny = 1,830,000x − 18,3000.99410.01–5.00.010.003
97-Methylcoumariny = 1,170,000x − 21000.99730.10–5.00.100.03
106-Methylcoumariny = 874,000x − 11,5000.99960.01–5.00.010.003
11Psoraleny = 2,150,000x − 30000.99810.01–5.00.010.003
12Xanthotoxiny = 1,180,000x + 4720.99970.01–5.00.010.003
13Bergapteny = 4,330,000x − 18500.99890.01–1.00.010.003
14Isopimpinelliny = 3,330,000x + 7210.99850.01–5.00.010.003
15Isobergapteny = 2,690,000x − 14100.99760.01–5.00.010.003
16Imperatoriny = 1,04,000x − 890.99510.01–5.00.010.003
IS8-Acetyl-6-hydroxy-7-methoxycoumariny = 117,000x − 23.70.99920.01–2.50.010.003
In the regression equation y = ax + b, x refers to the sample injection amount, y to the peak area; r2 is the correlation coefficient of the equation, and LOQ is the limit of quantification.
Table 3. Contents of the coumarins and furocoumarins in Z. zanthoxyloides plant parts (n = 3).
No.ComponentsConcentration of Coumarin Components (mg/kg Dry Plant Material Weight ± SD)Concentration of Coumarin Components (mg/kg Fruit Oil Weight ± SD)
Solvent ExtractsEssential Oil
FruitLeafRootStemTrunkFruit
1Isoscopoletin632.5 ± 20.3<LOQ<LOQ118.3 ± 3.81047.8 ± 18.4NDND
2Daphnetin-7-methylether1116.0 ± 21.6ND<LOQ99.4 ± 6.51835.9 ± 35.1<LOQ<LOQ
3Umbelliferone1243.1 ± 26.9NDNDNDNDNDND
4Scopoletin370.6 ± 8.6<LOQ<LOQ<LOQ577.8 ± 3.1NDND
56,7-Dimethylesculetin1074.3 ± 4.6<LOQ<LOQ<LOQ1062.0 ± 5.3<LOQ<LOQ
6CoumarinNDNDND<LOQ<LOQ0.1 ± 0.08.1 ± 0.6
7Herniarin152.0 ± 2.2NDNDND79.3 ± 1.40.1 ± 0.06.5 ± 0.0
84-Methoxycoumarin<LOQNDNDND<LOQtr2.0 ± 0.0
97-Methylcoumarin<LOQNDNDNDNDtr3.4 ± 0.1
106-Methylcoumarin<LOQNDNDNDNDtr4.4 ± 0.1
11Psoralen5192.6 ± 68.859.1 ± 2.3ND<LOQND2.3 ± 0.1226.7 ± 6.2
12Xanthotoxin39,522.3 ± 9.3263.7 ± 9.1<LOQ13.5 ± 0.5<LOQ4.2 ± 0.1421.4 ± 12.5
13Bergapten8786.8 ± 29.884.7 ± 0.5ND6.9 ± 0.1ND3.00 ± 0.0198.1 ± 2.0
14Isopimpinellin8439.3 ± 13.835.1 ± 1.4<LOQ<LOQ<LOQ0.4 ± 0.039.2 ± 0.0
15Isobergapten99.9 ± 1.4<LOQNDNDNDtr1.5 ± 0.1
16Imperatorin29,607.0 ± 0.0224.1 ± 9.9<LOQ16.5 ± 0.1<LOQ2.8 ± 0.1284.4 ± 6.5
ND: Not Dected; LOQ: Limit of Quantification; SD: Standard Deviation; tr: trace <0.1 mg/kg.

