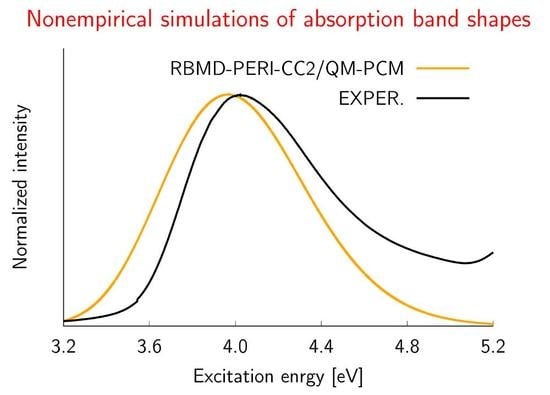
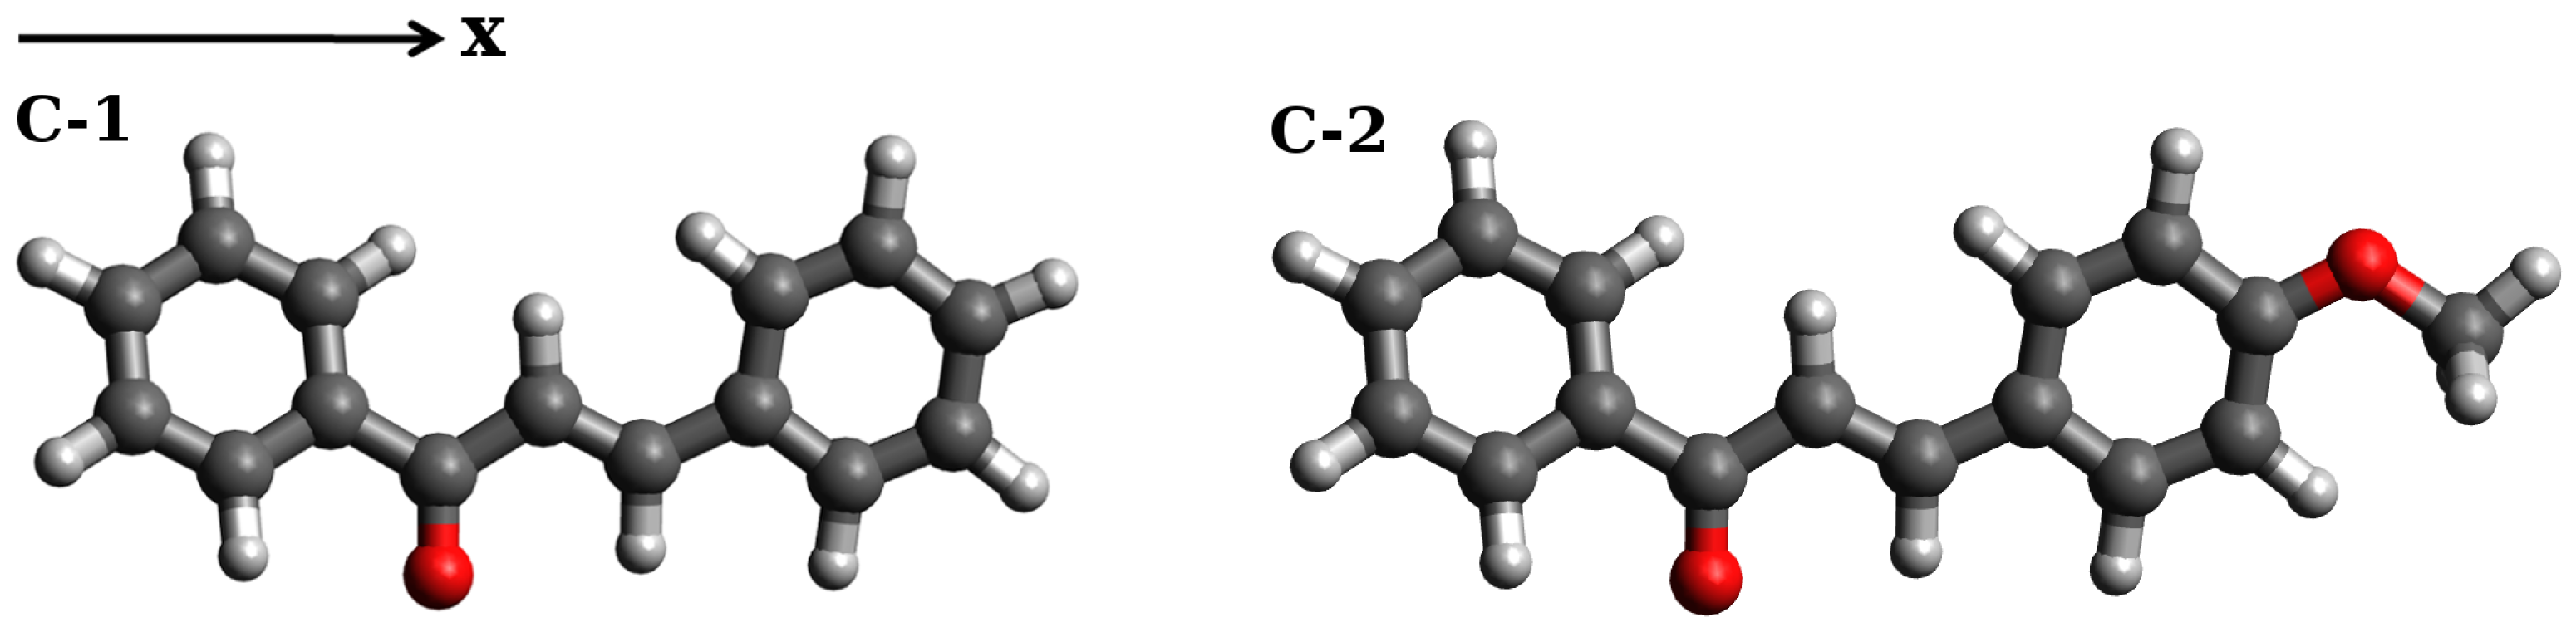
Nonempirical Simulations of Inhomogeneous Broadening of Electronic Transitions in Solution: Predicting Band Shapes in One- and Two-Photon Absorption Spectra of Chalcones

 , and
, and
Abstract
:
1. Introduction
2. Results and Discussion
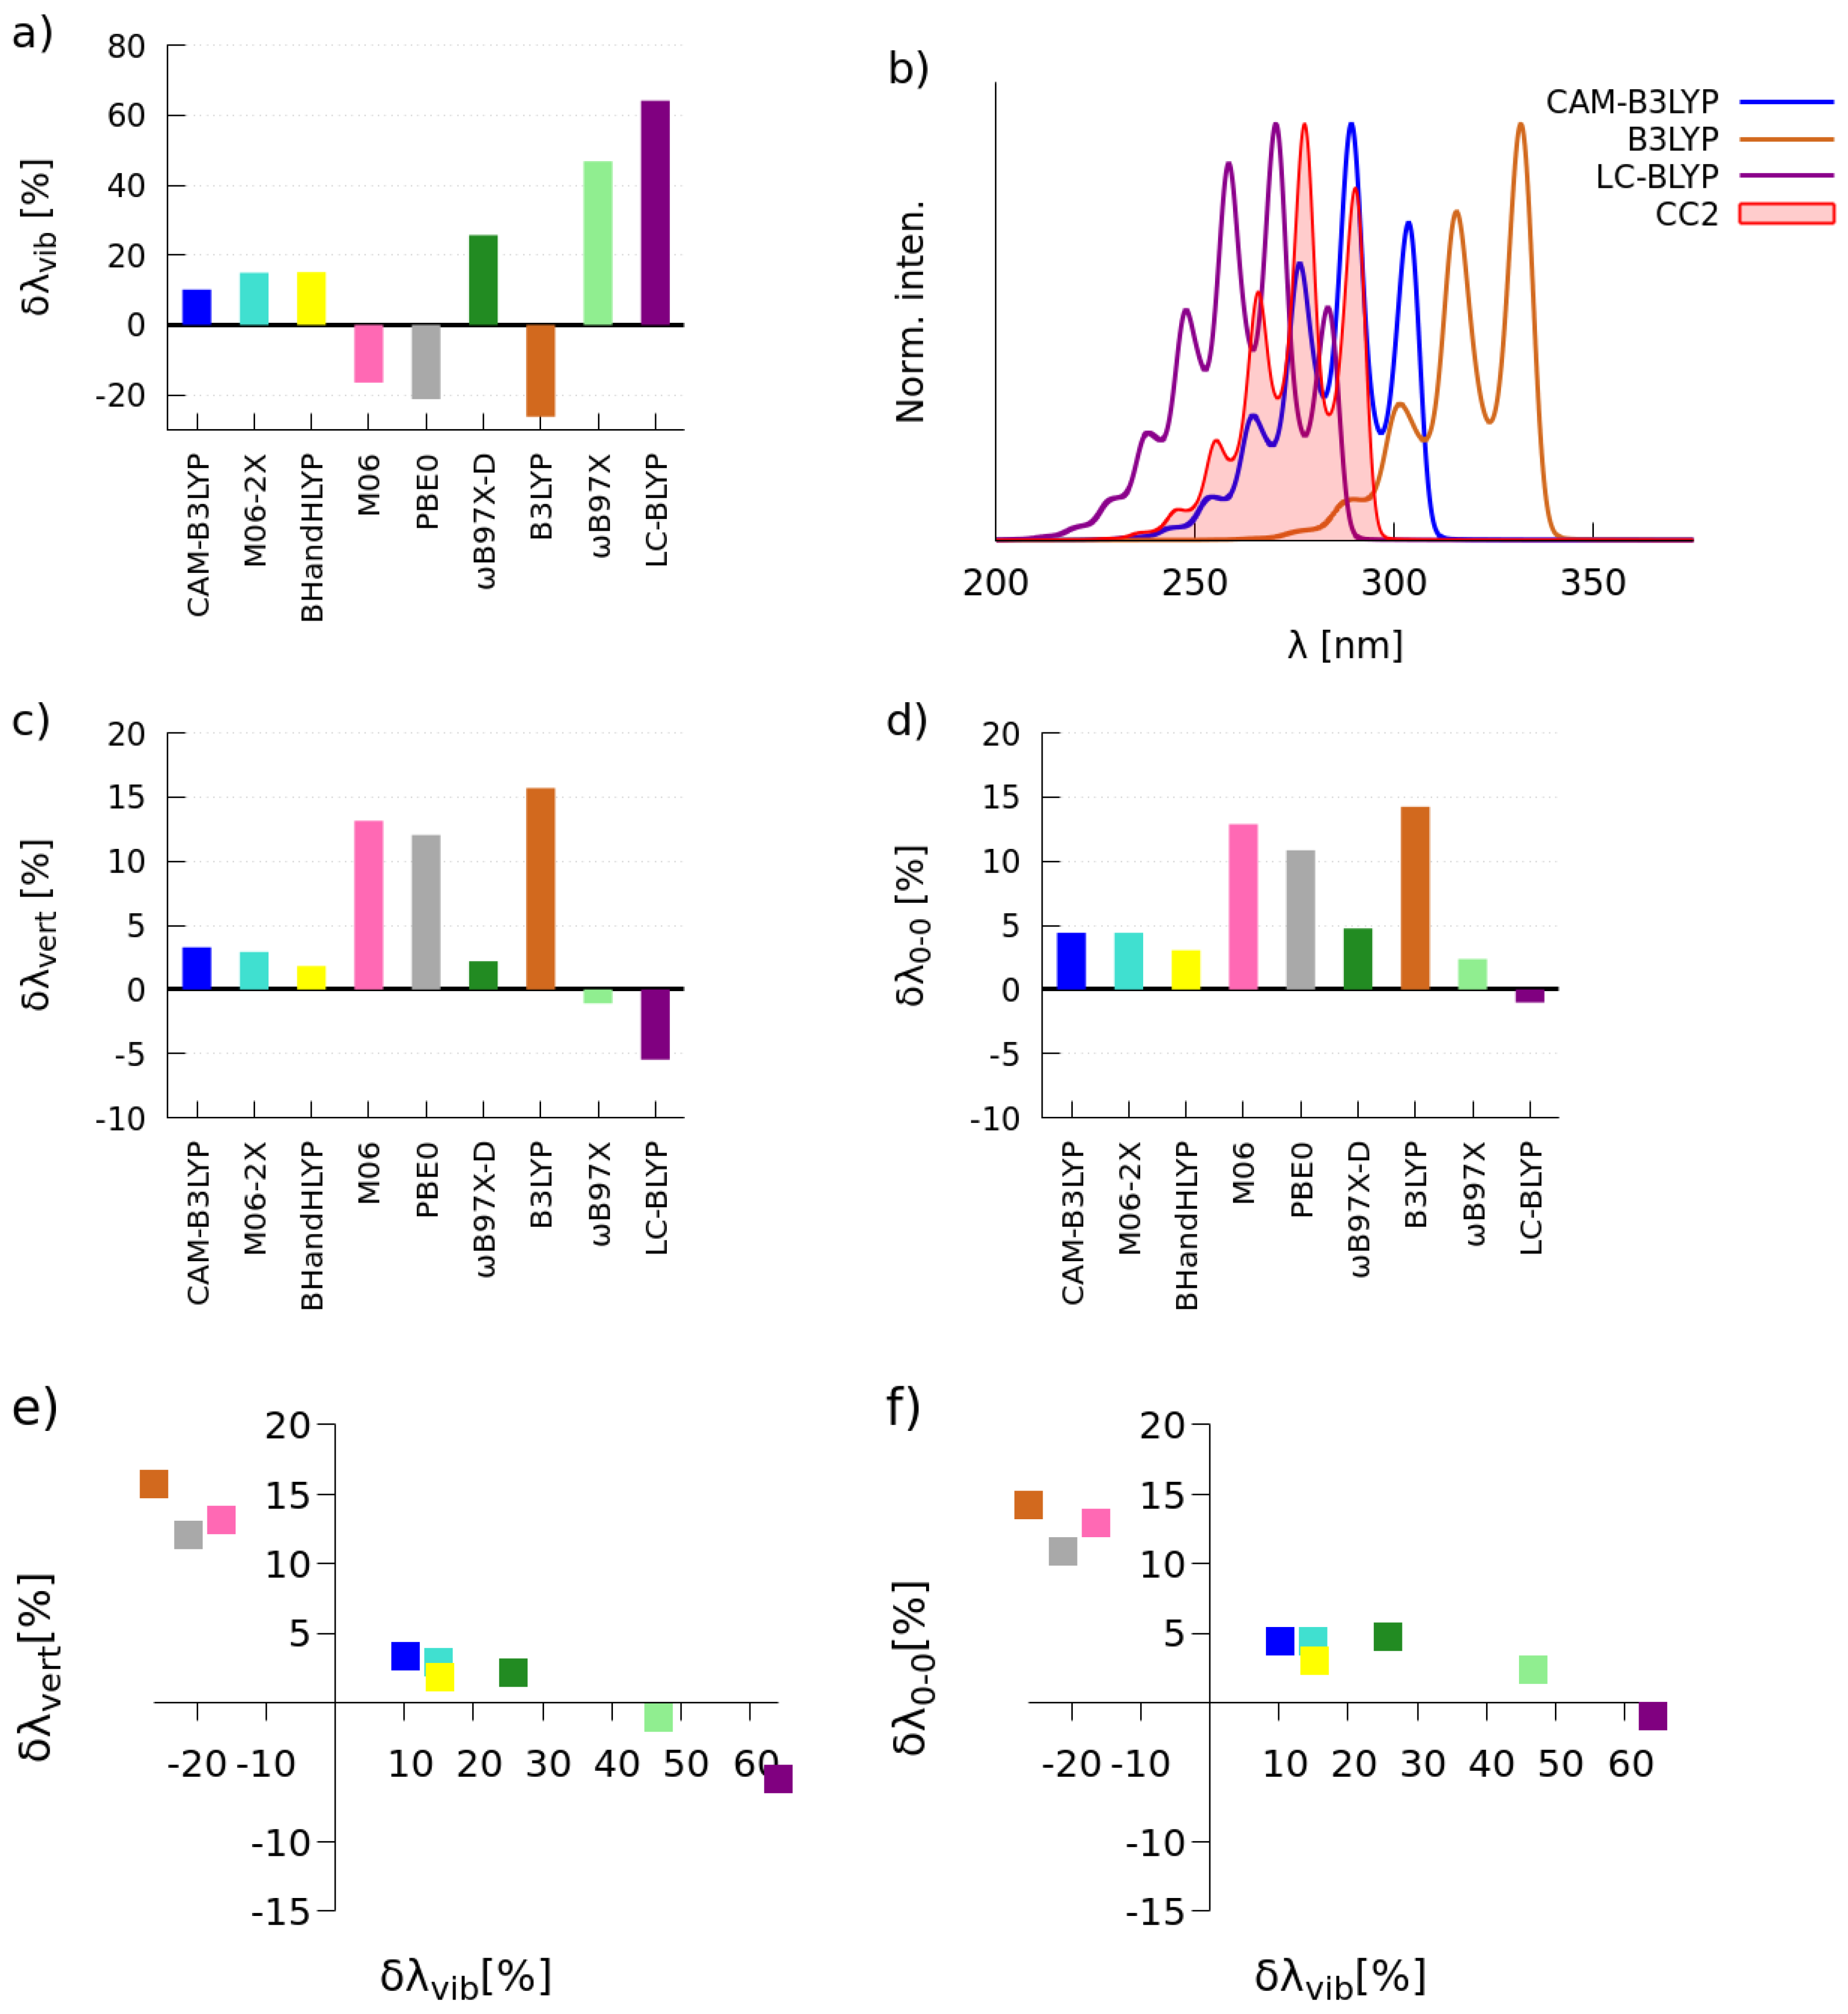
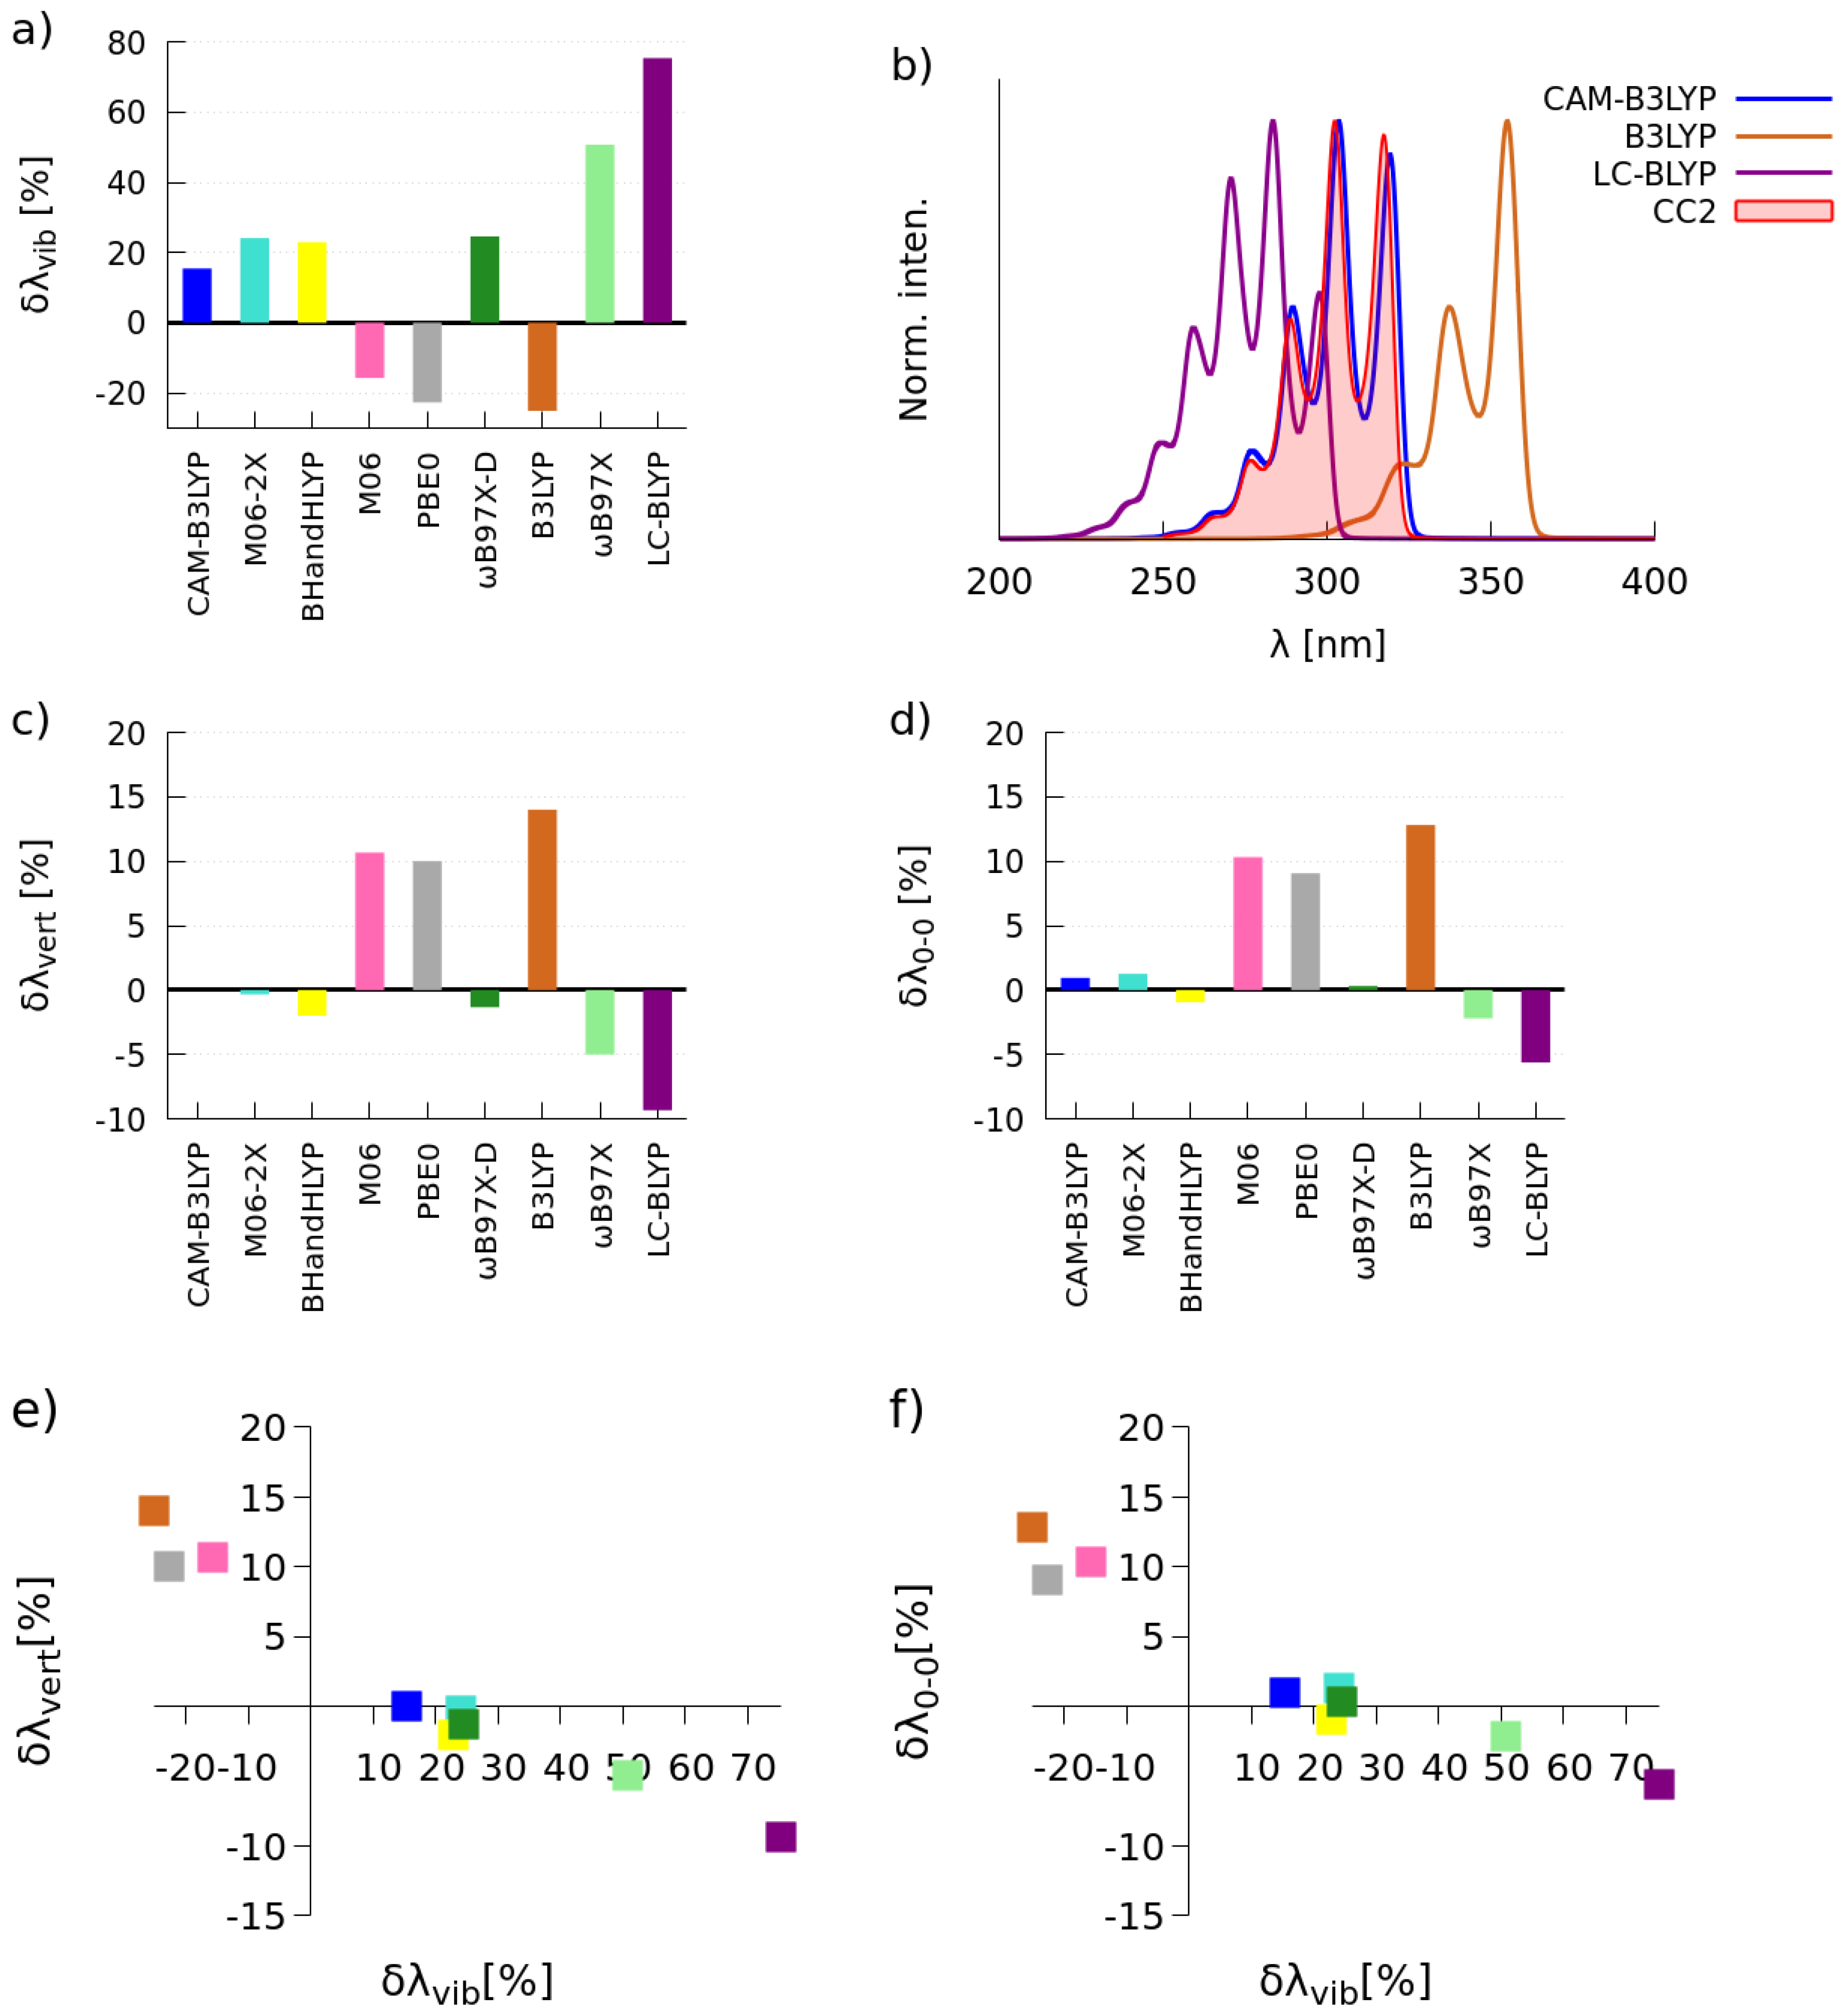
2.1. Selection of the Exchange-Correlation Functional
2.1.1. Simulations of One-Photon Absorption Spectra in Vacuo
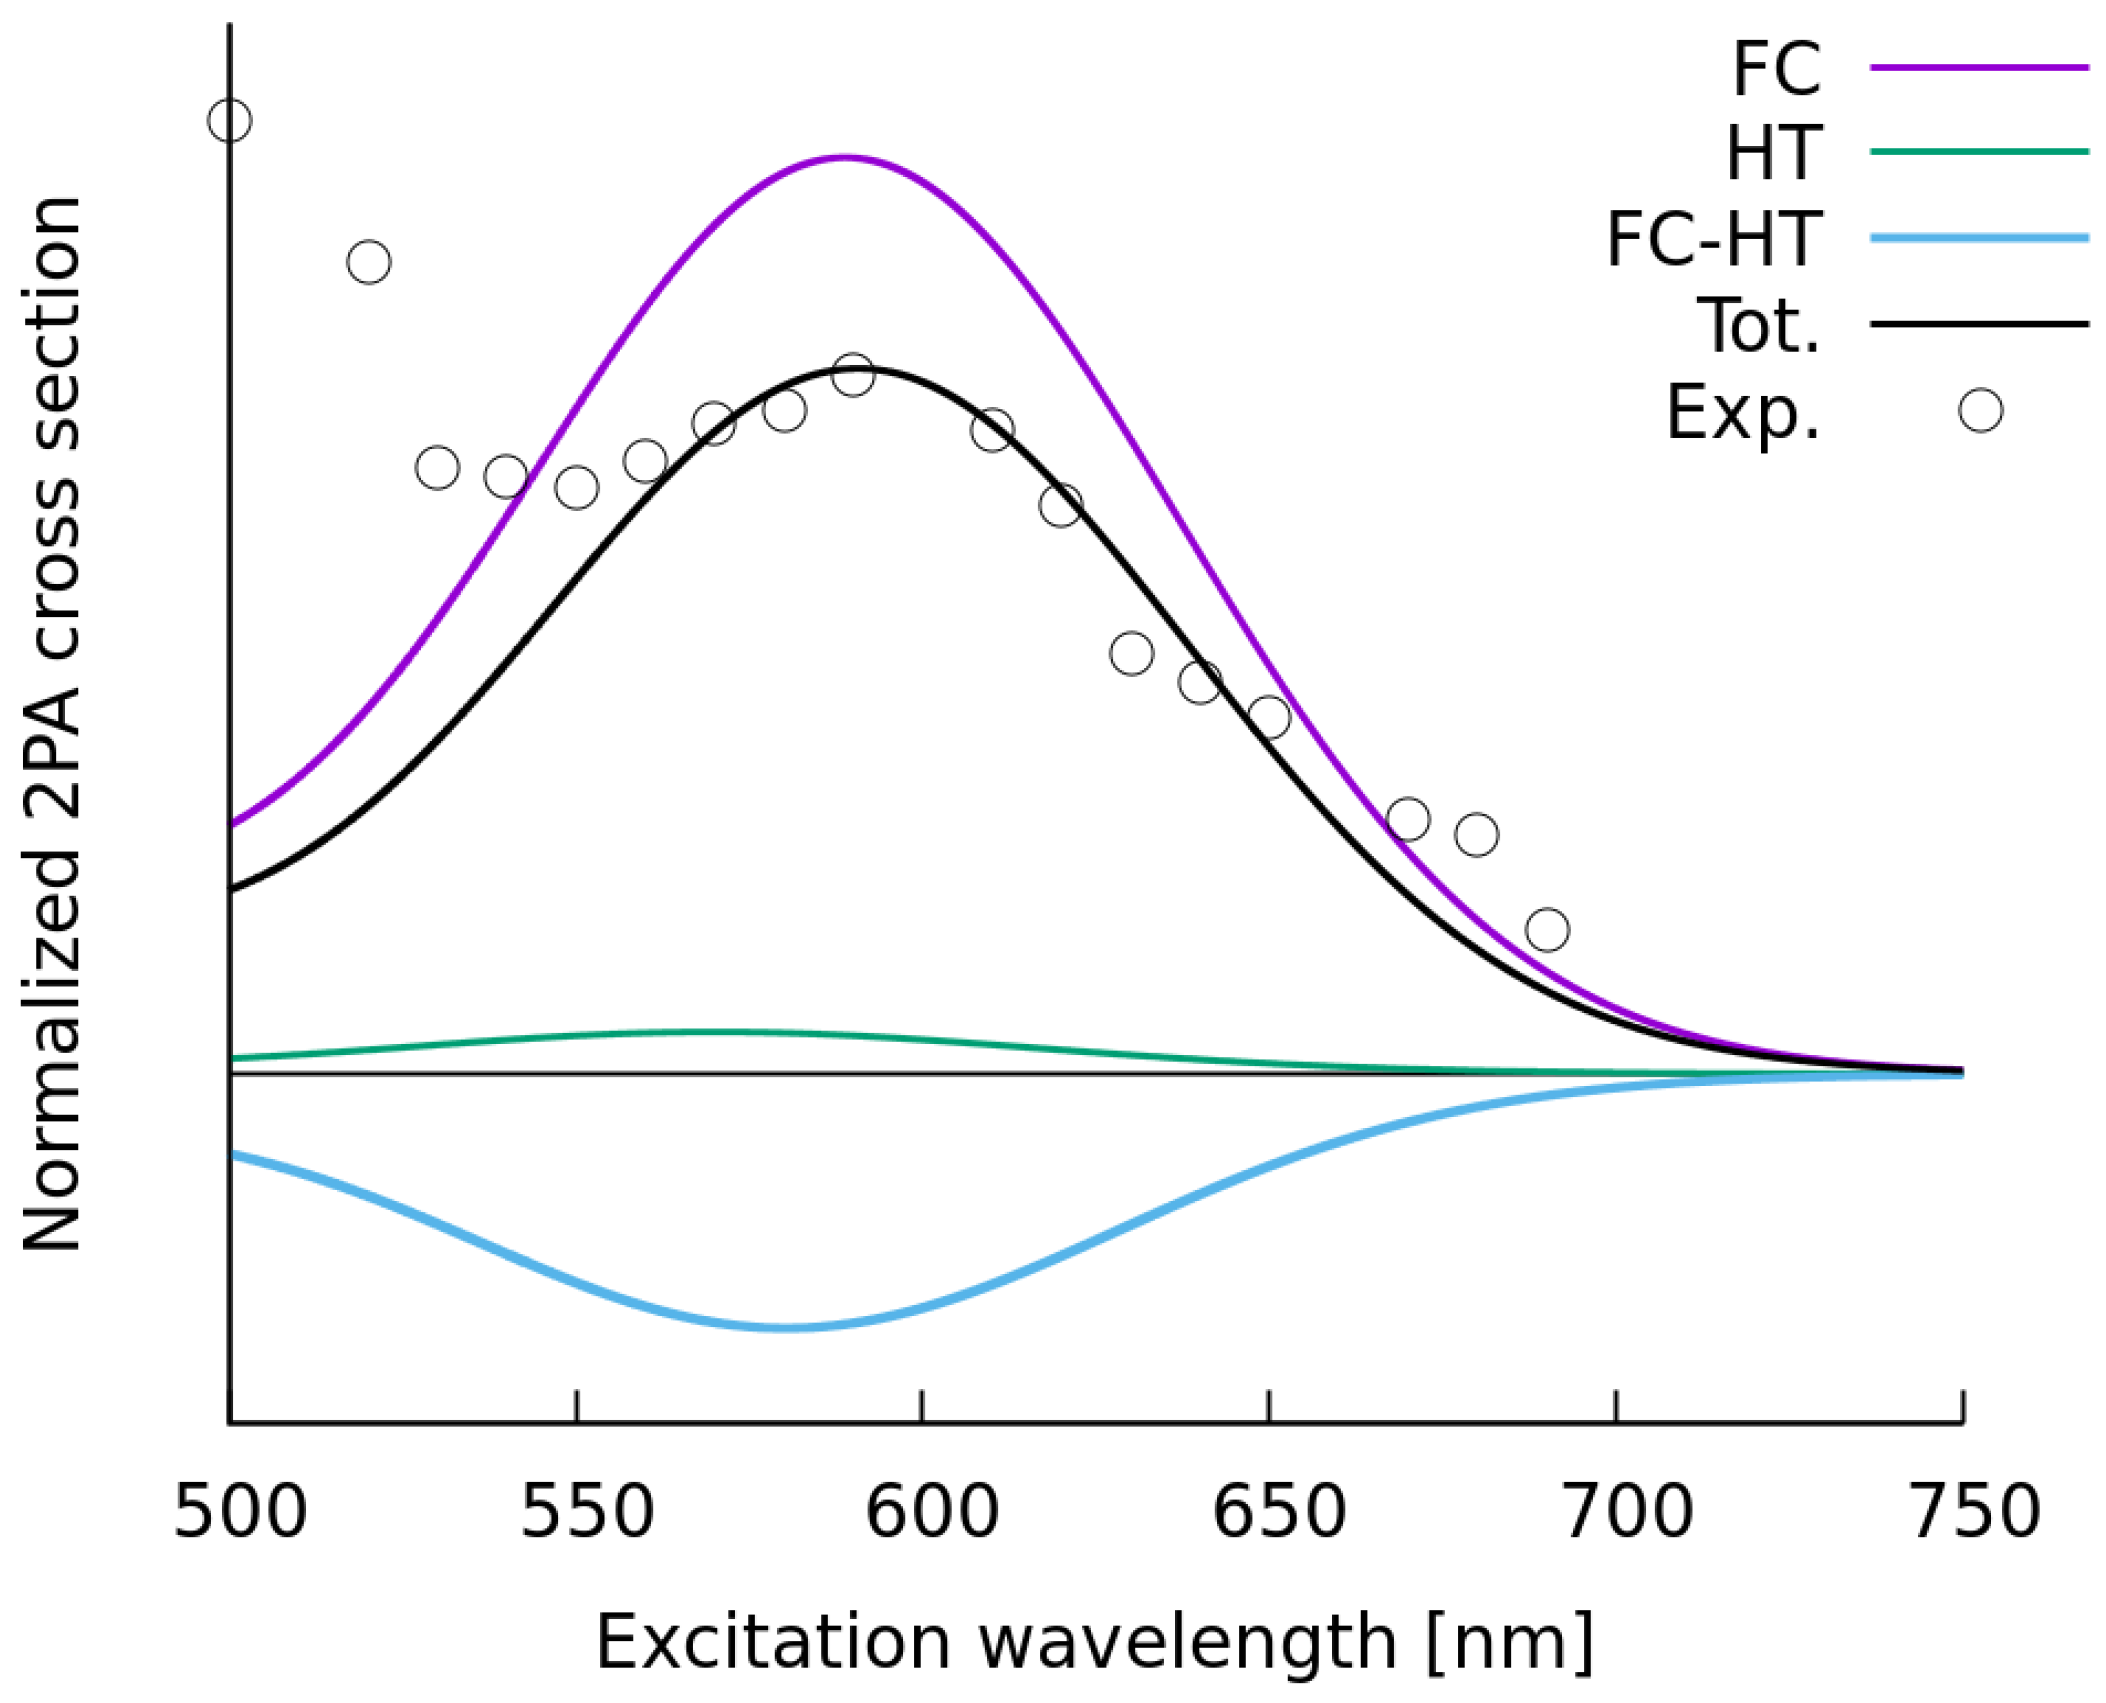
2.1.2. Simulations of Two-Photon Absorption Spectra In Vacuo
2.2. Simulations of the One- and Two-Photon Spectra Including Solvation Effects
3. Computational Details
3.1. Simulations of One-Photon Spectra
3.2. Simulations of Two-Photon Spectra
3.3. Solvation Effects
4. Conclusions
Acknowledgments
Author Contributions
Conflicts of Interest
Abbreviations
| TDDFT | Time-Dependent Density Functional Theory |
| 1PA | One-Photon Absorption |
| 2PA | Two-Photon Absorption |
| XCF | Exchange-Correlation Functional |
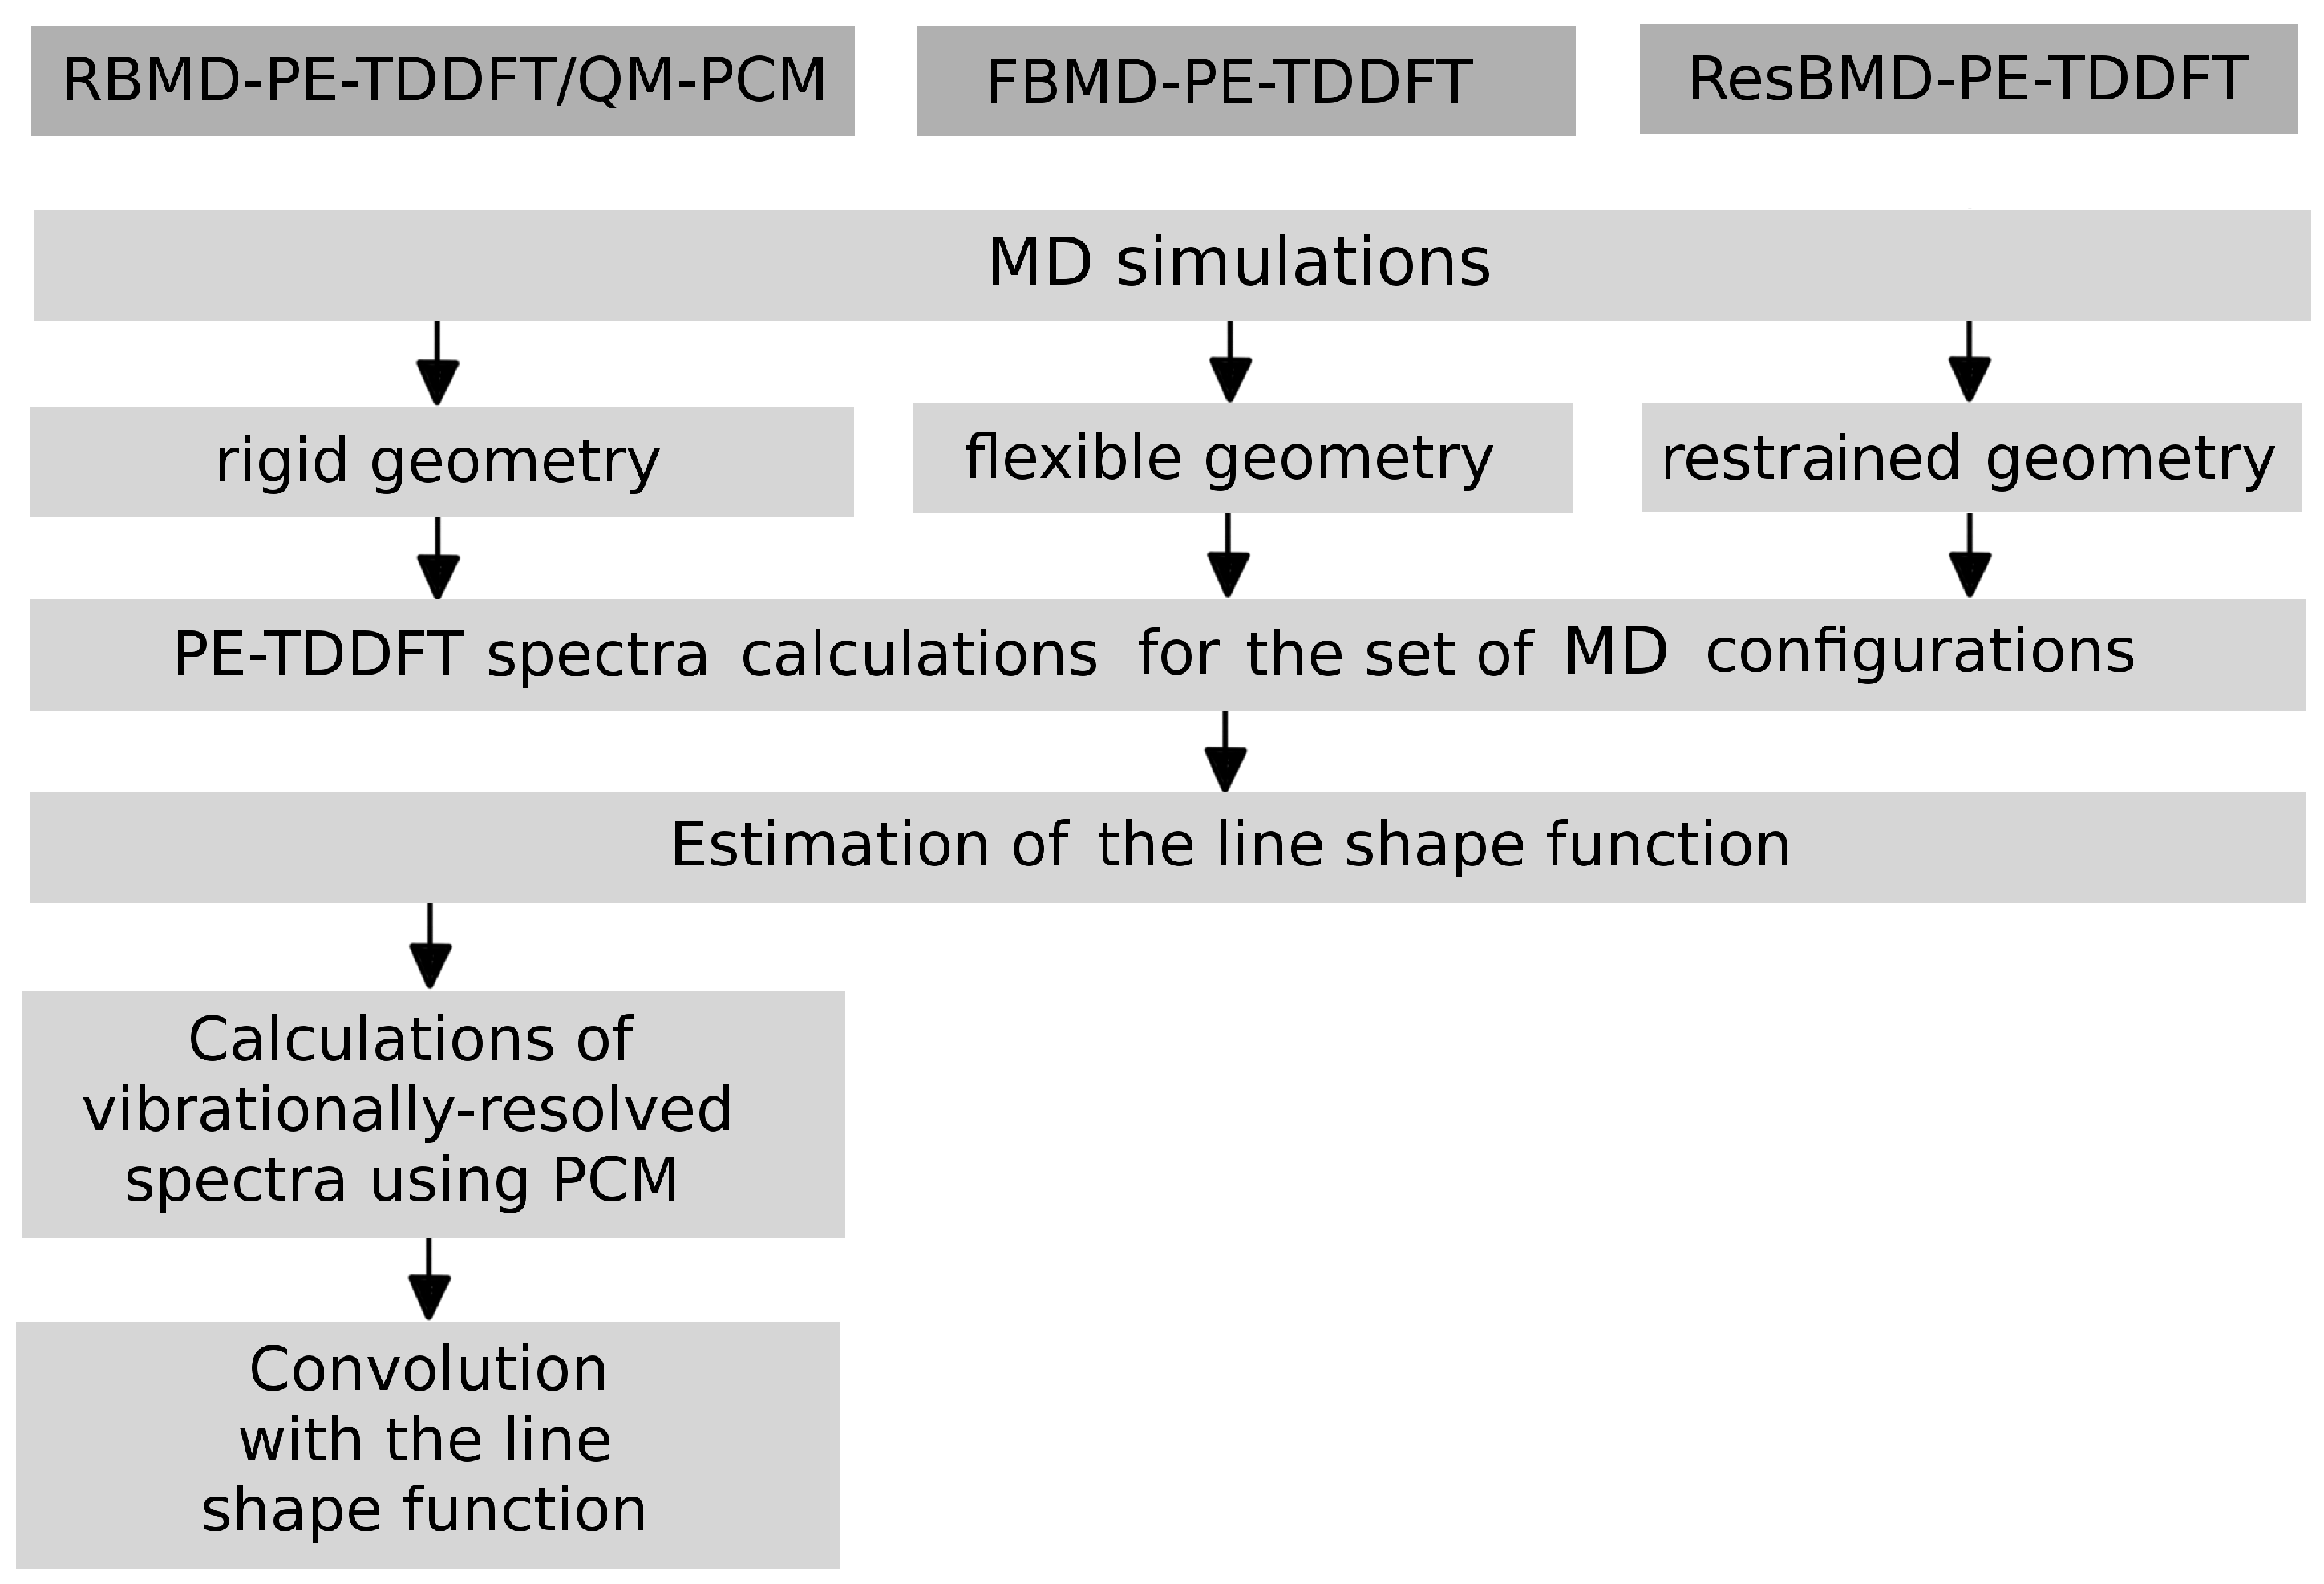
| PCM | Polarizable Continuum Model |
| RBMD | Rigid-Body Molecular Dynamics |
| ResBMD | Restrained-Body Molecular Dynamics |
| FBMD | Flexible-Body Molecular Dynamics |
| PE | Polarizable Embedding |
| RI | Resolution of Identity |
| QM | Quantum Mechanics |
| MM | Molecular Mechanics |
References
- Aquilante, F.; Boman, L.; Boström, J.; Koch, H.; Lindh, R.; Merás, A.; Pedersen, T. Cholesky decomposition techniques in electronic structure theory. In Linear-Scaling Techniques in Computational Chemistry and Physics; Zaleśny, R., Papadopoulos, M.G., Mezey, P.G., Leszczyński, J., Eds.; Challenges and advances in computational chemistry and physics; Springer: Dordrecht, The Netherlands, 2011; Volume 13, pp. 301–343. [Google Scholar]
- Korona, T.; Kats, D.; Schutz, M.; Adler, T.B.; Liu, Y.; Werner, H.J. Local approximations for an efficient and accurate treatment of electron correlation and electron excitations in molecules. In Linear-Scaling Techniques in Computational Chemistry and Physics; Zaleśny, R., Papadopoulos, M.G., Mezey, P.G., Leszczyński, J., Eds.; Challenges and advances in computational chemistry and physics; Springer: Dordrecht, The Netherlands, 2011; Volume 13, pp. 345–407. [Google Scholar]
- Nelson, T.; Fernandez-Alberti, S.; Roitberg, A.E.; Tretiak, S. Nonadiabatic excited-state molecular dynamics: modeling photophysics in organic conjugated materials. Acc. Chem. Res. 2014, 47, 1155–1164. [Google Scholar] [CrossRef] [PubMed]
- Hättig, C.; Weigend, F. CC2 excitation energy calculations on large molecules using the resolution of the identity approximation. J. Chem. Phys. 2000, 113, 5154–5161. [Google Scholar] [CrossRef]
- Tomasi, J.; Mennucci, B.; Cammi, R. Quantum mechanical continuum solvation models. Chem. Rev. 2005, 105, 2999–3094. [Google Scholar] [CrossRef] [PubMed]
- Caricato, M.; Mennucci, B.; Tomasi, J.; Ingrosso, F.; Cammi, R.; Corni, S.; Scalmani, G. Formation and relaxation of excited states in solution: a new time dependent polarizable continuum model based on time dependent density functional theory. J. Chem. Phys. 2006, 124, 124520. [Google Scholar] [CrossRef] [PubMed]
- Improta, R.; Barone, V.; Scalmani, G.; Frisch, M.J. A state-specific polarizable continuum model time dependent density functional theory method for excited state calculations in solution. J. Chem. Phys. 2006, 125, 054103. [Google Scholar] [CrossRef] [PubMed]
- Bartkowiak, W.; Lipiński, J. Solvent effect on the nonlinear optical properties of para-nitroaniline studied by Langevin dipoles-monte carlo (LD/MC) approach. Comput. Chem. 1998, 22, 31–37. [Google Scholar] [CrossRef]
- Nielsen, C.B.; Christiansen, O.; Mikkelsen, K.V.; Kongsted, J. Density functional self-consistent quantum mechanics/molecular mechanics theory for linear and nonlinear molecular properties: applications to solvated water and formaldehyde. J. Chem. Phys. 2007, 126, 154112–154118. [Google Scholar] [CrossRef] [PubMed]
- Olsen, J.M.; Aidas, K.; Kongsted, J. Excited states in solution through polarizable embedding. J. Chem. Theory Comput. 2010, 6, 3721–3734. [Google Scholar] [CrossRef]
- Schwabe, T.; Sneskov, K.; Haugaard Olsen, J.M.; Kongsted, J.; Christiansen, O.; Hattig, C. PERI-CC2: A polarizable embedded RI-CC2 method. J. Chem. Theory Comput. 2012, 8, 3274–3283. [Google Scholar] [CrossRef] [PubMed]
- Olsen, J.M.; Kongsted, J. Molecular properties through polarizable embedding. Adv. Quantum Chem. 2011, 61, 107–143. [Google Scholar]
- Marenich, A.V.; Cramer, C.J.; Truhlar, D.G.; Guido, C.A.; Mennucci, B.; Scalmani, G.; Frisch, M.J. Practical computation of electronic excitation in solution: vertical excitation model. Chem. Sci. 2011, 2, 2143–2161. [Google Scholar] [CrossRef]
- Adamovic, I.; Freitag, M.A.; Gordon, M.S. Density functional theory based effective fragment potential method. J. Chem. Phys. 2003, 118, 6725–6732. [Google Scholar] [CrossRef]
- Day, P.N.; Jensen, J.H.; Gordon, M.S.; Webb, S.P.; Stevens, W.J.; Krauss, M.; Garmer, D.; Basch, H.; Cohen, D. An effective fragment method for modeling solvent effects in quantum mechanical calculations. J. Chem. Phys. 1996, 105, 1968–1986. [Google Scholar] [CrossRef]
- Dierksen, M.; Grimme, S. The vibronic structure of electronic absorption spectra of large molecules: a time-dependent density functional study on the influence of exact Hartree-Fock exchange. J. Phys. Chem. A 2004, 108, 10225–10237. [Google Scholar] [CrossRef]
- Jacquemin, D.; Wathelet, V.; Perpéte, E.A.; Adamo, C. Extensive TDDFT benchmark: singlet-excited states of organic molecules. J. Chem. Theory Comput. 2009, 5, 2420–2435. [Google Scholar] [CrossRef] [PubMed]
- Jacquemin, D.; Perpéte, E.A.; Scuseria, G.E.; Ciofini, I.; Adamo, C. TDDFT performance for the visible absorption spectra of organic dyes: conventional versus long-range hybrids. J. Chem. Theory Comput. 2008, 4, 123–135. [Google Scholar] [CrossRef] [PubMed]
- Laurent, A.; Jacquemin, D. TDDFT benchmarks: a review. Int. J. Quantum Chem. 2013, 113, 2019–2039. [Google Scholar] [CrossRef]
- Charaf-Eddin, A.; Planchat, A.; Mennucci, B.; Adamo, C.; Jacquemin, D. Choosing a functional for computing absorption and fluorescence band shapes with TDDFT. J. Chem. Theory Comput. 2013, 9, 2749–2760. [Google Scholar] [CrossRef] [PubMed]
- Jacquemin, D.; Moore, B.; Planchat, A.; Adamo, C.; Autschbach, J. Performance of an optimally tuned range-separated hybrid functional for 0-0 electronic excitation energies. J. Chem. Theory Comput. 2014, 10, 1677–1685. [Google Scholar] [CrossRef] [PubMed]
- Adamo, C.; Jacquemin, D. The calculations of excited-state properties with time-dependent density functional theory. Chem. Soc. Rev. 2013, 42, 845–856. [Google Scholar] [CrossRef] [PubMed]
- Guennic, B.L.; Jacquemin, D. Taking up the cyanine challenge with quantum tools. Acc. Chem. Res. 2015, 48, 530–537. [Google Scholar] [CrossRef] [PubMed]
- Send, R.; Valsson, O.; Filippi, C. Electronic excitations of simple cyanine dyes: reconciling density functional and wave function methods. J. Chem. Theory Comput. 2011, 7, 444–455. [Google Scholar] [CrossRef] [PubMed]
- Momeni, M.R.; Brown, A. Why do TDDFT excitation energies of BODIPY/aza-BODIPY families largely deviate from experiment? Answers from electron correlated and multireference methods. J. Chem. Theory Comput. 2015, 11, 2619–2632. [Google Scholar] [CrossRef] [PubMed]
- Dierksen, M.; Grimme, S. Density functional calculations of the vibronic structure of electronic absorption spectra. J. Chem. Phys. 2004, 120, 3544. [Google Scholar] [CrossRef] [PubMed]
- Petrenko, T.; Neese, F. Analysis and prediction of absorption band shapes, fluorescence band shapes, resonance Raman intensities, and excitation profiles using the time-dependent theory of electronic spectroscopy. J. Chem. Phys. 2007, 127, 164319. [Google Scholar] [CrossRef] [PubMed]
- Petrenko, T.; Neese, F. Efficient and automatic calculation of optical band shapes and resonance Raman spectra for larger molecules within the independent mode displaced harmonic oscillator model. J. Chem. Phys. 2012, 137, 234107. [Google Scholar] [CrossRef] [PubMed]
- Santoro, F.; Improta, R.; Lami, A.; Bloino, J.; Barone, V. Effective method to compute Franck-Condon integrals for optical spectra of large molecules in solution. J. Chem. Phys. 2007, 126, 084509. [Google Scholar] [CrossRef] [PubMed]
- Santoro, F.; Cappelli, C.; Barone, V. Effective time-independent calculations of vibrational resonance Raman spectra of isolated and solvated molecules including Duschinsky and Herzberg-Teller effects. J. Chem. Theory Comput. 2011, 7, 1824–1839. [Google Scholar] [CrossRef] [PubMed]
- Baiardi, A.; Bloino, J.; Barone, V. General time dependent approach to vibronic spectroscopy including Franck-Condon, Herzberg-Teller, and Duschinsky effects. J. Chem. Theory Comput. 2013, 9, 4097–4115. [Google Scholar] [CrossRef] [PubMed]
- Muniz-Miranda, F.; Pedone, A.; Battistelli, G.; Montalti, M.; Bloino, J.; Barone, V. Benchmarking TDDFT against vibrationally resolved absorption spectra at room temperature: 7-aminocoumarins as test cases. J. Chem. Theory Comput. 2015, 11, 5371–5384. [Google Scholar] [CrossRef] [PubMed]
- Ferrer, F.J.A.; Santoro, F. Comparison of vertical and adiabatic harmonic approaches for the calculation of the vibrational structure of electronic spectra. Phys. Chem. Chem. Phys. 2012, 14, 13549–13563. [Google Scholar] [CrossRef] [PubMed]
- Kamarchik, E.; Krylov, A.I. Non-Condon effects in the one- and two-photon absorption spectra of the green fluorescent protein. J. Phys. Chem. Lett. 2011, 2, 488–492. [Google Scholar] [CrossRef]
- Silverstein, D.W.; Jensen, L. Vibronic coupling simulations for linear and nonlinear optical processes: Theory. J. Chem. Phys. 2012, 136, 064111. [Google Scholar] [CrossRef] [PubMed]
- Silverstein, D.W.; Jensen, L. Vibronic coupling simulations for linear and nonlinear optical processes: simulation results. J. Chem. Phys. 2012, 136, 064110. [Google Scholar] [CrossRef] [PubMed]
- Mitri, N.D.; Monti, S.; Prampolini, G.; Barone, V. Absorption and emission spectra of a flexible dye in solution: a computational time-dependent approach. J. Chem. Theory Comput. 2013, 9, 4507–4516. [Google Scholar] [CrossRef] [PubMed]
- Ferrer, F.J.A.; Improta, R.; Santoro, F.; Barone, V. Computing the inhomogeneous broadening of electronic transitions in solution: A first-principle quantum mechanical approach. Phys. Chem. Chem. Phys. 2011, 13, 17007–17012. [Google Scholar] [CrossRef] [PubMed]
- Ferrer, F.J.A.; Cerezo, J.; Soto, J.; Improta, R.; Santoro, F. First-principle computation of absorption and fluorescence spectra in solution accounting for vibronic structure, temperature effects and solvent inhomogenous broadening. Comput. Theor. Chem. 2014, 1040–1041, 328–337. [Google Scholar] [CrossRef]
- Silva, D.L.; Murugan, N.A.; Kongsted, J.; Rinkevicius, Z.; Canuto, S.; Ågren, H. The role of molecular conformation and polarizable embedding for one- and two-photon absorption of disperse orange 3 in solution. J. Phys. Chem. B 2012, 116, 8169–8181. [Google Scholar] [CrossRef] [PubMed]
- Murugan, N.A.; Zaleśny, R.; Kongsted, J.; Ågren, H. Chelation-induced quenching of two-photon absorption of azacrown ether substituted distyryl benzene for metal ion sensing. J. Chem. Theory Comput. 2014, 10, 778–788. [Google Scholar] [CrossRef] [PubMed]
- Zaleśny, R.; Murugan, N.A.; Gel’mukhanov, F.; Rinkevicius, Z.; Ośmiałowski, B.; Bartkowiak, W.; Ågren, H. Towards fully nonempirical simulations of optical band shapes of molecules in solution: a case study of heterocyclic ketoimine difluoroborates. J. Phys. Chem. A 2015, 119, 5145–5152. [Google Scholar] [CrossRef] [PubMed]
- Zaleśny, R.; Murugan, N.A.; Tian, G.; Medveď, M.; Ågren, H. First-principles simulations of one- and two-photon absorption band shapes of the bis(BF2) core complex. J. Phys. Chem. B 2016, 120, 2323–2332. [Google Scholar] [CrossRef] [PubMed]
- Abegão, L.M.; Fonseca, R.D.; Santos, F.A.; Souza, G.B.; Barreiros, A.L.B.; Barreiros, M.L.; Alencar, M.; Mendonc̨a, C.R.; Silva, D.L.; Boni, L.D.; et al. Second- and third-order nonlinear optical properties of unsubstituted and mono-substituted chalcones. Chem. Phys. Lett. 2016, 648, 91–96. [Google Scholar] [CrossRef]
- Jacquemin, D.; Adamo, C. Computational molecular electronic spectroscopy with TDDFT. In Density-Functional Methods for Excited States; Ferré, N., Filatov, M., Huix-Rotllant, M., Eds.; Springer: Cham, Switzerland, 2016; pp. 347–375. [Google Scholar]
- Bednarska, J.; Zaleśny, R.; Bartkowiak, W.; Ośmiałowski, B.; Medved’, M.; Jacquemin, D. Quantifying the performances of dft for predicting vibrationally resolved optical spectra: asymmetric fluoroborate dyes as working examples. J. Chem. Theory Comput. 2017, 13, 4347–4356. [Google Scholar] [CrossRef] [PubMed]
- Becke, A.D. Density-functional thermochemistry. III. The role of exact exchange. J. Chem. Phys. 1993, 98, 5648–5652. [Google Scholar] [CrossRef]
- Adamo, C.; Barone, V. Toward reliable density functional methods without adjustable parameters: The PBE0 model. J. Chem. Phys. 1999, 110, 6158–6170. [Google Scholar] [CrossRef]
- Ernzerhof, M.; Scuseria, G.E. Assessment of the Perdew-Burke-Ernzerhof exchange-correlation functional. J. Chem. Phys. 1999, 110, 5029–5036. [Google Scholar] [CrossRef]
- Zhao, Y.; Truhlar, D.G. The M06 suite of density functionals for main group thermochemistry, thermochemical kinetics, noncovalent interactions, excited states, and transition elements: two new functionals and systematic testing of four M06-class functionals and 12 other functionals. Theor. Chem. Acc. 2008, 120, 215–241. [Google Scholar]
- Becke, A.D. A new mixing of Hartree-Fock and local density-functional theories. J. Chem. Phys. 1993, 98, 1372–1377. [Google Scholar] [CrossRef]
- Yanai, T.; Tew, D.P.; Handy, N.C. A new hybrid exchange-correlation functional using the Coulomb-attenuating method (CAM-B3LYP). Chem. Phys. Lett. 2004, 393, 51–57. [Google Scholar] [CrossRef]
- Chai, J.D.; Head-Gordon, M. Systematic optimization of long-range corrected hybrid density functionals. J. Chem. Phys. 2008, 128, 084106. [Google Scholar] [CrossRef] [PubMed]
- Chai, J.D.; Head-Gordon, M. Long-range corrected hybrid density functionals with damped atom-atom dispersion corrections. Phys. Chem. Chem. Phys. 2008, 10, 6615–6620. [Google Scholar] [CrossRef] [PubMed]
- Iikura, H.; Tsuneda, T.; Yanai, T.; Hirao, K. A long-range correction scheme for generalized-gradient-approximation exchange functionals. J. Chem. Phys. 2001, 115, 3540–3544. [Google Scholar] [CrossRef]
- Beerepoot, M.T.P.; Friese, D.H.; List, N.H.; Kongsted, J.; Ruud, K. Benchmarking two-photon absorption cross sections: performance of CC2 and CAM-B3LYP. Phys. Chem. Chem. Phys. 2015, 17, 19306–19314. [Google Scholar] [CrossRef] [PubMed]
- Bednarska, J.; Roztoczyńska, A.; Bartkowiak, W.; Zaleśny, R. Comparative assessment of density functionals for excited-state dipole moments. Chem. Phys. Lett. 2013, 584, 58–62. [Google Scholar] [CrossRef]
- Luo, Y.; Ågren, H.; Knuts, S.; Minaev, B.; Jørgensen, P. Response theory calculations of the vibrationally induced 1A1g-1B1u two-photon spectrum of benzene. Chem. Phys. Lett. 1993, 209, 513–518. [Google Scholar] [CrossRef]
- Zaleśny, R.; Tian, G.; Hättig, C.; Bartkowiak, W.; Ågren, H. Toward assessment of density functionals for vibronic coupling in two-photon absorption: A case study of 4-nitroaniline. J. Comput. Chem. 2015, 36, 1124–1131. [Google Scholar] [CrossRef] [PubMed]
- Ai, Y.; Tian, G.; Luo, Y. Role of non-Condon vibronic coupling and conformation change on two-photon absorption spectra of green fluorescent protein. Mol. Phys. 2013, 111, 1316–1321. [Google Scholar] [CrossRef]
- Lin, N.; Luo, Y.; Ruud, K.; Zhao, X.; Santoro, F.; Rizzo, A. Differences in two-photon and one-photon absorption profiles induced by vibronic coupling: The case of dioxaborine heterocyclic dye. ChemPhysChem 2011, 12, 3392–3403. [Google Scholar] [CrossRef] [PubMed]
- Macak, P.; Luo, Y.; Ågren, H. Simulations of vibronic profiles in two-photon absorption. Chem. Phys. Lett. 2000, 330, 447–456. [Google Scholar] [CrossRef]
- Frisch, M.J.; Trucks, G.W.; Schlegel, H.B.; Scuseria, G.E.; Robb, M.A.; Cheeseman, J.R.; Scalmani, G.; Barone, V.; Mennucci, B.; Petersson, G.A.; et al. Gaussian 2009; Gaussian Inc.: Wallingford, CT, USA, 2009. [Google Scholar]
- TURBOMOLE V7.0 2015, a Development of University of Karlsruhe and Forschungszentrum Karlsruhe GmbH, 1989–2007, TURBOMOLE GmbH, Since 2007. Available online: http://www.turbomole.com (accessed on 1 April 2017).
- Macak, P.; Luo, Y.; Norman, P.; Ågren, H. Electronic and vibronic contributions to two-photon absorption of molecules with multi-branched structures. J. Chem. Phys. 2000, 113, 7055–7061. [Google Scholar] [CrossRef]
- Neese, F. The ORCA program system. WIREs Comput. Mol. Sci. 2012, 2, 73–78. [Google Scholar] [CrossRef]
- Sałek, P.; Vahtras, O.; Guo, J.; Luo, Y.; Helgaker, T.; Ågren, H. Calculations of two-photon absorption cross sections by means of density-functional theory. Chem. Phys. Lett. 2003, 374, 446–452. [Google Scholar] [CrossRef]
- Friese, D.H.; Hattig, C.; Ruud, K. Calculation of two-photon absorption strengths with the approximate coupled cluster singles and doubles model CC2 using the resolution-of-identity approximation. Phys. Chem. Chem. Phys. 2012, 14, 1175–1184. [Google Scholar] [CrossRef] [PubMed]
- Monson, P.R.; McClain, W.M. Polarization dependence of the two-photon absorption of tumbling molecules with application to liquid 1-chloronaphtalene and benzene. J. Chem. Phys. 1970, 53, 29–37. [Google Scholar] [CrossRef]
- McClain, W.M. Excited state symmetry assignment through polarized two-photon absorption studies of fluids. J. Chem. Phys. 1971, 55, 2789–2796. [Google Scholar] [CrossRef]
- Medveď, M.; Stachová, M.; Jacquemin, D.; André, J.M.; Perpète, E.A. A generalized Romberg differentiation procedure for calculation of hyperpolarizabilities. J. Mol. Struct. THEOCHEM 2007, 847, 39–46. [Google Scholar] [CrossRef]
- Tian, G.; Duan, S.; Hua, W.; Luo, Y. DynaVib; Royal Institute of Technology: Stockholm, Sweden, 2012. [Google Scholar]
- Case, D.; Babin, V.; Berryman, J.; Betz, R.; Cai, Q.; Cerutti, D.; Cheatham, T.E., III; Darden, T.; Duke, R.; Gohlke, H.; et al. AMBER 14; University of California: San Francisco, CA, USA, 2014. [Google Scholar]
- Breneman, C.M.; Wiberg, K.B. Determining atom-centered monopoles from molecular electrostatic potentials. the need for high sampling density in formamide conformational analysis. J. Comput. Chem. 1990, 11, 361–373. [Google Scholar] [CrossRef]
- DALTON, A Molecular Electronic Structure Program, Release Dalton 2013. Available online: http://daltonprogram.org/ (accessed on 1 April 2017).
Sample Availability: Samples of the compounds are not available from the authors. |


| S S | S S | |||||
|---|---|---|---|---|---|---|
| (eV) | (au) | (au) | (eV) | (au) | (au) | |
| C-1 | ||||||
| BLYP | 2.68 | 6 | 8 | 3.49 | 108 | 2.7 × 10 |
| PBE | 2.64 | 5 | 6 | 3.51 | 107 | 2.6 × 10 |
| PBE0 | 3.30 | 9 | 14 | 4.01 | 111 | 2.7 × 10 |
| B3LYP | 3.23 | 9 | 17 | 3.90 | 114 | 2.8 × 10 |
| CAM-B3LYP | 3.57 | 7 | 11 | 4.28 | 93 | 1.8 × 10 |
| BHandHLYP | 3.84 | 11 | 22 | 4.32 | 89 | 1.7 × 10 |
| CC2 | 3.43 | 6 | 6 | 4.47 | 137 | 4.0 × 10 |
| C-2 | ||||||
| BLYP | 2.73 | 10 | 18 | 3.14 | 286 | 16.8 × 10 |
| PBE | 2.70 | 9 | 14 | 3.15 | 289 | 17.2 × 10 |
| PBE0 | 3.34 | 12 | 27 | 3.72 | 221 | 10.2 × 10 |
| B3LYP | 3.27 | 13 | 32 | 3.61 | 230 | 11.0 × 10 |
| CAM-B3LYP | 3.60 | 9 | 17 | 4.04 | 171 | 6.1 × 10 |
| BHandHLYP | 3.88 | 15 | 48 | 4.10 | 161 | 5.4 × 10 |
| CC2 | 3.45 | 9 | 17 | 4.07 | 270 | 15.5 × 10 |
| B3LYP | CAM-B3LYP | CC2 | ||||
|---|---|---|---|---|---|---|
| 2342 | 2 | <1 | 252 | 1 | <1 | 356 |
| C-1 | C-2 | |||
|---|---|---|---|---|
| (eV) | (eV) | (eV) | (eV) | |
| PE-TDDFT | ||||
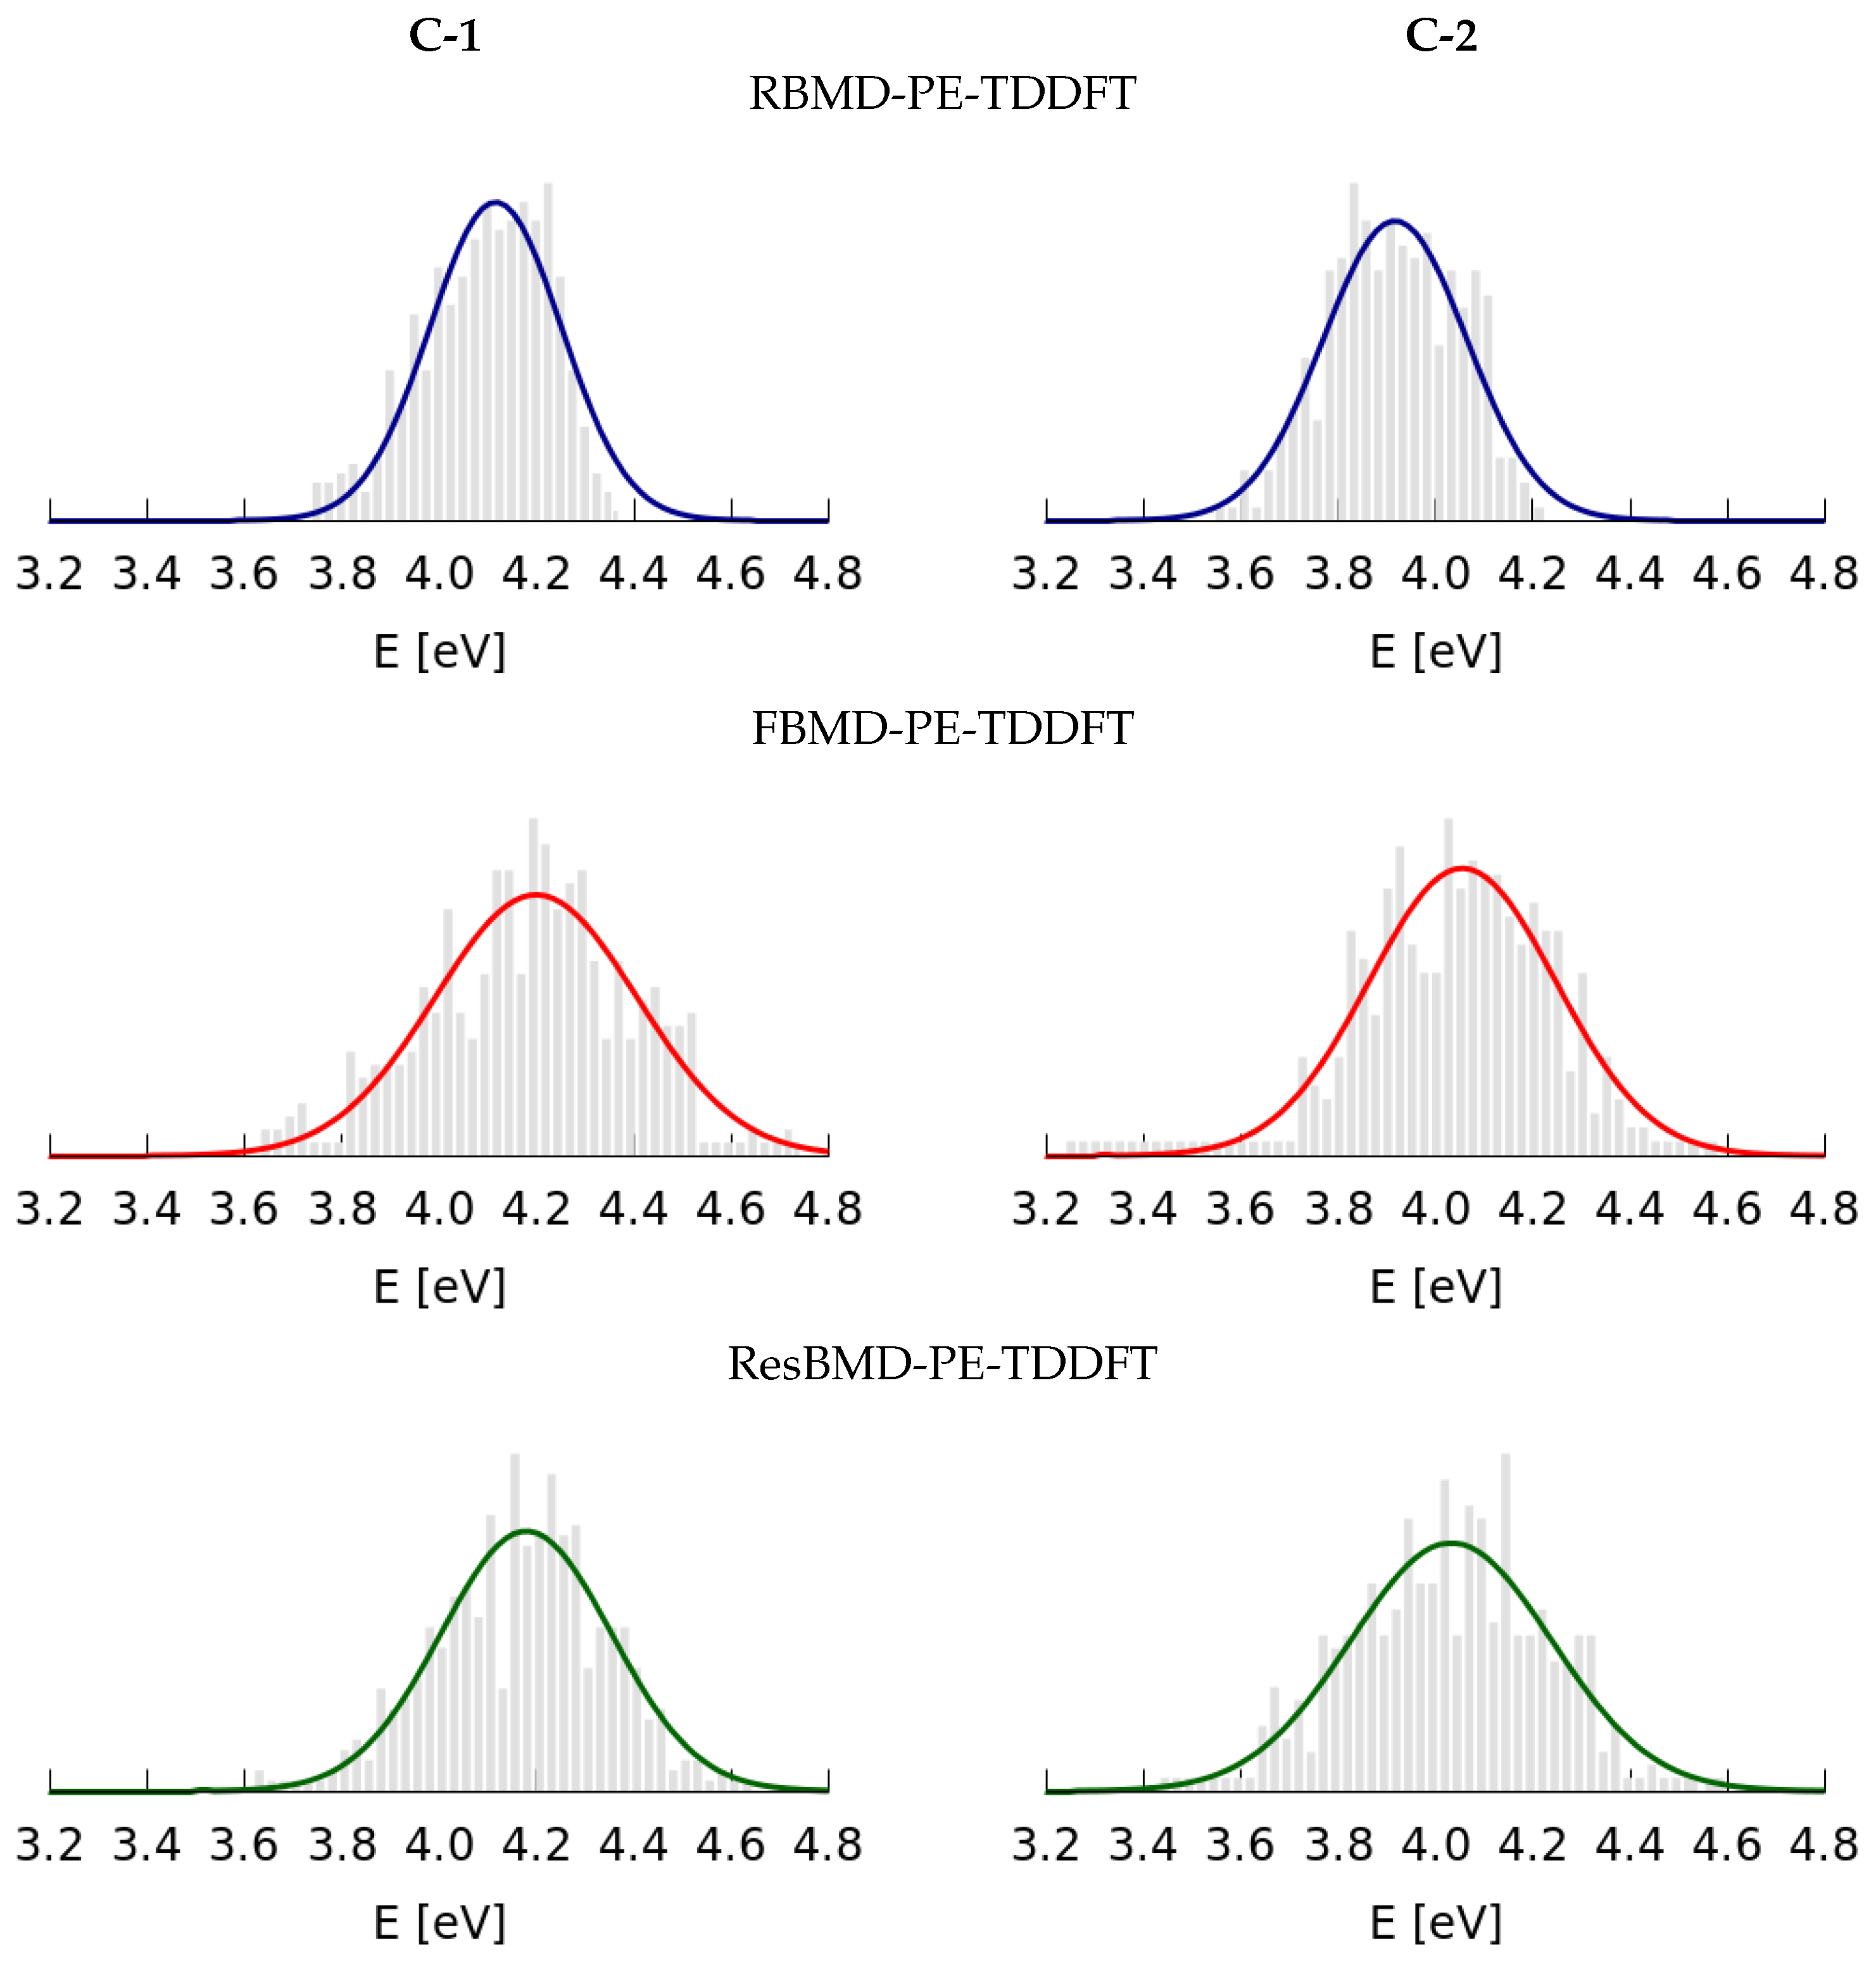
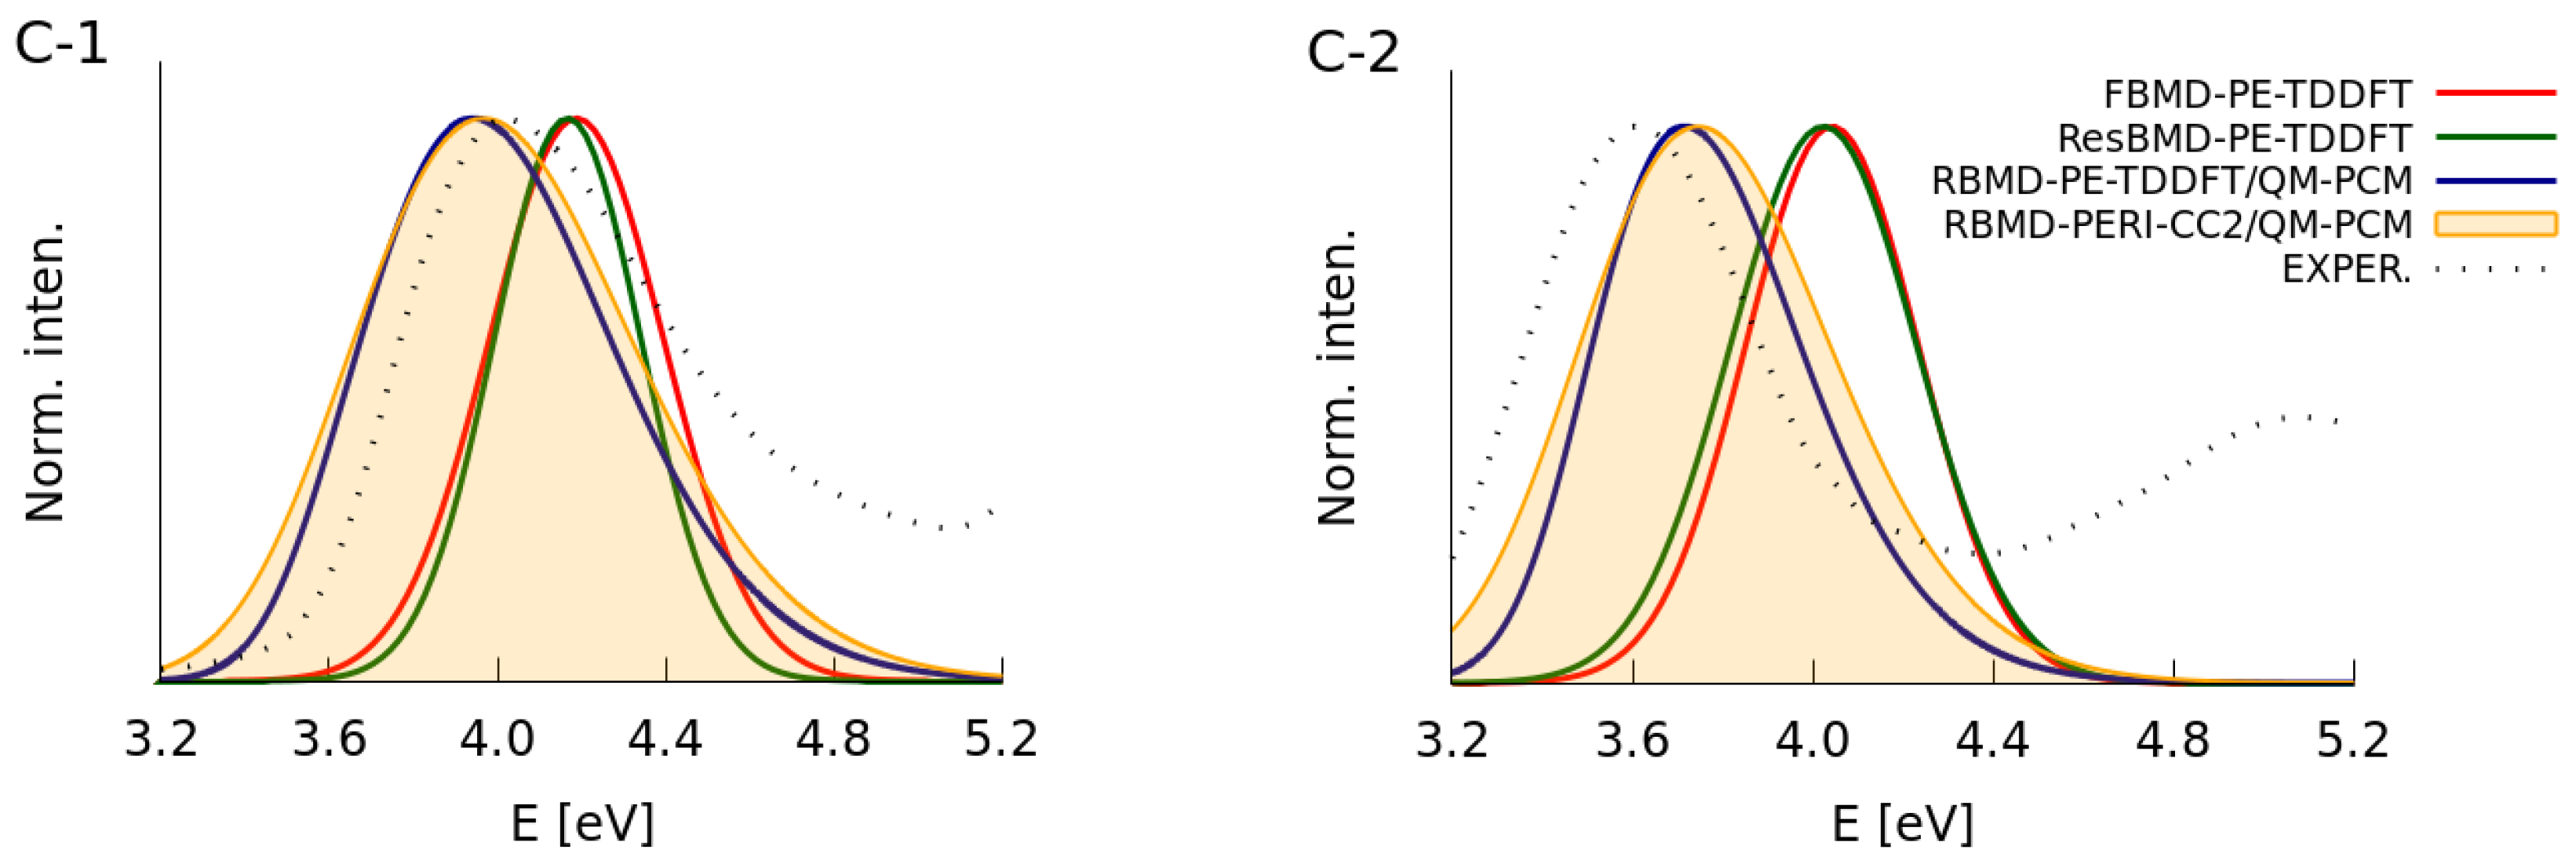
| RBMD | 4.09 | 0.13 | 3.91 | 0.15 |
| FBMD | 4.19 | 0.21 | 4.04 | 0.19 |
| ResBMD | 4.17 | 0.18 | 4.02 | 0.21 |
| PERI-CC2 | ||||
| RBMD | 4.21 | 0.20 | 3.91 | 0.21 |
| PE-TDDFT/QM-PCM | ||||
| RBMD | 3.94 | 0.30 | 3.72 | 0.23 |
| PERI-CC2/QM-PCM | ||||
| RBMD | 3.94 | 0.33 | 3.72 | 0.28 |
| Experimental Data | ||||
| 4.02 | 0.34 | 3.60 | 0.26 | |
© 2017 by the authors. Licensee MDPI, Basel, Switzerland. This article is an open access article distributed under the terms and conditions of the Creative Commons Attribution (CC BY) license (http://creativecommons.org/licenses/by/4.0/).
Share and Cite
Bednarska, J.; Zaleśny, R.; Tian, G.; Murugan, N.A.; Ågren, H.; Bartkowiak, W. Nonempirical Simulations of Inhomogeneous Broadening of Electronic Transitions in Solution: Predicting Band Shapes in One- and Two-Photon Absorption Spectra of Chalcones. Molecules 2017, 22, 1643. https://doi.org/10.3390/molecules22101643
Bednarska J, Zaleśny R, Tian G, Murugan NA, Ågren H, Bartkowiak W. Nonempirical Simulations of Inhomogeneous Broadening of Electronic Transitions in Solution: Predicting Band Shapes in One- and Two-Photon Absorption Spectra of Chalcones. Molecules. 2017; 22(10):1643. https://doi.org/10.3390/molecules22101643
Chicago/Turabian StyleBednarska, Joanna, Robert Zaleśny, Guangjun Tian, Natarajan Arul Murugan, Hans Ågren, and Wojciech Bartkowiak. 2017. "Nonempirical Simulations of Inhomogeneous Broadening of Electronic Transitions in Solution: Predicting Band Shapes in One- and Two-Photon Absorption Spectra of Chalcones" Molecules 22, no. 10: 1643. https://doi.org/10.3390/molecules22101643