Validation of Molecular Dynamics Simulations for Prediction of Three-Dimensional Structures of Small Proteins

 , ,
, ,
Abstract
: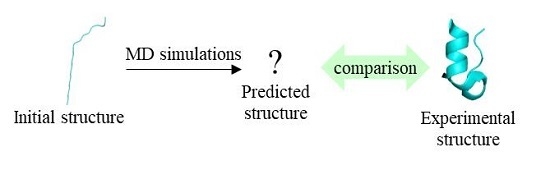
1. Introduction
2. Results and Discussion
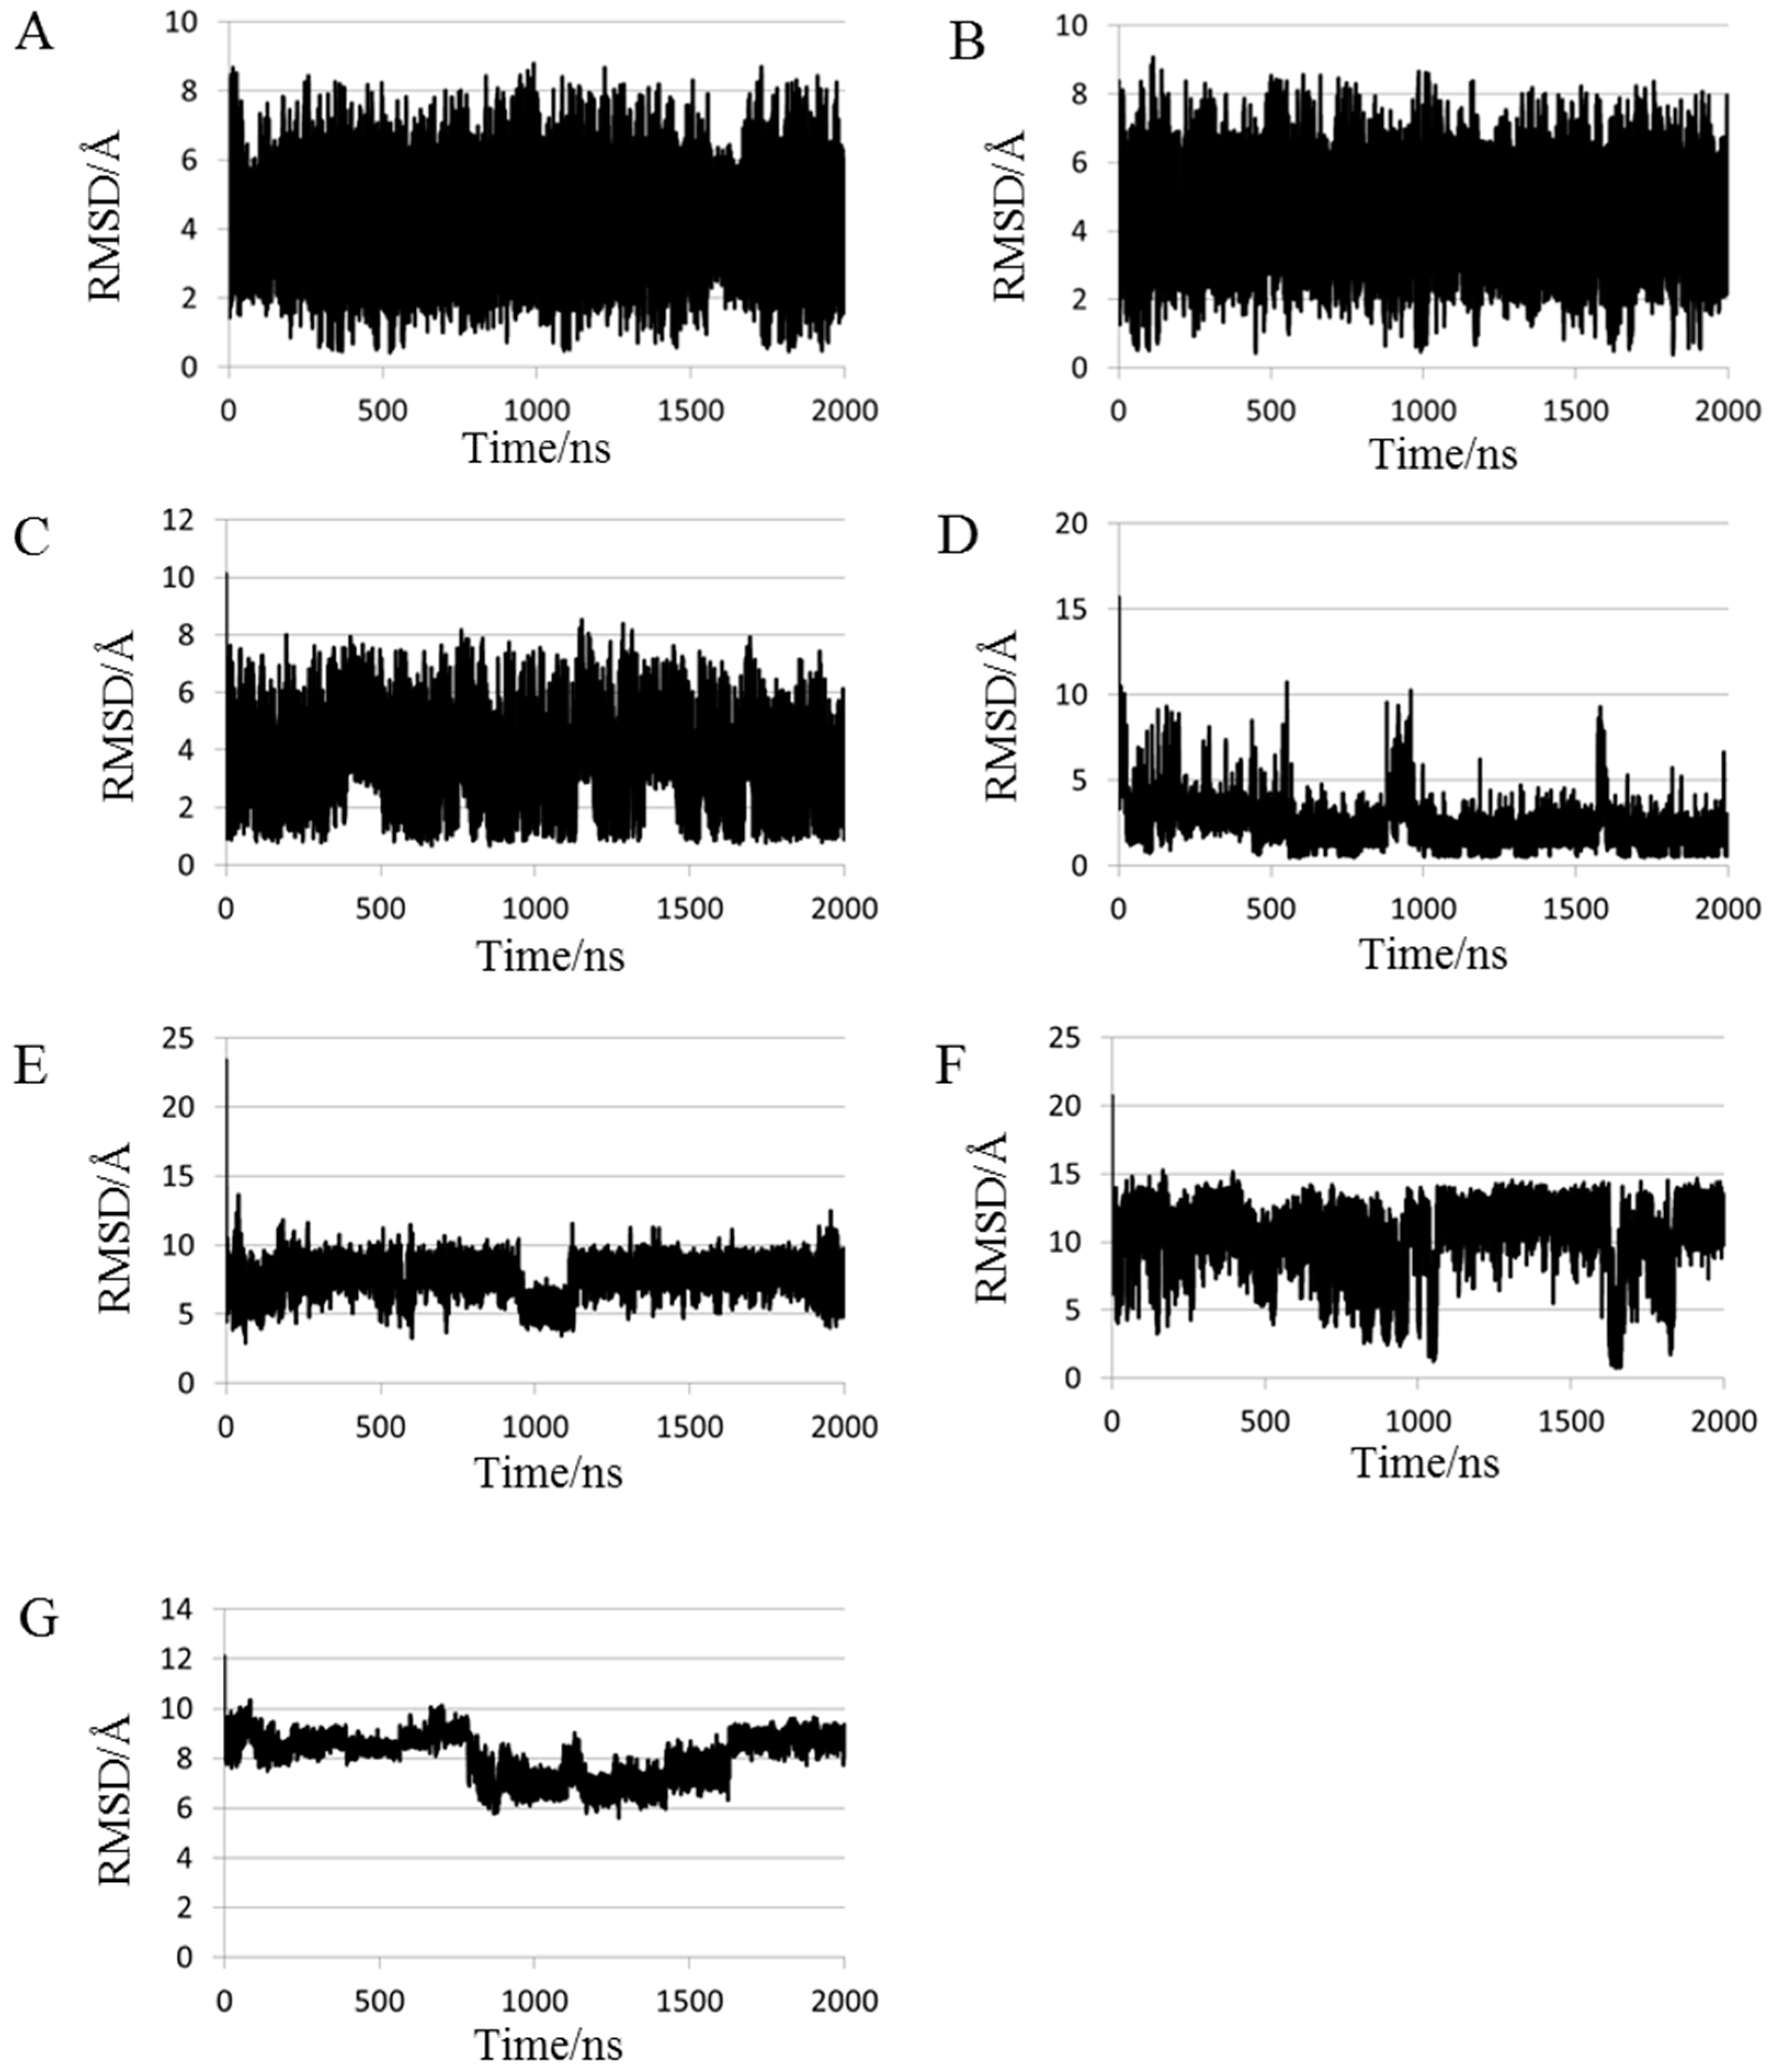
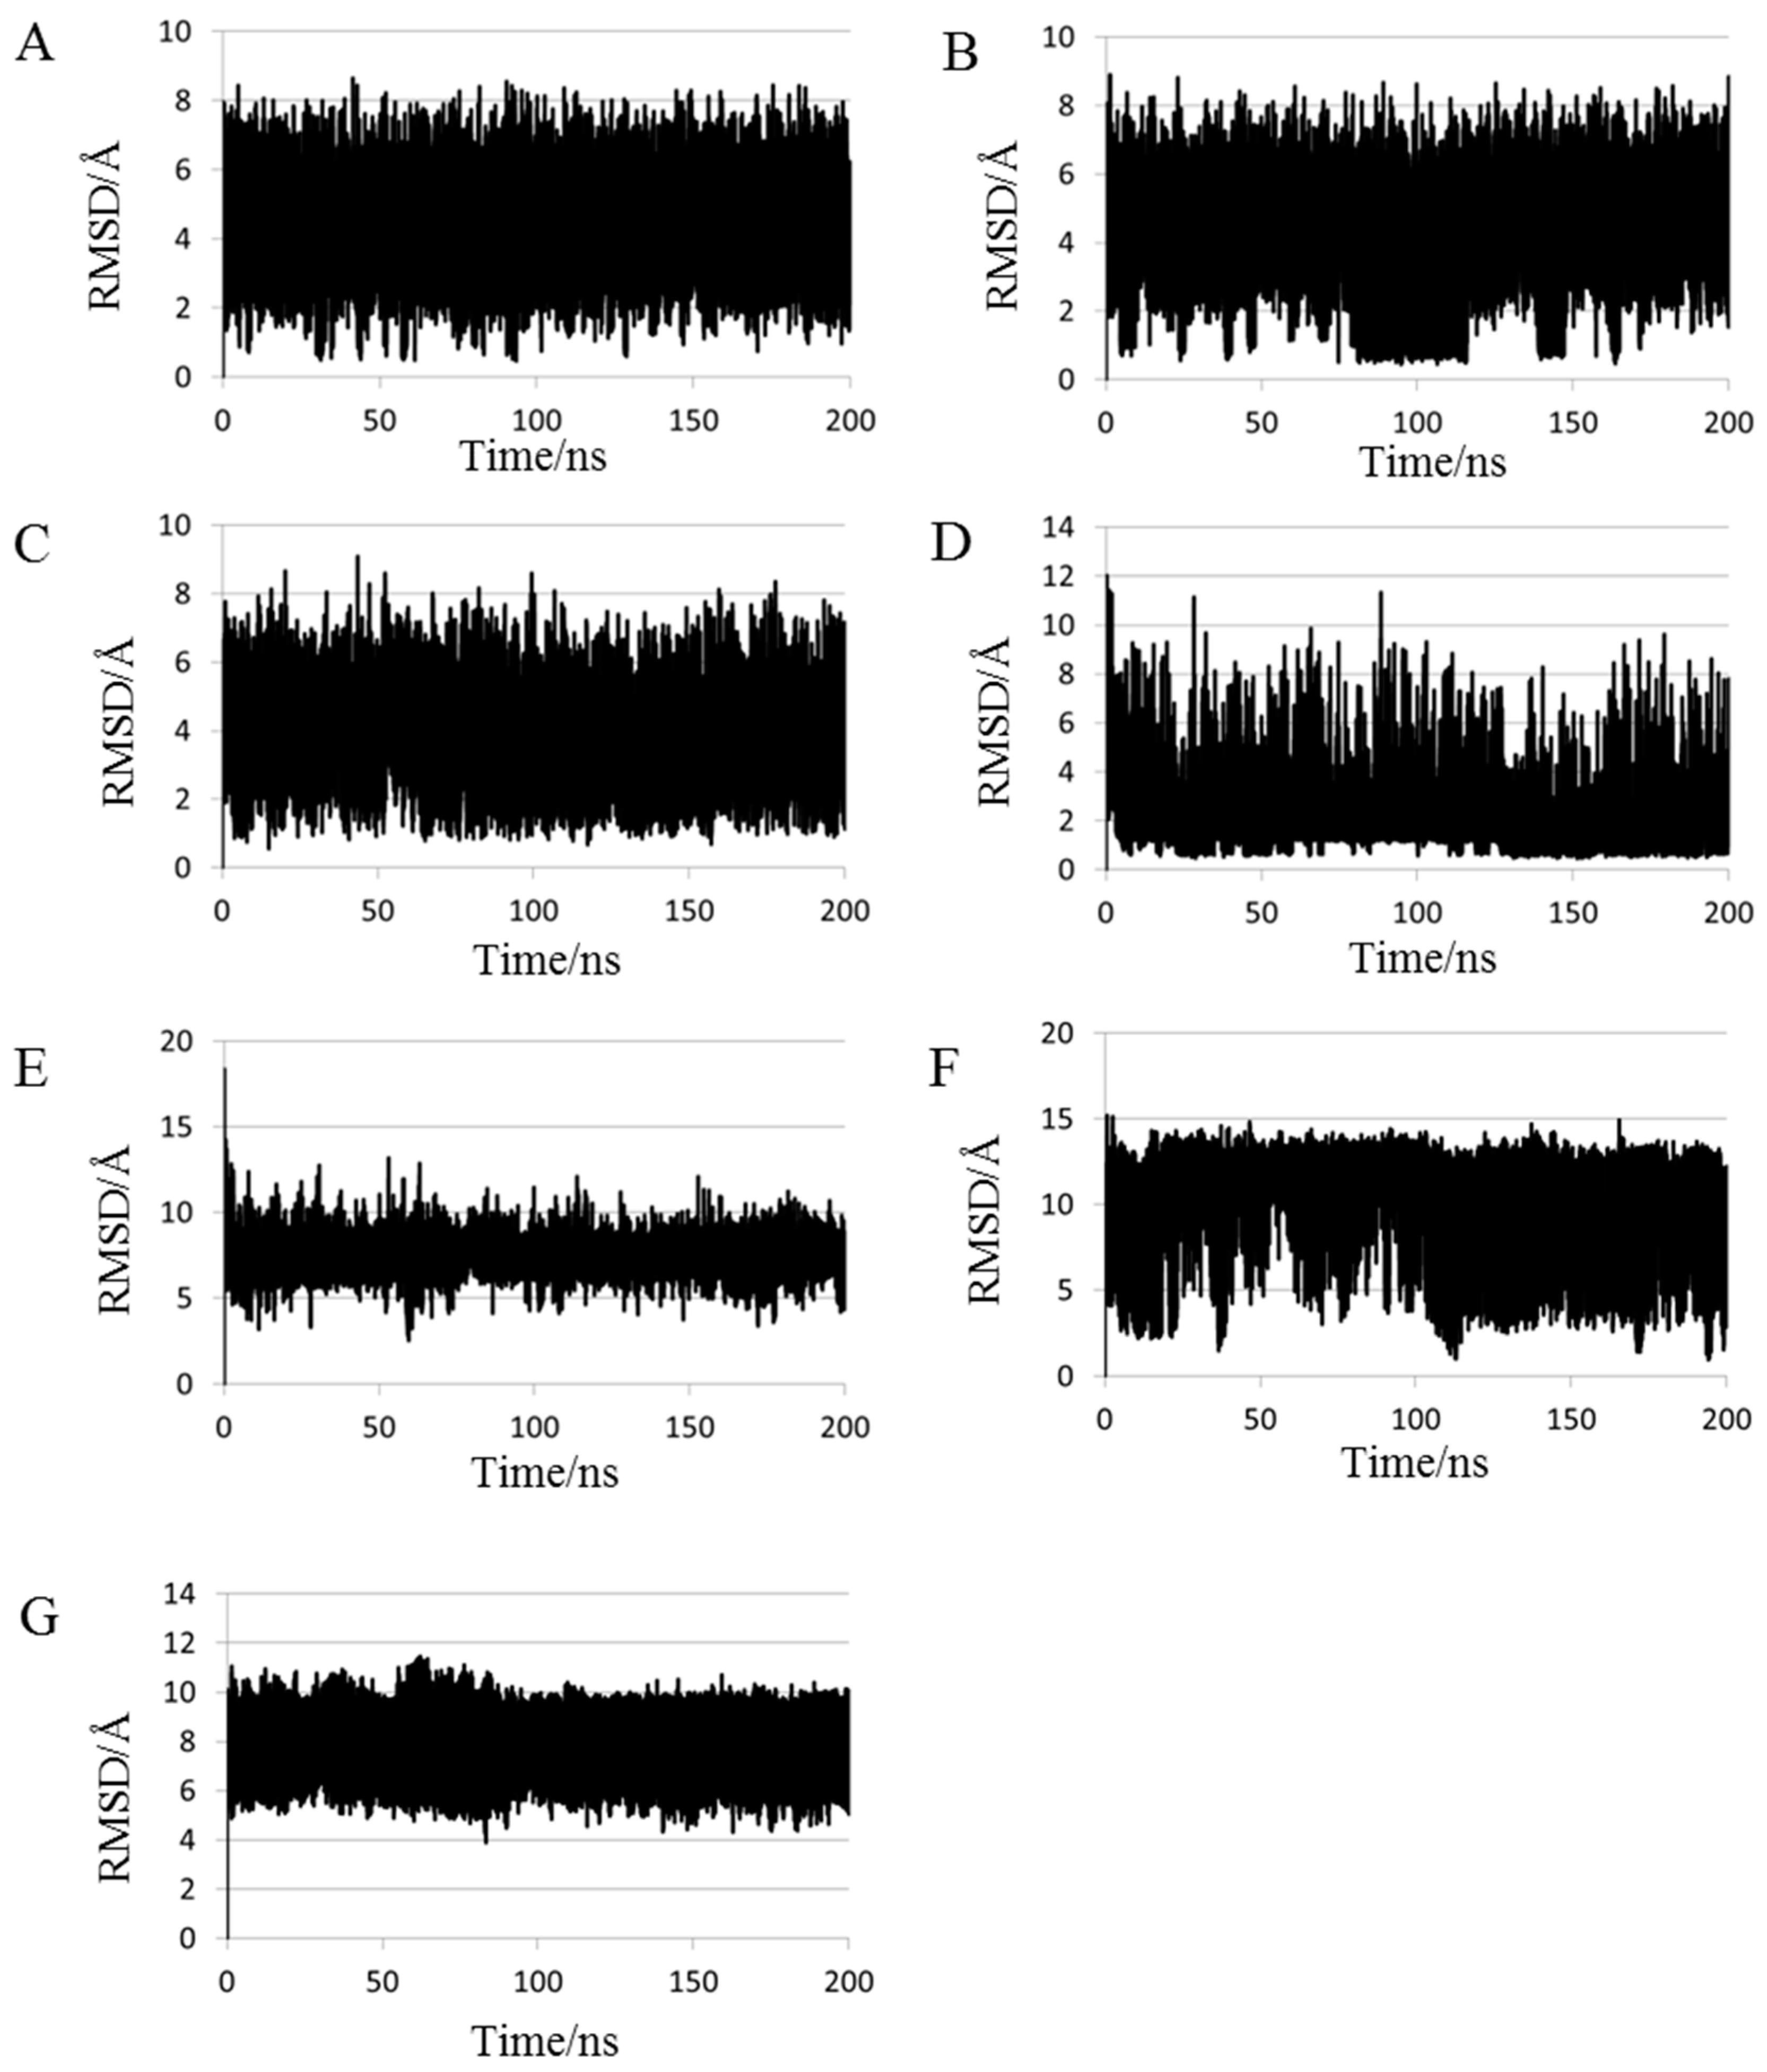
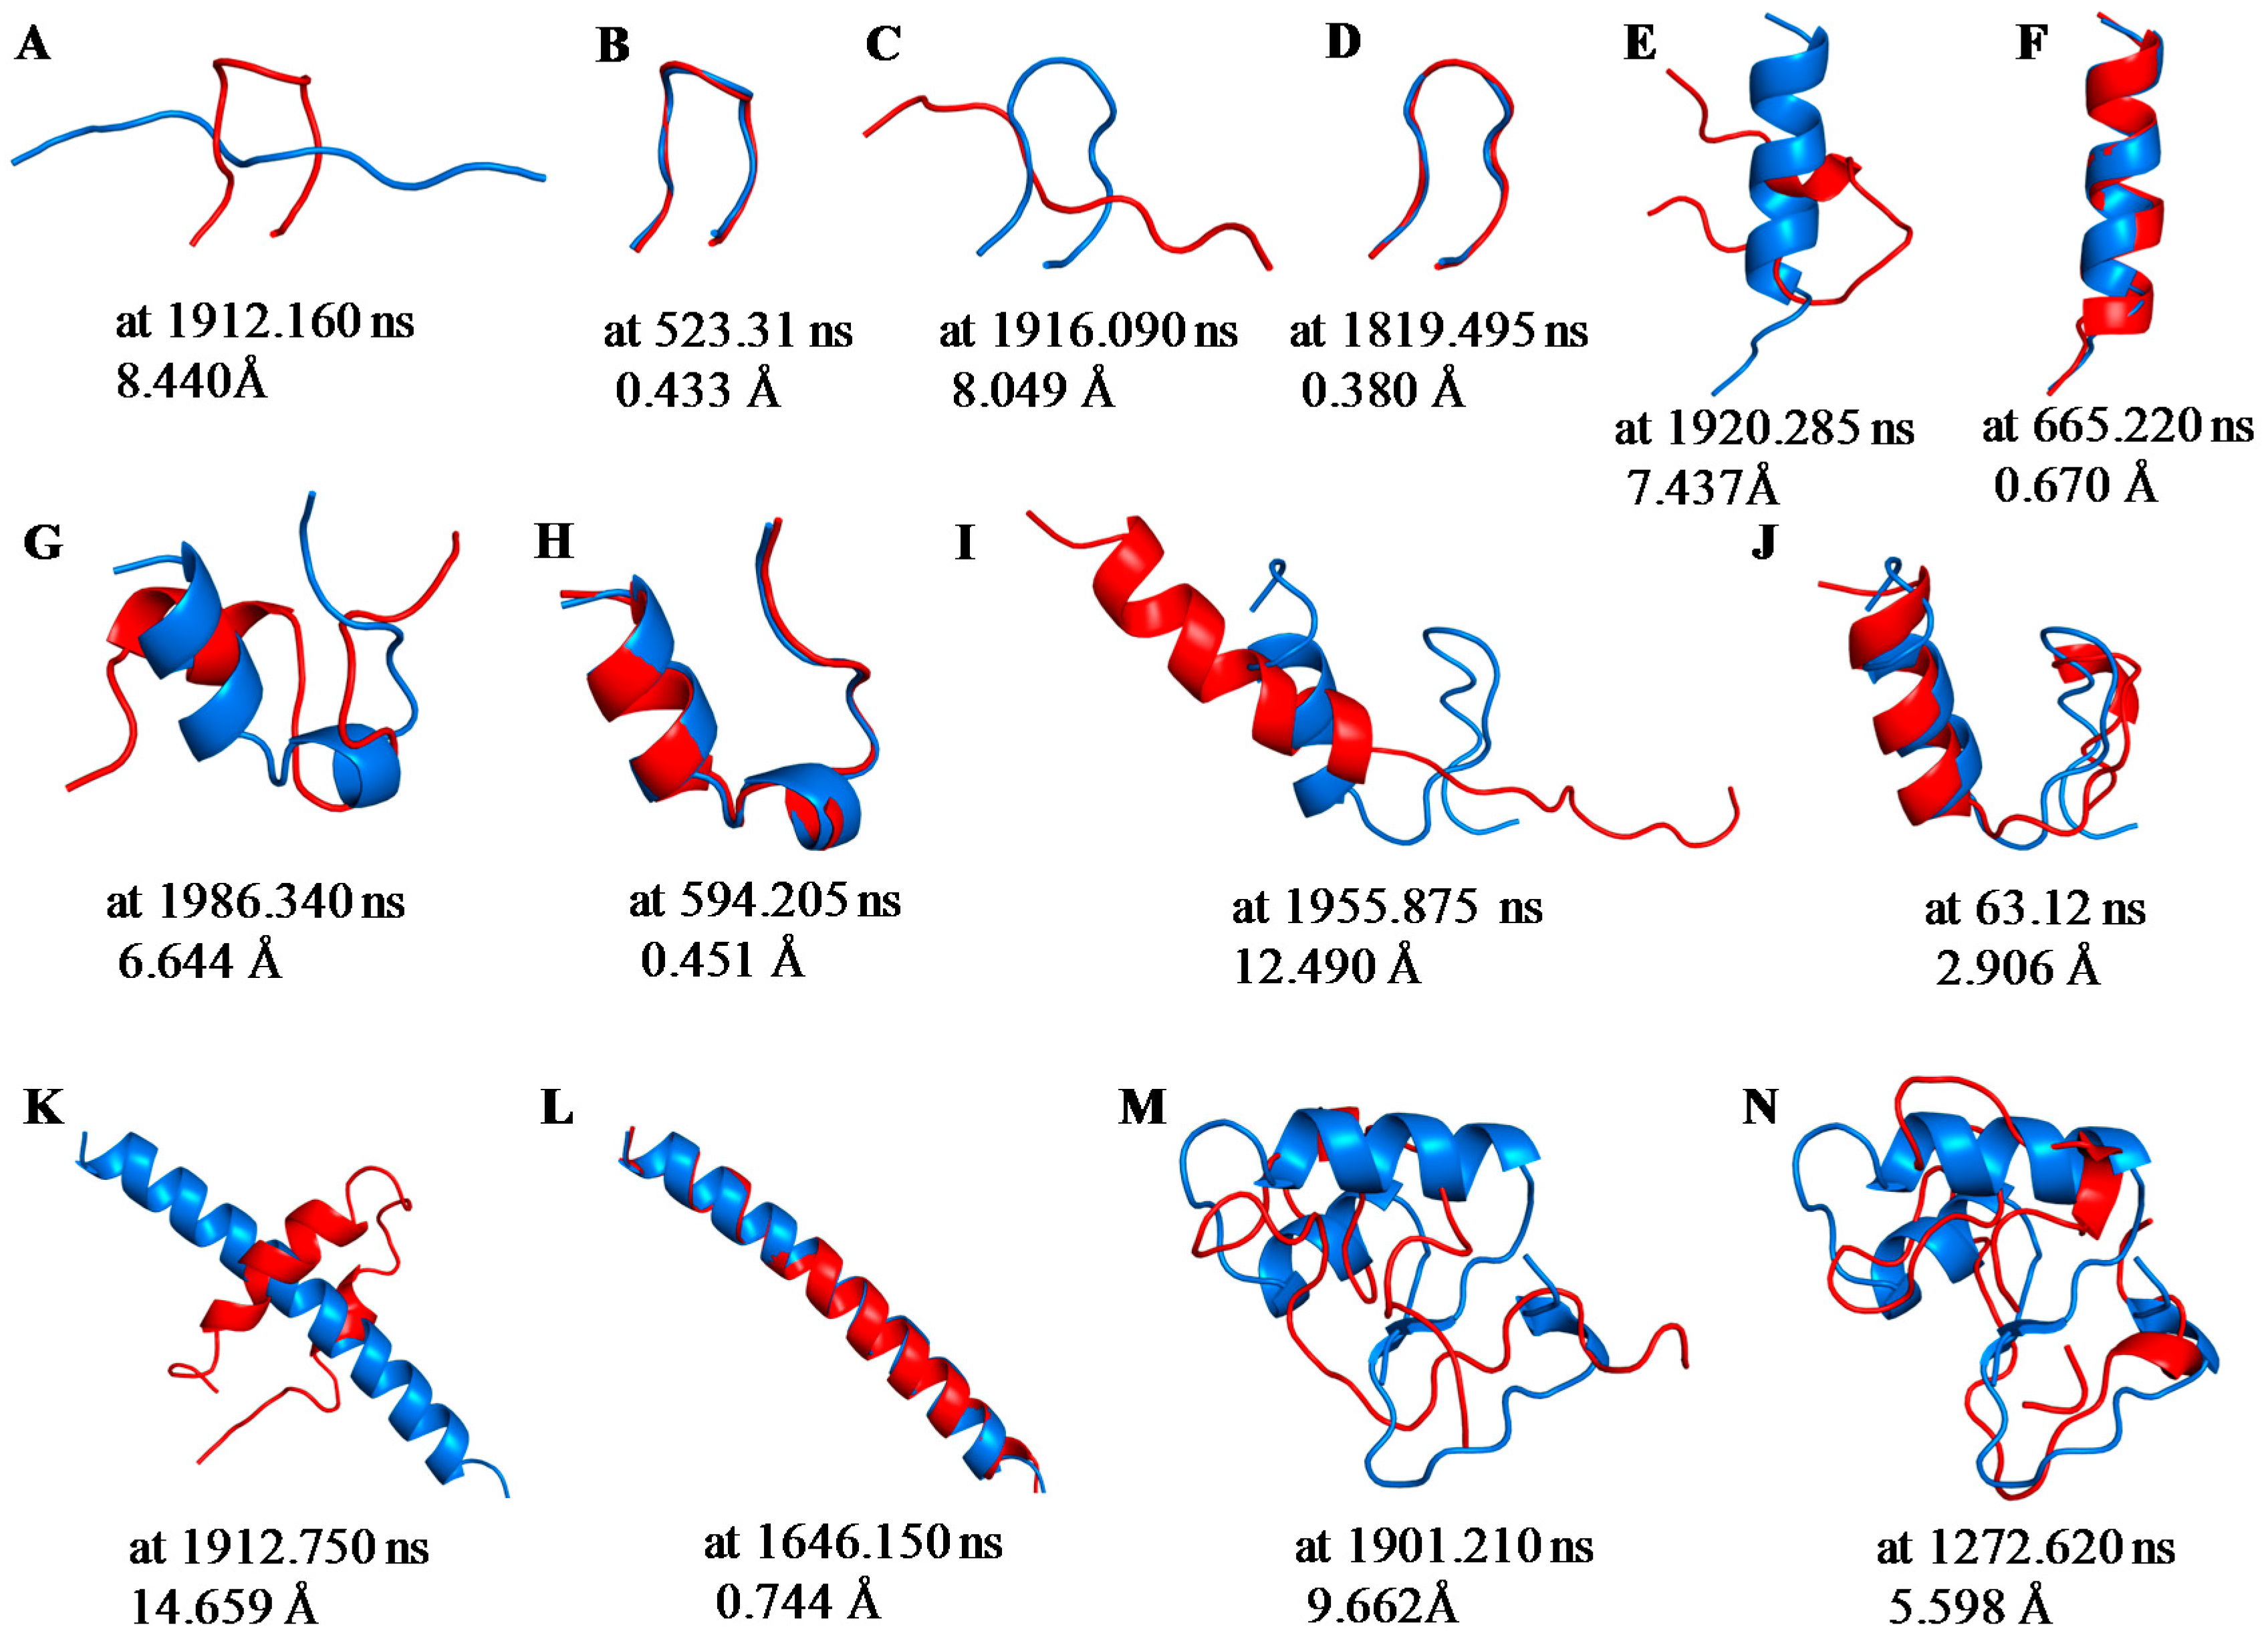
2.1. Root Mean Square Deviations (RMSDs) between Predicted and Experimental Structures
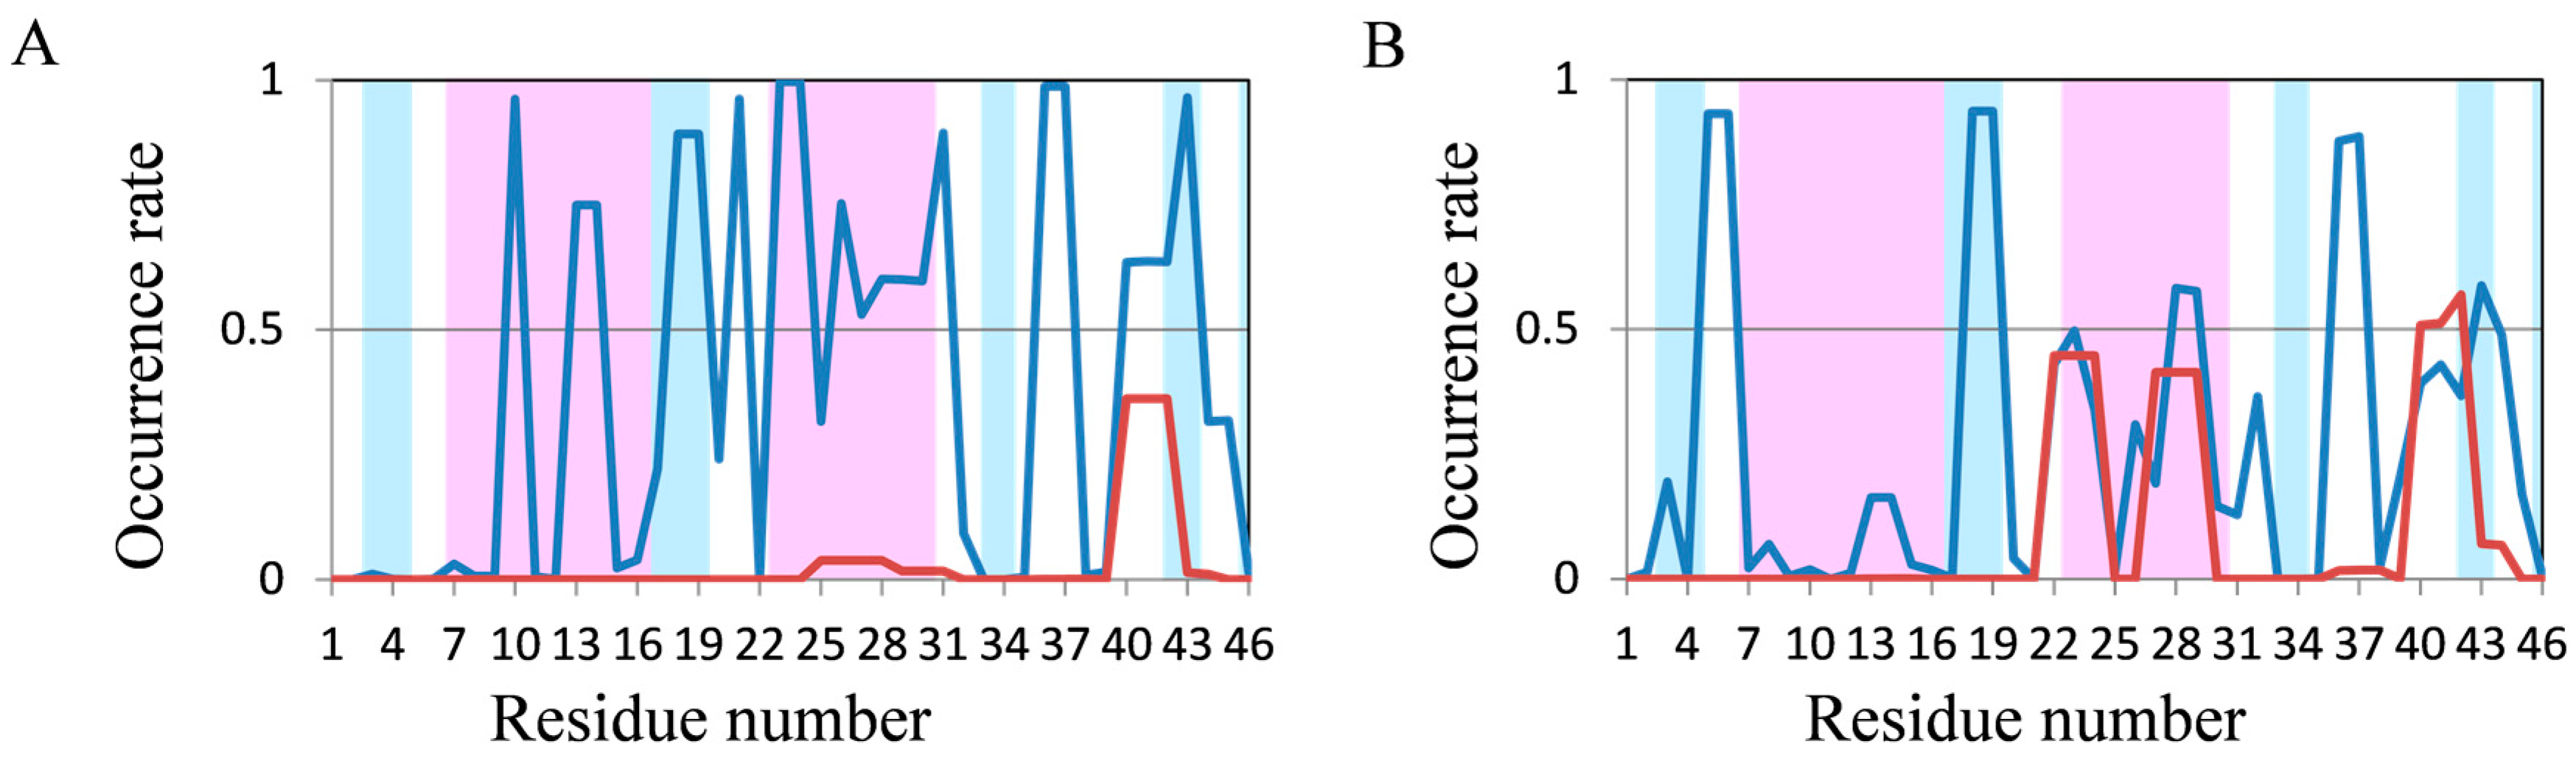
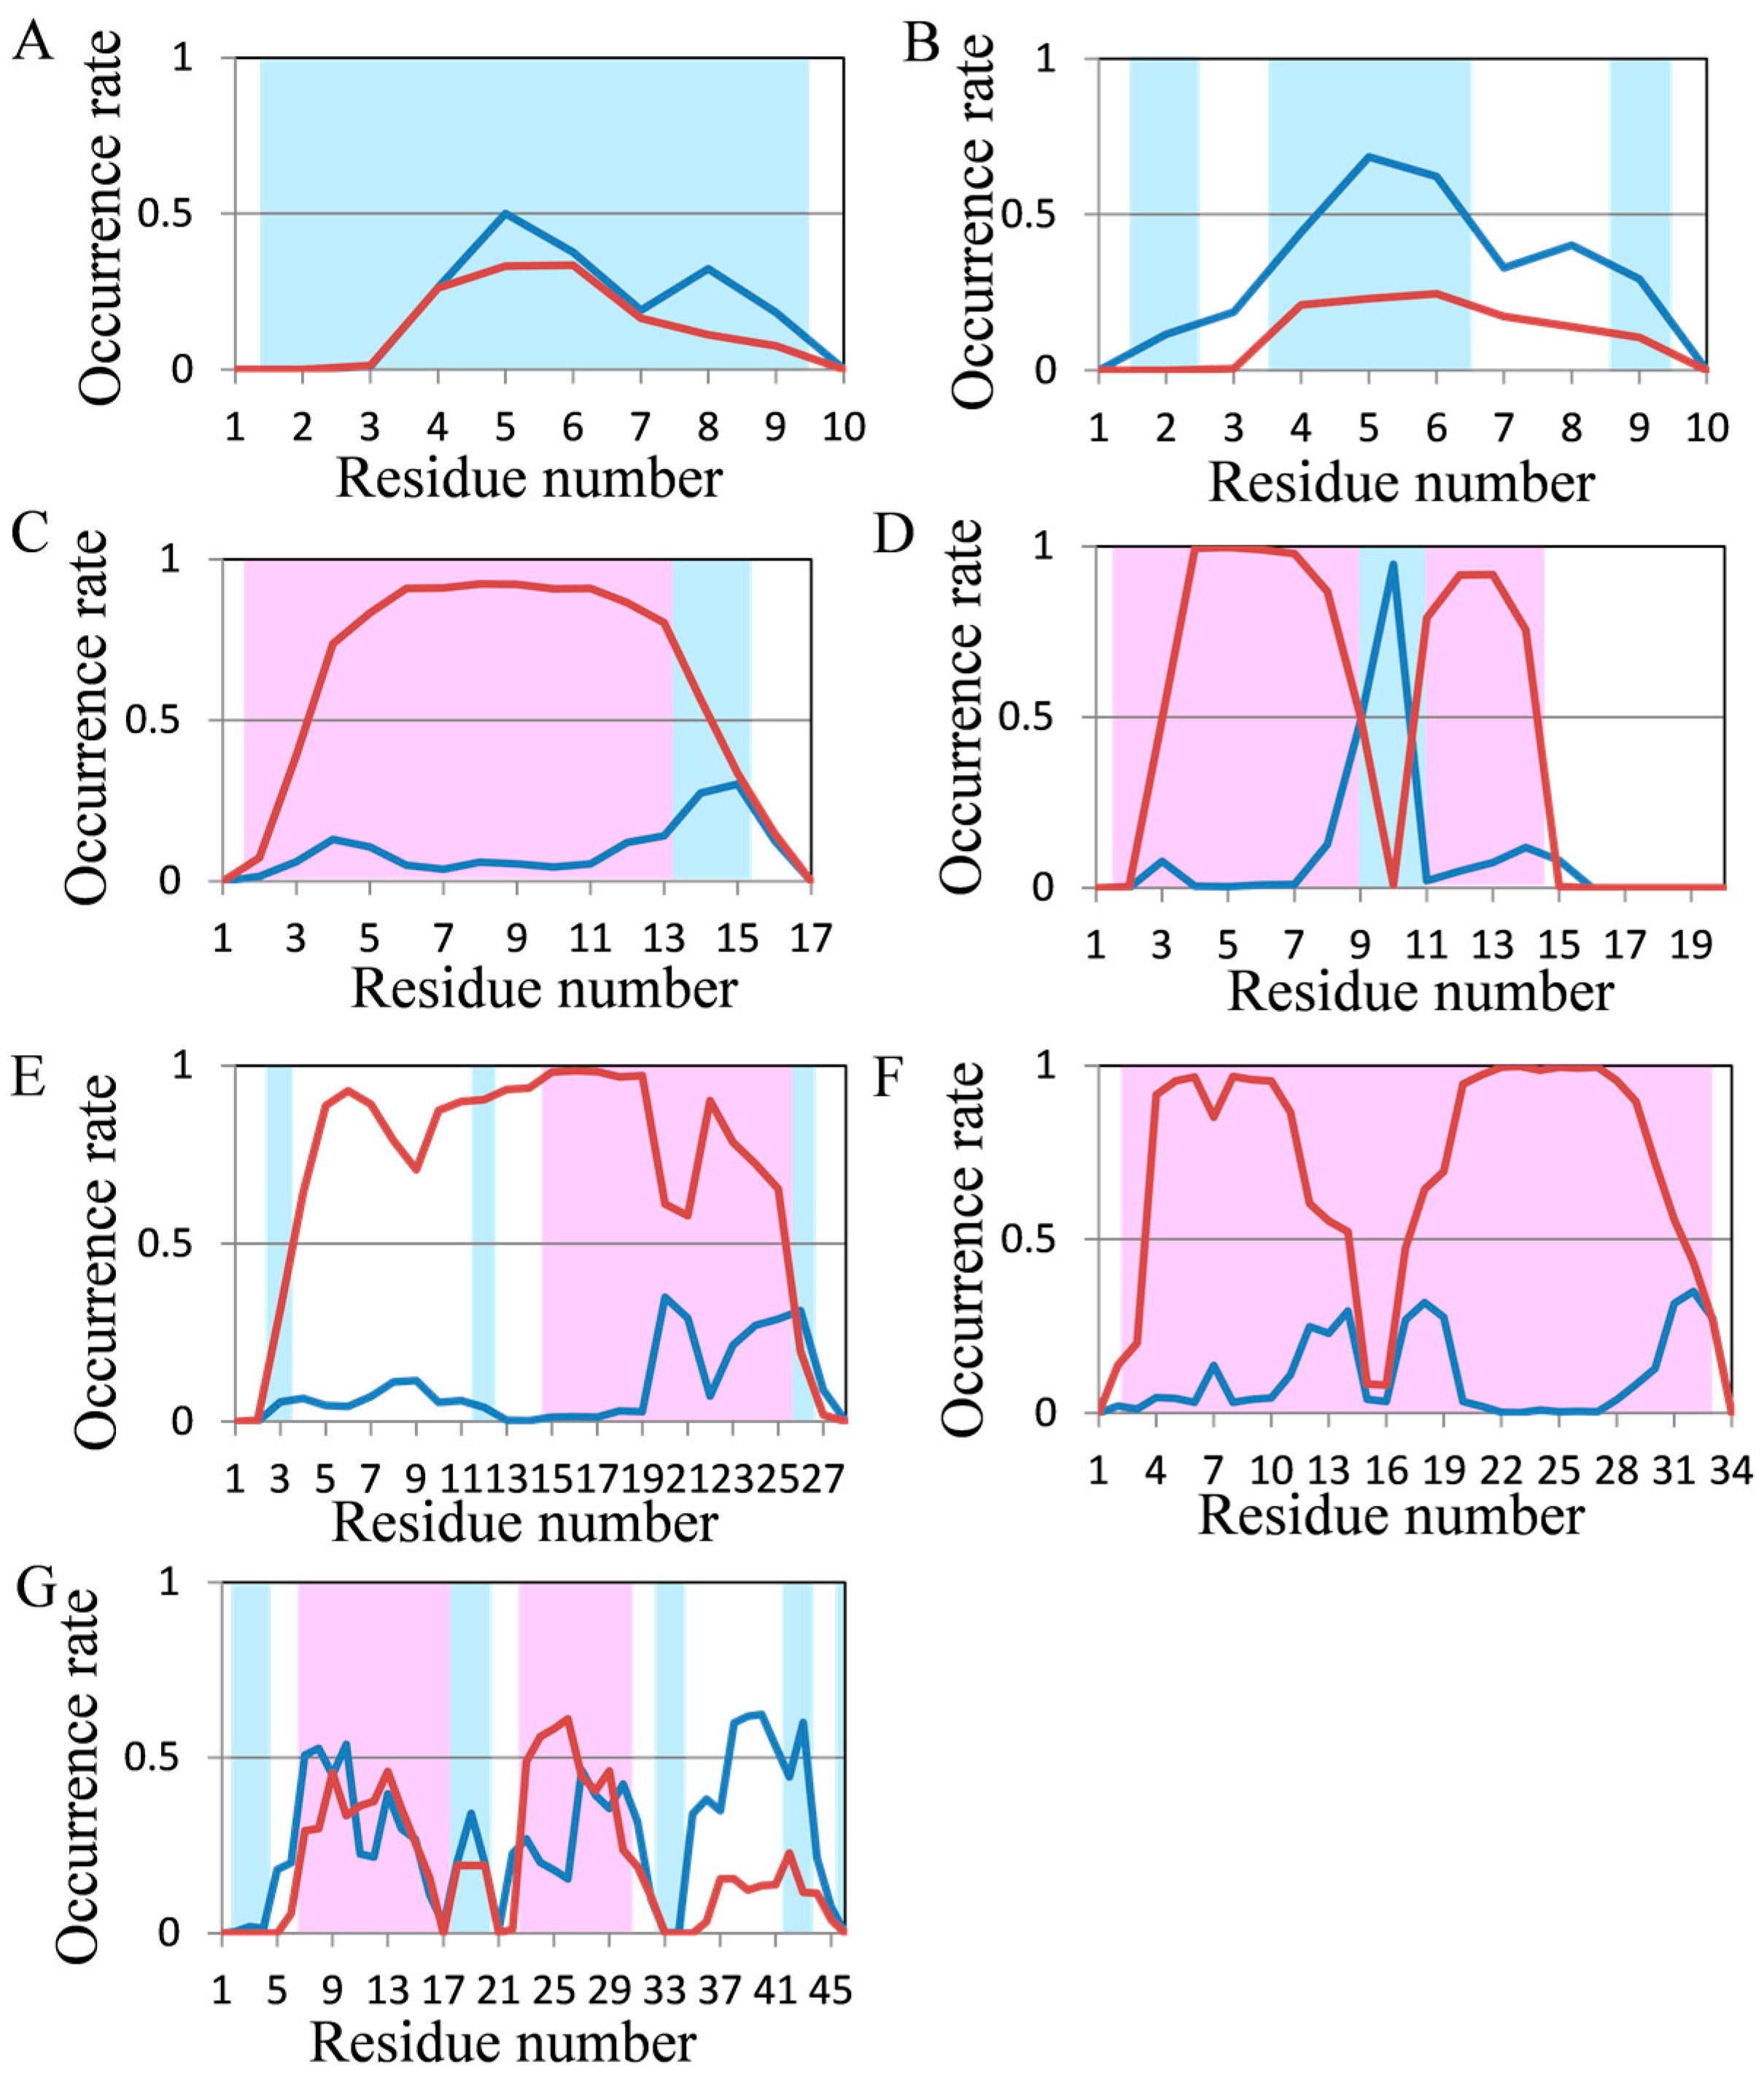
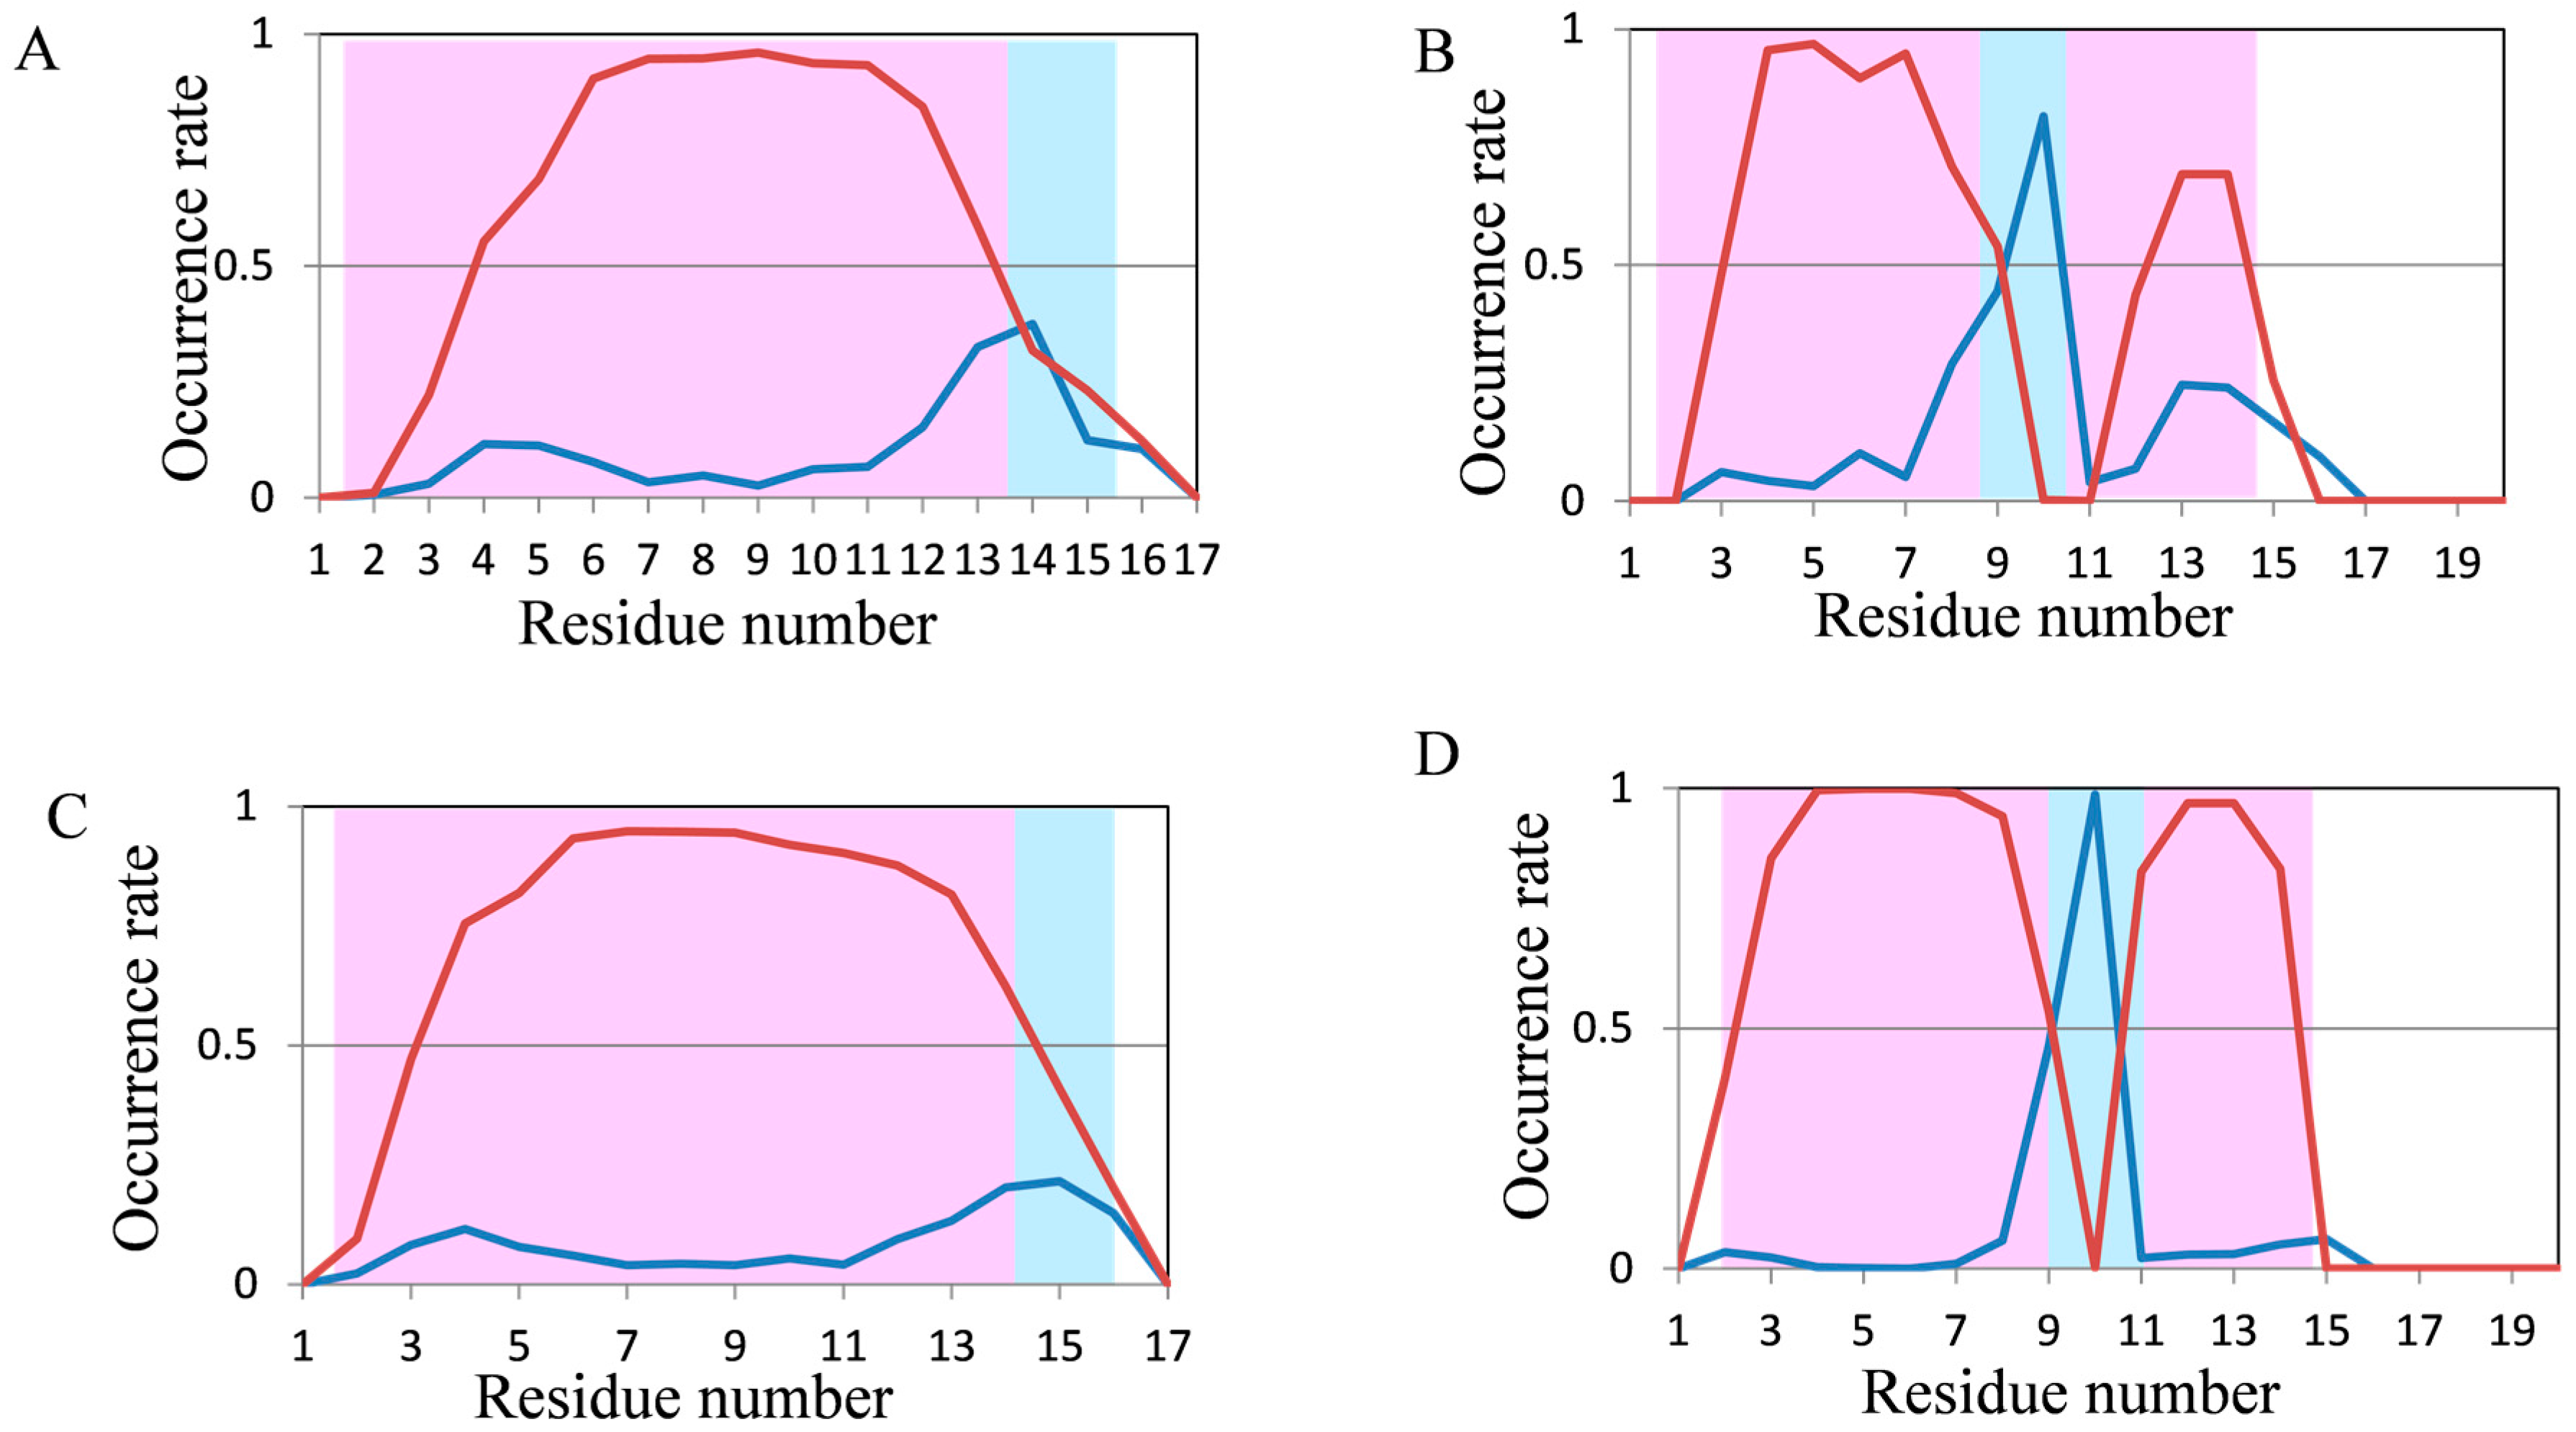
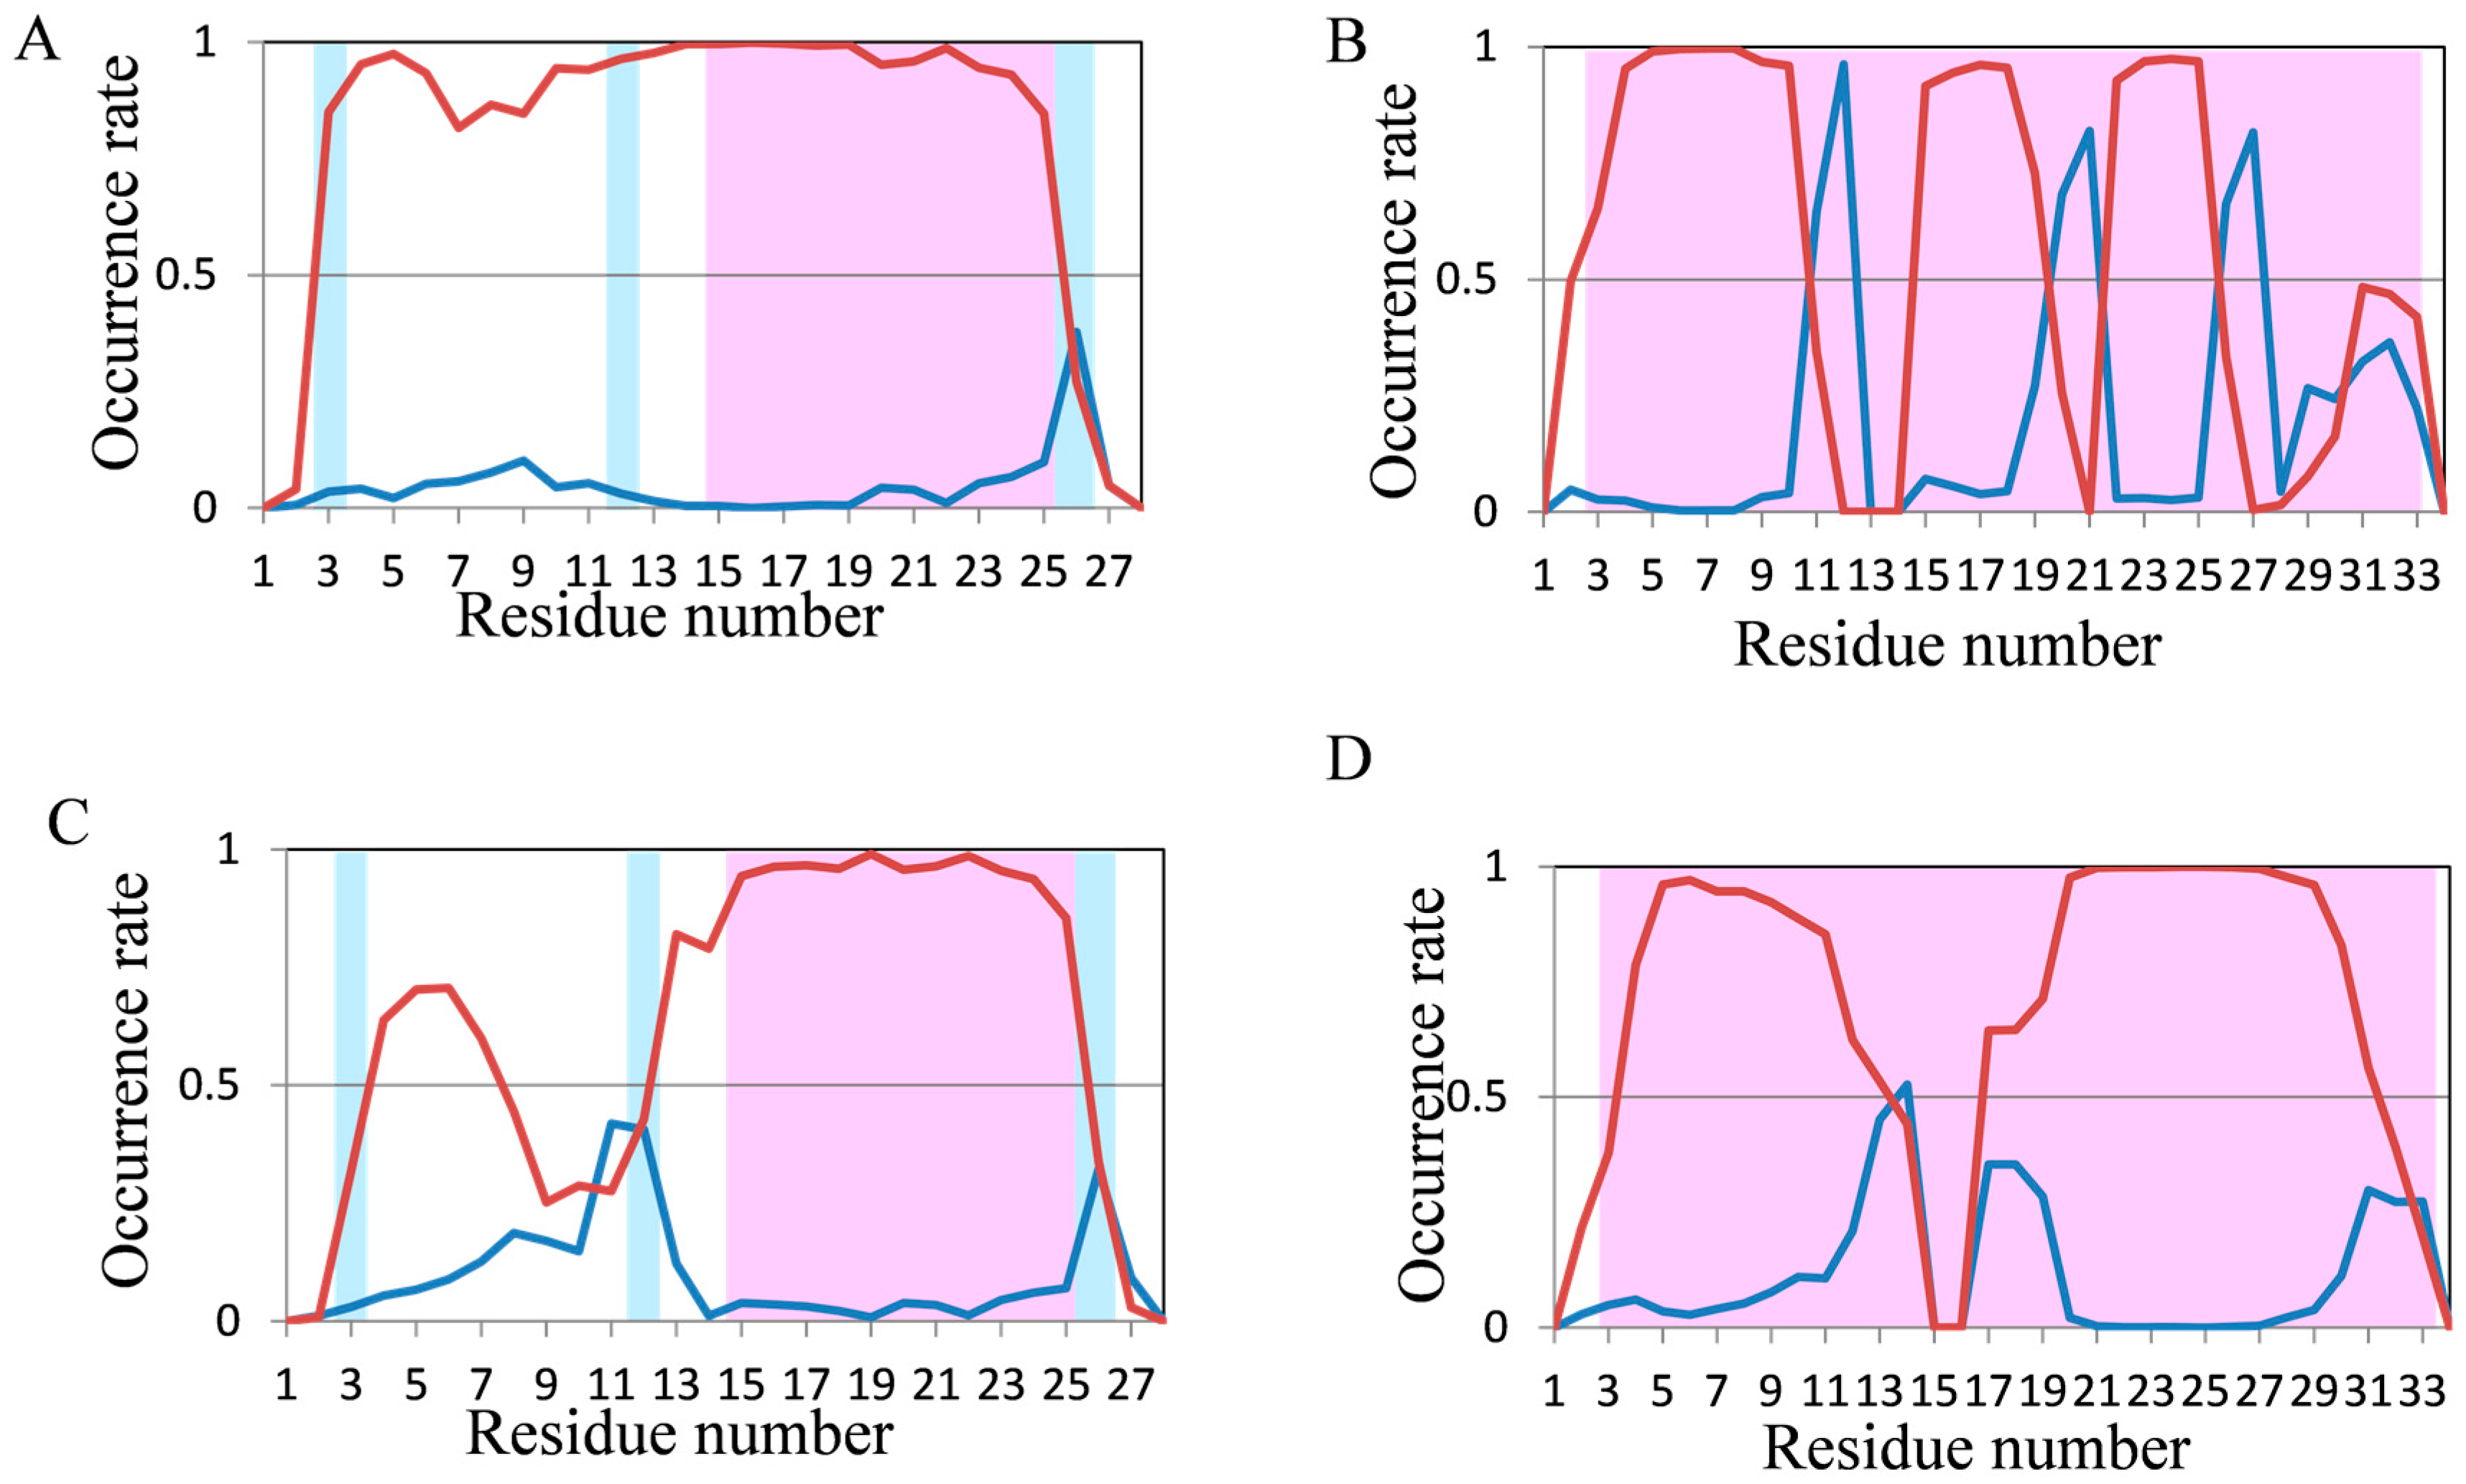
2.2. Analyses of Secondary Structures
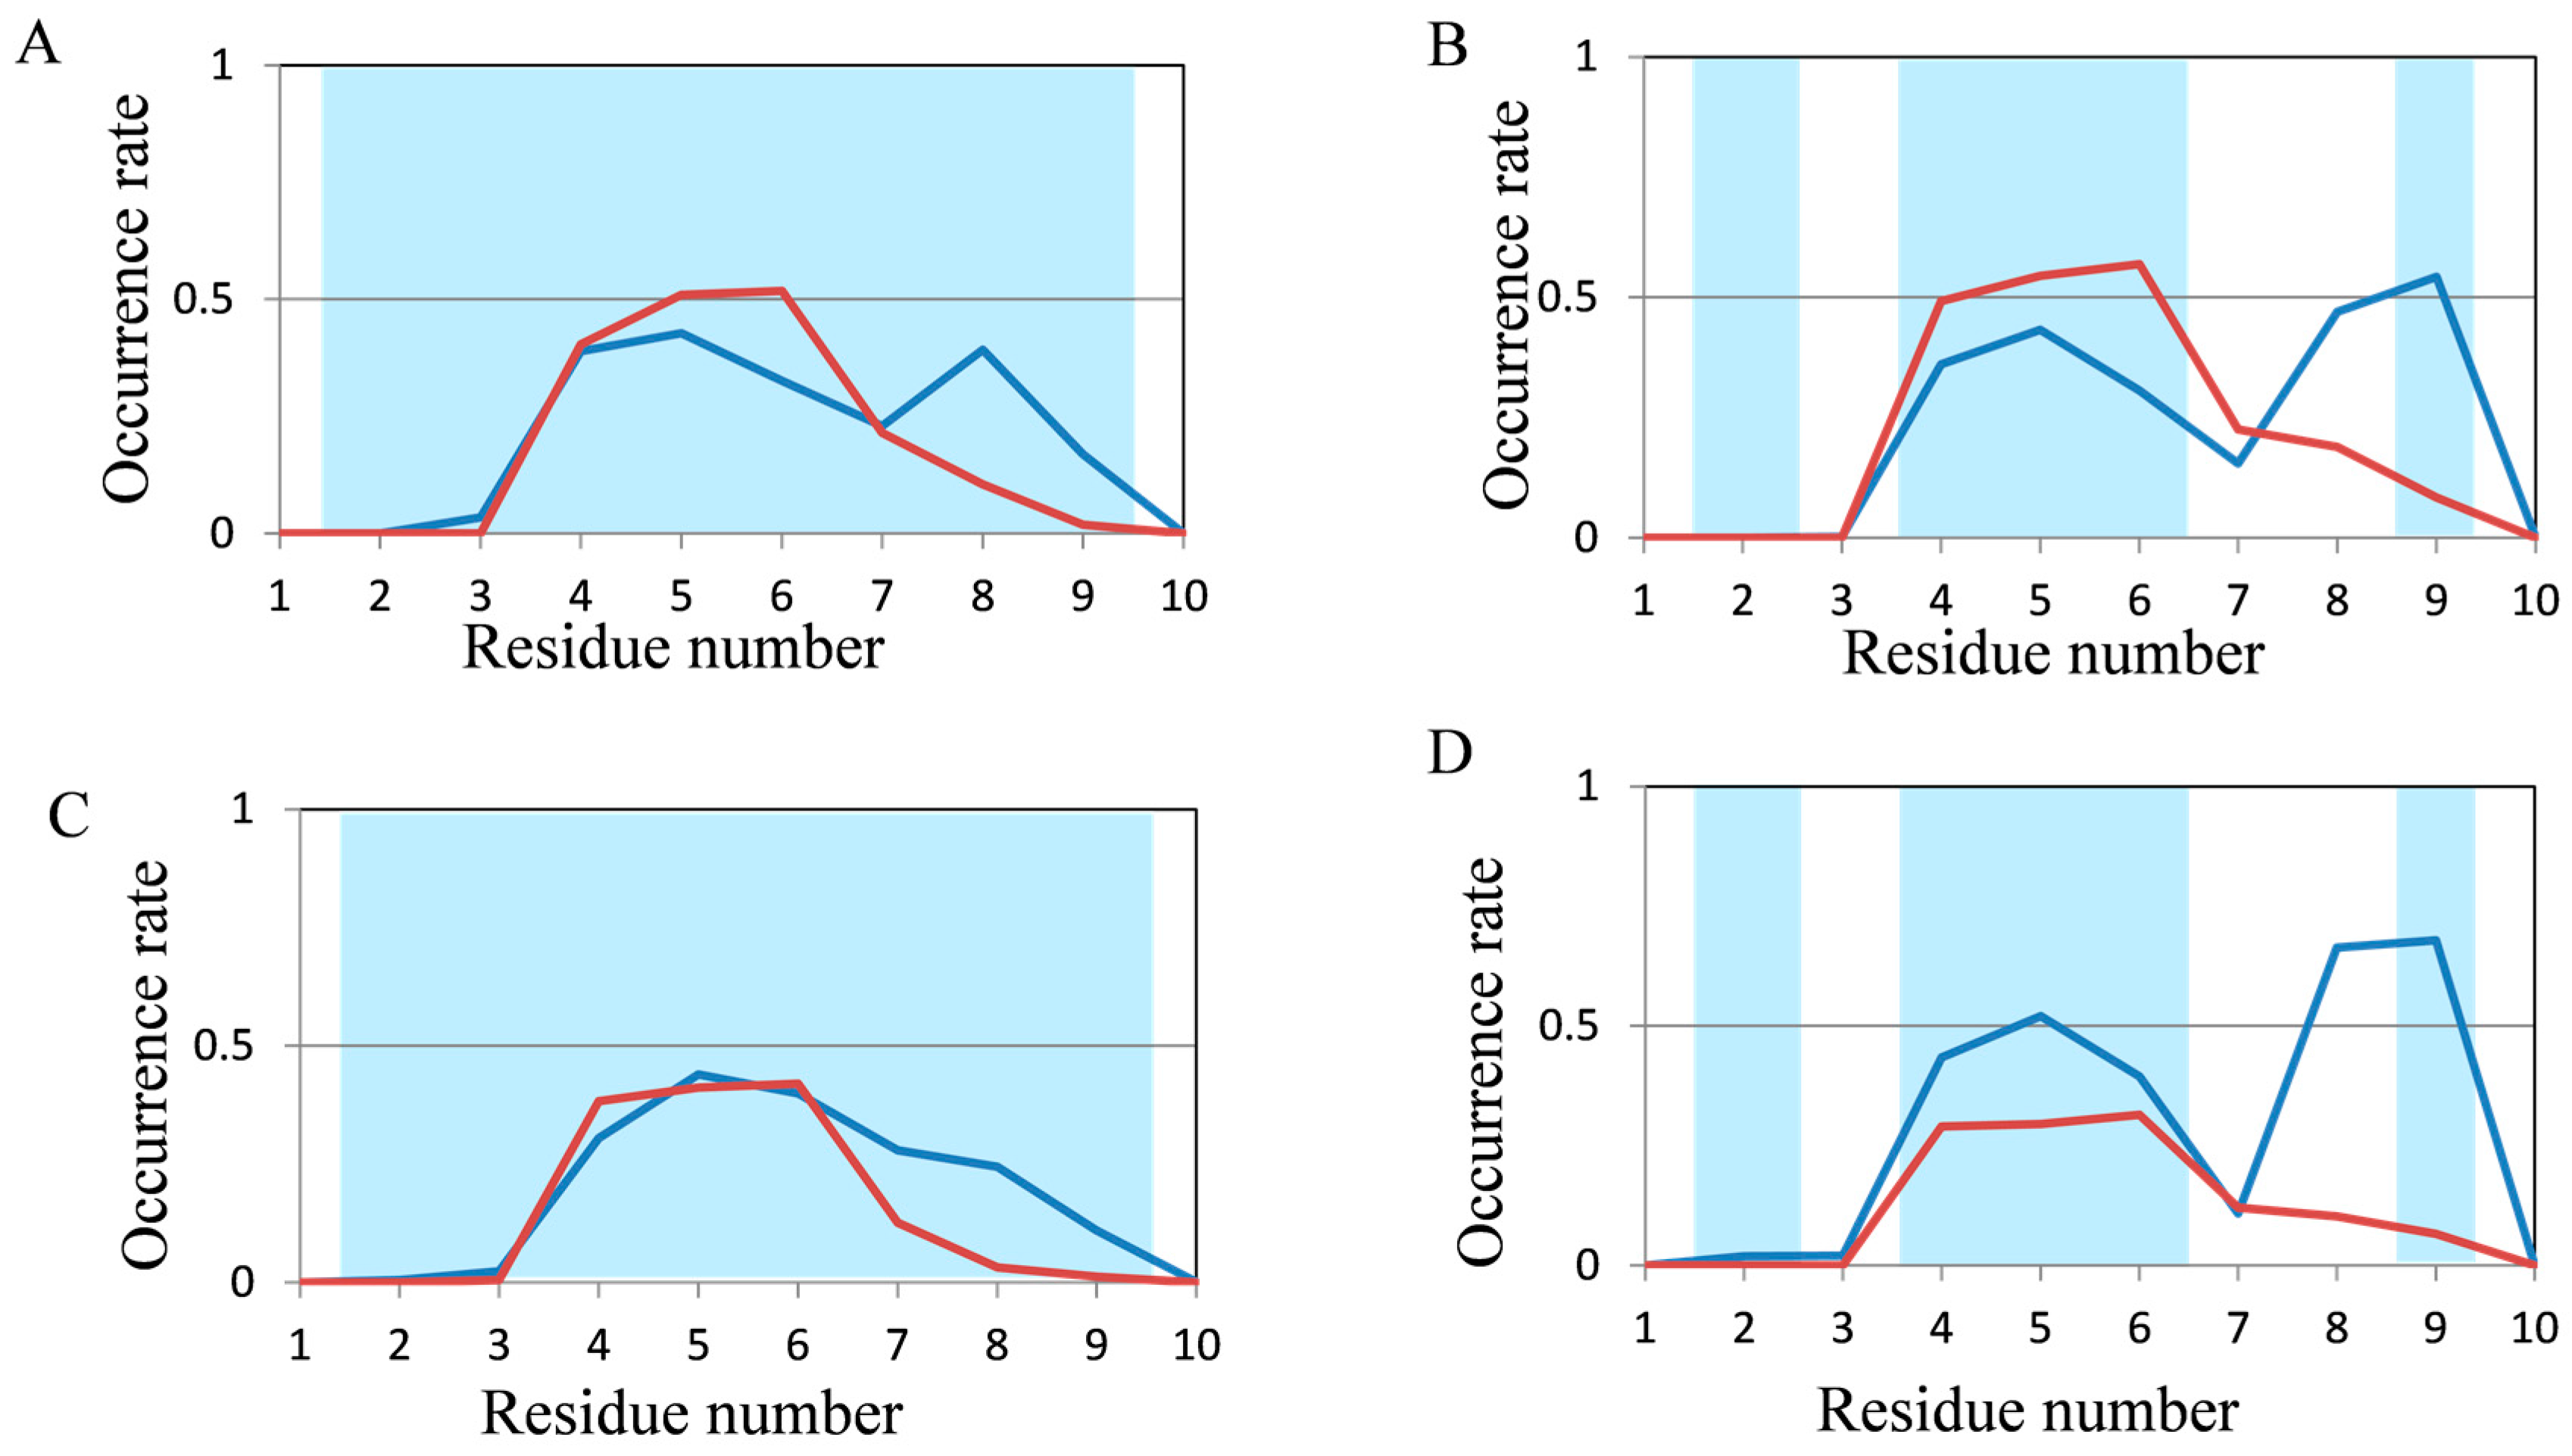
2.3. Structure Predictions Using REMD
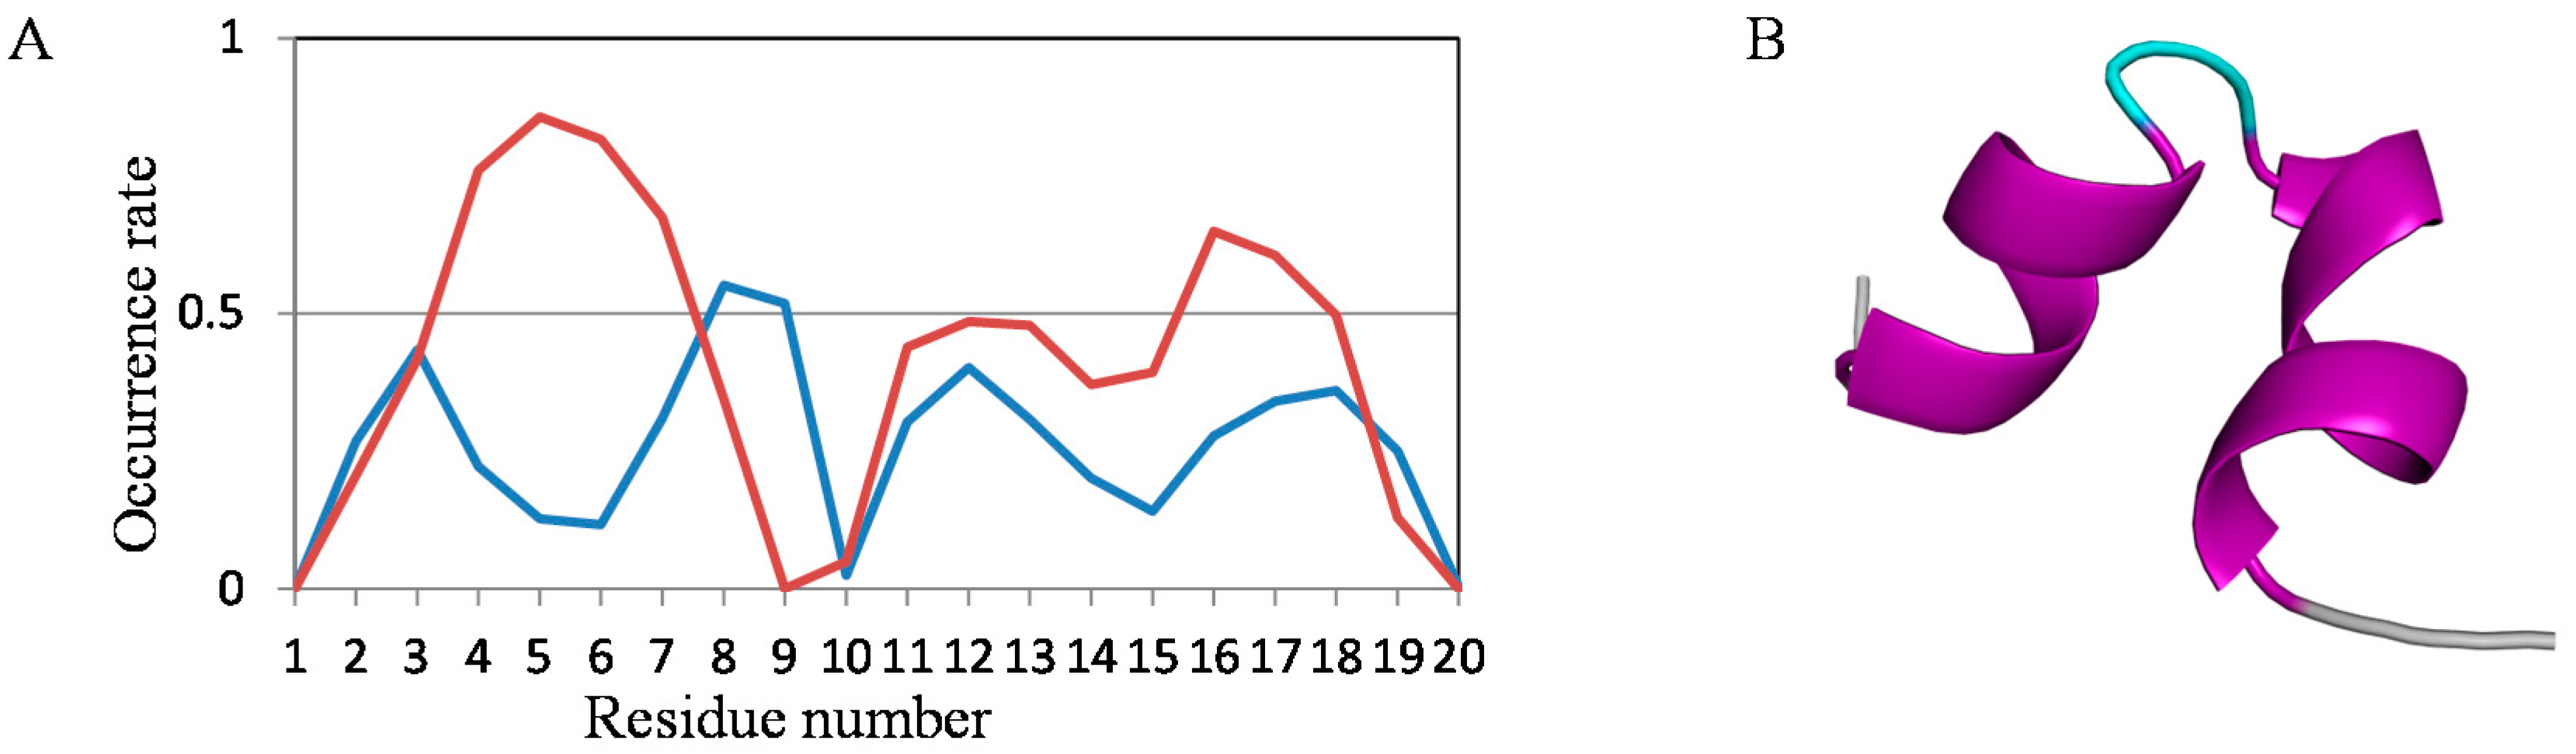
2.4. Structure Prediction for Primitive Protein
3. Methods
4. Conclusions
Acknowledgments
Author Contributions
Conflicts of Interest
References
- Mackenzie, O.C.; Grigoryan, G. Protein structural motif in prediction and design. Curr. Opin. Struct. Biol. 2017, 44, 161–167. [Google Scholar] [CrossRef] [PubMed]
- Khor, B.Y.; Tye, G.J.; Lim, T.S.; Choong, Y. General overview on structure prediction of twilight-zone proteins. Theor. Biol. Med. Model. 2015, 12, 15. [Google Scholar] [CrossRef] [PubMed]
- Zhang, Y. Interplay of I-TASSER and QUARK for template-based and ab initio protein structure prediction in CASP10. Proteins Struct. Funct. Bioinf. 2012, 82, 175–187. [Google Scholar] [CrossRef] [PubMed]
- Kawabata, T. HOMCOS: An updated server to search and model complex 3D structures. J. Struct. Funct. Genom. 2016, 17, 83–99. [Google Scholar] [CrossRef] [PubMed]
- Aloy, P.; Russell, R.B. Interrogating protein interaction networks through structural biology. Proc. Natl. Acad. Sci. USA 2002, 99, 5896–5901. [Google Scholar] [CrossRef] [PubMed]
- Simons, K.T.; Bonneau, R.; Ruczinski, I.; Baker, D. Ab initio protein structure prediction of CASP III targets using ROSETTA. Proteins Struct. Funct. Genet. 1999, 3, 171–176. [Google Scholar] [CrossRef]
- Zhang, Y.; Skolnick, J. Automated structure prediction of weakly homologue proteins on a genomic scale. Proc. Natl. Acad. Sci. USA 2004, 101, 7594–7599. [Google Scholar] [CrossRef] [PubMed]
- Wu, S.; Zhang, Y. LOMETS: A local meta-threading-server for protein structure prediction. Nucl. Acids Res. 2007, 35, 3375–3382. [Google Scholar] [CrossRef] [PubMed]
- Kelly, L.A.; Mezulis, S.; Yates, C.M.; Wass, M.N.; Sernberg, M.J.E. The Phyre2 web portal for protein modeling, prediction and analysis. Nat. Protoc. 2015, 10, 845–858. [Google Scholar] [CrossRef] [PubMed]
- Arnold, K.; Bordoli, L.; Kopp, J.; Schwede, T. The SWISS-MODEL Workspace: A web-based environment for protein structure homology modelling. Bioinformatics 2006, 22, 195–201. [Google Scholar] [CrossRef] [PubMed]
- Shen, Y.; Maupetit, J.; Derreumaux, P.; Tuffery, P. Improved PEP-FOLD approach for peptide and miniprotein structure prediction. J. Chem. Theory Comput. 2014, 10, 4745–4758. [Google Scholar] [CrossRef] [PubMed]
- Thevenet, P.; Shen, Y.; Maupetit, J.; Guyon, F.; Derreumaux, P.; Tuffery, P. PEP-FOLD: An updated de novo structure prediction server for both linear and disulfide bonded cyclic peptides. Nucl. Acids Res. 2012, 40, 288–293. [Google Scholar] [CrossRef] [PubMed]
- Fujii, N.; Kaji, Y.; Fujii, N.; Nakamura, T.; Motoie, R.; Mori, Y.; Kinouchi, T. Collapse of homochirality of amino acids in proteins from various tissues during aging. Chem. Biodivers. 2010, 7, 1389–1397. [Google Scholar] [CrossRef] [PubMed]
- Fujii, N.; Kaji, Y.; Fujii, N. d-Amino acids in aged proteins: Analysis and biological relevance. J. Chromatogr. B 2011, 879, 3141–3147. [Google Scholar] [CrossRef] [PubMed]
- Fujii, N.; Saito, T. Homochirality and life. Chem. Rec. 2004, 4, 267–278. [Google Scholar] [CrossRef] [PubMed]
- Bolhassani, A.; Jafarzade, B.S.; Mardani, G. In vitro and in vivo delivery of therapeutic proteins using cell penetrating peptides. Peptides 2017, 87, 50–63. [Google Scholar] [CrossRef] [PubMed]
- Yamashita, H.; Kato, T.; Oba, M.; Misawa, T.; Hattori, T.; Ohoka, N.; Tanaka, M.; Naito, M.; Kurihara, M.; Demizu, Y. Development of a cell-penetrating peptide that exhibits responsive changes in its secondary structure in the cellular environment. Sci. Rep. 2016, 6, 33003. [Google Scholar] [CrossRef] [PubMed]
- Tashima, T. Intelligent substance delivery into cells using cell-penetrating peptides. Bioorg. Med. Chem. Lett. 2017, 27, 121–130. [Google Scholar] [CrossRef] [PubMed]
- Zuckerkandl, E.; Derancourt, J.; Vogel, H. Mutational trends and random processes in the evolution of informational macromolecules. J. Mol. Biol. 1971, 59, 473–490. [Google Scholar] [CrossRef]
- Jordan, I.K.; Kondrashov, F.A.; Adzhubel, I.A.; Wolf, Y.I.; Koonin, E.V.; Kondrashov, A.S.; Sunyaev, S. A universal trend of amino acid gain and loss in protein evolution. Nature 2005, 433, 633–638. [Google Scholar] [CrossRef] [PubMed]
- Van der Gulik, P.; Massar, S.; Gilis, D.; Buhrman, H.; Rooman, M. The first peptides: The evolutionary transition between prebiotic amino acids and early proteins. J. Theor. Biol. 2009, 261, 531–539. [Google Scholar] [CrossRef] [PubMed]
- Oshima, T. Magic 20 and the origins of life. Viva Origino 2011, 39, 45–47. [Google Scholar]
- Ikehara, K.; Omori, Y.; Arai, R.; Hirose, A. A novel theory on the origin of the genetic code: A GNC-SNS hypothesis. J. Mol. Evol. 2002, 54, 530–538. [Google Scholar] [CrossRef] [PubMed]
- Oda, A.; Fukuyoshi, S. Predicting three-dimensional conformations of peptides constructed of only glycine, alanine, aspartic acid, and valine. Orig. Life Evol. Biosph. 2015, 45, 183–193. [Google Scholar] [CrossRef] [PubMed]
- Oda, A.; Kobayashi, K.; Takahashi, O. Molecular-dynamics simulations for amyloid β1–42 monomer with d-aspartic acid residues using continuous solvent. Chem. Biodivers. 2010, 7, 1357–1363. [Google Scholar] [CrossRef] [PubMed]
- Oda, A.; Kobayashi, K.; Takahashi, O. Comparison of molecular dynamics simulation methods for amyloid β1–42 monomers containing d-aspartic acid residues for predicting retention times in chromatography. J. Chromatogr. B 2011, 873, 3337–3343. [Google Scholar] [CrossRef] [PubMed]
- Harada, R.; Shigeta, Y. Efficient conformational search based on structural dissimilarity sampling: applications for reproducing structural transitions of proteins. J. Chem. Theory Comput. 2017, 13, 1411–1423. [Google Scholar] [CrossRef] [PubMed]
- Anandakrishnan, R.; Drozdetski, A.; Walker, R.C.; Onufriev, A.V. Speed of conformational change: comparing explicit and implicit solvent molecular dynamics simulations. Biophys. J. 2015, 108, 1153–1164. [Google Scholar] [CrossRef] [PubMed]
- Lindorff-Larsen, K.; Piana, S.; Dror, R.O.; Shaw, D.E. How fast-folding proteins fold. Science 2011, 334, 517–520. [Google Scholar] [CrossRef] [PubMed]
- Duan, L.L.; Gao, Y.; Mei, Y.; Zhang, Q.G.; Tang, B.; Zhang, J.Z.H. Folding of a helix is critically stabilized by polarization of backbone hydrogen bonds: Study in explicit water. J. Phys. Chem. B 2012, 116, 3430–3435. [Google Scholar] [CrossRef] [PubMed]
- Duan, L.L.; Mei, Y.; Zhang, D.; Zhang, Q.G.; Zhang, J.Z. Folding of a helix at room temperature is critically aided by electrostatic polarization of intraprotein hydrogen bonds. J. Am. Chem. Soc. 2010, 132, 11159–11164. [Google Scholar] [CrossRef] [PubMed]
- Lee, I.; Kim, S.; Lee, J. Folding models of mini-protein FSD-1. J. Phys. Chem. B 2012, 116, 6916–6922. [Google Scholar] [CrossRef] [PubMed]
- Wu, C.; Shea, J.E. On the origins of the weak folding cooperativity of a designed ββα ultrafast protein FSD-1. PLoS Comput. Biol. 2010, 6, 11. [Google Scholar] [CrossRef]
- Potts, J.T. Parathyroid hormone: Past and present. J. Enodocrinol. 2005, 187, 311–325. [Google Scholar] [CrossRef] [PubMed]
- Hansmann, U.H. Generalized-ensemble simulations of the human parathyroid hormone fragment PTH(1–34). J. Chem. Phys. 2004, 120, 417–422. [Google Scholar] [CrossRef] [PubMed]
- Dalby, A.; Shamsir, M.S. Molecular dynamics simulations of the temperature induced unfolding of crambin follow the arrhenius equation. F1000Research 2015, 4, 589. [Google Scholar] [CrossRef] [PubMed]
- Abaturov, L.V.; Nosova, N.G. Protein conformational dynamics of crambin in crystal, solution and in the trajectories of molecular dynamics simulations. Biofizika 2013, 58, 599–617. [Google Scholar] [CrossRef] [PubMed]
- Alsenoy, C.V.; Yu, C.; Peeters, A.; Martin, J.M.L.; Scha1fer, L. Ab initio geometry determinations of proteins. 1. Crambin. J. Phys. Chem. A 1998, 102, 2246–2251. [Google Scholar] [CrossRef]
- Schmidt, A.; Teeter, M.; Weckert, E.; Lamzin, V.S. Crystal structure of small protein crambin at 0.48 Å resolution. Acta Cryst. 2011, 67, 424–428. [Google Scholar] [CrossRef]
- Honda, S.; Akiba, T.; Kato, Y.; Sawada, Y.; Sekijima, M.; Ishimura, M.; Ooishi, A.; Watanabe, H.; Odahara, T.; Harata, K. Crystal structure of a ten-amino acid protein. J. Am. Chem. Soc. 2008, 130, 15327–15331. [Google Scholar] [CrossRef] [PubMed]
- Ryckaert, J.P.; Ciccotti, G.; Berendsen, H.J.C. Numerical integration of the cartesian equations of motion of a system with constraints: Molecular dynamics of n-alkanes. J. Comput. Phys. 1977, 23, 327–341. [Google Scholar] [CrossRef]
- Nguyen, H.; Roe, D.R.; Simmerling, C. Improved generalized Born solvent model parameters for protein simulations. J. Chem. Theory Comput. 2013, 9, 2020–2034. [Google Scholar] [CrossRef] [PubMed]
- Maier, J.A.; Martinez, C.; Kasavajhala, K.; Wickstrom, L.; Hauser, K.E.; Simmserling, C. ff14SB: Improving the accuracy of protein side chain and backbone parameters from ff99SB. J. Chem. Theory Comput. 2015, 11, 3696–3713. [Google Scholar] [CrossRef] [PubMed]
- Case, D.A.; Darden, T.A.; Cheatham, T.E., III; Simmerling, C.L.; Wang, J.; Duke, R.E.; Luo, R.; Walker, R.C.; Zhang, W.; Merz, K.M.; et al. Amber 12; University of California: San Francisco, CA, USA, 2017; Available online: http://ambermd.org/ (accessed on 11 October 2017).
- Kabsch, W.; Sander, C. Dictionary of protein secondary structure: Pattern recognition of hydrogen-bonded and geometrical features. Biopolymers 1983, 22, 2577–2637. [Google Scholar] [CrossRef] [PubMed]
- Ikebe, J.; Kamiya, N.; Ito, J.; Shindo, H.; Higo, J. Simulation study on the disordered state of an Alzheimer’s β amyloid peptide Aβ(12–36) in water consisting of random-structural, β-structural, and helical clusters. Protein Sci. 2007, 16, 1596–1608. [Google Scholar] [CrossRef] [PubMed]
- Prigozhin, M.; Gruebele, M. Microsecond folding experiments and simulations: A match is made. Phys. Chem. Chem. Phys. 2013, 15, 3372–3388. [Google Scholar] [CrossRef] [PubMed]
- Beaufays, J.; Lins, L.; Thomas, A.; Brasseur, R. In silico predictions of 3D structures of linear and cyclic peptides with natural and non-proteinogenic residues. J. Pept. Sci. 2012, 18, 17–24. [Google Scholar] [CrossRef] [PubMed]
- Kurimoto, E.; Kato, K.; Furuhashi, T. Alteration of assembling properties of coiled-coil domain in yeast cargo receptors Emp46p/47p and application to pH biosensor. Bull. Res. Inst. Meijo Univ. 2015, 20, 223–226. [Google Scholar]
- Seibert, M.M.; Patriksson, A.; Hess, B.; Spoel, D.V.D. Reproducible polypeptide folding and structure prediction using molecular dynamics simulations. J. Mol. Biol. 2005, 354, 173–183. [Google Scholar] [CrossRef] [PubMed]
Sample Availability: Samples of the compounds are not available from the authors. |


| Name | Number of Residues | PDB ID |
|---|---|---|
| Chignolin | 10 | 1UAO |
| CLN025 | 10 | - c |
| 2I9M | 17 | 2I9M |
| Trp-cage | 20 | 1L2Y |
| FSD-1 a | 28 | 1FSD |
| HPH b | 34 | 1ET1 |
| Crambin | 46 | 1CRN |
| Protein | 200 ns | 2000 ns |
|---|---|---|
| Chignolin | 1.338 | 0.433 |
| CLN025 | 0.501 | 0.380 |
| 2I9M | 0.791 | 0.670 |
| Trp-cage | 0.747 | 0.451 |
| FSD-1 | 2.906 | 2.906 |
| HPH | 3.258 | 0.744 |
| Crambin | 7.496 | 5.598 |
| Protein | 200 ns | 2000 ns |
|---|---|---|
| Chignolin | 3.982 | 4.123 |
| CLN025 | 4.180 | 4.186 |
| 2I9M | 3.834 | 2.902 |
| Trp-cage | 5.007 | 1.546 |
| FSD-1 | 8.313 | 7.460 |
| HPH | 10.206 | 12.345 |
| Crambin | 8.266 | 8.843 |
| Protein | Min | Average |
|---|---|---|
| Chignolin | 0.474 | 4.191 |
| CLN025 | 0.446 | 4.694 |
| 2I9M | 0.582 | 3.375 |
| Trp-cage | 0.485 | 1.966 |
| FSD-1 | 2.555 | 7.697 |
| HPH | 0.959 | 8.769 |
| Crambin | 3.898 | 7.595 |
© 2017 by the authors. Licensee MDPI, Basel, Switzerland. This article is an open access article distributed under the terms and conditions of the Creative Commons Attribution (CC BY) license (http://creativecommons.org/licenses/by/4.0/).
Share and Cite
Kato, K.; Nakayoshi, T.; Fukuyoshi, S.; Kurimoto, E.; Oda, A. Validation of Molecular Dynamics Simulations for Prediction of Three-Dimensional Structures of Small Proteins. Molecules 2017, 22, 1716. https://doi.org/10.3390/molecules22101716
Kato K, Nakayoshi T, Fukuyoshi S, Kurimoto E, Oda A. Validation of Molecular Dynamics Simulations for Prediction of Three-Dimensional Structures of Small Proteins. Molecules. 2017; 22(10):1716. https://doi.org/10.3390/molecules22101716
Chicago/Turabian StyleKato, Koichi, Tomoki Nakayoshi, Shuichi Fukuyoshi, Eiji Kurimoto, and Akifumi Oda. 2017. "Validation of Molecular Dynamics Simulations for Prediction of Three-Dimensional Structures of Small Proteins" Molecules 22, no. 10: 1716. https://doi.org/10.3390/molecules22101716