1. Introduction
As most Chinese medicinal herbs are obtained from crude plants, some are mixed with impurities in the collecting process, some are violently toxic, thus precluding their direct consumption, whereas others cannot produce the intended therapeutic effect without special treatment. Thus, they must be subjected to processing, such as parching, steaming and boiling, before clinical use. These processing methods are called ‘Pao Zhi’ in Chinese. The acknowledged theory of the seeds of herbal medicine used in traditional Chinese medicine is summarized as ‘Feng zi bi chao’, meaning that they must be parched or fried before clinical use. Why is parching necessary? The theoretical basis was discovered during the Ming Dynasty in Yizong Cuiyan [
1]. Ancient people believed that parching or frying the seeds could increase the levels of active compounds in the decoction. After a long period of evolution and transfer, seed herb medicinal processing rules have been developed. Although the purpose of parching or frying is not identical for every single seed, the increase in the dissolution rate of the effective components is the same.
Semen cassiae is the ripe seed of
Cassia obtusifolia L. or
Cassia tora L. of the family Leguminosae. It was initially recorded in Shennong Bencao Jing [
2], which is the earliest book of Chinese materia medica, during the Han Dynasty of China. In this monograph, Semen cassiae was described for use as a laxative and for reversing ‘‘liver fire’’ to improve vision. In addition, it has been widely used in Korea, Japan, India and many Southeast Asian countries as an herbal medicine or health tea for the treatment of a variety of ailments [
3,
4,
5]. Modern pharmacological studies indicate that Semen cassiae has hepatoprotective activities [
6], antioxidants activities [
7,
8], neuroprotective effects [
9,
10,
11] and antidiabetic effects [
12]. In the clinical practice of Chinese medicine, Semen cassiae is used as raw Semen cassiae (R-SC) and parched Semen cassiae (P-SC), both of which are recorded in Chinese Pharmacopoeia. P-SC, which was first described in Taiping Shenghui Fang [
13] during the Song Dynasty of China, has always been preferred by doctors. In addition, P-SC is generally associated with decreased purgative effects, making it suitable for elderly and infirm patients [
14]. Modern pharmacological studies also indicated that P-SC has decreased purgative effects compared with R-SC [
15]. A chemistry study identified anthraquinone aglycones, anthraquinone glycosides and naphthopyrone glycosides as the main constituents of Semen cassiae [
16,
17]. Changes of the clinical curative effect are assumed to be related to changes of the internal chemical composition, including qualitative and quantitative changes. In our previous study, we discovered that parching can increase the contents of three anthraquinone aglycones (aurantio-obtusin, chryso-obtusin, obtusifolin) and decrease the contents of three naphthopyrone glycosides (rubrofusarin gentiobioside, casside, cassiaside C) [
18]. However, the active compounds responsible for the therapeutic effects were generally the absorbed ingredients in vivo. Bioactive herbal compounds that exhibit considerable levels after administration are most likely to account for the pharmacological effects of herbal medicines and form the basis of therapeutic efficacy. Thus, studying the chemical composition of R-SC or P-SC is not sufficient to reveal the processing mechanism. Pharmacokinetic studies of R-SC and P-SC extract should be performed to further clarify the processing mechanism of Semen cassiae.
With its high selective and rapid analysis properties, ultra-high-performance liquid chromatography–tandem mass spectroscopy (UPLC–MS/MS) is widely used in pharmacokinetic analyses of many medicines. After oral administration of herbal medicines, the components in blood are extremely complex, and their concentrations are extremely low. Thus, UPLC–MS/MS had outstanding advantages for pharmacokinetic studies of natural medicines. Concerning the pharmacokinetic analysis of oral R-SC, UPLC–MS/MS exhibited feasibility for detecting some compounds of Semen cassiae such as aurantio-obtusin, chryso-obtusin and obtusin in the reported literature [
19,
20]. However, no studies of the pharmacokinetics of P-SC have been reported.
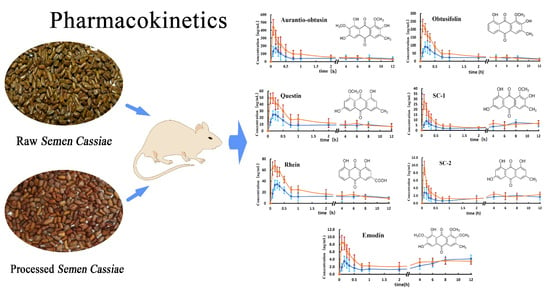
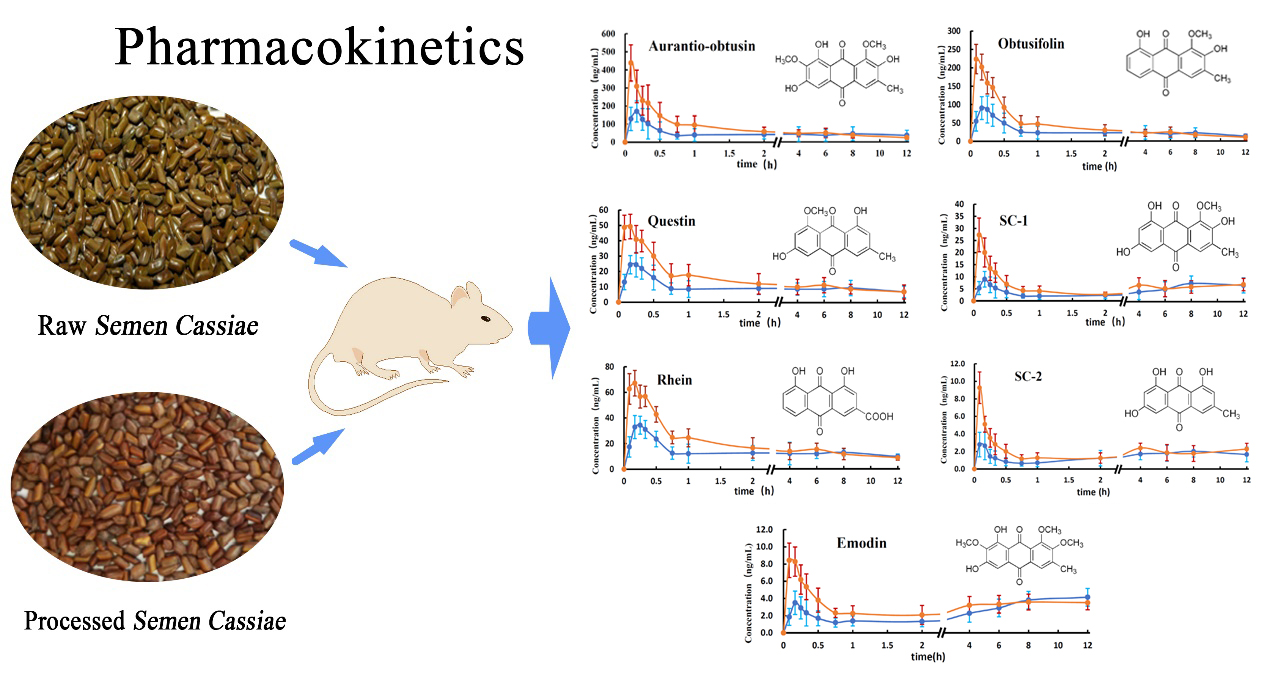
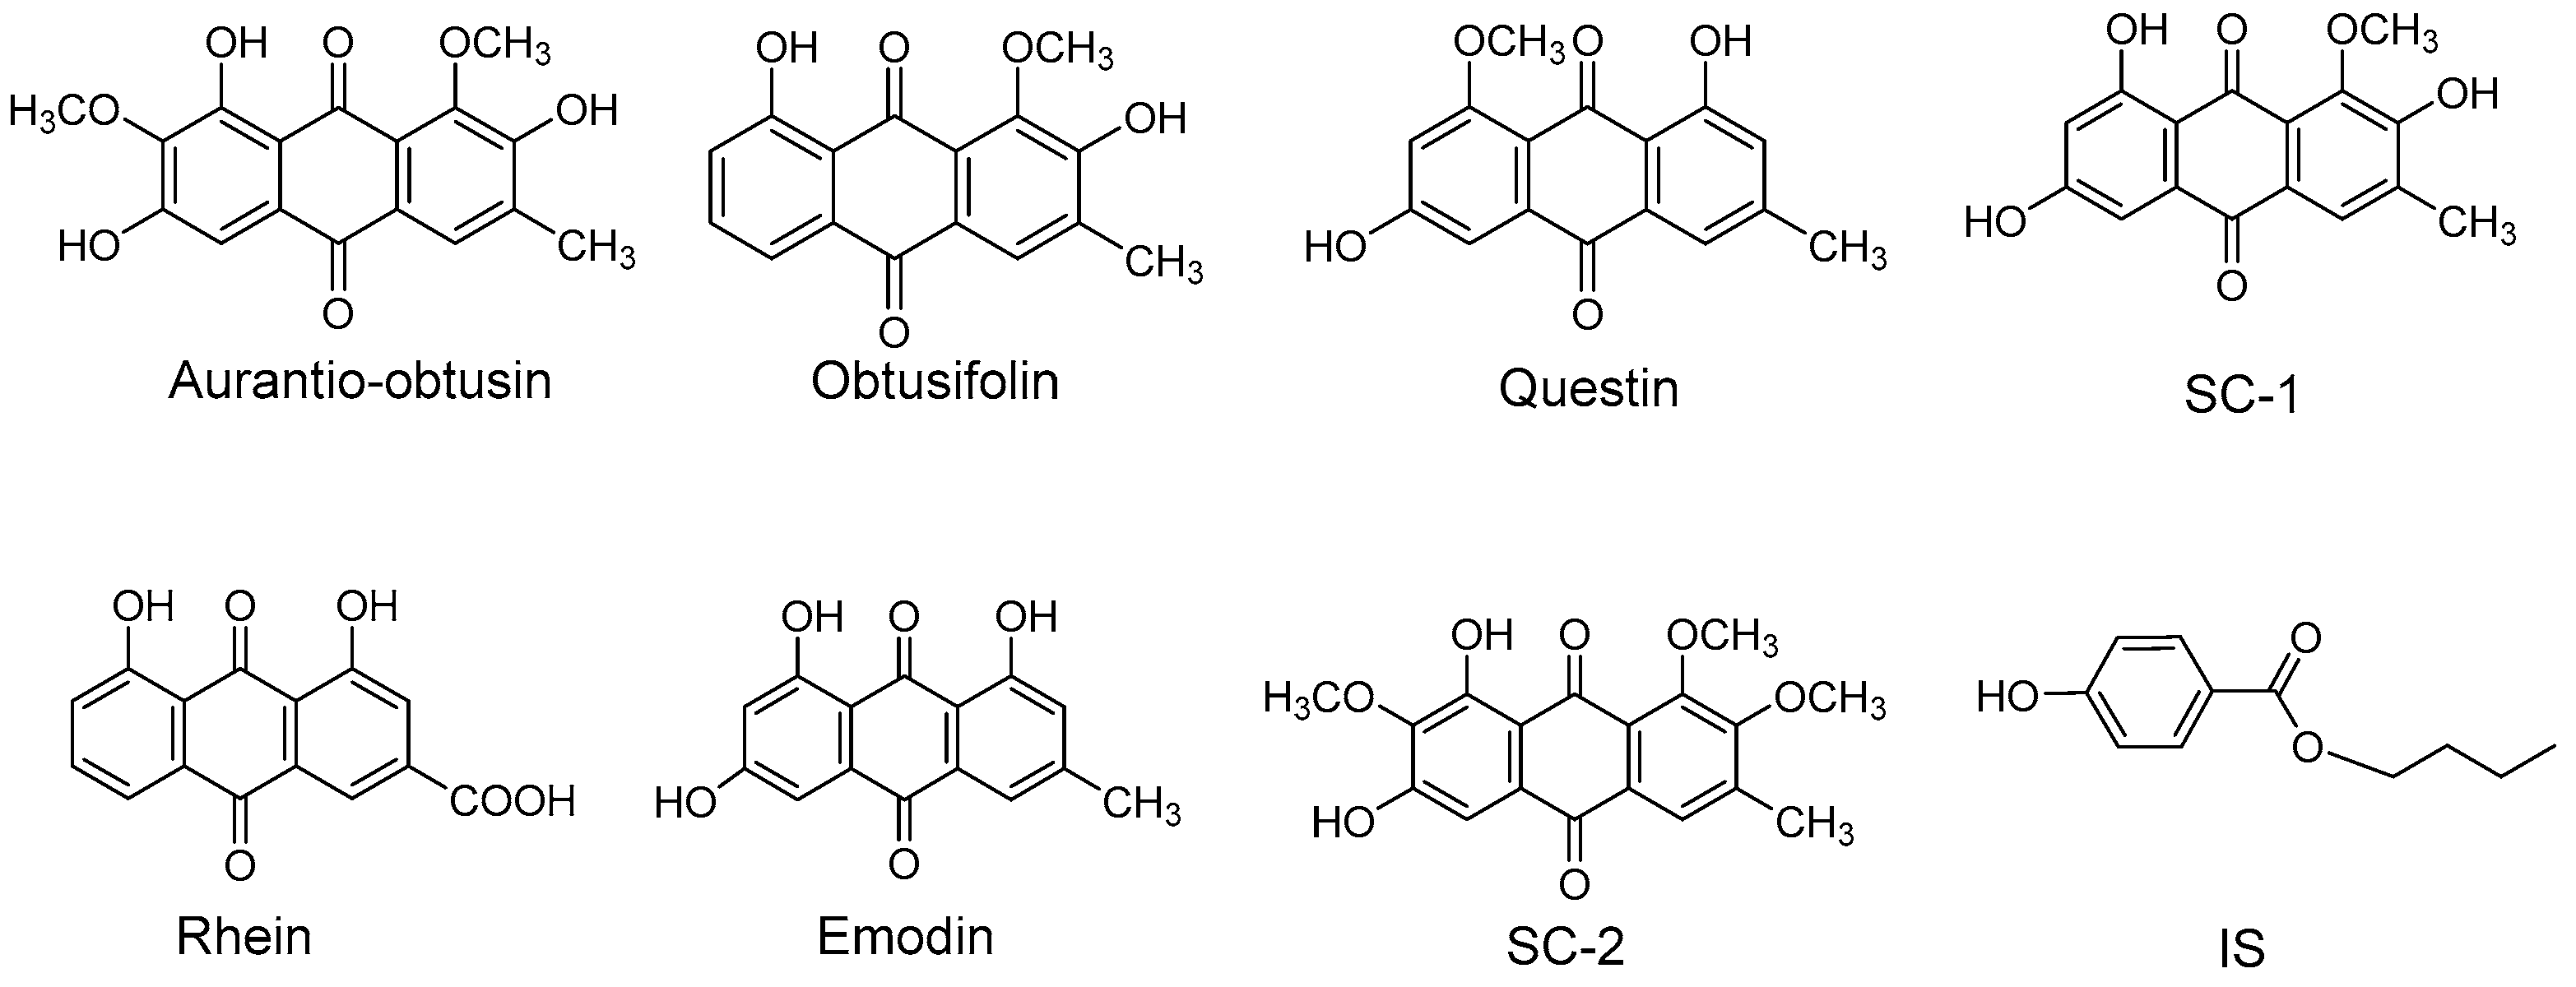
In this study, seven anthraquinone aglycones, namely aurantio-obtusin, obtusifolin, questin, 2-hydroxyemodin-1-methyl-ether (SC-1), rhein, emodin and 1,2,7-trimethoxyl-6,8-dihydroxy-3-methylanthraquinone (SC-2), were selected as quantitative components in plasma. All chemical structures are shown in
Figure 1. Next, a selective and sensitive UPLC–electrospray ionisation (ESI)–MS/MS method was developed for the simultaneous quantification of the seven compounds in rat plasma. The established method was then successfully applied to a pharmacokinetic study in male rats after the oral administration of R-SC and P-SC extracts.
For pharmacokinetic analyses, blood is usually collected from the orbital venous plexus, but this method results in the waste of blood and pain to the animals, including death. We used an automated blood sampler to collect blood from the rats. By programming the sample time and volumes, the exact peristaltic pump of the sampler will automatically collect blood samples from the jugular vein of rats via a catheter. The automated blood sampler increases the precision of sampling, avoids leakage and reduces wasting of blood samples. Anaesthesia is not needed, thus eliminating the effects of anaesthesia on pharmacokinetics. It also reduces the discomfort of animals during the experiment.
2. Results
2.1. Method Validation
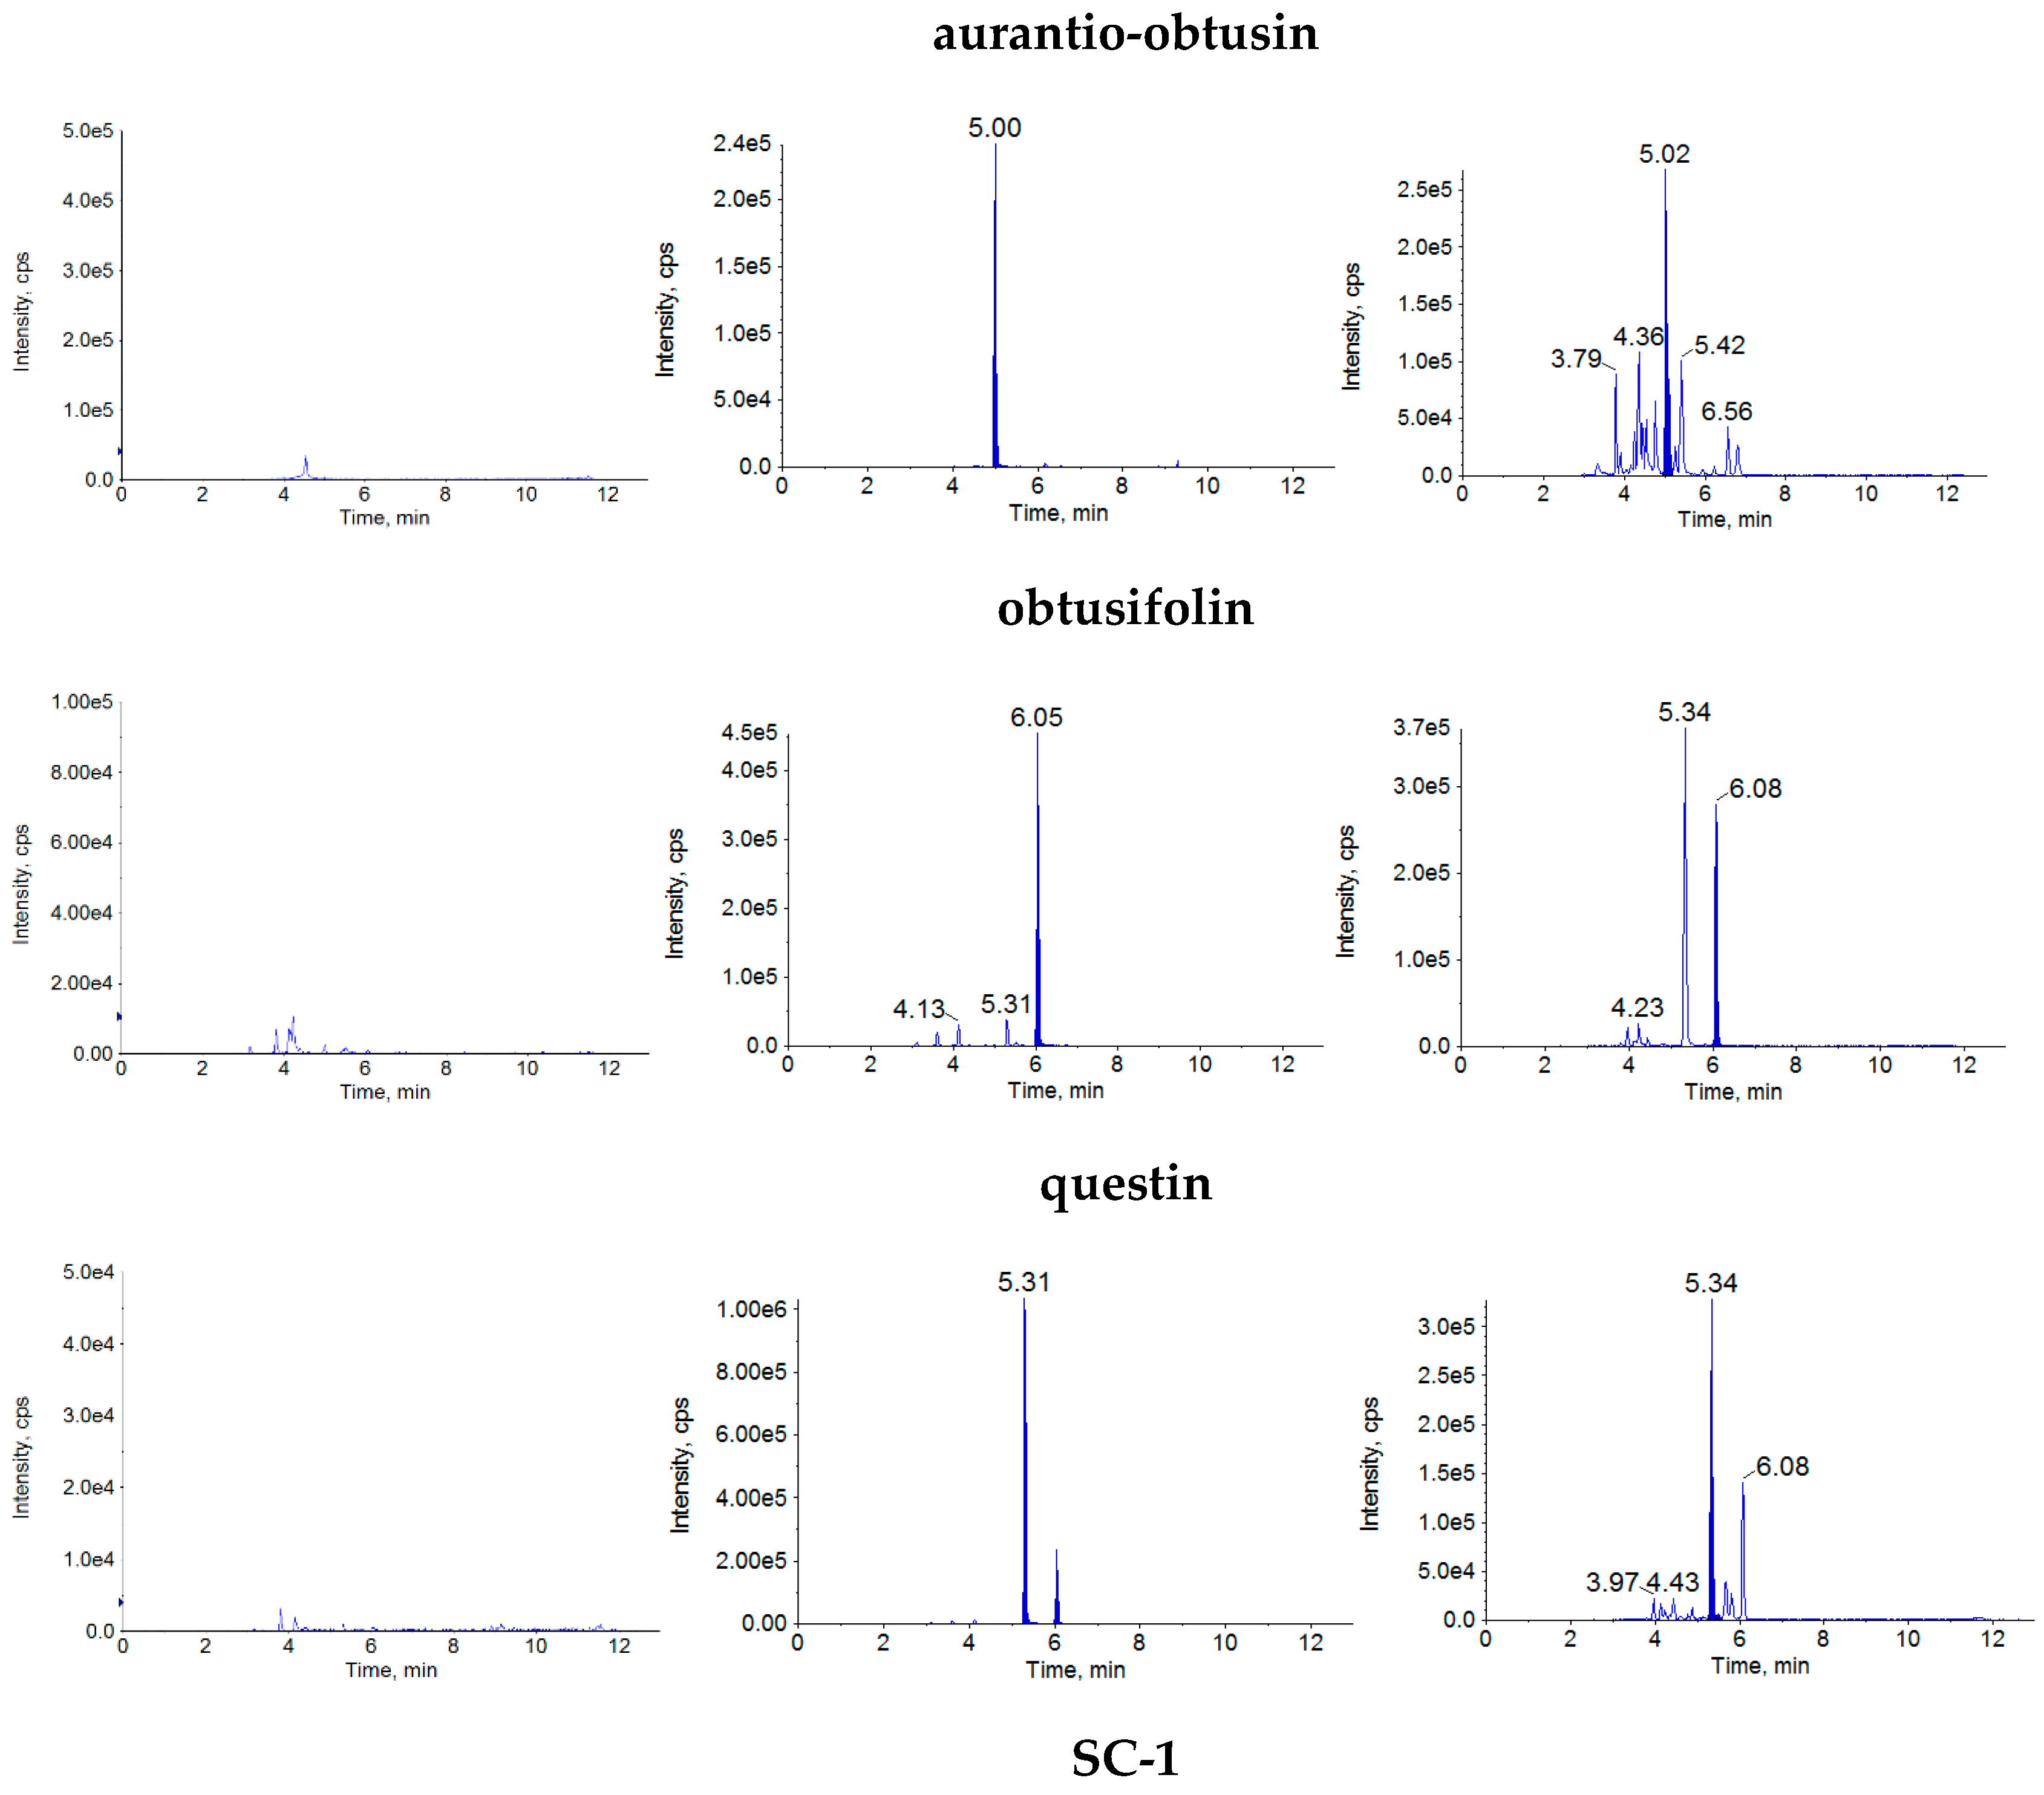
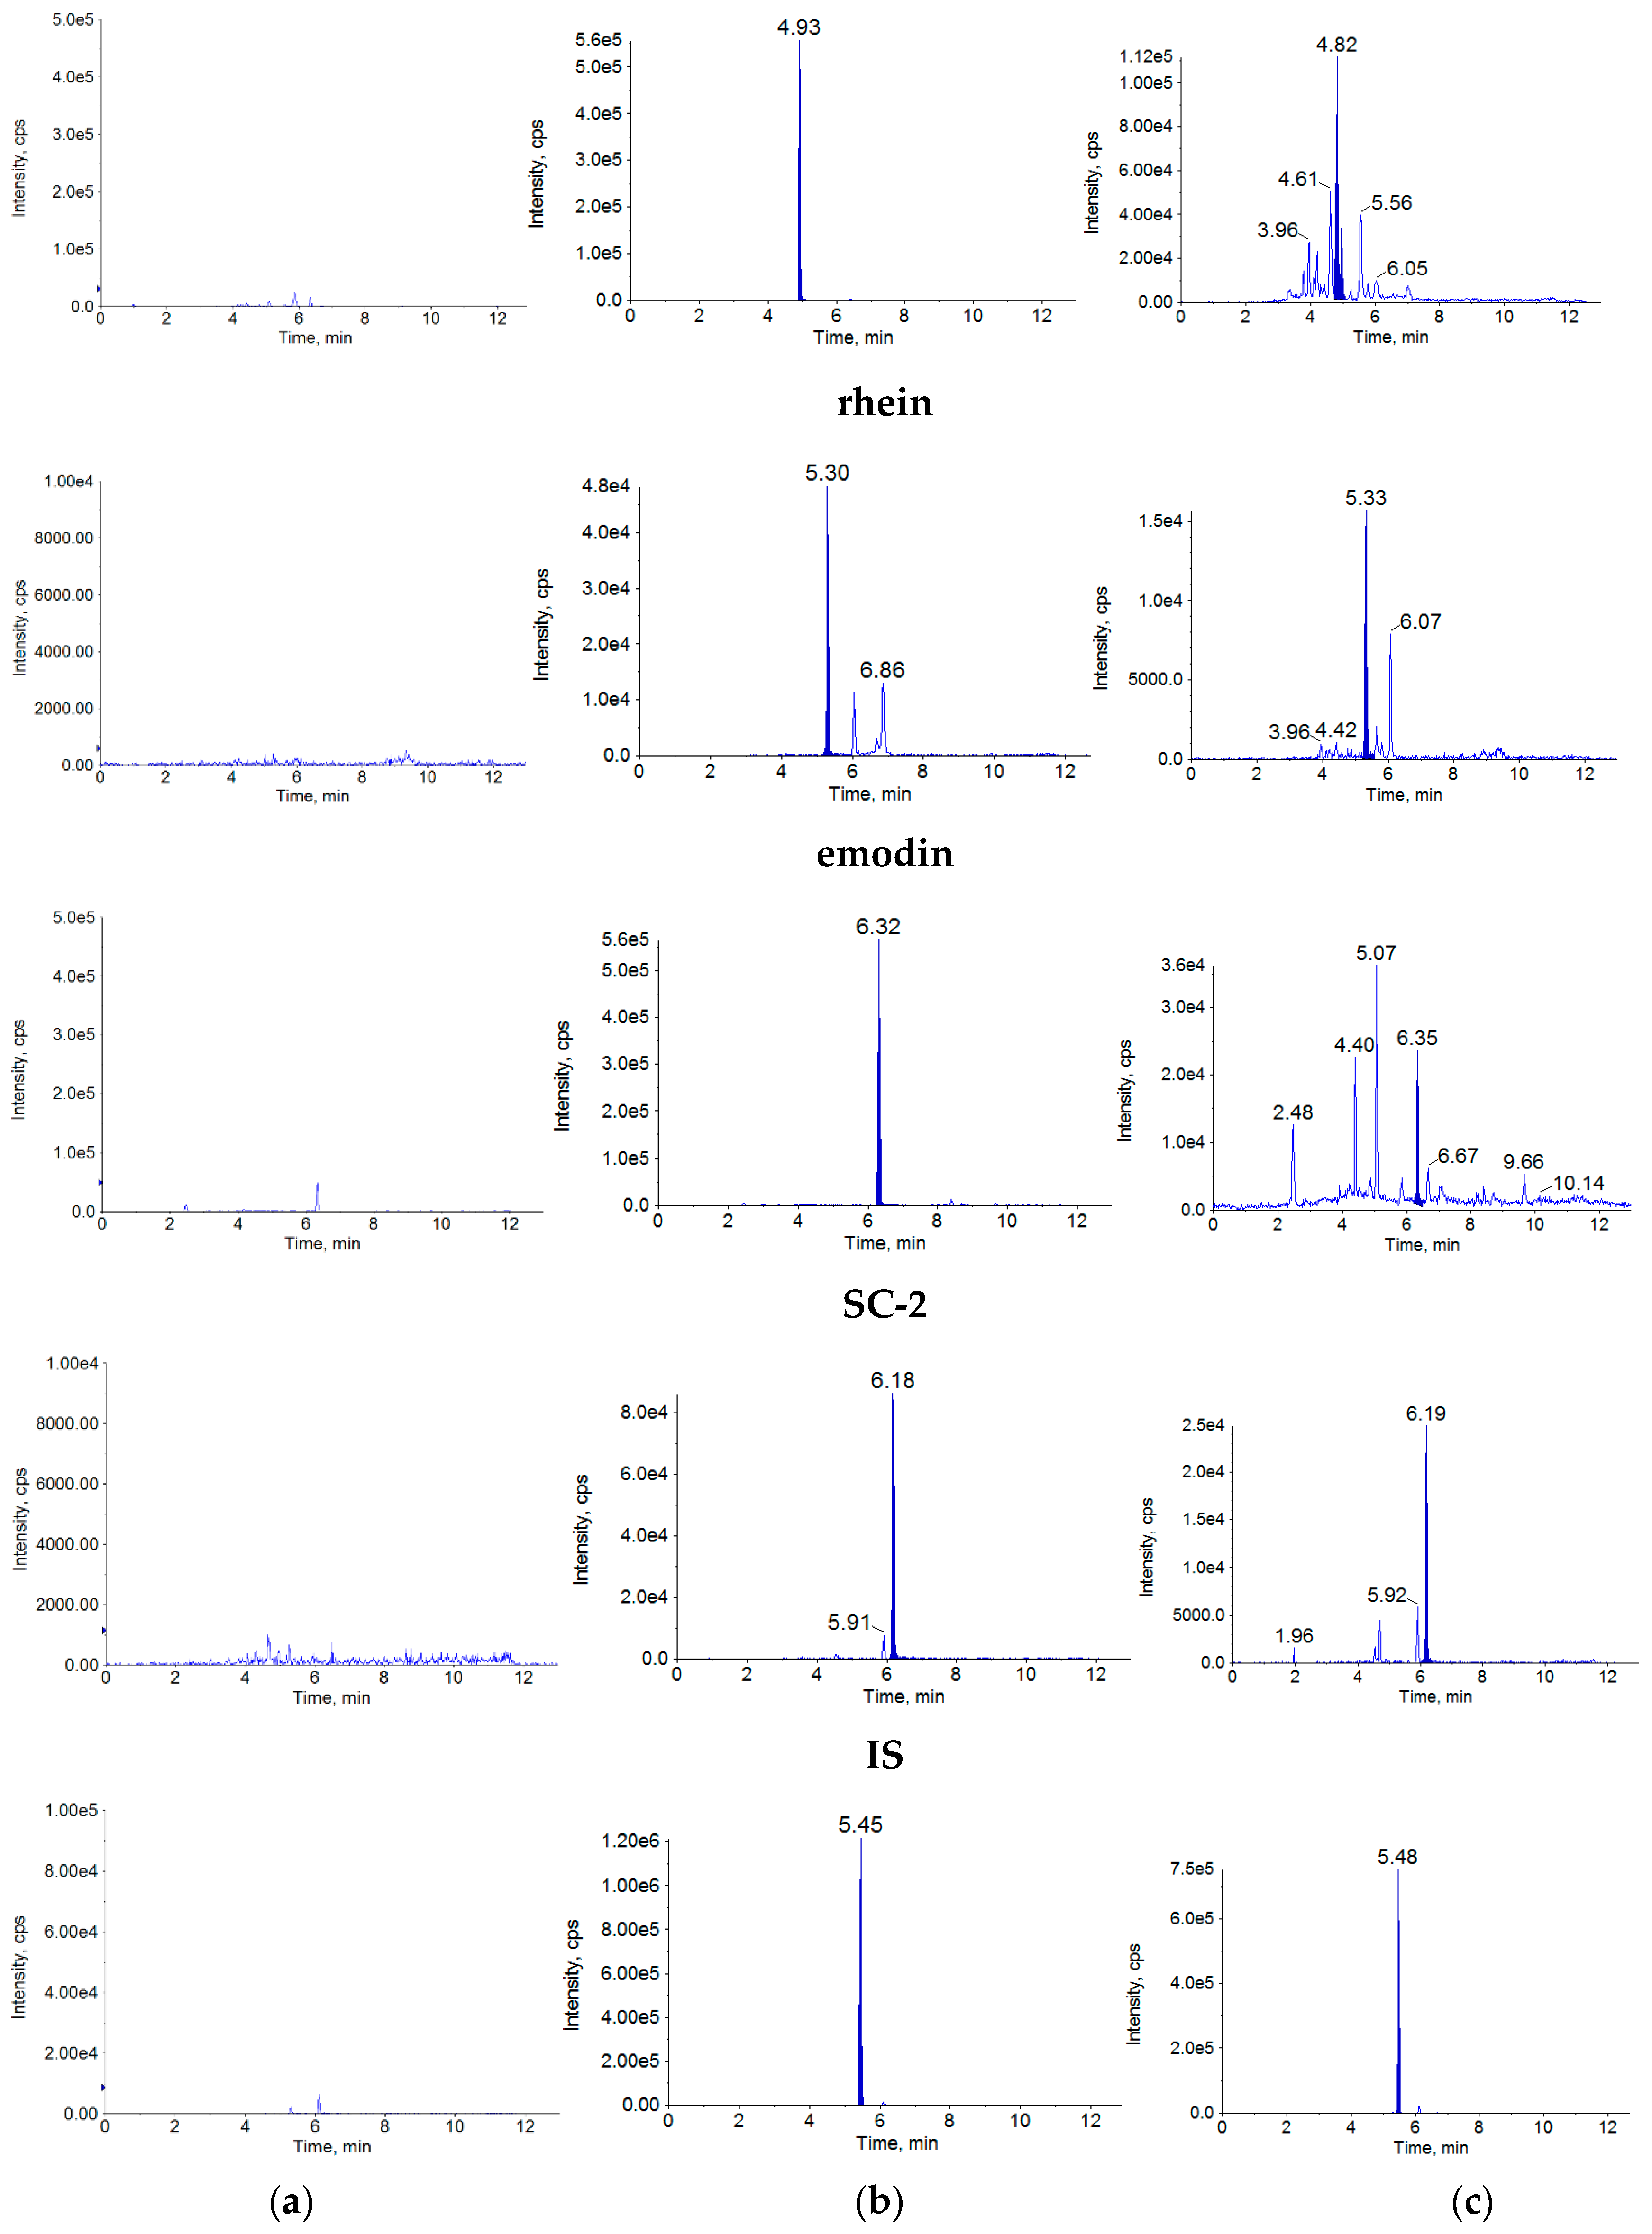
2.1.1. Specificity
The retention times were approximately 5.04 min for aurantio-obtusin, 6.09 min for obtusifolin, 5.34 min for questin, 4.96 min for SC-1, 5.34 min for rhein, 6.37 min for emodin, 6.22 min for SC-2 and 5.46 min for internal standard (IS). There was no obvious interference by endogenous substances (
Figure 2).
2.1.2. Linearity and LLOQ
The final concentrations of the calibration samples were in the ranges of 0.94–564.0 ng/mL for aurantio-obtusin, 1.03–410.0 ng/mL for obtusifolin, 0.84–84 ng/mL for questin, 1.03–82.80 ng/mL for SC-1, 1.07–203.0 ng/mL for rhein, 1.03–207.0 ng/mL for emodin and 0.9–180.0 ng/mL for SC-2. In the calibration equations, X is the plasma concentration of each analyte (ng/mL), Y is the peak-area ratio of each analyte to IS, and r is the correlation coefficient. All seven calibration curves exhibited good linearity for their corresponding analytes (r > 0.9964). The LLOQ values were 0.94 ng/mL for aurantio-obtusin, 1.03 ng/mL for obtusifolin, 0.84 ng/mL for questin, 1.03 ng/mL for SC-1, 1.07 ng/mL for rhein, 1.03 ng/mL for emodin and 0.90 ng/mL for SC-2. The results for the calibration curves, correlation coefficients and LLOQ of the analytes in rat plasma are shown in
Table 1.
2.1.3. Precision and Accuracy
The intra- and inter-day precisions and accuracies for the plasma samples are shown in
Table 2. For each QC sample, the intra- and inter-day precision values (RSD, %) were both less than 9%, and the accuracy (%) was in the range of 95–106%. These results demonstrated that the precision and accuracy were all within acceptable ranges, and this method proved to be accurate and precise.
2.1.4. Recovery and Matrix Effect
The recoveries and matrix effects of the seven analytes at three concentrations are shown in
Table 3. The recoveries of the analytes ranged 76–94%, and the matrix effects ranged 93–106%. The results indicated acceptable recoveries and matrix effects for the present method.
2.1.5. Stability Experiments
The stability data indicated that the seven analytes were all stable in plasma for all analyzed conditions, as shown in
Table 4.
2.2. Application to the Pharmacokinetic Study
The concentrations of the seven analytes in the R-SC and P-SC extracts were determined by UPLC–MS/MS. The results illustrated that the concentrations of the analytes in the R-SC and P-SC extracts were 578 and 918 μg/mL, respectively, for aurantio-obtusin, 178 and 352 μg/mL, respectively, for obtusifolin, 28 and 40 μg/mL, respectively, for questin, 96 and 163 μg/mL, respectively, for SC-1, 26 and 40 μg/mL, respectively, for rhein, 74 and 117 μg/mL, respectively, for emodin and 44 and 76 μg/mL, respectively, for SC-2.
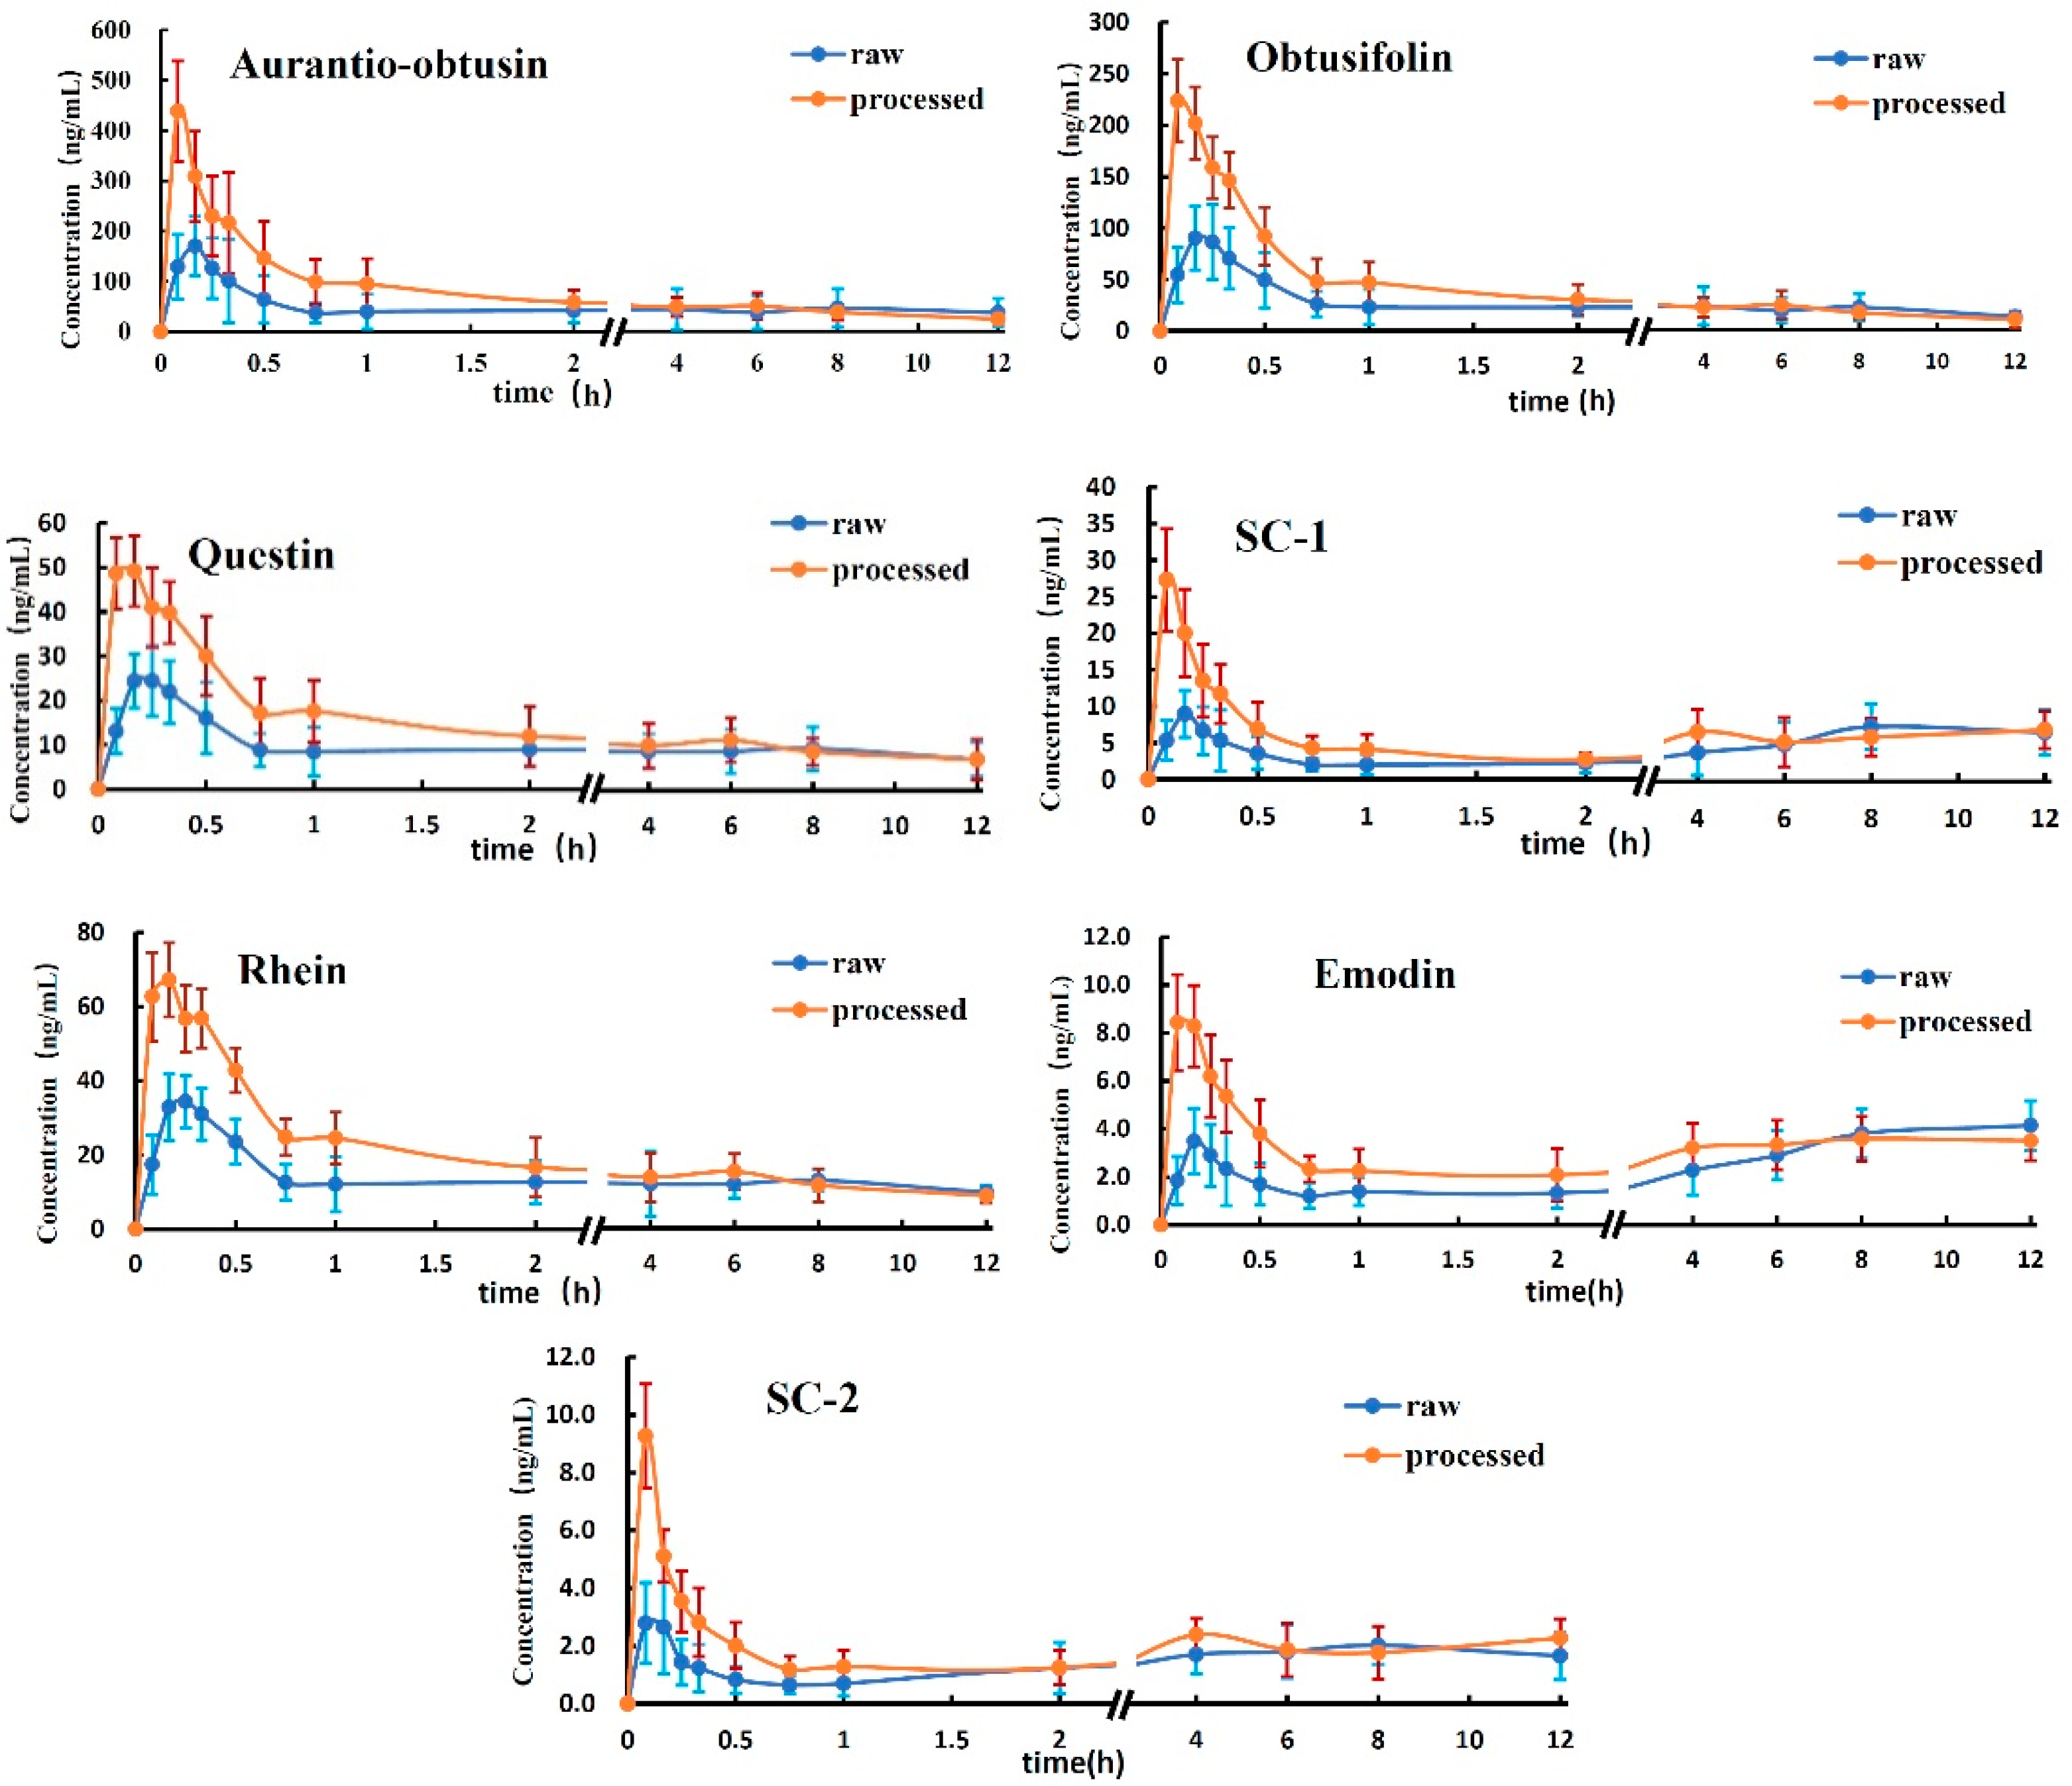
In this study, the validated analytical method was employed to determine the concentrations of the seven analytes in rat plasma after oral administration (gavage) of the R-SC and P-SC extracts. The mean plasma concentration–time profiles of the seven analytes are presented in
Figure 3. The pharmacokinetic parameters, including C
max, T
max, AUC
0-12, AUC
0-∞ and MRT
0-12 were calculated.
As shown in
Table 5, C
max was larger for all seven analytes in the P-SC group, with significant differences observed for aurantio-obtusin, obtusifolin, questin, SC-1 and rhein (
p < 0.05).
Regarding AUC, there were no significant differences in AUC0-∞ and AUC0-12 for the seven analytes between the P-SC and R-SC group. However, AUC0-12 was higher for all seven analytes in the P-SC group than in the R-SC group.
The mean Tmax and MRT0-12 values of the analytes were all smaller in the P-SC group than in the R-SC group. Specifically, Tmax for aurantio-obtusin and SC-1 and MRT0-12 for obtusifolin and rhein were significantly smaller in the P-SC group (p < 0.05).
4. Materials and Methods
4.1. Chemicals and Reagents
Aurantio-obtusin (No. 111900-201303, ≥99.1%) and rhein (No. 110757-200206, ≥99.3%) were purchased from the National Institutes for Food and Drug Control (Beijing, China). Obtusifolin, questin, SC-1, emodin were prepared in our laboratory [
22], and their structures were determined via comparisons of spectral data (UV, MS,
1H-NMR and
13C-NMR) with values reported in the literature. SC-2 was first isolated in our laboratory [
23]. The purity of these compounds was determined to be ≥98% by HPLC using the normalization method of peak area. Butyl 4-hydroxybenzoate ([IS], ≥98%, No: CHB-N-025) was purchased from Chengdu Chroma-Biotechnology Co., Ltd. (Chengdu, China). All chemicals were stored at 4 °C in our laboratory. Acetonitrile, methanol, water and formic acid (Fisher, Fair Lawn, NJ, USA) were of UPLC grade.
4.2. Instrument and Analytical Conditions
The UPLC–MS/MS system consisted of a Shimadzu LC-20AD series liquid chromatograph (Shimadzu, Kyoto, Japan) and a 5500 triple quadrupole mass spectrometer (Applied Bio-systems, AB Sciex, Framingham, MA, USA) equipped with an ESI source system. Data acquisition was performed using Analyst 1.6.2 software (AB MDS Sciex, Framingham, MA, USA). The automated blood sampler (Instech, Plymouth, PA, USA) was equipped with Instech Automated Blood Sampling System ABS212 Software Version 2.13.1 (Instech, Plymouth, PA, USA).
The separations were achieved on a Waters HSS T3 column (100 mm × 2.1 mm, 1.7 μm, Waters Corporation, Milford, MA, USA). The mobile phases consisted of 0.1% formic acid (A) and acetonitrile (B) using a gradient elution as follows: 90% to 75% A and 10% to 25% B (v/v) at 0–1 min; 75% to 30% A and 25% to 70% B (v/v) at 1–3 min; 30% to 10% A and 70% to 90% B (v/v) at 3–10 min; 10% to 90% A and 90% to 10% B (v/v) at 10–10.1 min; and 90% A and 10% B (v/v) at 10.1–13 min. The flow rate was set at 0.3 mL/min. The column oven temperature was kept at 40 °C. The injection volume was 1.0 μL. The full-scan mass spectra revealed that ionisation of the seven analytes was more efficient in the negative-ion mode than in positive-ion mode; thus, quantification was performed in the negative-ion mode. Quantification was performed using multiple reaction monitoring of the precursor product ion transition at m/z 329.1–314.0 for aurantio-obtusin, m/z 283.1–268.0 for obtusifolin, m/z 283.1–240.0 for questin, m/z 299.1–256.0 for SC-1, m/z 283.0–183.0 for rhein, m/z 269.0–225.1 for emodin, m/z 343.1–328.1 for SC-2 and m/z 193.0–136.0 for butyl 4-hydroxybenzoate. The other parameters of the mass spectrometer were as follows: curtain gas, 30.00 psi; collision gas, −2 psi; ion spray voltage, −4500.00 V; temperature, 550.00 °C; ion source gas 1, 55.00 psi; and ion source gas 2, 55.00 psi. The dwell time of each MRM transition was 300 ms.
4.3. Preparation of the R-SC and P-SC Extracts
R-SC was purchased from Bozhou TCM market (Anhui, China) and authenticated by Professor Zhuju Wang. R-SC was processed according to the procedure recorded in Chinese Pharmacopoeia to obtain P-SC (National Commission of Chinese Pharmacopoeia, 2015). Briefly, after heating a pan to 200 °C, R-SC was placed in the pan and constantly stirred for 5 min, after which the seeds were removed for cooling. The content determination standard of Chinese Pharmacopoeia (2015 edition) was achieved for both R-SC and P-SC. The voucher specimens (voucher no. R-SC 160708, P-SC 160905) are deposited at the herbarium of China Academy of Chinese Medical Science (Beijing, China).
To prepare the R-SC and P-SC extracts, 50 g of R-SC (or P-SC) dried powder were extracted under reflux with 500 mL of 75% methanol for 1 h and then filtrated. Approximately 5 mL of the filtrate were stored at 4 °C for quantitative analysis. Then, 415 mL of the filtrate were evaporated to dryness, and the dense extract was dissolved in water to obtain 23 mL of the R-SC (or P-SC) extract for oral administration.
4.4. Preparation of Combined Standard Stock Solution and IS Solution
The combined standard stock solution of aurantio-obtusin (11.3 μg/mL), obtusifolin (12.3 μg/mL), questin (10.1 μg/mL), SC-1 (12.4 μg/mL), rhein (12.8 μg/mL), emodin (12.4 μg/mL) and SC-2 (10.1 μg/mL) was prepared in methanol, as was the IS solution (104 ng/mL). All solutions were stored at 4 °C.
4.5. Preparation of Calibration Standard and Quality Control (QC) Samples
The combined standard stock solution was further diluted in methanol to produce a series of standard working solutions. Calibration standards were prepared by spiking 100 μL of the standard working solutions into 100 μL blank plasma to yield calibration concentration of 0.94–564.0 ng/mL for aurantio-obtusin, 1.03–410.0 ng/mL for obtusifolin, 0.84–84.0 ng/mL for questin, 1.03–82.80 ng/mL for SC-1, 1.07–203.0 ng/mL for rhein, 1.03–207.0 ng/mL for emodin, 0.90–180.0 ng/mL for SC-2. The QC samples were prepared in blank plasma at three concentrations (low, medium and high), which were 1.88, 18.8 and 94 ng/mL for aurantio-obtusin; 2.05, 20.5 and 103 ng/mL for obtusifolin; 1.68, 16.8 and 84 ng/mL for questin; 2.07, 20.7 and 103 ng/mL for SC-1; 2.13, 21.3 and 107 ng/mL for rhein; 2.07, 20.7 and 207 ng/mL for emodin and 1.8, 18.0 and 90 ng/mL for SC-2.
4.6. Plasma Samples Preparation
To a 100-μL aliquot of plasma, 100 μL of the IS working solution were added and vortexed for 30 s. Next, 400 μL of acetonitrile were added, vortexed for 1 min and centrifuged for 10 min at 10,000 rpm. Then, the supernatant were transferred to a 1.5-mL centrifuge tube and evaporated to dryness under a stream of nitrogen gas at 40 °C. The dried residue was reconstituted in 100 μL of methanol, vortexed for 1 min and centrifuged at 10,000 rpm for 10 min. Then, a 1.0-μL aliquot of each sample was injected into the UPLC–MS/MS system for calibration analysis.
4.7. Method Validation
The method was validated for specificity, linearity, lower limit of quantification (LLOQ), accuracy and precision, recovery, matrix effect and stability in accordance with the requirements of the bioanalytical method validation guidelines of the USA Food and Drug Administration (FDA) and registration guidelines for new drugs in China.
4.7.1. Specificity
The specificity of this method was evaluated by comparing the chromatograms of the blank plasma samples from six individual rats, blank plasma spiked with the seven analytes and IS and plasma samples obtained from the rats after the oral administration of the R-SC and P-SC extracts.
4.7.2. Linearity and LLOQ
Calibration samples were injected into the UPLC–MS/MS system for calibration analysis. The calibration curves were constructed by plotting the ratio of the chromatographic peaks area (analytes/IS) versus the concentration of these analytes using the least-squares linear regression method to calculate the calibration equation and regression parameters. LLOQ was defined as the lowest concentration on the calibration curve with acceptable precision and accuracy.
4.7.3. Precision and Accuracy
Precision and accuracy were assessed via replicate analysis (n = 6) of QC samples at high, medium and low concentrations on the same day (intra-day) and on 3 different days (inter-day). The actual concentration of each QC sample was obtained using calibration curves prepared the same day. The intra-day and inter-day precisions were expressed as the relative standard deviation (RSD), and the accuracy was defined by comparing the measured concentration using calibration curves with its nominal value.
4.7.4. Recovery and Matrix Effect
To determine recovery and the matrix effect, processed, non-processed (pure sample freshly prepared in methanol) and post-processed spiked samples at the three QC concentrations were analysed. Recovery was determined at the three QC concentrations with six replicates by comparing the observed peak areas of processed plasma samples with those of non-processed samples. The matrix effect was evaluated by comparing the peak areas of the analytes in post-processed spiked samples with those of the analytes in non-processed samples at the same theoretical concentrations.
4.7.5. Stability Experiments
The stability of analytes in plasma was assessed by analysing QC samples (high, medium and low concentrations) under following conditions: room temperature for 4 h, autosampler for 24 h, three freeze/thaw cycles (from −20 °C to ambient temperature) and long-term stability (storage at −20 °C for 3 weeks). Stability was expressed as percentage of the remaining concentration.
4.8. Application of Method and Pharmacokinetic Study
Male Sprague–Dawley rats (body weight, 310 ± 20 g) were purchased from the Peking University Health Science Center (Beijing, China) and adapted under 65% relative humidity at 25 °C for 5 days. The animal handling procedures were approved by the Institutional ethical committee China Academy of Chinese Medical Science (approval No.: 2016090110). The animals were allowed free access to water but were fasted for 12 h before the experiment. Twelve rats were divided into two groups randomly (R-SC and P-SC groups). The rats were orally administered 18.0 g/kg R-SC or P-SC extract. Through an operation in the neck of the rat, a catheter was inserted to the jugular vein of the rat, thus the automated blood sampler could collect blood from the rat. The rat could free to move and kept awake. Blood samples (approximately 300 μL) were collected in heparinized tubes from each rat before and after oral administration at 0.083, 0.167, 0.25, 0.333, 0.5, 0.75, 1, 2, 4, 6, 8 and 12 h, using an automated blood sampler. The lost blood volume during collection was replaced with normal saline to prevent fluid loss from the animal.
Blood samples were centrifuged at 3000 rpm for 5 min, and 100 μL of plasma were finally obtained and stored at −80 °C until analysis.
4.9. Assay Application and Statistical Methods
All pharmacokinetic parameters were calculated using DAS 3.0 software (DAS 3.0, Mathematical Pharmacology Professional Committee of China, Shanghai, China). And the pharmacokinetic parameters were performed a non-compartmental analysis, including the maximum concentration (Cmax), the time to reach the maximum concentration (Tmax), area under the concentration–time curve (AUC0-t and AUC0-∞) and mean residence time (MRT0-t). Each value is expressed as the mean ± SD.
All the data were checked and all of them were of normal distribution. And the analyses were performed using a t-test with SPSS 21.0 (SPSS Inc., Chicago, IL, USA). Values were considered significantly different at p < 0.05.


