Ginger and Propolis Exert Neuroprotective Effects against Monosodium Glutamate-Induced Neurotoxicity in Rats

 and
and
Abstract
:1. Introduction
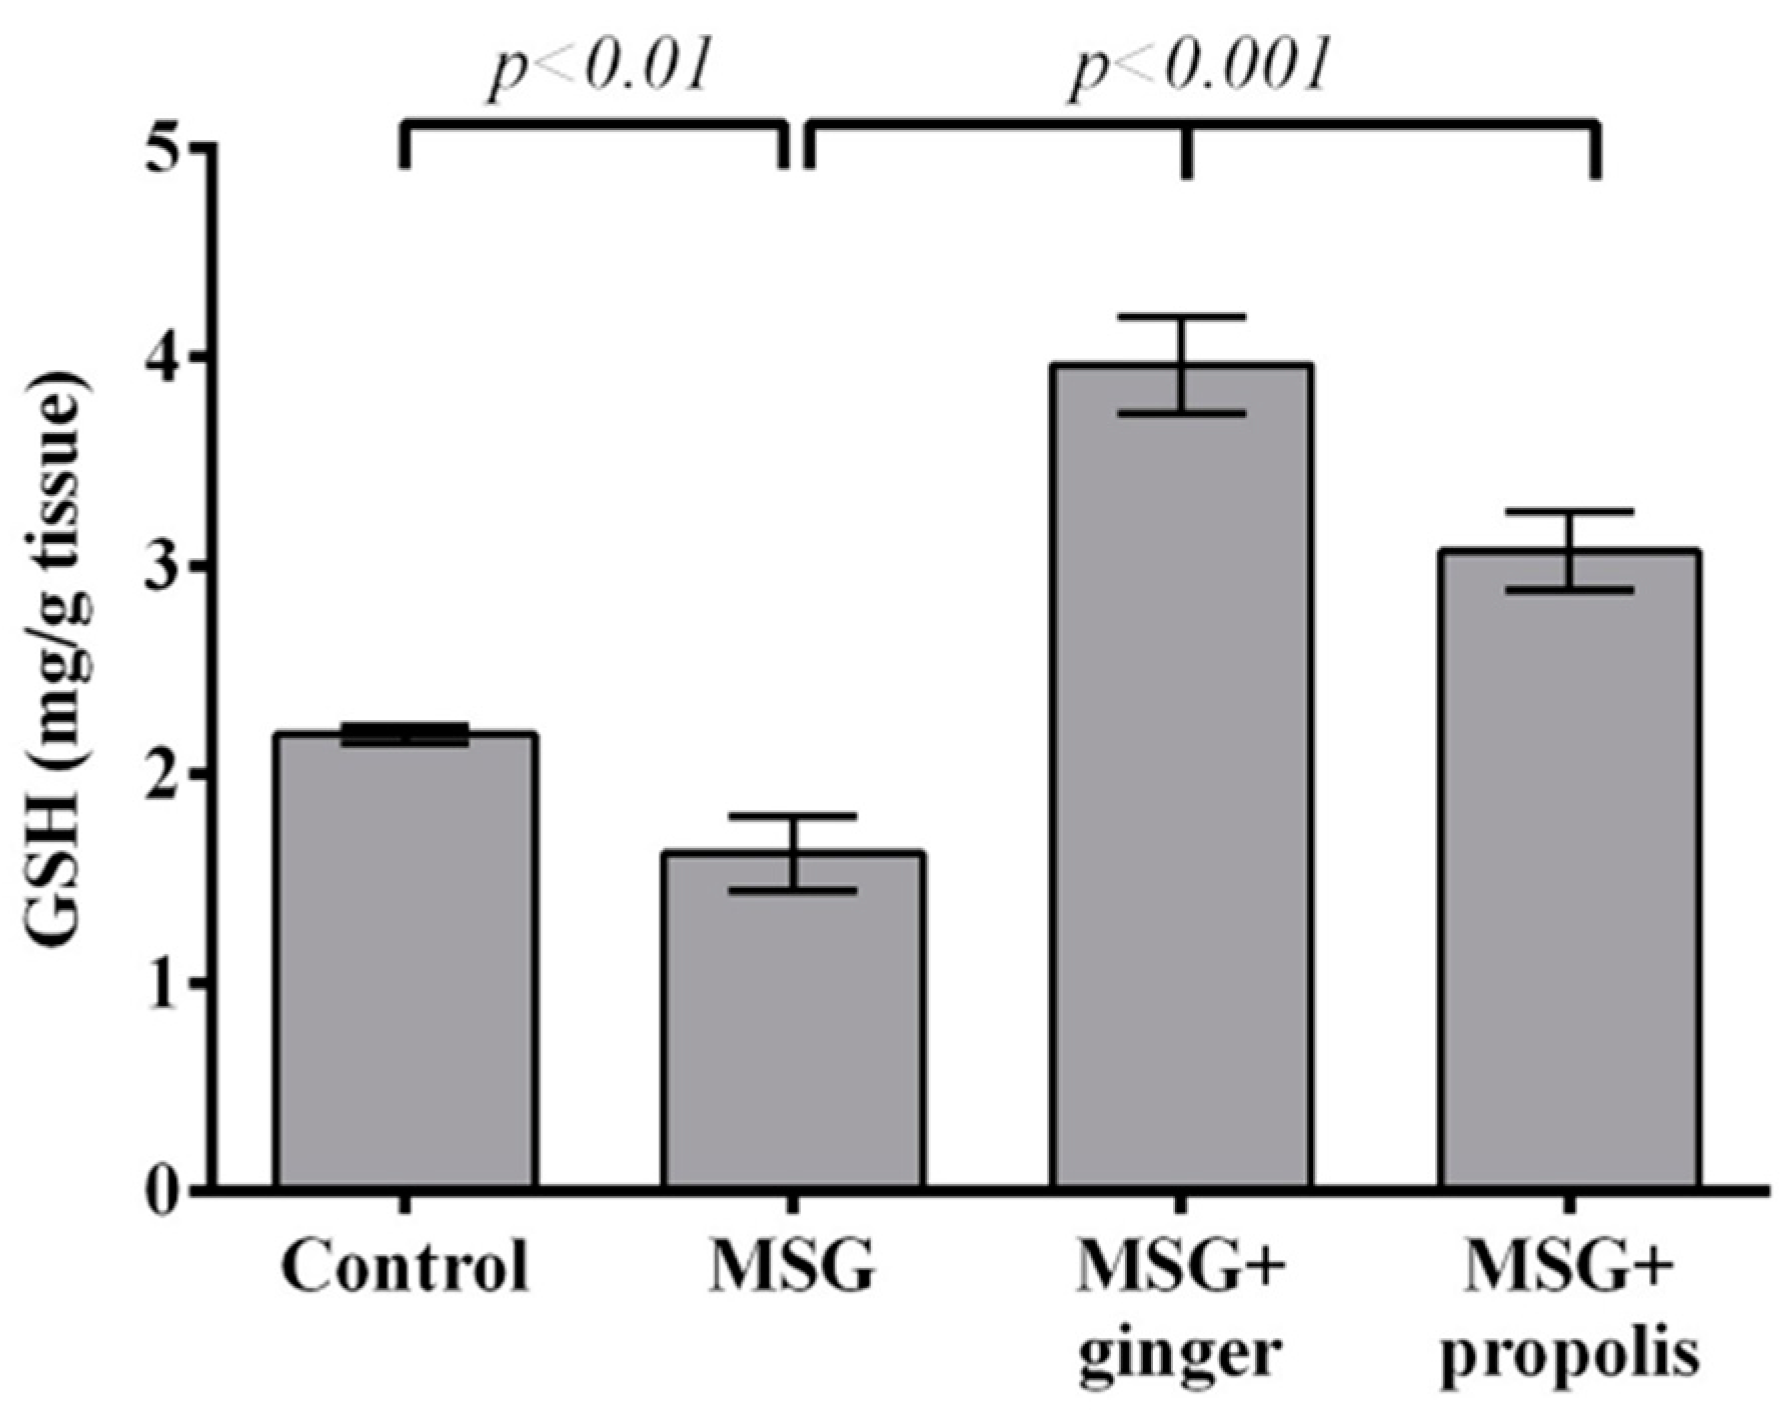
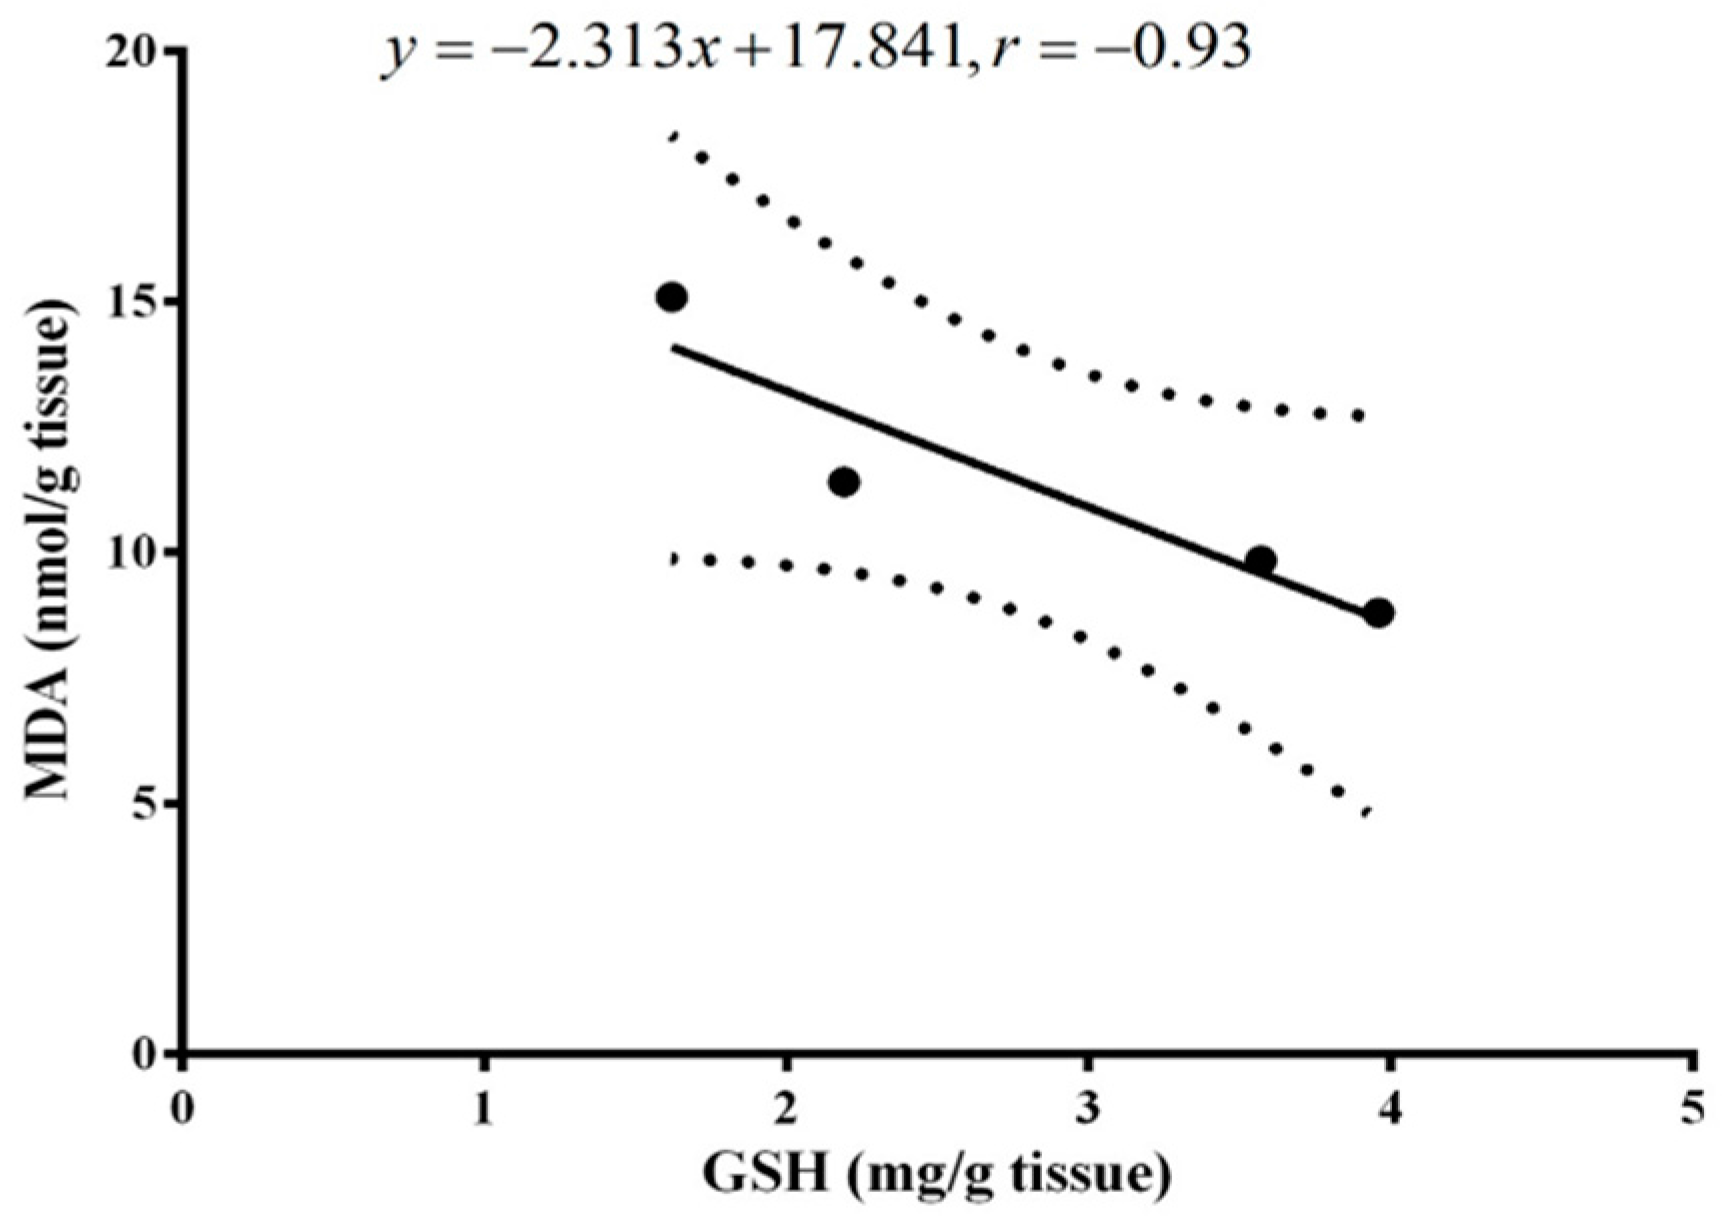
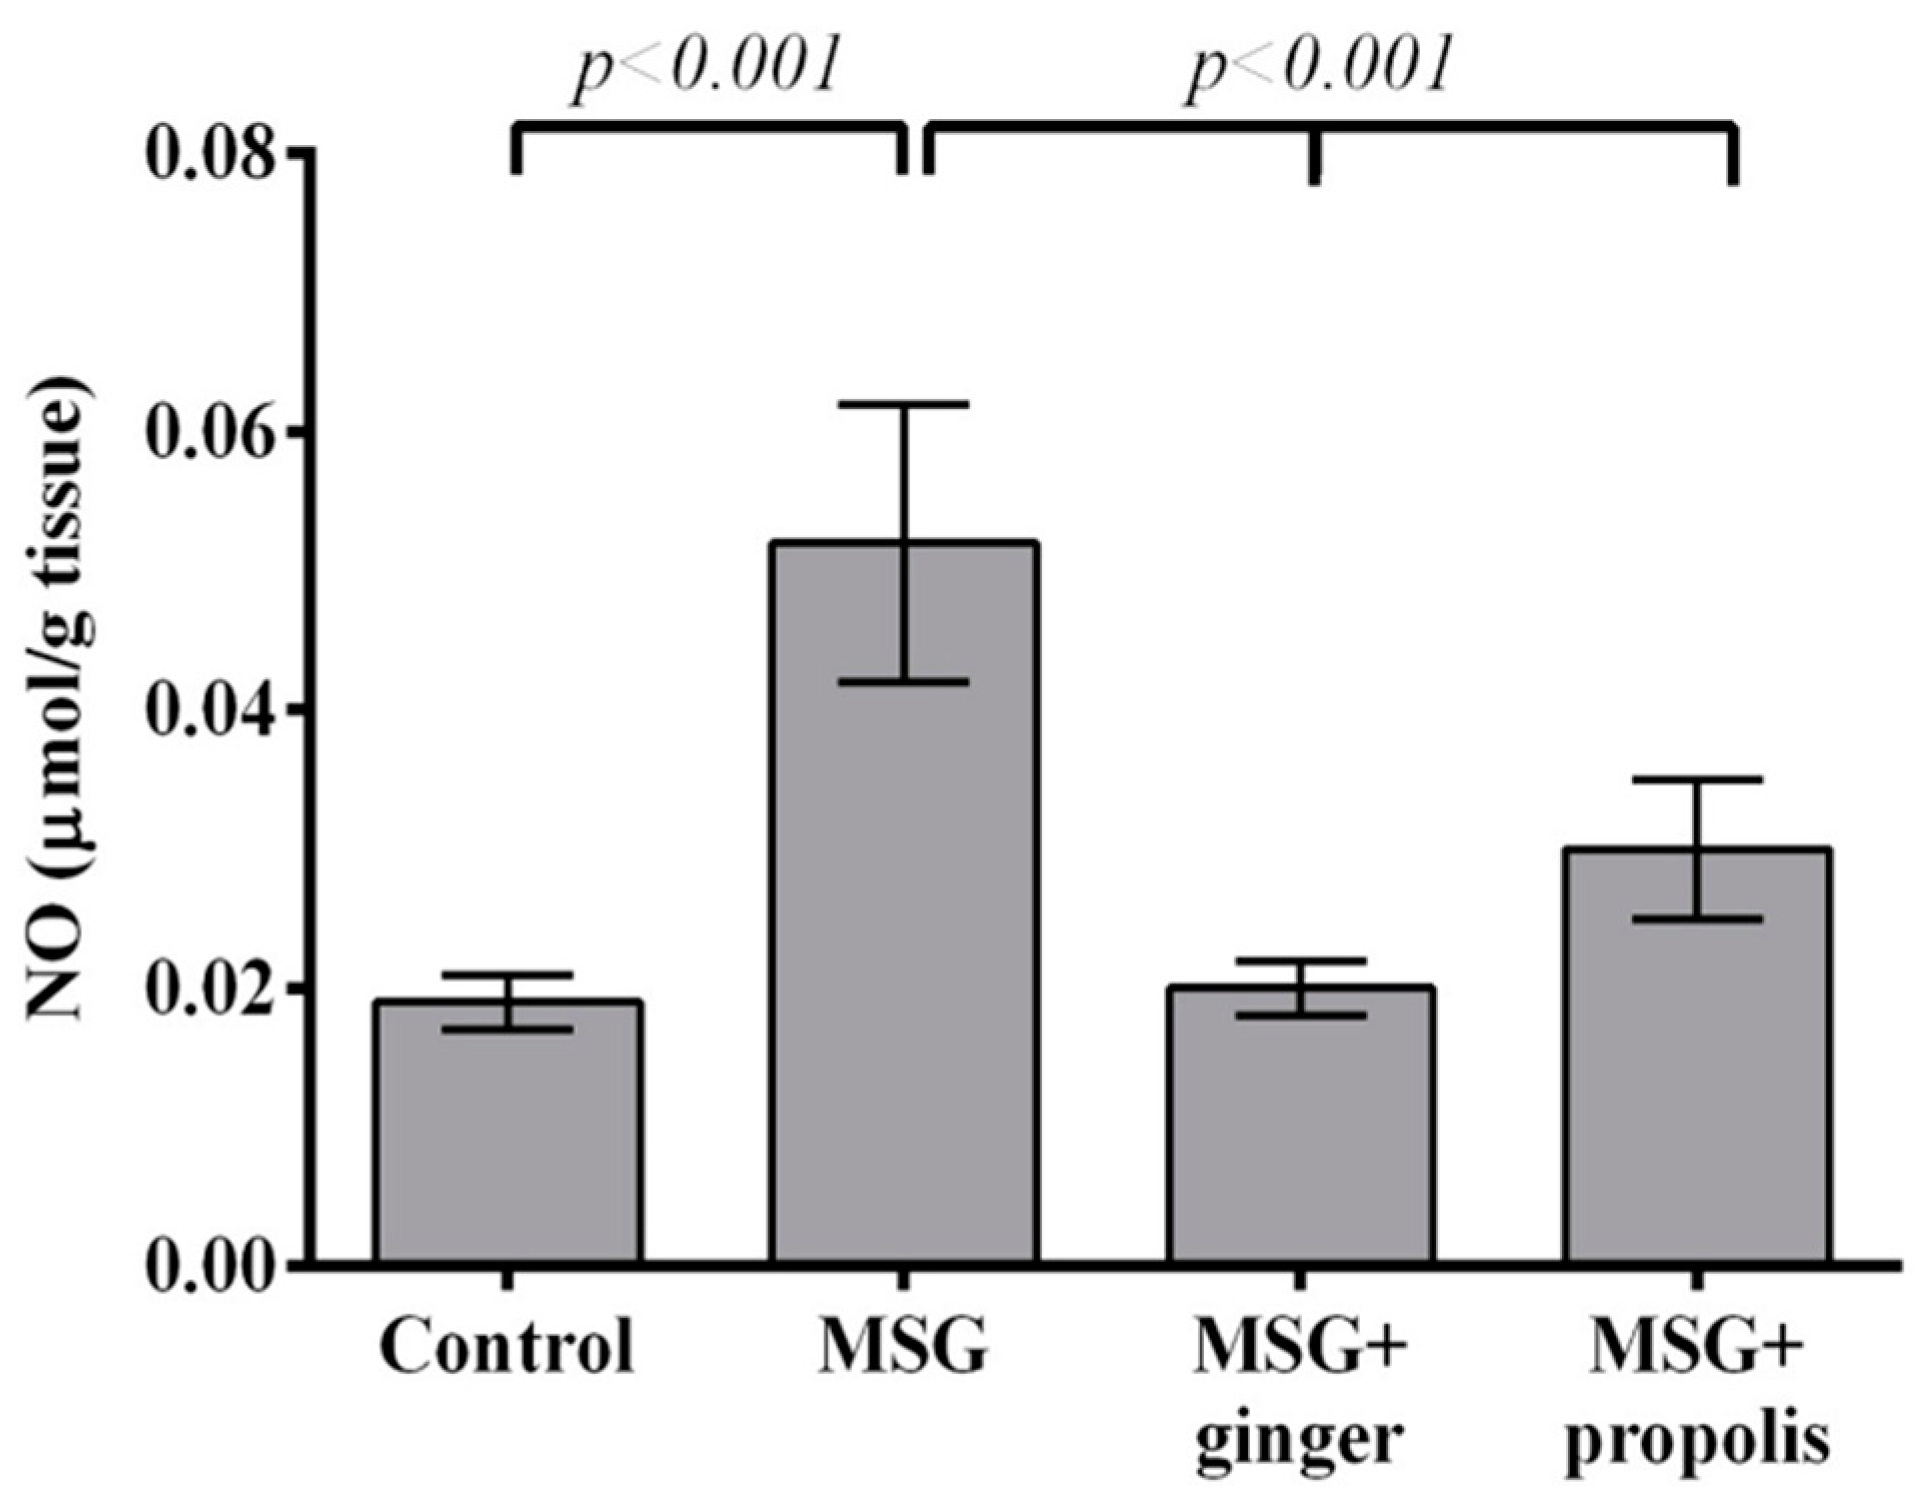
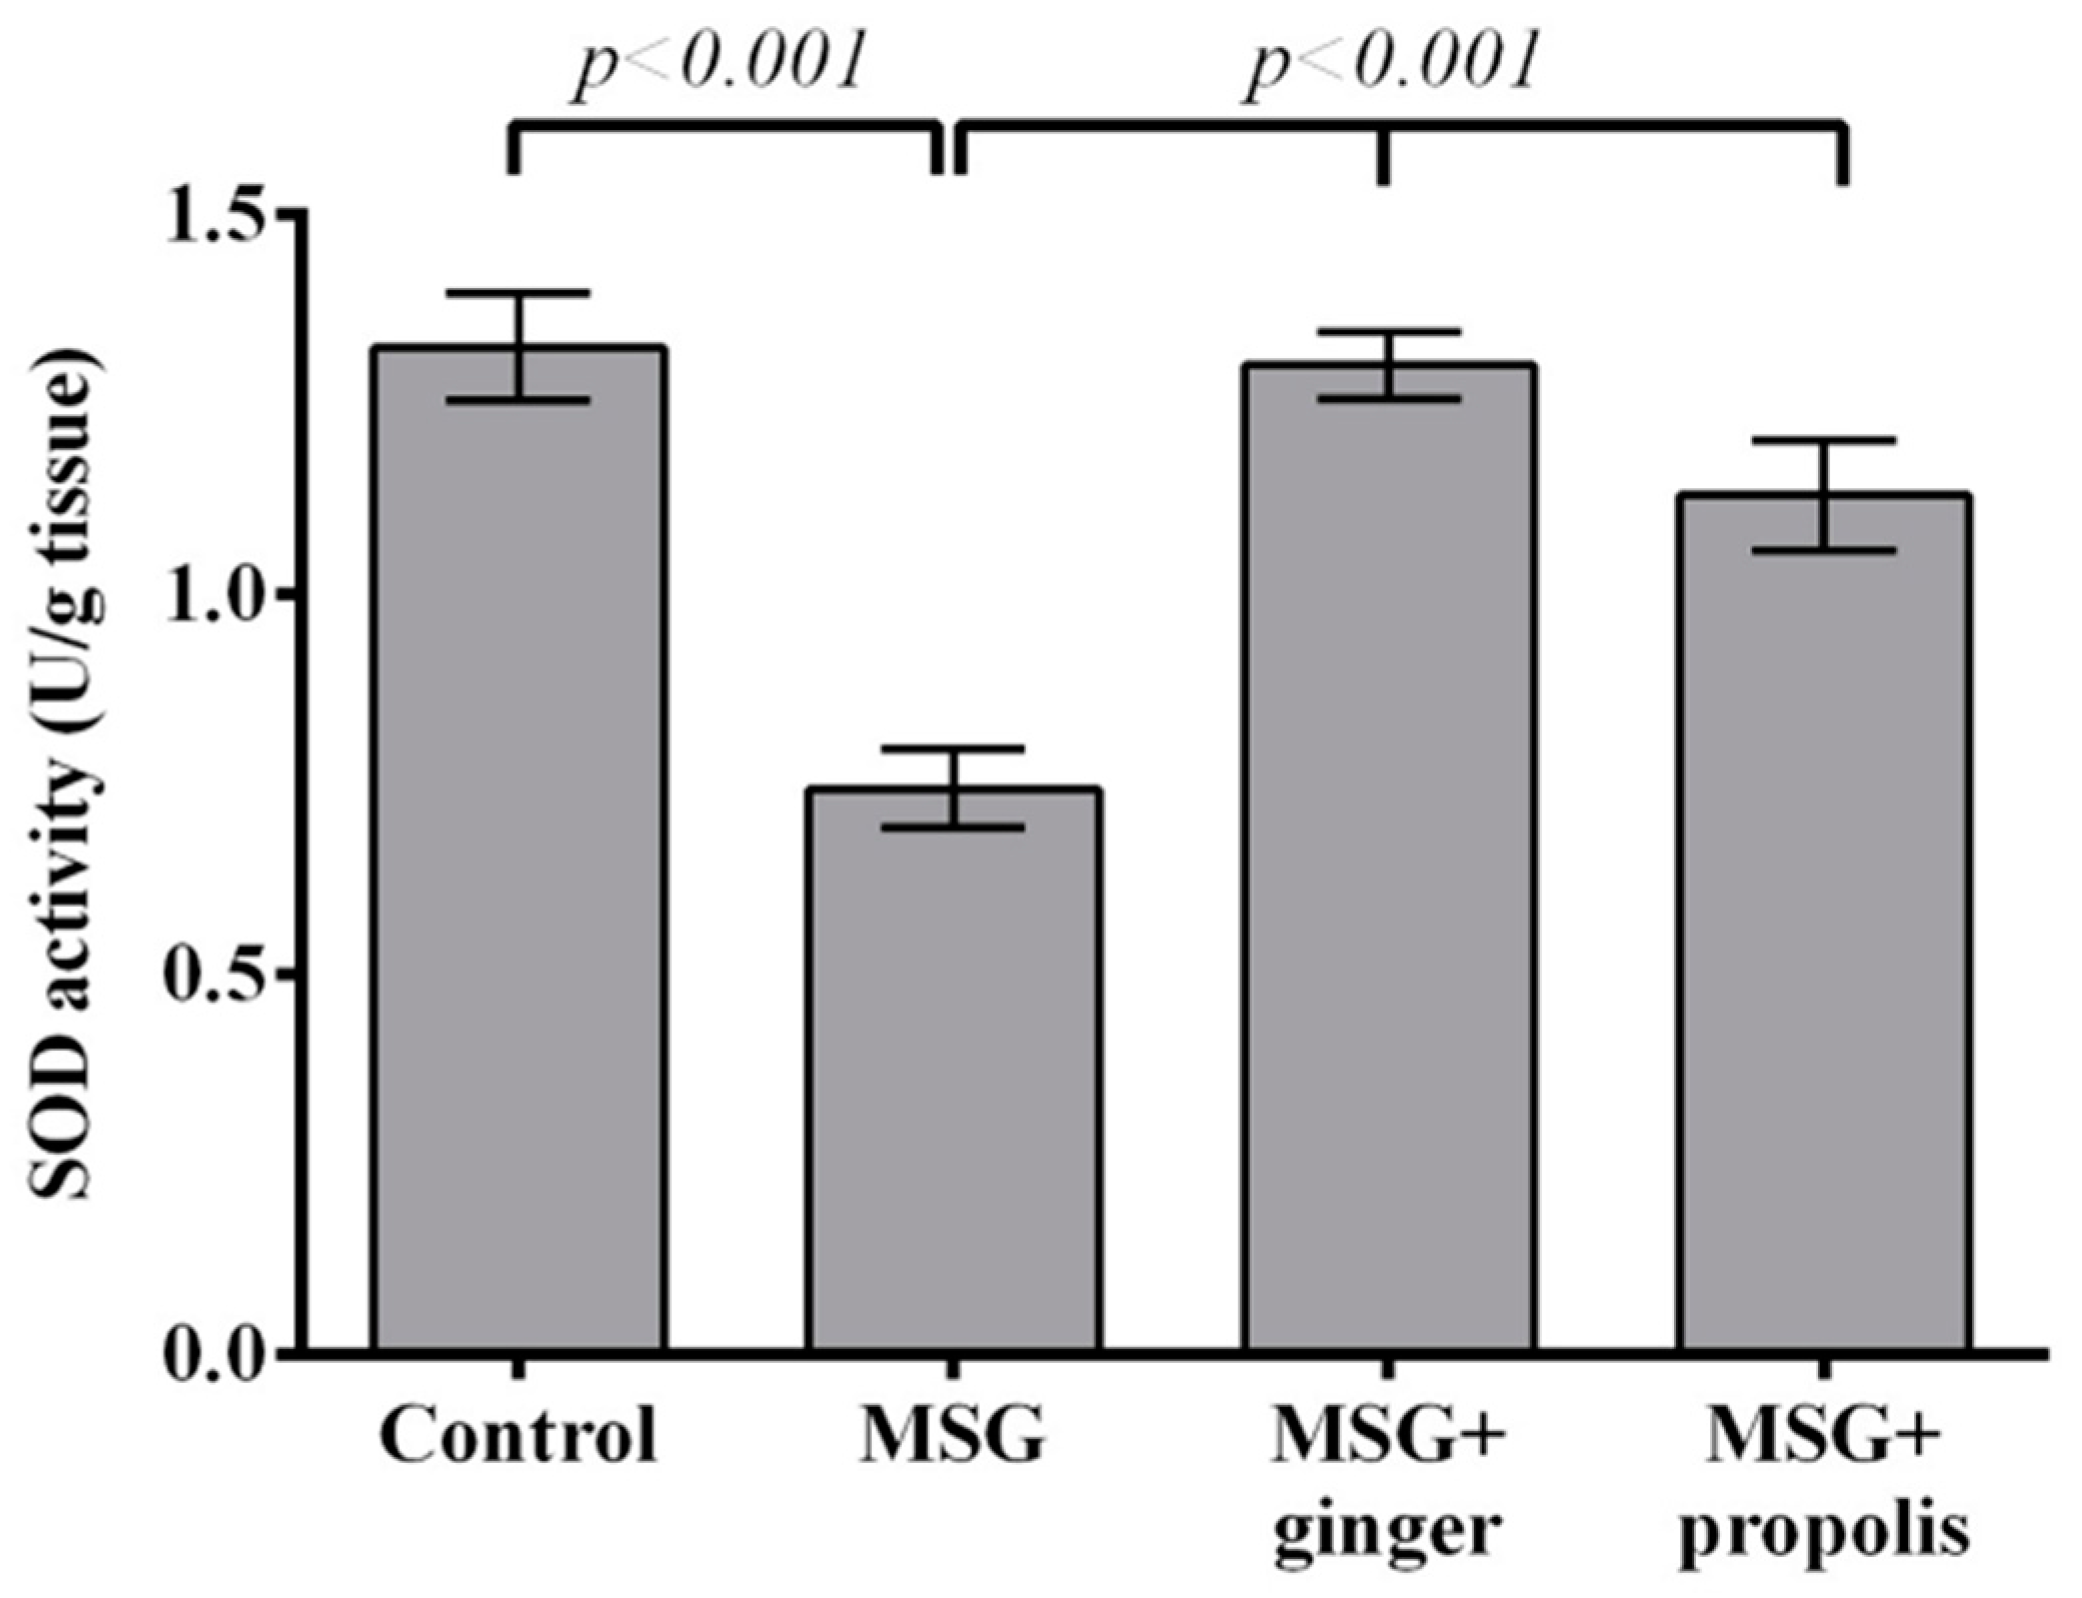
2. Results
3. Discussion
4. Experimental Section
4.1. Chemicals
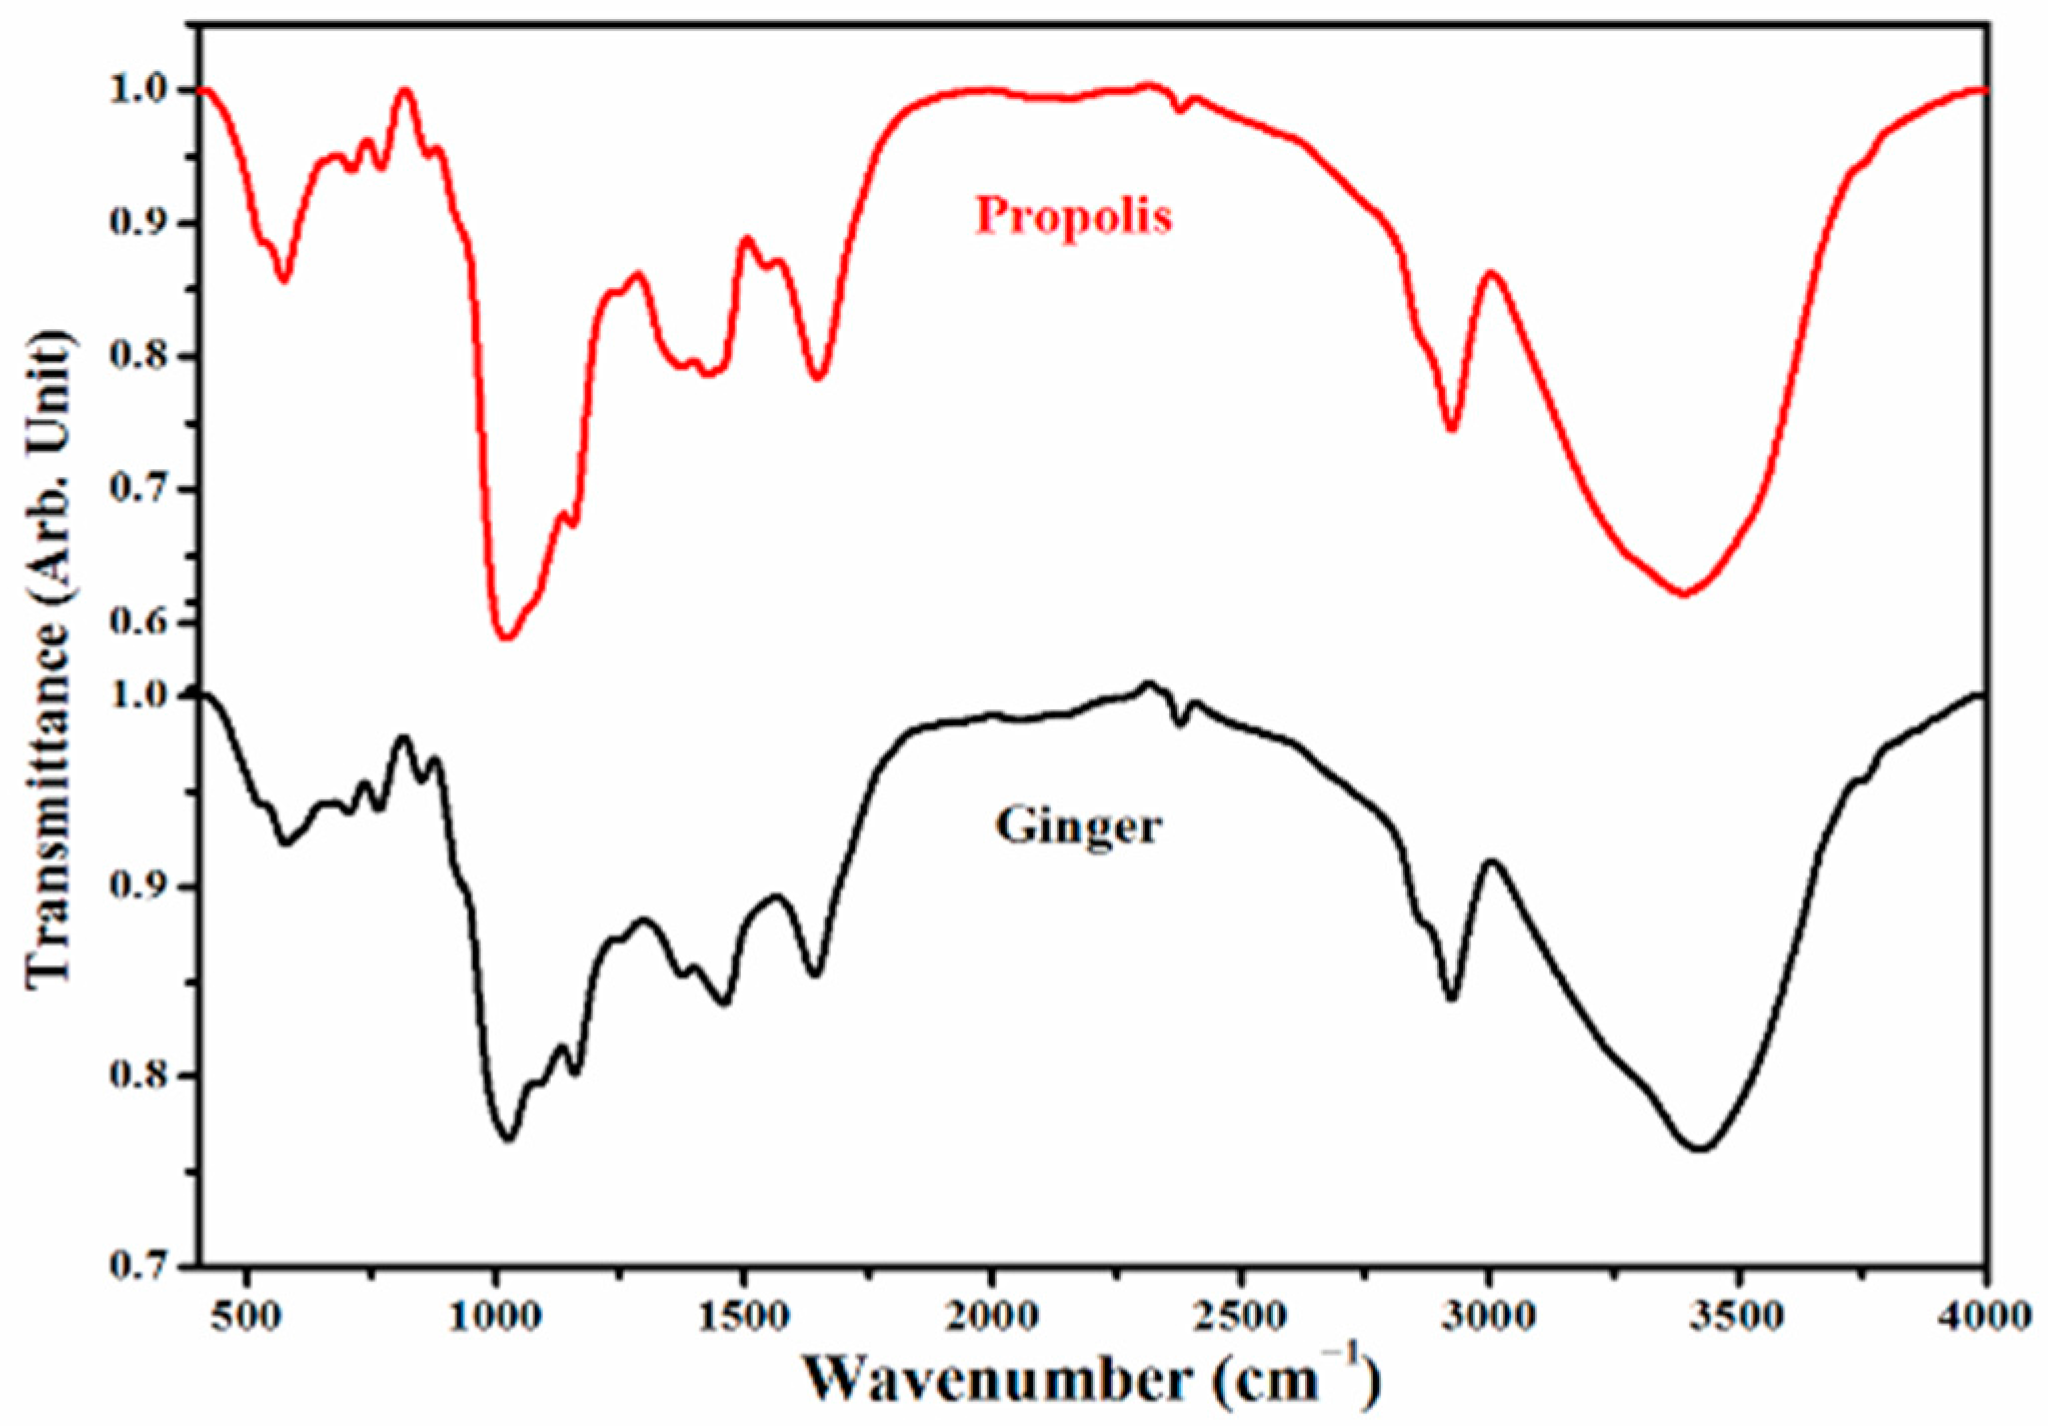
4.2. Analyses of Ginger and Propolis Using FTIR
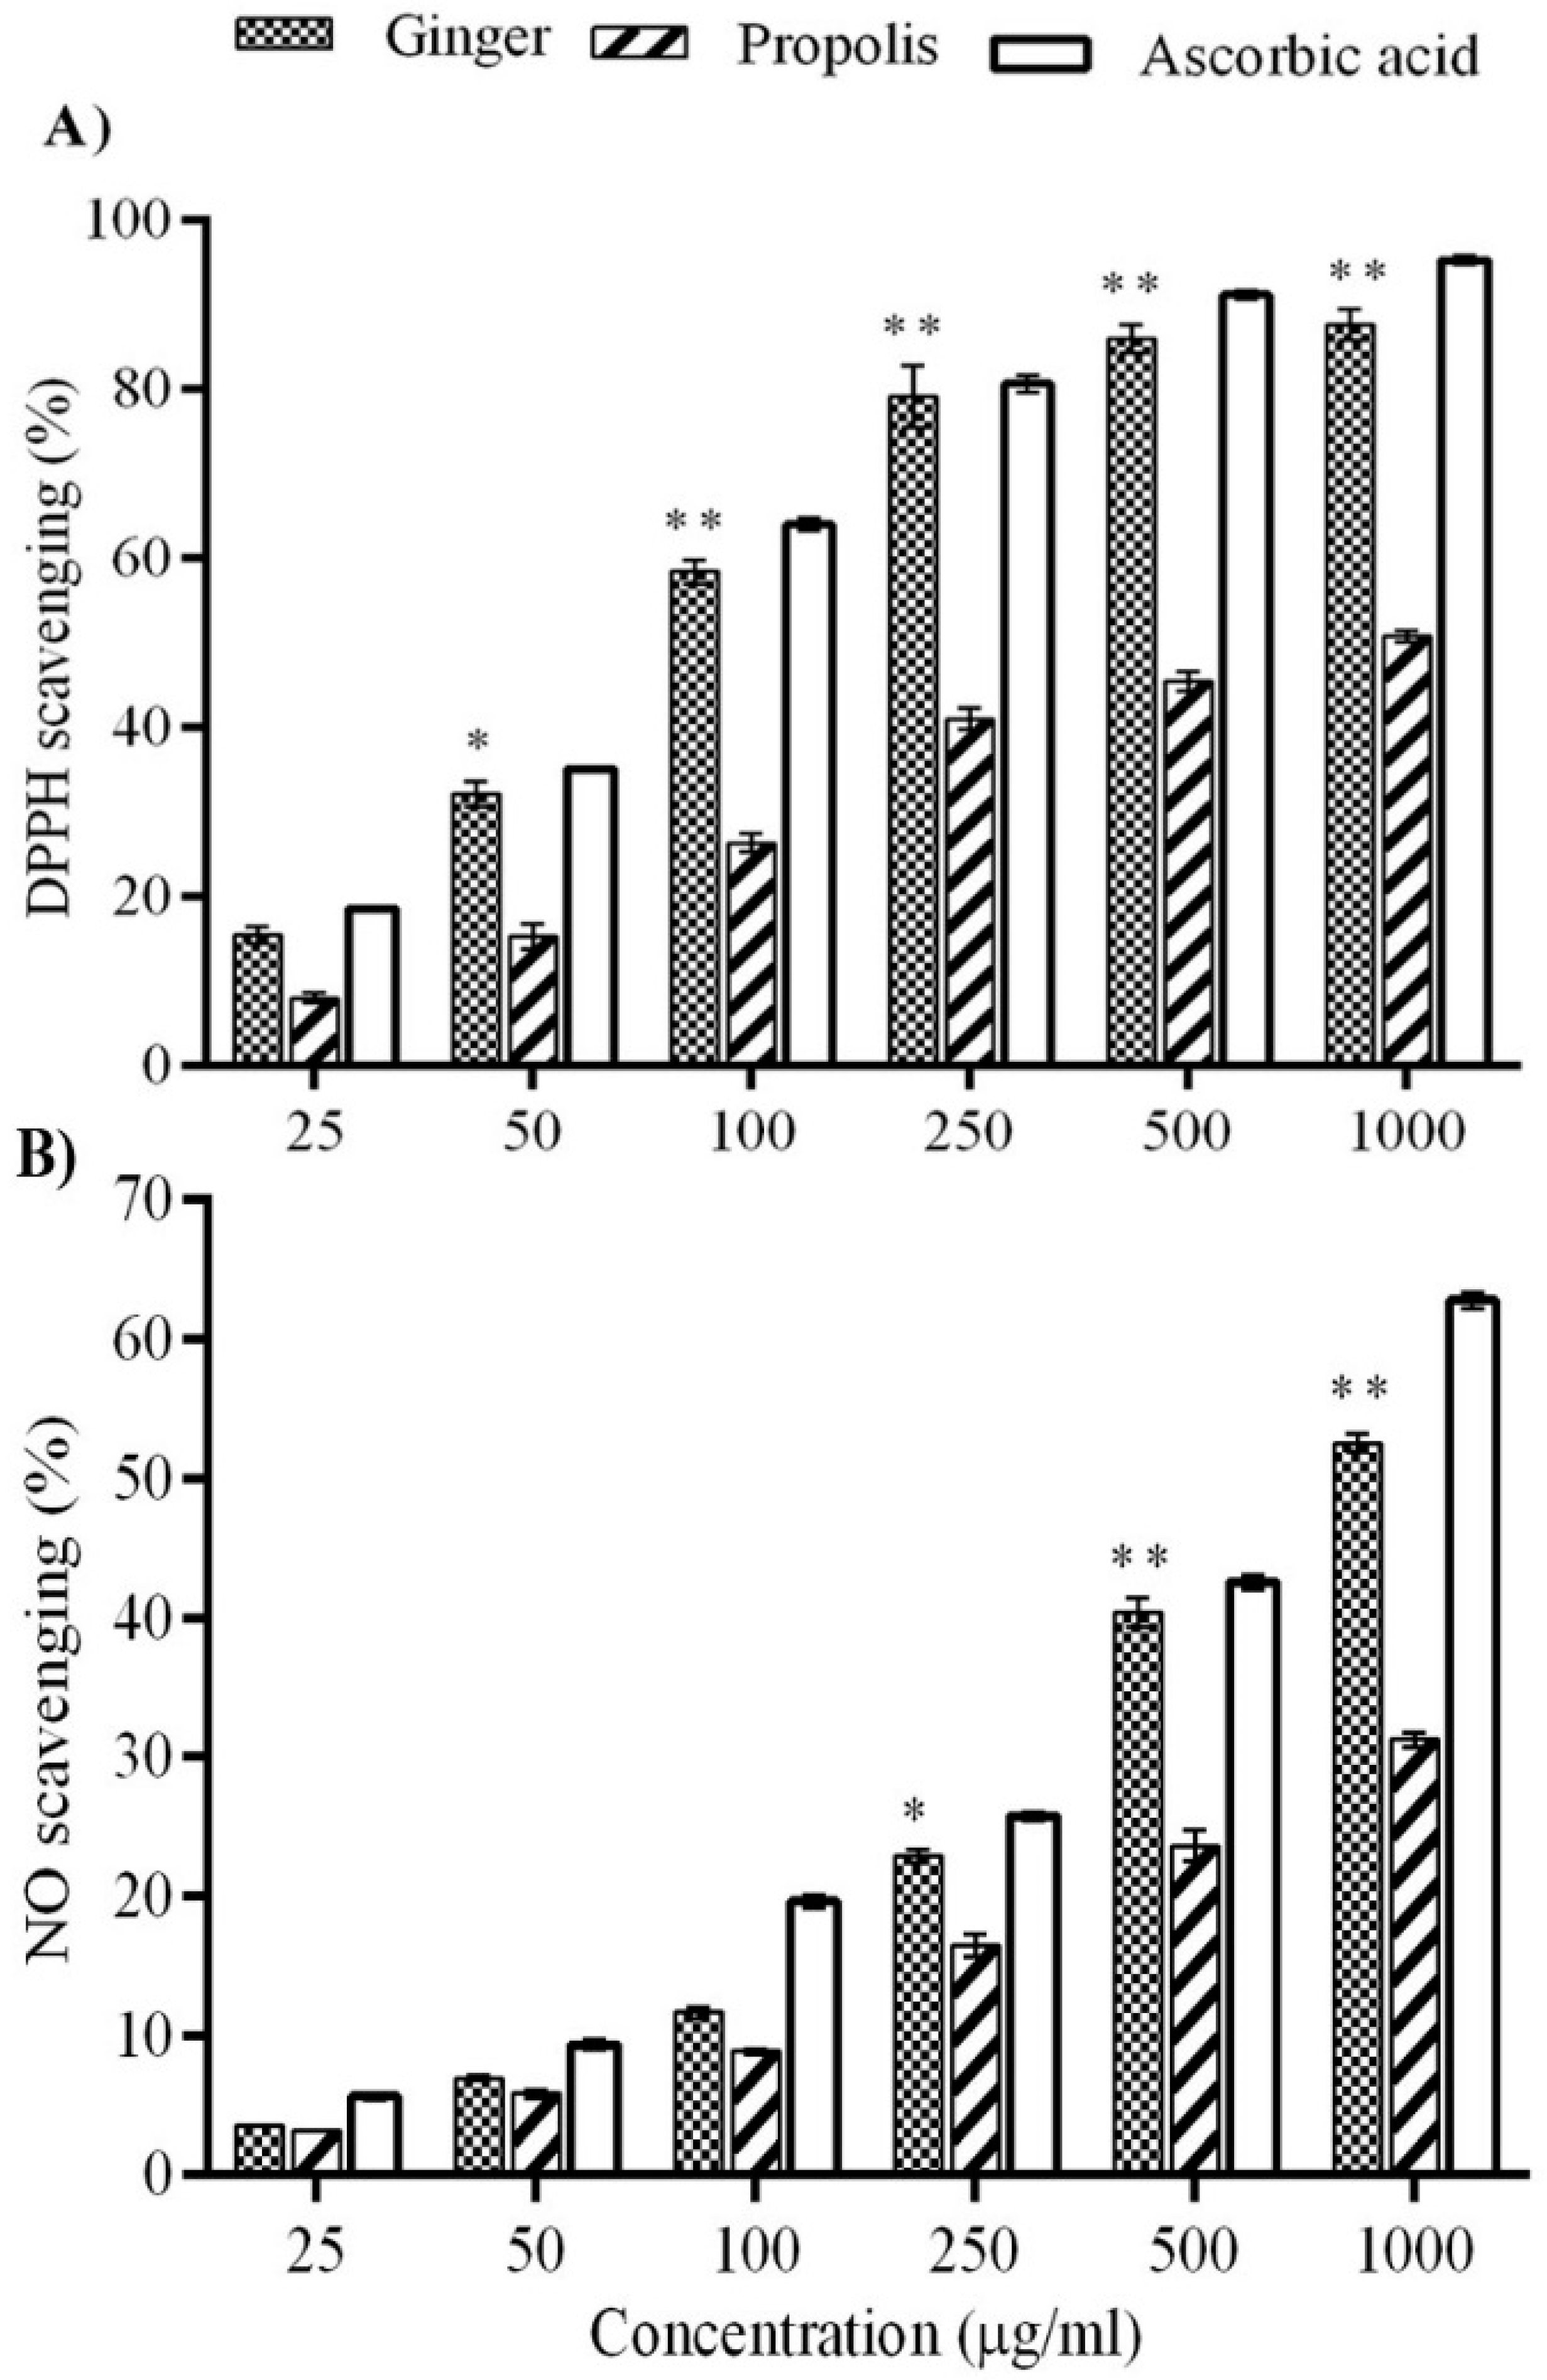
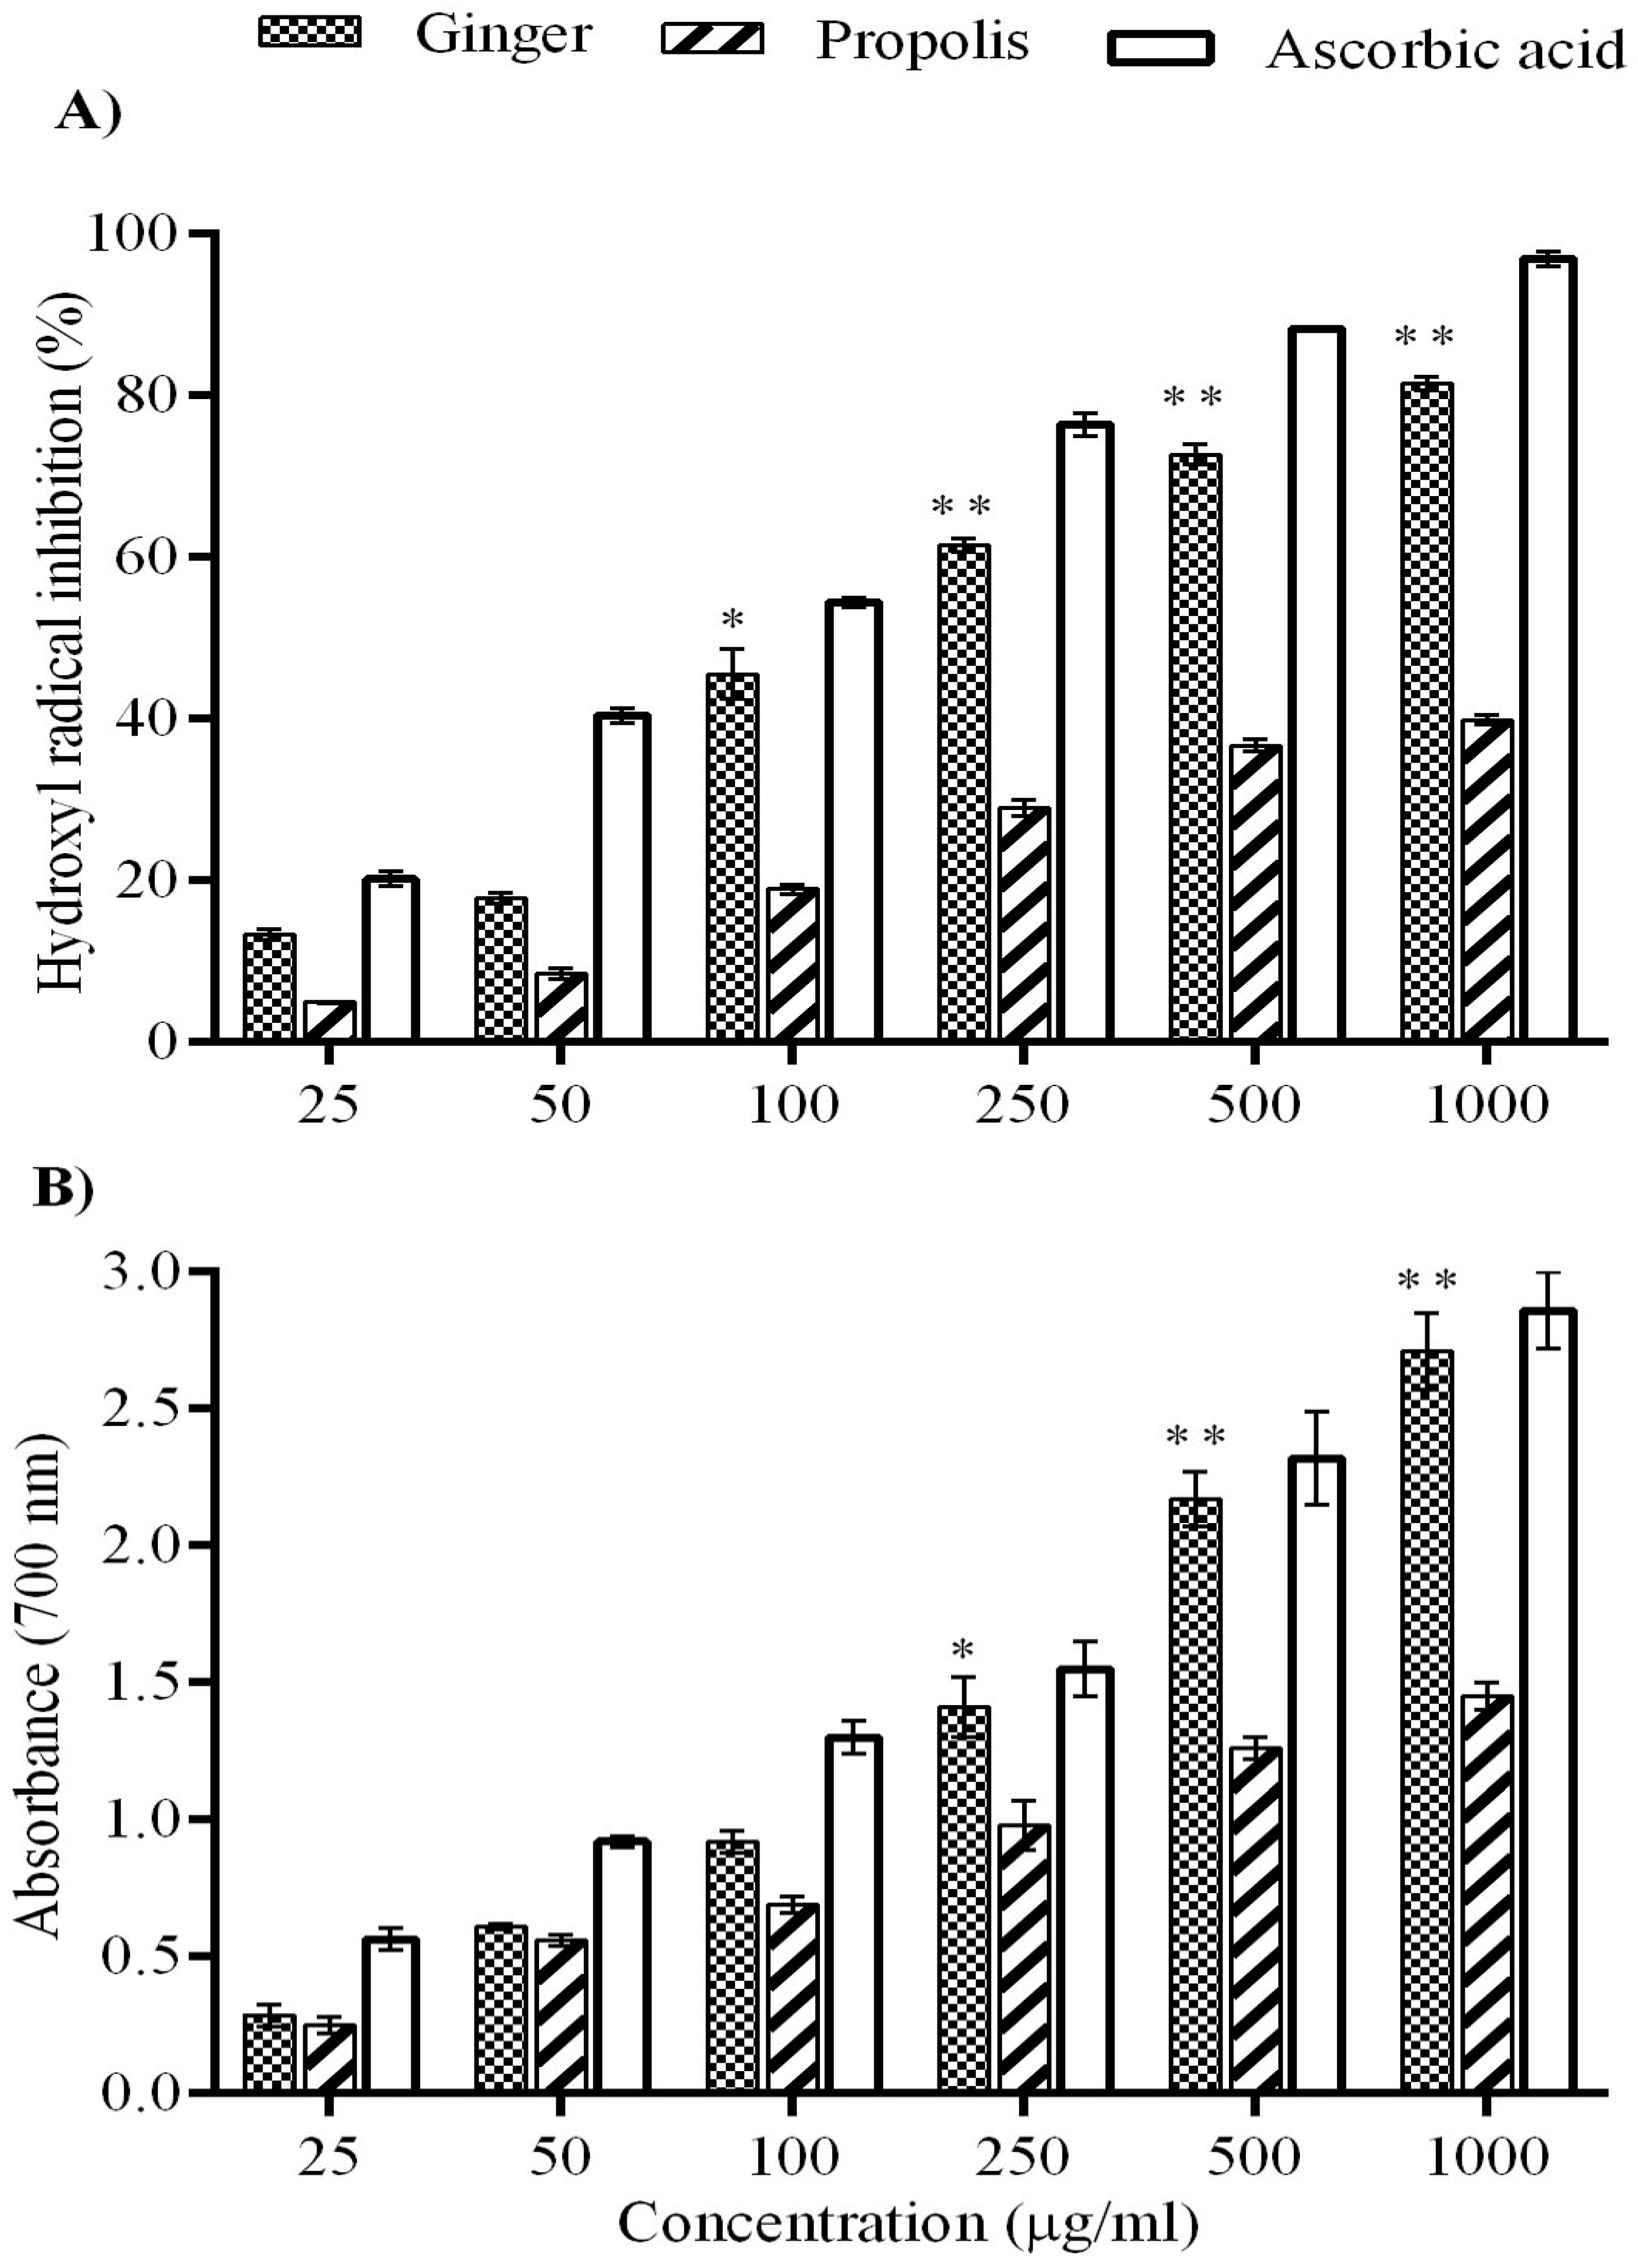
4.3. Measurement of Antioxidant Activity
4.3.1. DPPH-Based Free Radical Scavenging Assay
4.3.2. Superoxide Radical Scavenging Assay
4.3.3. Nitric Oxide Radical Scavenging Activity
4.3.4. Ferric Reducing Potential Assay
4.4. Animals and Maintenance
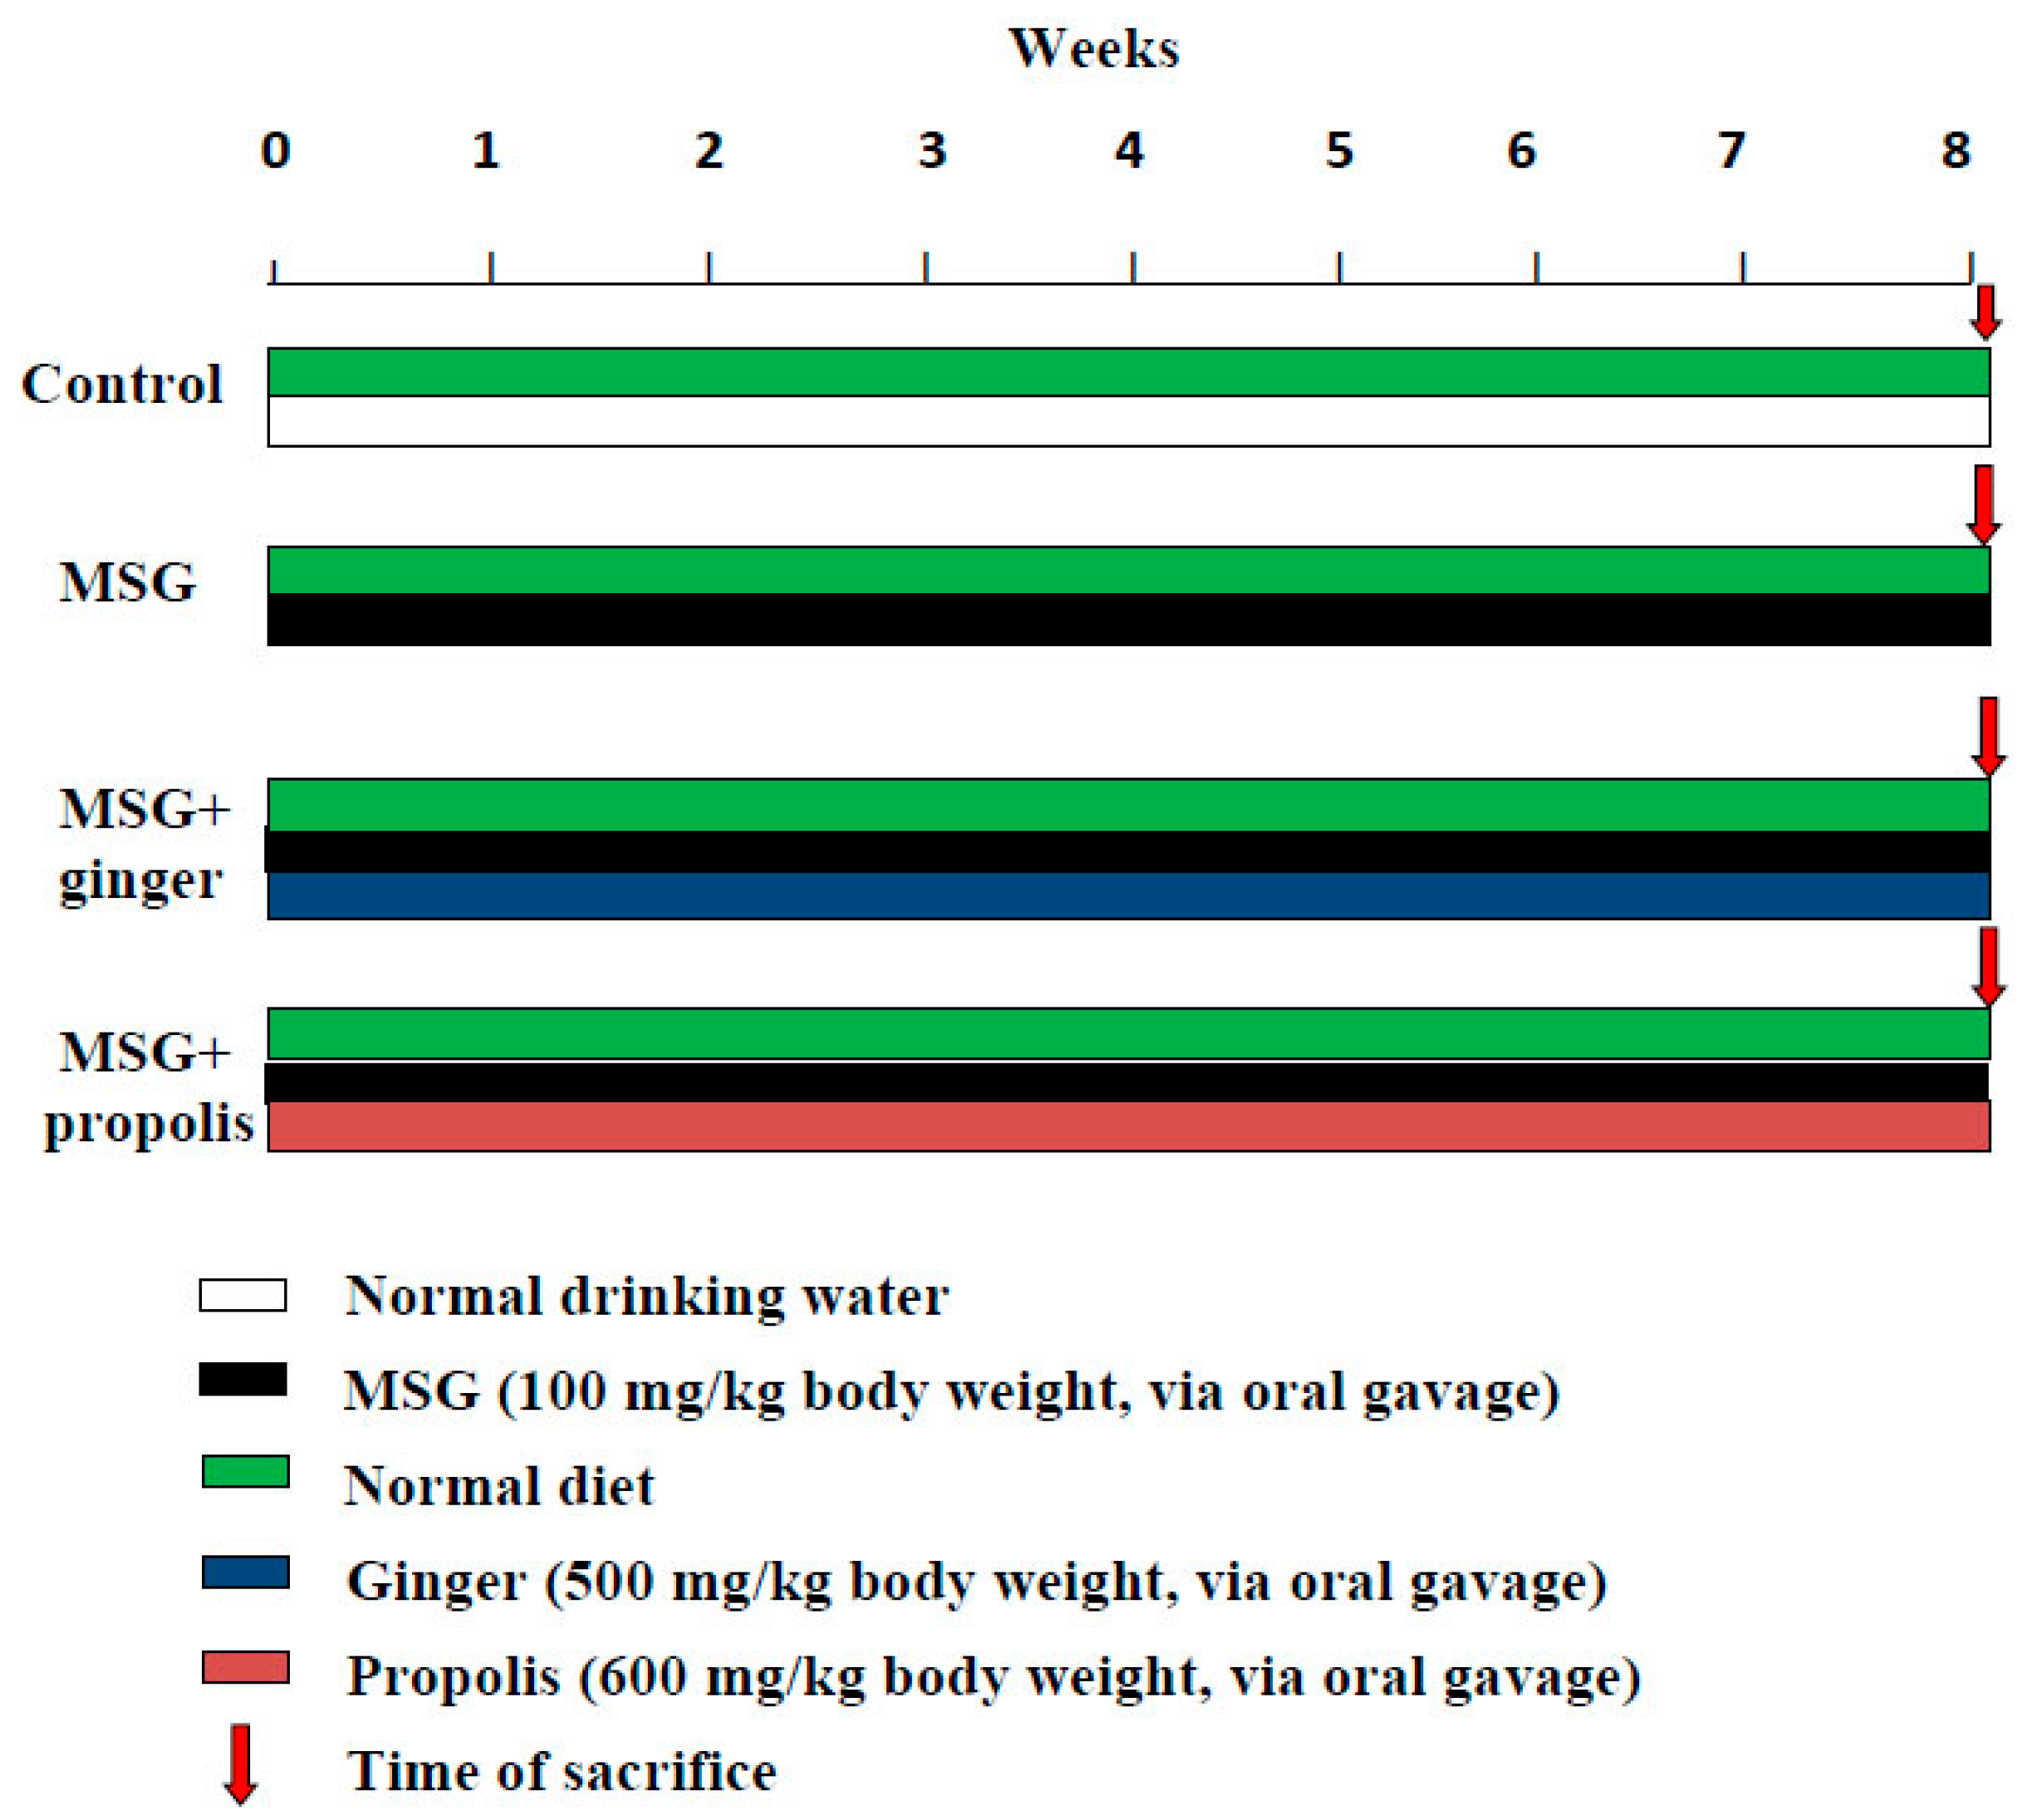
4.5. Experimental Design for Chemoprotective Study
4.6. Brain Tissue Sampling for Biochemical Assays
4.6.1. Tissue Processing Methods
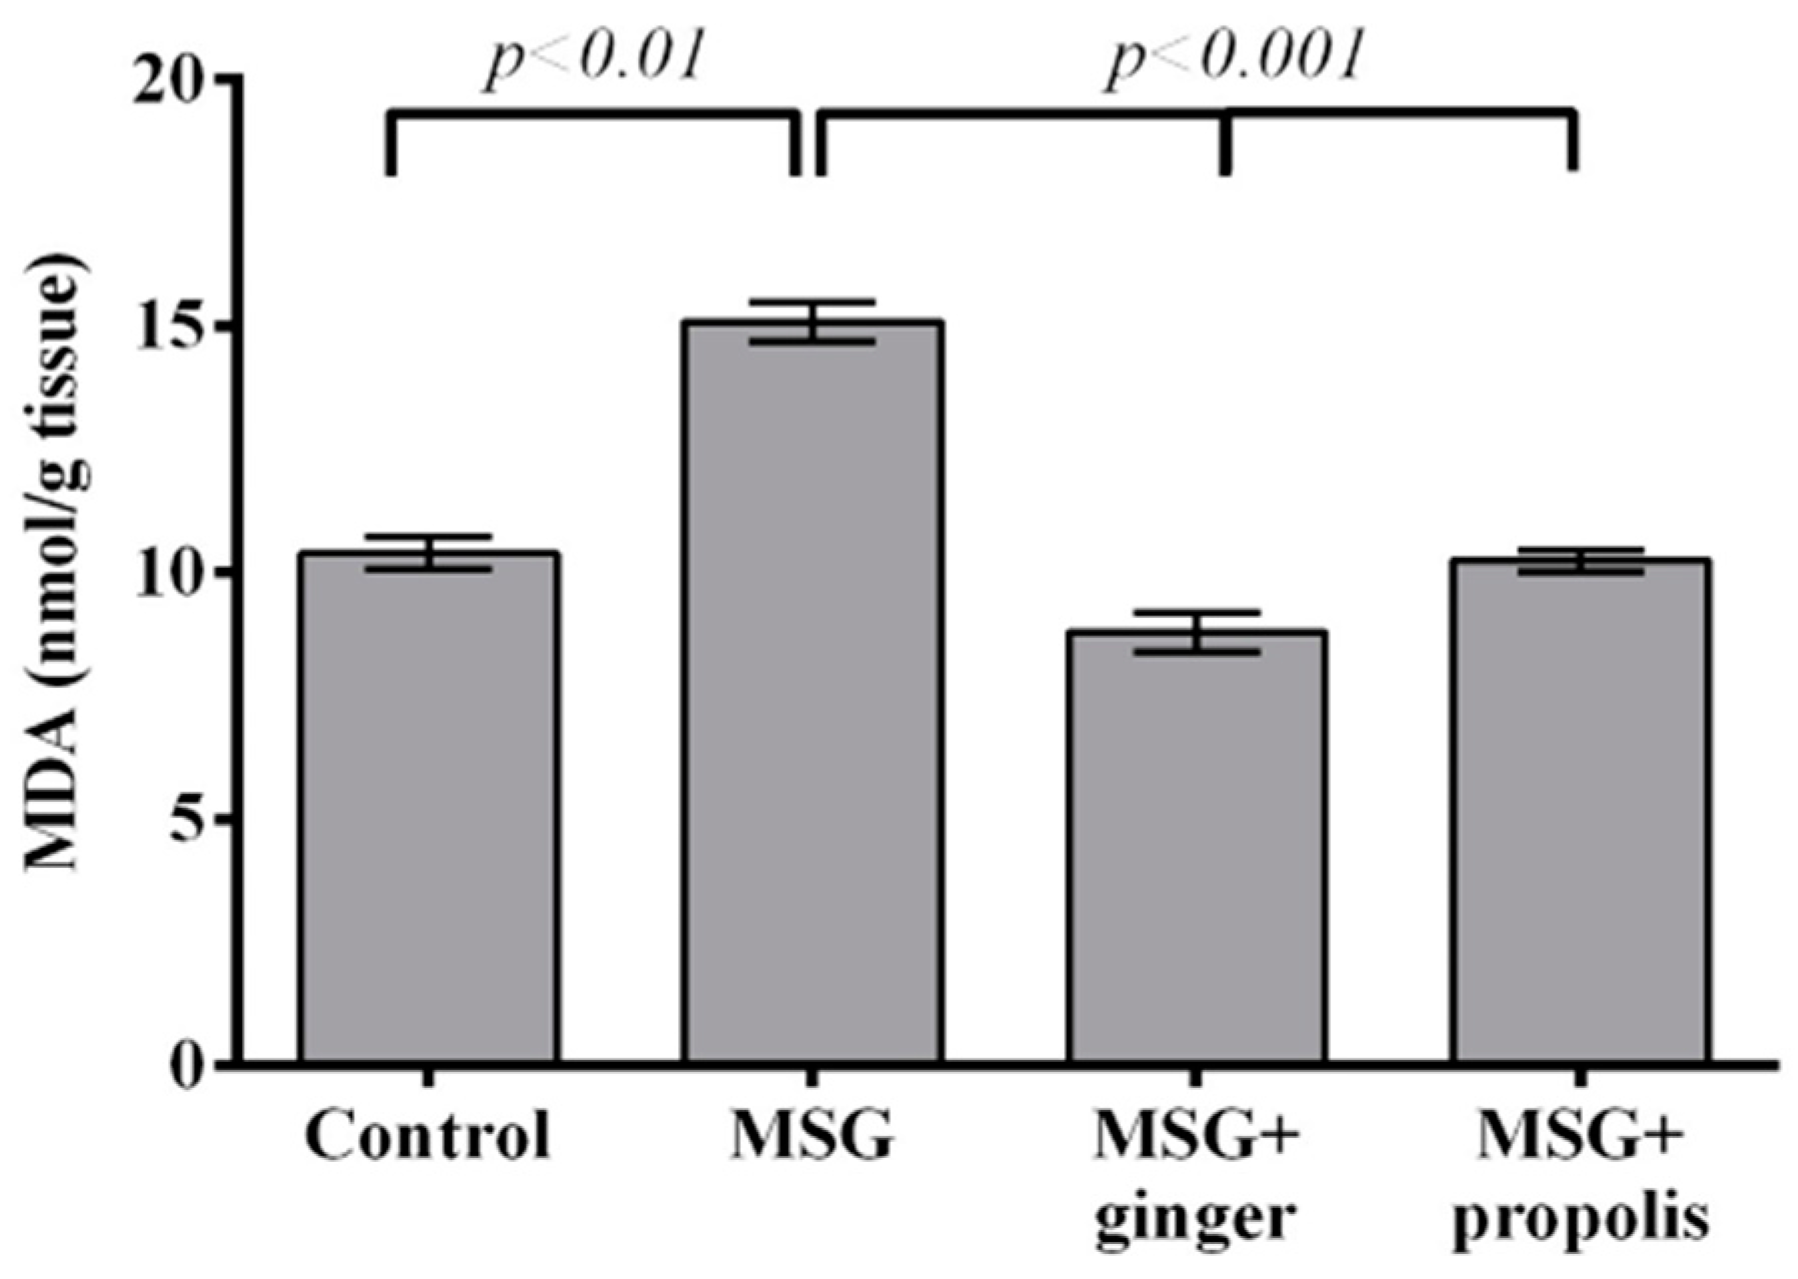
4.6.2. Lipid Peroxidation
4.6.3. GSH
4.6.4. NO
4.6.5. SOD
4.6.6. CAT
4.6.7. Assessment of β-Amyloid Peptides
4.6.8. Assessment of Acetyl Cholinesterase (AChE, EC 3.1.1.7) Activity
4.6.9. Assessment of Glutamate Neurotransmitter Level
4.6.10. Determination of Serotonin Neurotransmitter
4.6.11. Determination of Dopamine Neurotransmitter
4.6.12. Determination of Brain 8-OHdG Using HPLC
4.6.13. Estimation of the Electrolytes
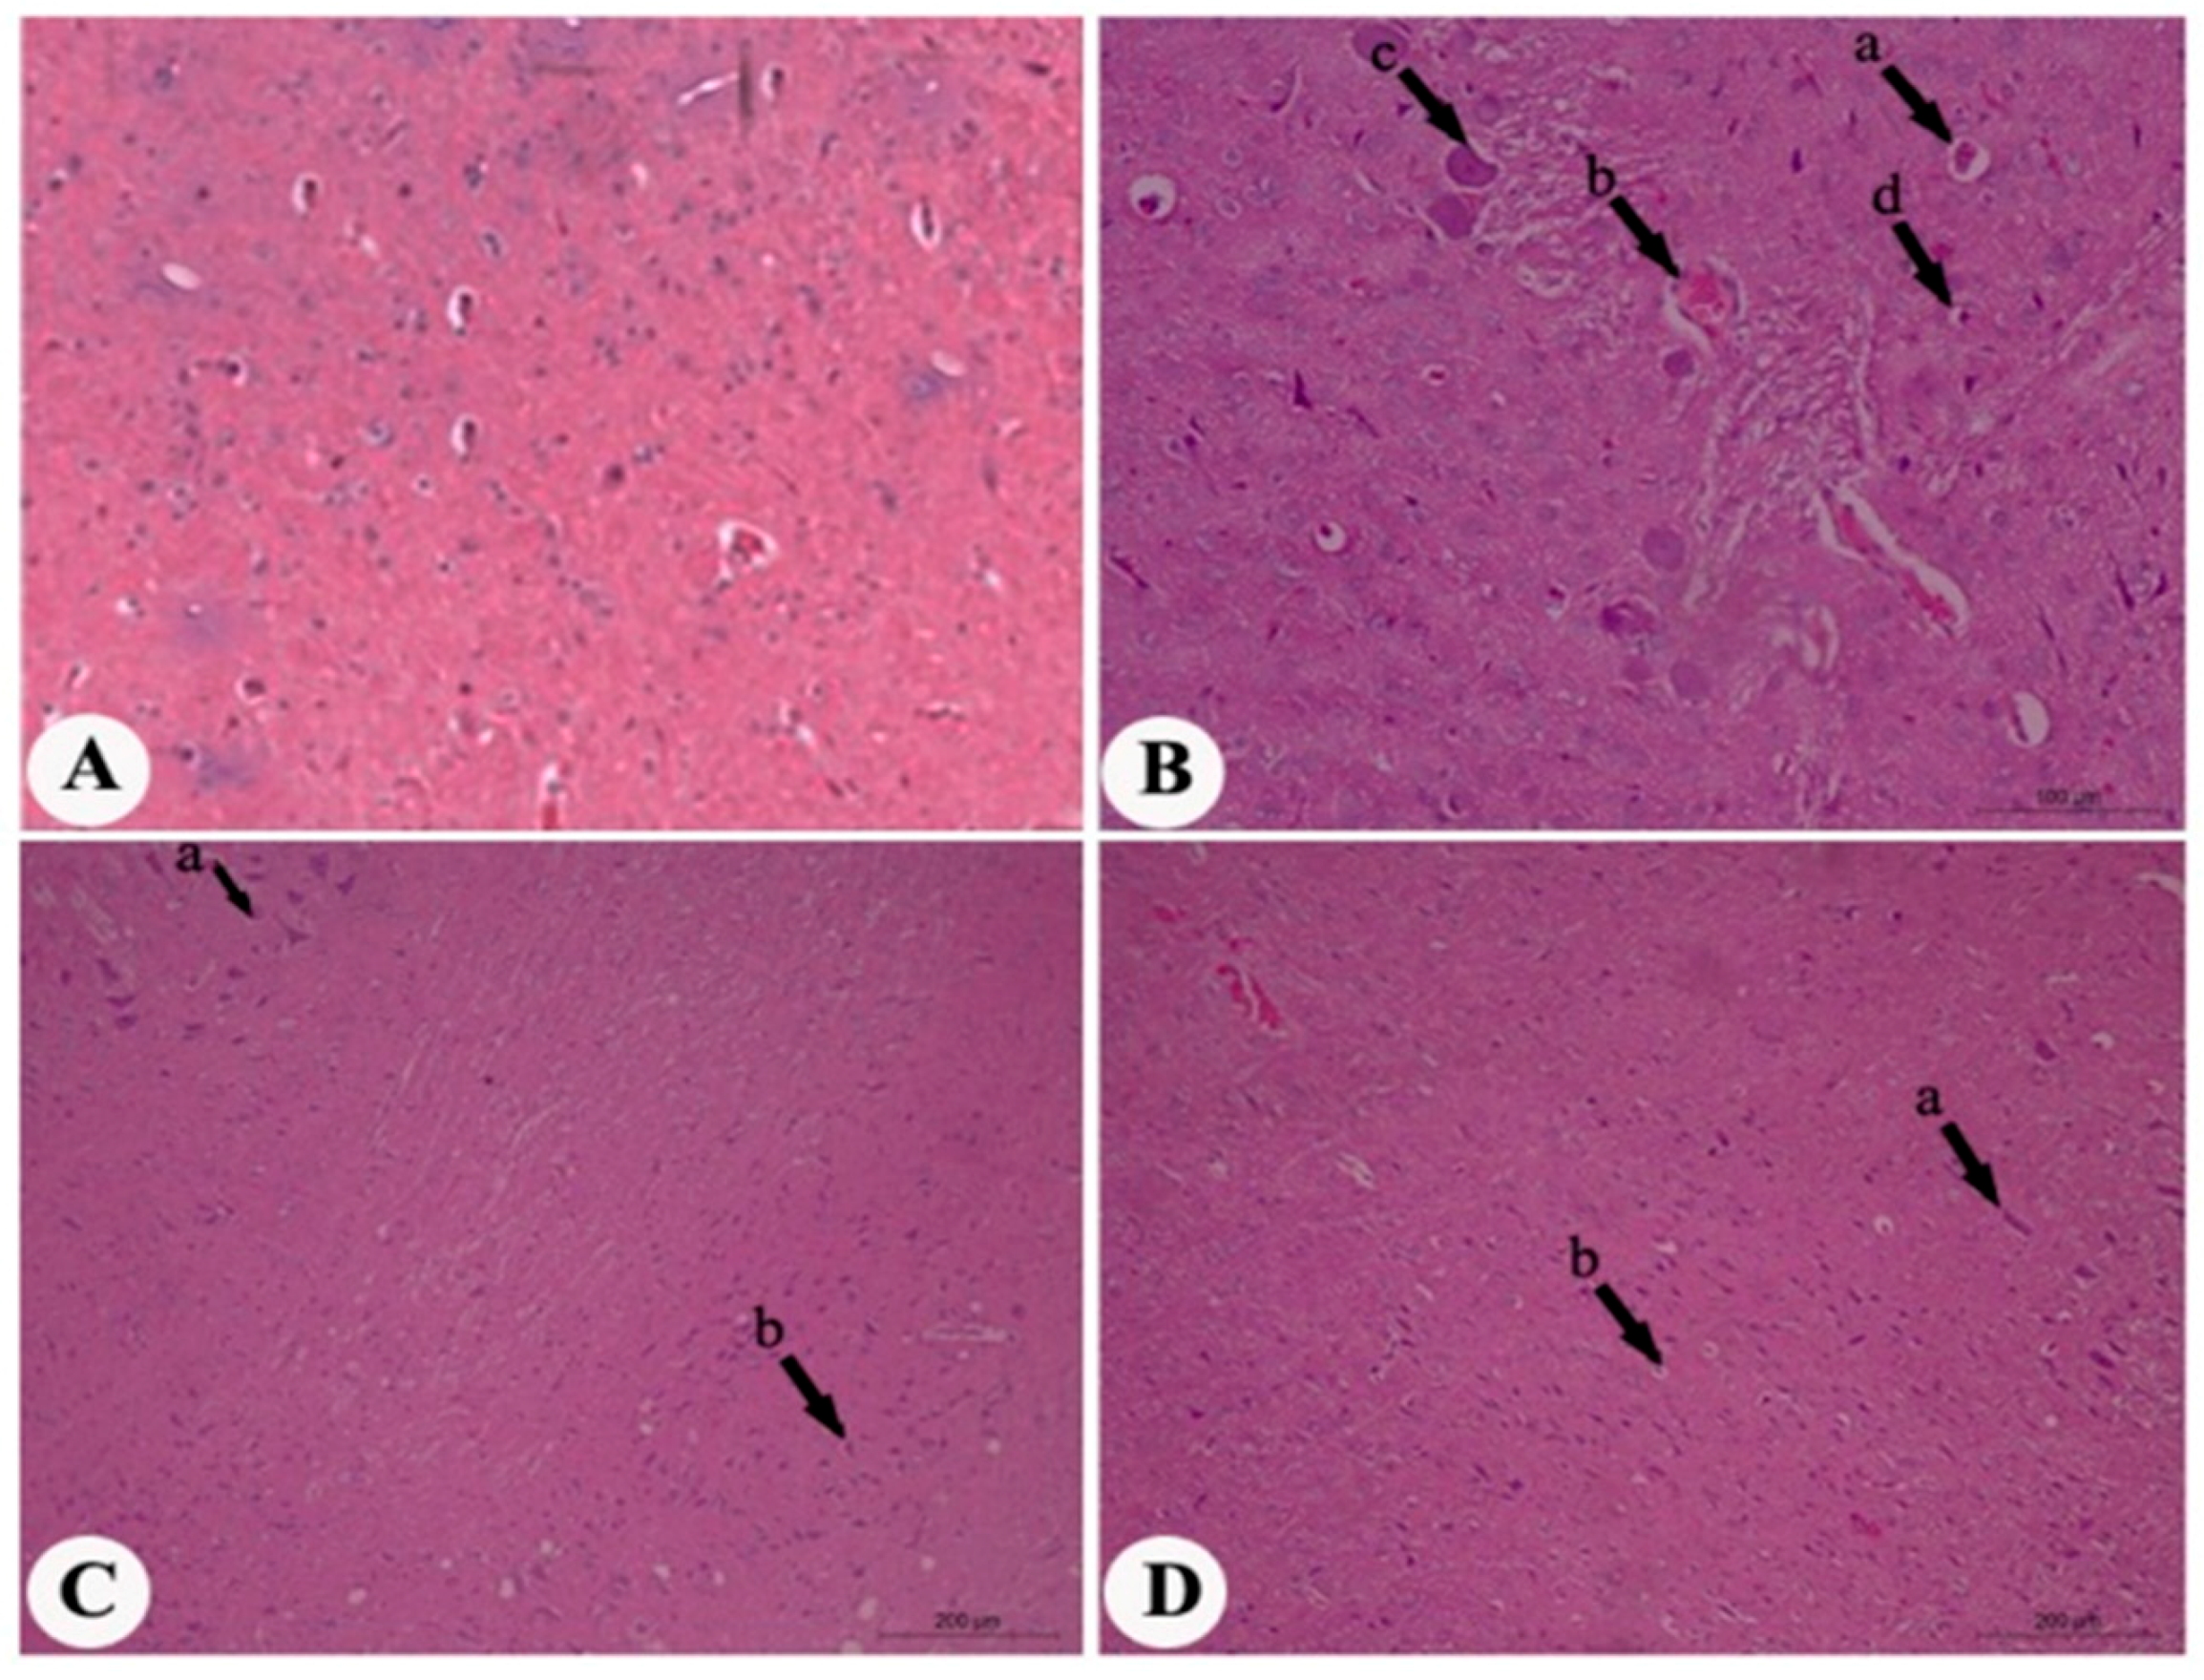
4.7. Histopathological Assessment
4.8. Expression of Results and Statistical Significance
Acknowledgments
Author Contributions
Conflicts of Interest
Abbreviations
| AchE | Acetylcholinesterase |
| CAT | Catalase |
| CNS | Central nervous system |
| DPPH | α,α-Diphenyl-β-picrylhydrazyl |
| EGTA | Ethylene glycol-bis(β-aminoethyl ether)-N,N,N’,N’-tetraacetic acid |
| FTIR | Fourier transform infrared spectroscopy |
| GSH | Glutathione |
| GST | Glutathione S-transferase |
| FTIR | Fourier transform infrared |
| iNOS | Inducible nitric oxide synthase |
| MDA | Malondialdehyde |
| MSG | Monosodium glutamate |
| NO | Nitric oxide |
| 8-OHdG | 8-Hydroxy-2’-deoxyguanosine |
| ONOO− | Peroxinitrite radical |
| ROS | Reactive oxygen species |
| SOD | Superoxide dismutase |
| TBA | Thiobarbituric acid |
| TCA | Trichloro acetic acid |
References
- Bhattacharya, T.; Bhakta, A.; Ghosh, S.K. Long term effect of monosodium glutamate in liver of albino mice after neo-natal exposure. Nepal Med. Coll. J. 2011, 13, 11–16. [Google Scholar] [PubMed]
- Beyreuther, K.; Biesalski, H.K.; Fernstrom, J.D.; Grimn, P.; Hammes, W.P.; Heinemann, U.; Kempski, O.; Stehle, P.; Stein-hart, H.; Walker, R. Consensus meeting: Monosodium glutamate—An update. Eur. J. Clin. Nutr. 2007, 61, 304–313. [Google Scholar] [CrossRef] [PubMed]
- Garattini, S. Glutamic acis, twenty years later. J. Nutr. 2000, 130 (Suppl. 4), 901S–909S. [Google Scholar] [PubMed]
- Nelson, G.; Chandrashekar, J.; Hoon, M.A.; Feng, L.; Zhao, G.; RybaN, J.; Zuker, C.S. An amino acid taste receptor. Nature 2002, 416, 199–202. [Google Scholar] [CrossRef] [PubMed]
- Dief, A.E.; Kamha, E.S.; Baraka, A.M.; Elshorbagy, A.K. Monosodium glutamate neurotoxicity increases beta amyloid in the rat hippocampus: A potential role for cyclic AMP protein kinase. Neurotoxicology 2014, 42, 76–82. [Google Scholar] [CrossRef] [PubMed]
- Onyema, O.O.; Farombi, E.O.; Emerole, G.O.; Ukoha, A.I.; Onyeze, G.O. Effects of vitamin E on monosodium glutamate induced hepatotoxicity and oxidative stress in rats. Indian J. Biochem. Biophys. 2006, 43, 20–24. [Google Scholar] [PubMed]
- Onyema, O.O.; Alisi, C.S.; Ihetuge, A.P. Monosodium Glutamate Induces Oxidative Stress and Affects Glucose Metabolism in the Kidney of Rats. Int. J. Biochem. Res. Rev. 2012, 2, 1–11. [Google Scholar]
- Shivasharan, B.D.; Nagakannan, P.; Thippeswamy, P.S.; Veerapur, V.P. Protective Effect of Calendula officinalis L. Flowers Against Monosodium Glutamate Induced Oxidative Stress and Excitotoxic Brain Damage in Rats. Ind. J. Clin. Biochem. 2013, 28, 292–298. [Google Scholar] [CrossRef] [PubMed]
- Farombi, E.O.; Onyema, O.O. Monosodium glutamate-induced oxidative damage and genotoxicity in the rat: Modulatory role of vitamin C, vitamin E and quercetin. Hum. Exp. Toxicol. 2006, 25, 251–259. [Google Scholar] [CrossRef] [PubMed]
- Freeman, M. Reconsidering the effects of monosodium glutamate: A literature review. J. Am. Acad. Nurse Pract. 2006, 10, 482–486. [Google Scholar] [CrossRef] [PubMed]
- Kumar, L.P.; Panneer-selvam, N. Cytogenetic studies of food preservative in Allium cepa root meristem cells. Med. Biol. 2007, 14, 60–63. [Google Scholar]
- Nagwa, R.A.H.; Magda, A.M.E.; Atef, A.A.H.; Elham, A.A.A.H. Relative Mutagenecity of Some Food Preservatives on Plant Cells. Aust. J. Basic. Appl. Sci. 2011, 5, 2817–2826. [Google Scholar]
- Pavlovic, V.; Sarac, M. The role of ascorbic acid and monosodium glutamate in thymocyte apoptosis. Bratisl. Lek. Listy 2010, 111, 357. [Google Scholar] [PubMed]
- Dimov, V.; Ivanovska, N.; Manolova, N.; Bankova, V.; Nikolov, N.; Popov, S. Immunomodulatory action of propolis. Influence on anti-infectious protection and macrophage function. Apidologie 1991, 22, 155–162. [Google Scholar] [CrossRef]
- Basnet, P.; Matsushige, K.; Hase, K.; Kadota, S.; Namba, T. Four di-O-caffeoyl quinic acid derivatives from propolis. Potent hepatoprotective activity in experimental liver injury models. Biol. Pharm. Bull. 1996, 19, 1479–1484. [Google Scholar] [CrossRef] [PubMed]
- Ramadan, A.; Soliman, G.; Mahmoud, S.S.; Nofal, S.M.; Abdel-Rahman, R.F. Evaluation of the safety and antioxidant activities of crocus sativus and propolis ethanolic extracts. J. Saudi Chem. Soc. 2012, 16, 13–21. [Google Scholar] [CrossRef]
- Miyataka, H.; Nishiki, M.; Matsumoto, H.; Fujimoto, T.; Matsuka, M.; Satoh, T. Evaluation of propolis (I). Evaluation of Brazilian and Chinese propolis by enzymatic and physico-chemical methods. Biol. Pharm. Bull. 1997, 20, 496–501. [Google Scholar] [CrossRef] [PubMed]
- Isla, M.I.; Moreno, M.I.N.; Sampietro, A.R.; Vattuone, M.A. Antioxidant activity of Argentine propolis extracts. J. Ethnopharmacol. 2001, 76, 165–170. [Google Scholar] [CrossRef]
- Walker, P.; Crane, E. Constituents propolis. Apidologie 1987, 18, 327–334. [Google Scholar] [CrossRef]
- Lahouel, M.; Boutabet, K.; Kebsa, W.; Alyane, M. Polyphenolic fractions of Algerian propolis reverses doxorubicin induced acute renal oxidative stress. Afr. J. Pharm. Pharmacol. 2010, 4, 712–720. [Google Scholar]
- Stoilova, I.; Krastanov, A.; Stoyanova, A.; Denev, P.; Gargova, S. Antioxidant activities of a ginger extract (Zingiber officinale). Food Chem. 2007, 102, 764–770. [Google Scholar] [CrossRef]
- Thomson, M.; Al-Qattan, K.K.; Al-Sawan, S.M.; Alnaqeeb, M.A.; Khan, I.; Ali, M. The use of ginger (Zingiber officinale Rosc.) as a potential anti-inflammatory and antithrombotic agent. Prostaglandins Leukot. Essent. Fatty Acids 2002, 67, 475–478. [Google Scholar] [CrossRef] [PubMed]
- Shukla, Y.; Singh, M. Cancer preventive properties of ginger: A brief review. Food Chem. Toxicol. 2007, 45, 683–690. [Google Scholar] [CrossRef] [PubMed]
- Flynn, D.L.; Rafferty, M.F.; Boctor, A.M. Prostaglandins. Leukot. Med. 1986, 24, 195–198. [Google Scholar] [CrossRef]
- Tsakanova, G.V.; Ayvazyan, V.A.; Boyajyan, A.S.; Arakelova, E.A.; Grigoryan, G.S.; Guevorkyan, A.A.; Mamikonyan, A.A. A comparative study of antioxi-dant system and intensity of lipid peroxidation in type 2 diabetes mellitus andischemic stroke aggravated and not aggravated by type 2 diabetes mellitus. Bull. Exp. Biol. Med. 2011, 151, 564–566. [Google Scholar] [CrossRef] [PubMed]
- Blumenthal, M.; Lindstrom, A.; Lynch, M.E.; Rea, P. Herb sales continue growth: Up 3.3% in 2010. Herb. Gram 2011, 90, 64–67. [Google Scholar]
- Mattson, M.P. Glutamate and Neurotrophic Factors in Neuronal Plasticity and Disease. Ann. N. Y. Acad. Sci. 2008, 1144, 97–112. [Google Scholar] [CrossRef] [PubMed]
- Singh, K.; Ahluwalia, P. Studies on the effects of monosodium glutamate administration on antioxidant in the arterial tissue of male albino mice. J. Nutr. Sci. Vitaminol. 2003, 49, 145–148. [Google Scholar] [CrossRef] [PubMed]
- Andersen, J.K. Oxidative stress in neurodegeneration: Cause or consequence. Nature reviews. Neuroscience 2004, 5, 518–525. [Google Scholar]
- Mahmoud, H.M.; Hussein, U.L. Suppression of N-nitrosodiethylamine induced oxidative renal toxicity by sulphated polysaccharide and aqueous extract of Ulva lactuca in rats. Int. J. Pharm. Pharm. Sci. 2014, 6, 248–253. [Google Scholar]
- Hussein, U.K.; Mahmoud, H.M.; Farrag, A.G.; Bishayee, A. Chemoprevention of Diethylnitrosamine-Initiated and Phenobarbital-Promoted Hepatocarcinogenesis in Rats by Sulfated Polysaccharides and Aqueous Extract of Ulva lactuca. Integr. Cancer Ther. 2015, 14, 525–545. [Google Scholar]
- Cooke, M.S.; Evans, M.D.; Dizdaroglu, M.; Linec, J. Oxidative DNA damage: Mechanisms, mutation, and disease. FASEB J. 2003, 17, 1195–1214. [Google Scholar] [CrossRef] [PubMed]
- Shanmugam, K.R.; Ramakrishna, C.H.; Mallikarjuna, K.; Reddy, K.S. Protective effect of ginger against alcohol-induced renal damage and antioxidant enzymes in male albino rats. Indian J. Exp. Biol. 2010, 48, 143–149. [Google Scholar] [PubMed]
- Reddy, A.C.P.; Lokesh, B.R. Studies on spice principles as antioxidants in the inhibition of lipid peroxidation of rat liver microsomes. Mol. Cell. Biochem. 1992, 111, 117–124. [Google Scholar] [PubMed]
- Lee, C.; Park, G.H.; Kim, C.Y.; Jang, J.H. 6-Gingerol attenuates β-amyloid-induced oxidative cell death via fortifying cellular antioxidant defense system. Food Chem. Toxicol. 2011, 49, 1261–1269. [Google Scholar] [CrossRef] [PubMed]
- Shim, S.; Kim, S.; Choi, D.S.; Kwon, Y.B.; Kwon, J. Anti-inflammatory effects of [6]-shogaol: Potential roles of HDAC inhibition and HSP70 induction. Food Chem. Toxicol. 2011, 49, 2734–2740. [Google Scholar] [CrossRef] [PubMed]
- Uchida, K. 4-Hydroxynonenal: A product and mediator of oxidative stress. Prog. Lipid Res. 2003, 42, 318–343. [Google Scholar] [CrossRef]
- Butterfield, D.A.; Lauderback, C.M. Lipid peroxidation and protein oxidation in Alzheimer’s disease brain: Potential causes and consequences involving amyloid beta-peptide associated free radical oxidative stress. Free Radic. Biol. Med. 2002, 32, 1050–1060. [Google Scholar] [CrossRef]
- Zappettini, S.; Grilli, M.; Guendalina, O.; Elisa, M.; Stefania, P.; Stefano, G.; Alessia, S.; Mario, M. Beta amyloid differently modulates nicotinic and muscarinic receptor subtypes which stimulate in vitro and in vivo the release of glycine in the rat hippocampus. Front. Pharmacol. 2012, 3, 1–9. [Google Scholar] [CrossRef] [PubMed]
- Oyama, Y.; Sakai, H.; Arata, T.; Okano, Y.; Akaike, N.; Sakai, K.; Noda, K. Cytotoxic effects of methanol, formaldehyde, and formate on dissociated rat thymocytes: A possibility of aspartame toxicity. Cell Biol. Toxicol. 2002, 18, 43–50. [Google Scholar] [CrossRef] [PubMed]
- Abu-Taweel, G.M. Effect of monosodium glutamate and aspartame on behavioral and biochemical parameters of male albino mice. Afr. J. Biotechnol. 2016, 15, 601–612. [Google Scholar]
- Kristova, V.; Kriska, M.; Babal, P.; Jezova, D. Early postnatal glutamate Treatment Results in altered Vascular Responsiveness to Serotonin and Noradrenalin in adult rats. Endocr. Regul. 1998, 32, 133–139. [Google Scholar] [PubMed]
- Mayhan, W.G.; Didion, S.P. Glutamate-induced disruption of the blood- brain barrier in rats. Role of nitric oxide. Stroke 1996, 27, 965–970. [Google Scholar] [CrossRef] [PubMed]
- Kumaravel, P.; Subash, S.; Seethalakshmi, K.S.; Murugan, N.; Yuvarajan, R.; Subramanian, P. Monosodium glutamate modulates the circadian rhythms of biochemical variables and behavioral activity in rats under constant light. Int. J. Nutr. Pharmacol. Neurol. Dis. 2012, 2, 251–257. [Google Scholar]
- Koenig, H.; Trout, J.J.; Goldstone, A.D.; Lu, C.Y. Capillary NMDA receptors regulate blood- brain barrier function and breakdown. Brain Res. 1992, 588, 297–303. [Google Scholar] [CrossRef]
- Nemeroff, C.B.; Crisley, F.D. Monosodium l-glutamate-induced convulsions: Temporary alteration in blood- brain barrier permeability to plasma proteins. Environ. Physiol. Biochem. 1975, 5, 389–395. [Google Scholar] [PubMed]
- Riyazi, A.; Hemel, A.; Bauer, K.; Geissler, N.; Schaaf, S.; Verspohl, E.J. The effect of the volatile oil from Ginger rhizomes (Zingiber officinale), its fractions and isolated compounds on the 5-HT3 receptor complex and the serotoninergic system of the rat ileum. Planta Med. 2007, 73, 355–362. [Google Scholar] [CrossRef] [PubMed]
- Ferezou, I.; Cauli, B.; Hill, E.L.; Rossier, J.; Hamel, E.; Lambolez, B. 5-HT3 receptors medate serotonergic fast synaptic excitation of neocortical vasoactive intestinal peptide cholecystokinin intemeurom. J. Neurosci. 2002, 22, 7389–7397. [Google Scholar] [PubMed]
- Chameau, P.; Van-Hooft, J.A. Serotonin 5-HT (3) receptors in the central nervous system. Cell Tissue Res. 2006, 326, 573–581. [Google Scholar] [CrossRef] [PubMed]
- Fink, K.B.; Gothert, M. 5-HT receptor regulation of neurotrammitter release. Phacol. Rev. 2007, 59, 360–417. [Google Scholar]
- Wang, Y.; Qin, Z. Molecular and cellular mechanisms of excitotoxic neuronal death. Apoptosis 2010, 15, 1382–1402. [Google Scholar] [CrossRef] [PubMed]
- Swamy, A.H.M.; Patel, N.L.; Gadad, P.C.; Koti, B.C.; Patel, U.M.; Thippeswamy, A.H.M.; Manjula, D.V. Neuroprotective Activity of Pongamia pinnata in Monosodium Glutamate-induced Neurotoxicity in Rats. Indian J. Pharm. Sci. 2013, 75, 657–663. [Google Scholar] [PubMed]
- Mukherjee, S.; Mandal, N.; Dev, A.; Mondal, B. An approach towards optimization of the extraction of polyphenolic antioxidants from ginger (Zingiber officinale). J. Food Sci. Technol. 2014, 51, 3301–3308. [Google Scholar] [CrossRef] [PubMed]
- Von Gadow, A.; Joubert, E.; Hansmann, C.F. Comparison of antioxidant activity of aspalathin with that of other plant phenols of Rooibosed tea (Aspalathon linearis), a-tocopherol, BHT and BHA. J. Agric. Food Chem. 1997, 45, 632–638. [Google Scholar] [CrossRef]
- El-Ghorab, A.H.; Nauman, M.; Anjum, F.M.; Hussain, S.; Nadeem, M. A comparative study on chemical composition and antioxidant activity of ginger (Zingiber officinale) and cumin (Cuminum cyminum). J. Agric. Food Chem. 2010, 58, 8231–8237. [Google Scholar] [CrossRef] [PubMed]
- Jayaprakasha, G.K.; Selvi, T.; Sakaria, K.K. Antibacterial and antioxidant activities of grape (Vitis vinifera) seed extracts. Food Res. Int. 2003, 36, 117–122. [Google Scholar] [CrossRef]
- Scully, C. Oral cancer: New insights into pathogenesis. Dent. Update 1993, 20, 95–100. [Google Scholar] [PubMed]
- Yermilov, V.; Rubio, J.; Becchi, M.; Friesen, M.D.; Pignatelli, B.; Ohshima, H. Formation of 8-nitroguanine by the reaction of guanine with peroxynitrite in vitro. Carcinogenesis 1995, 16, 2045–2050. [Google Scholar] [CrossRef] [PubMed]
- Carocho, M.; Ferreira, I. A review on antioxidants, prooxidants and related controversy: Natural and synthetic compounds, screening and analysis methodologies and future perspectives. Food Chem. Toxicol. 2013, 51, 15–25. [Google Scholar] [CrossRef] [PubMed]
- Kumar, S.; Mishra, A.; Pandey, A.K. Antioxidant mediated protective effect of Parthenium hysterophorus against oxidative damage using in vitro models. BMC Complement. Altern. Med. 2013, 13, 120. [Google Scholar] [CrossRef] [PubMed]
- Kumar, S.; Pandey, S.; Pandey, A.K. In Vitro Antibacterial, Antioxidant, and Cytotoxic Activities of Parthenium hysterophorus and Characterization of Extracts by LC-MS Analysis. Biomed. Res. Int. 2014, 2014, 495154. [Google Scholar] [CrossRef]
- Joshi, R.; Kumar, S.; Unnkrishnan, M.; Mukherjee, T. Free radical scavenging reactions of sulfasalazine, 5-aminosalicylic and sulfapyridine: Mechanistic aspects and antioxidant activity. Free Radic. Res. 2005, 39, 1163–1172. [Google Scholar] [CrossRef] [PubMed]
- Souillac, P.O.; Middaugh, C.R.; Rytting, J.H. Investigation of protein/carbohydrate interactions in the dried state 2. Diffuse reflectance FTIR studies. Int. J. Pharm. 2002, 235, 207–218. [Google Scholar] [CrossRef]
- Cawley, T.A., Jr.; Shickley, T.J. The potential neurotoxin 2-OH-dopamine is an inhibitor of arylsulfatase. Ann. N. Y. Acad. Sci. 1992, 648, 256–259. [Google Scholar] [CrossRef] [PubMed]
- Liu, F.; NG, T.B. Antioxidative and free radical scavenging activities of selected medicinal herbs. Life Sci. 1999, 66, 725–735. [Google Scholar] [CrossRef]
- Sreejayan Rao, M.N. Nitric oxide scavenging by curcuminoids. J. Pharm. Pharmacol. 1997, 49, 105–107. [Google Scholar] [CrossRef]
- Oyaizu, M. Studies on products of browning reaction: Antioxidative activities of products of browning reaction prepared from glucosamine. Jpn. J. Nutr. 1986, 44, 307–314. [Google Scholar] [CrossRef]
- Canadian Council on Animal Care. Guide to the Care and Use of Experimental Animals, 2nd ed.; CCAC: Ottawa, ON, Canada, 1993. [Google Scholar]
- Ali, M.M.; Bawari, M.; Misra, U.K.; Babu, G.N. Locomotor and Learning Deficits in Adult Rats Exposed to Monosodium-l-Glutamate during Early Life. Neurosci. Lett. 2000, 284, 57–60. [Google Scholar] [CrossRef]
- Diniz, Y.S.; Fernandes, A.A.; Campo, K.E.; Mani, F.; Ribas, B.O.; Novelli, E.L. Toxicity of hypercaloric diet and monosodium glutamate: Oxidative stress and metabolic shifting in hepatic tissue. Food Chem. Toxicol. 2004, 42, 319–325. [Google Scholar] [CrossRef]
- Ohkawa, H.; Ohishi, N.; Yagi, K. Assay for lipid peroxides in animal tissues by thiobarbituric acid reaction. Anal. Biochem. 1979, 95, 351–358. [Google Scholar] [CrossRef]
- Baker, M.A.; Cerniglia, G.J.; Zaman, A. Microtiter plate assay for the measurement of glutathione and glutathione disulfide in large numbers of biological samples. Anal. Biochem. 1990, 190, 360–365. [Google Scholar] [CrossRef]
- Montgomery, H.A.C.; Dymock, J.F. The determination of nitrite in water. Analyst 1961, 86, 414–416. [Google Scholar]
- Marklund, S.; Marklund, G. Involvement of the superoxyde anion radical in the auto oxidation of pyrogallol and a convenient assay for superoxide dismutase. Eur. J. Biochem. 1974, 47, 469–474. [Google Scholar] [CrossRef] [PubMed]
- Fossati, P.; Prencipe, L.; Berti, G. Use of 3,5-Dichloro-2-hydroxybenzenesulfonic Acid/4-Ami nophenazone Chromogenic System in Direct Enzymic Assay of Uric Acid in Serum and Urine. Clin. Chem. 1980, 26, 227–231. [Google Scholar] [PubMed]
- Tehranian, R.; Rose, M.E.; Vagni, V.; Pickrell, A.M.; Griffith, R.P.; Liu, H.; Clark, R.S.; Dixon, C.E.; Kochanek, P.M.; Graham, S.H. Disruption of Bax protein prevents neuronal cell death but produces cognitive impairment in mice following traumatic brain injury. J. Neurotrauma 2008, 25, 755–767. [Google Scholar] [CrossRef] [PubMed]
- Bradford, M.M. Rapid and sensitive method for the quantitation of microgram quantities of protein utilizing the principle of protein-dye binding. Anal. Biochem. 1976, 72, 248–254. [Google Scholar] [CrossRef]
- Ellman, G.L.; Callaway, E. Erythrocyte cholinesterase-levels in mental patients. Nature 1961, 23, 1216. [Google Scholar] [CrossRef]
- Lodovici, M.; Casalini, C.; Briani, C.; Dolara, P. Oxidative liver DNA damage in rats treated with pesticide mixtures. Toxicology 1997, 117, 55–60. [Google Scholar] [CrossRef]
- Trinder, P. Colorimetric method for determination of sodium in body fluids. Analyst 1951, 76, 596. [Google Scholar] [CrossRef]
- Sunderman, F.W., Jr.; Sunderman, F.W. Studies in serum electrolytes. XXII. A rapid, reliable method for serum potassium using tetraphenylboron. Am. J. Clin. Pathol. 1958, 29, 95–103. [Google Scholar] [CrossRef] [PubMed]
- Grindler, E.M.; King, J.D. Rapid colorimetric determination of Calciul in biologic fluids with methylthymol blue. Am. J. Clin. Pathol. 1972, 58, 376. [Google Scholar] [CrossRef]
Sample Availability: Samples of the compounds are available from the authors. |


| Ginger Powder | Propolis Powder | ||
|---|---|---|---|
| Wave Number (cm−1) | Assignments | Wave Number (cm−1) | Assignments |
| 3422.96 | υ (O–H) cryst. water | 3389.7 | υ (O–H), υ (NH) |
| 2923.38 | υass (CH2) | 2924.13 | υass (CH2) |
| 2377.44 | ---------- | 2377.55 | ------------- |
| 2053.16 | ---------- | 2152.7 | υass (-C≡C-) |
| 1641.47 | δ (H2O), amide I (C=O) | 2075.96 | ------------- |
| 1458.21 | Aromatic skeletal combined with C–H in plane deforming and stretching | 1647.59 | δ (H2O), amide I (C=O) |
| 1374.64 | Aromatic skeletal combined with C–H in plane deforming and stretching | 1545.6 | δ (HNH), (N–O), Q(C=O) |
| 1245.25 | υ (C–O–C), υ (C–F) | 1425.68 | υ (C–H) wagg., δ (-CH=CH-) |
| 1158.76 | υ (C–O–C), υ (C–F) | 1373.73 | Aromatic skeletal combined with C–H in plane deforming and stretching |
| 1082.81 | υ (C–O–C), υ (C–F) | 1246.75 | υ (C–O–C) or acid, υ (C–F) |
| 1025.34 | Amino acid, δ (C–H), υ (C–C) | 1153.72 | υ (C–O–C) or, υ (C–F) |
| 850.75 | υ (=C–H), δ (C–CL) | 1023.08 | υ (C–O–C) or, υ (C–F) |
| 763.65 | υ (C–H), δ (C–CL) | 863.1 | υ (=C–H) |
| 703.4 | υ (C–H), δ (C–CL) | 768.52 | υ (C–H), δ (C–CL) |
| 577.29 | δ (C–Br) | 709.66 | υ (C–H), δ (C–CL) |
| 573.5 | δ (C–Br) | ||
| Groups | Calcium (mmol/L) | Sodium (mmol/L) | Potassium (mmol/L) |
|---|---|---|---|
| Normal control (drinking H2O) | 0.598 ± 0.048 b | 157.949 ± 1.8 b | 10.929 ± 0.51 b |
| Monosodium glutamate (MSG) | 0.941 ± 0.011 a,* | 192.268 ± 3.5 a,* | 6.790 ± 0.35 a,* |
| MSG + Ginger | 0.675 ± 0.063 b | 164.947 ± 4.1 b | 8.739 ± 0.44 a,b |
| MSG + Propolis | 0.594 ± 0.021 b | 164.161 ± 3.3 b | 9.112 ± 0.49 a,b |
© 2017 by the authors. Licensee MDPI, Basel, Switzerland. This article is an open access article distributed under the terms and conditions of the Creative Commons Attribution (CC BY) license (http://creativecommons.org/licenses/by/4.0/).
Share and Cite
Hussein, U.K.; Hassan, N.E.-H.Y.; Elhalwagy, M.E.A.; Zaki, A.R.; Abubakr, H.O.; Nagulapalli Venkata, K.C.; Jang, K.Y.; Bishayee, A. Ginger and Propolis Exert Neuroprotective Effects against Monosodium Glutamate-Induced Neurotoxicity in Rats. Molecules 2017, 22, 1928. https://doi.org/10.3390/molecules22111928
Hussein UK, Hassan NE-HY, Elhalwagy MEA, Zaki AR, Abubakr HO, Nagulapalli Venkata KC, Jang KY, Bishayee A. Ginger and Propolis Exert Neuroprotective Effects against Monosodium Glutamate-Induced Neurotoxicity in Rats. Molecules. 2017; 22(11):1928. https://doi.org/10.3390/molecules22111928
Chicago/Turabian StyleHussein, Usama K., Nour El-Houda Y. Hassan, Manal E.A. Elhalwagy, Amr R. Zaki, Huda O. Abubakr, Kalyan C. Nagulapalli Venkata, Kyu Yun Jang, and Anupam Bishayee. 2017. "Ginger and Propolis Exert Neuroprotective Effects against Monosodium Glutamate-Induced Neurotoxicity in Rats" Molecules 22, no. 11: 1928. https://doi.org/10.3390/molecules22111928