Simultaneous Determination of Multiple Classes of Hydrophilic and Lipophilic Components in Shuang-Huang-Lian Oral Liquid Formulations by UPLC-Triple Quadrupole Linear Ion Trap Mass Spectrometry

Abstract
:1. Introduction
2. Results and Discussion
2.1. Optimization of UPLC-MS/MS Conditions
2.2. Method Validation
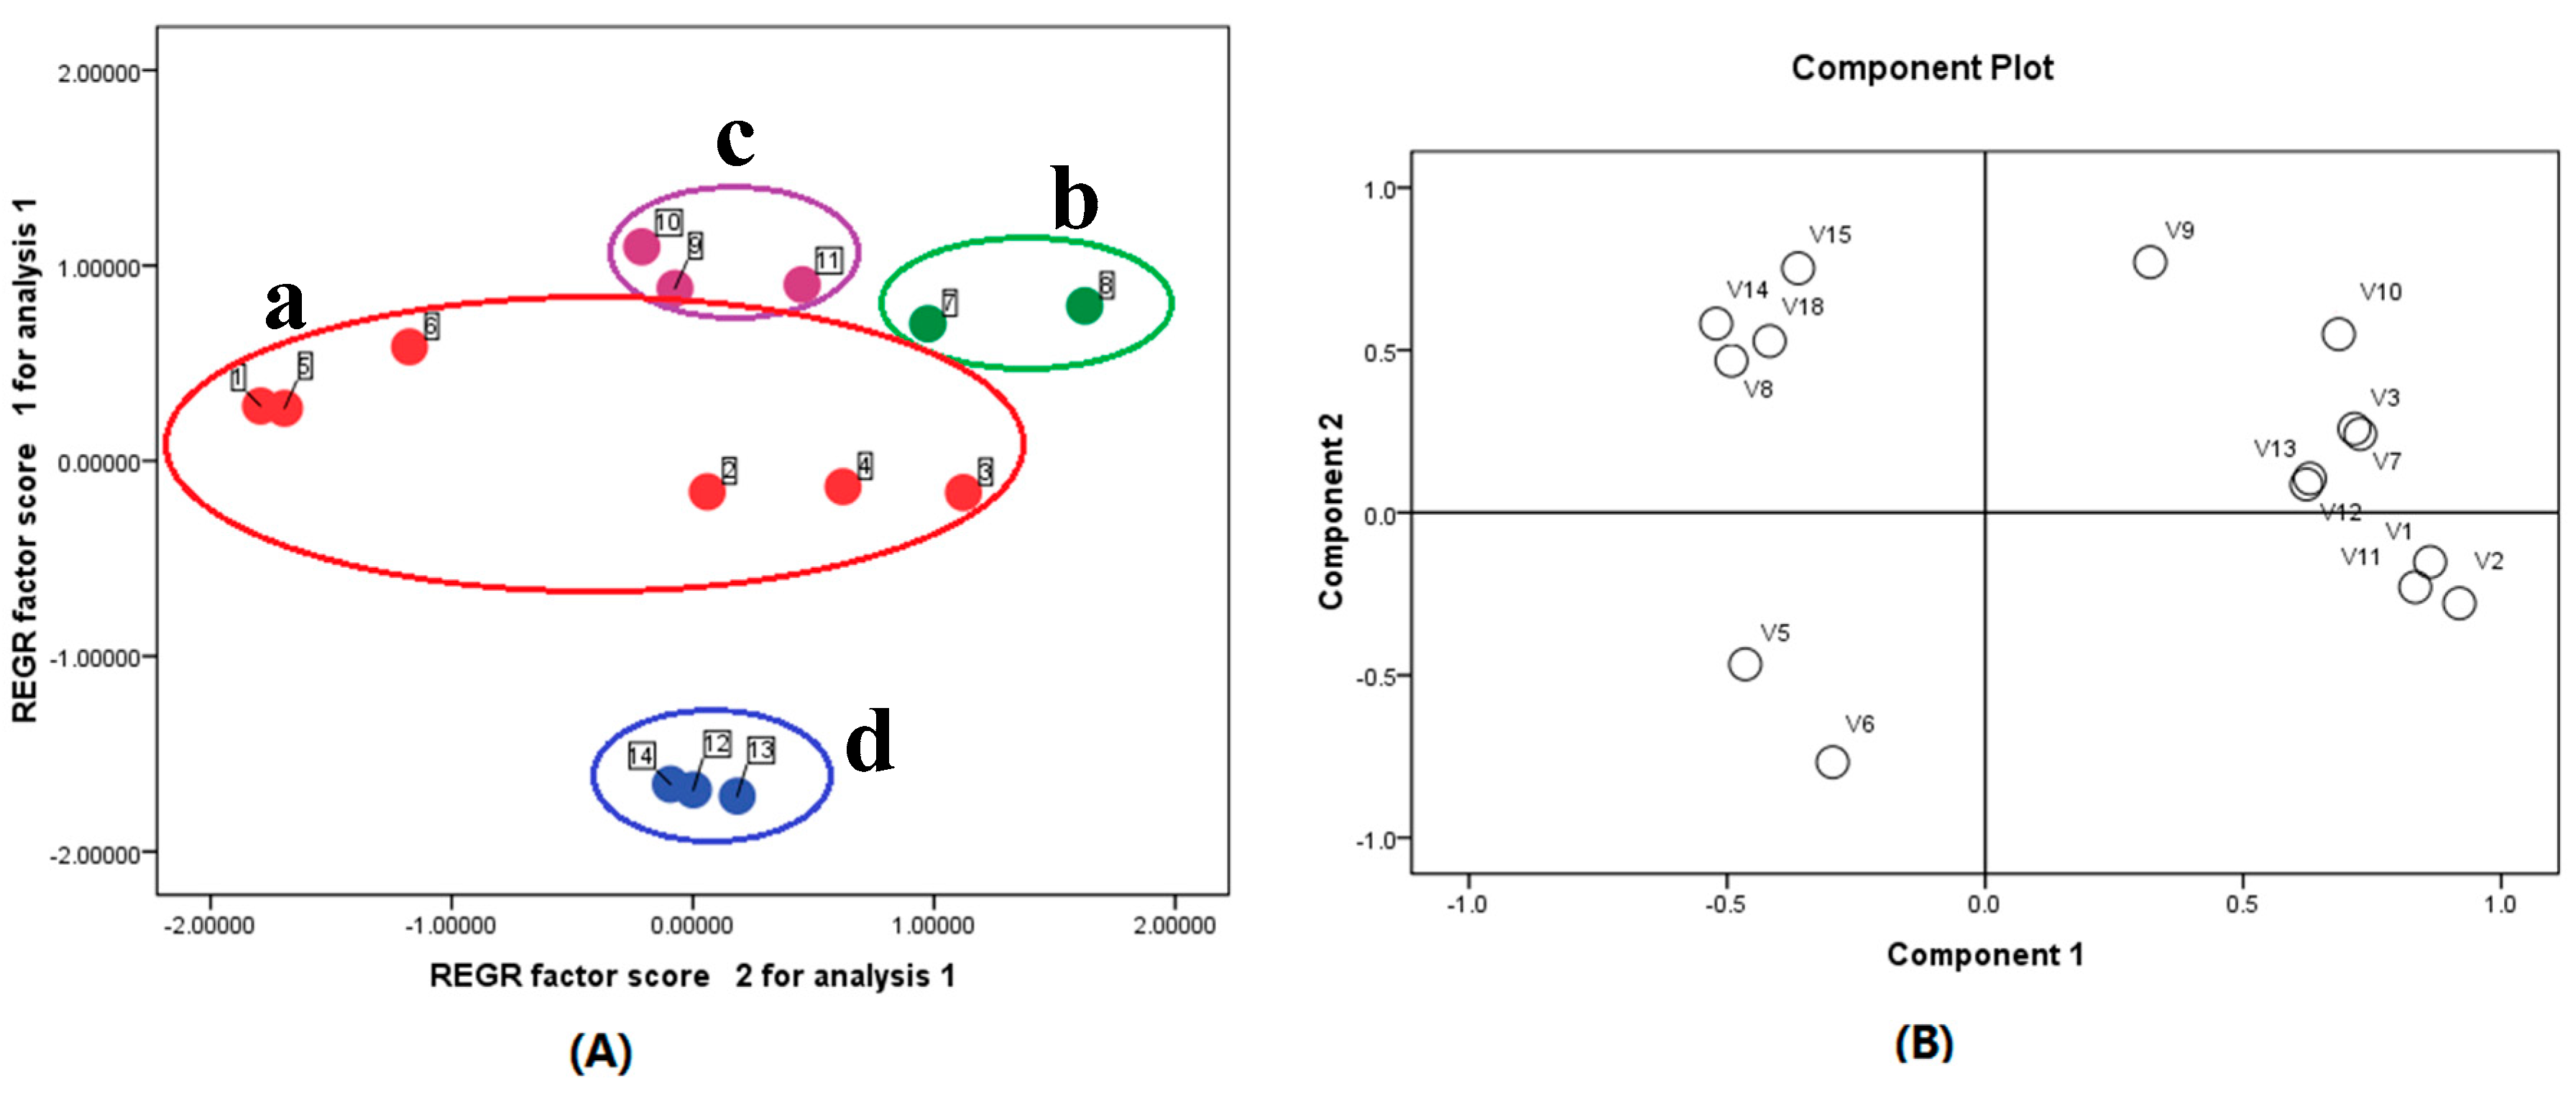
2.3. Sample Analysis
3. Materials and Methods
3.1. Chemicals and Materials
3.2. Preparation of Standard Solutions
3.3. Samples Preparation
3.4. Chromatographic and MS Conditions
4. Conclusions
Supplementary Materials
Acknowledgments
Author Contributions
Conflicts of Interest
References
- Ye, J.X.; Wei, W.; Quan, L.H.; Liu, C.Y.; Chang, Q.; Liao, Y.H. An LC–MS/MS method for the simultaneous determination of chlorogenic acid, forsythiaside A and baicalin in rat plasma and its application to pharmacokinetic study of Shuang-huang-lian in rats. J. Pharm. Biomed. Anal. 2010, 52, 625–630. [Google Scholar] [CrossRef] [PubMed]
- Ma, Y.C.; Wang, X.Q.; Hou, F.F.; Ma, J.; Luo, M.; Chen, A.; Jin, P.; Lu, S.; Xu, I. Rapid resolution liquid chromatography (RRLC) analysis and studies on the stability of Shuang-Huang-Lian preparations. J. Pharm. Biomed. Anal. 2011, 54, 265–272. [Google Scholar] [CrossRef] [PubMed]
- Cao, Y.; Wang, L.; Yu, X. Development of the chromatographic fingerprint of herbal preparations Shuang-Huang-Lian oral liquid. J. Pharm. Biomed. Anal. 2006, 41, 845–856. [Google Scholar] [CrossRef] [PubMed]
- Yan, G.L.; Zhang, A.H.; Sun, H. An effective method for determining the ingredients of Shuanghuanglian formula in blood samples using high-resolution LC–MS coupled with background subtraction and a multiple data processing approach. J. Sep. Sci. 2013, 36, 3191–3199. [Google Scholar] [CrossRef] [PubMed]
- Chen, G.; Zhang, H.W.; Ye, J.N. Determination of baicalein, baicalin and quercetin in Scutellariae Radix and its preparations by capillary electrophoresis with electrochemical detection. Talanta 2000, 53, 471–479. [Google Scholar] [CrossRef]
- Yang, L.I.; Yan, Q.; Mo, H.Z. Determination of chlorogenic acid, baicalin and forsythin in Shuanghuanglian preparations by HPLC-DAD. J. Chilean Chem. Soc. 2012, 57, 1361–1363. [Google Scholar] [CrossRef]
- Ban, L.N.; Xu, Y.J. Simultaneous determination of four effective components in Shuanghuanglian oral liquid by HPLC/MS. Chin. Tradit. Pat. Med. 2012, 34, 265–268. [Google Scholar]
- Zhang, Y.M.; Yan, D.; Zhang, P.; Ren, Y.S.; Zhang, S.F.; Feng, X.; Xiao, X.H. Quality control of Shuanghuanglian freeze-dried powder for injection based on its HPLC-ELSD fingerprints and biological profiles. Acta Pharm. Sin. 2010, 45, 93–97. [Google Scholar]
- Liu, L.; Suo, Z.R.; Zheng, J.B. Simultaneous determination of four compounds in Sanjing Shuanghuanglian oral liquid by high performance liquid chromatography-diode array detection-electrochemical detection. Chin. J. Chromatogr. 2006, 24, 247–250. [Google Scholar]
- Liu, T.; Di, L.Q.; Peng, L.X.; Kang, A.; Li, J.S.; Zhao, X.L. Simultaneous determination of 17 major components of Shuang-Huang-Lian oral liquid by UPLC-MS/MS. Chin. Tradit. Herb. Drugs 2015, 46, 3357–3363. [Google Scholar]
- Huang, M.; Zhao, H.; Xu, W.; Chu, K.; Hong, Z.; Peng, J.; Chen, L. Rapid simultaneous determination of twelve major components in Pien Tze Huang by ultra-performance liquid chromatography coupled with triple quadrupole mass spectrometry. J. Sep. Sci. 2013, 36, 3866–3873. [Google Scholar] [CrossRef] [PubMed]
- Qian, Z.M.; Li, H.J.; Li, P. Simultaneous qualitation and quantification of thirteen bioactive compounds in Flos lonicerae by high-performance liquid chromatography with diode array detector and mass spectrometry. Chem. Pharm. Bull. 2007, 55, 1073–1076. [Google Scholar] [CrossRef] [PubMed]
- Zuo, F.; Zhou, Z.M.; Liu, M.L. Determination of 14 chemical constituents in the traditional Chinese medicinal preparation Huangqin-Tang by high performance liquid chromatography. Biol. Pharm. Bull. 2001, 24, 693–697. [Google Scholar] [CrossRef] [PubMed]
- Guo, H.; Liu, A.H.; Li, L. Simultaneous determination of 12 major constituents in Forsythia suspensa by high performance liquid chromatography-DAD method. J. Pharm. Biomed. Anal. 2007, 43, 1000–1006. [Google Scholar] [CrossRef] [PubMed]
Sample Availability: Not available. |


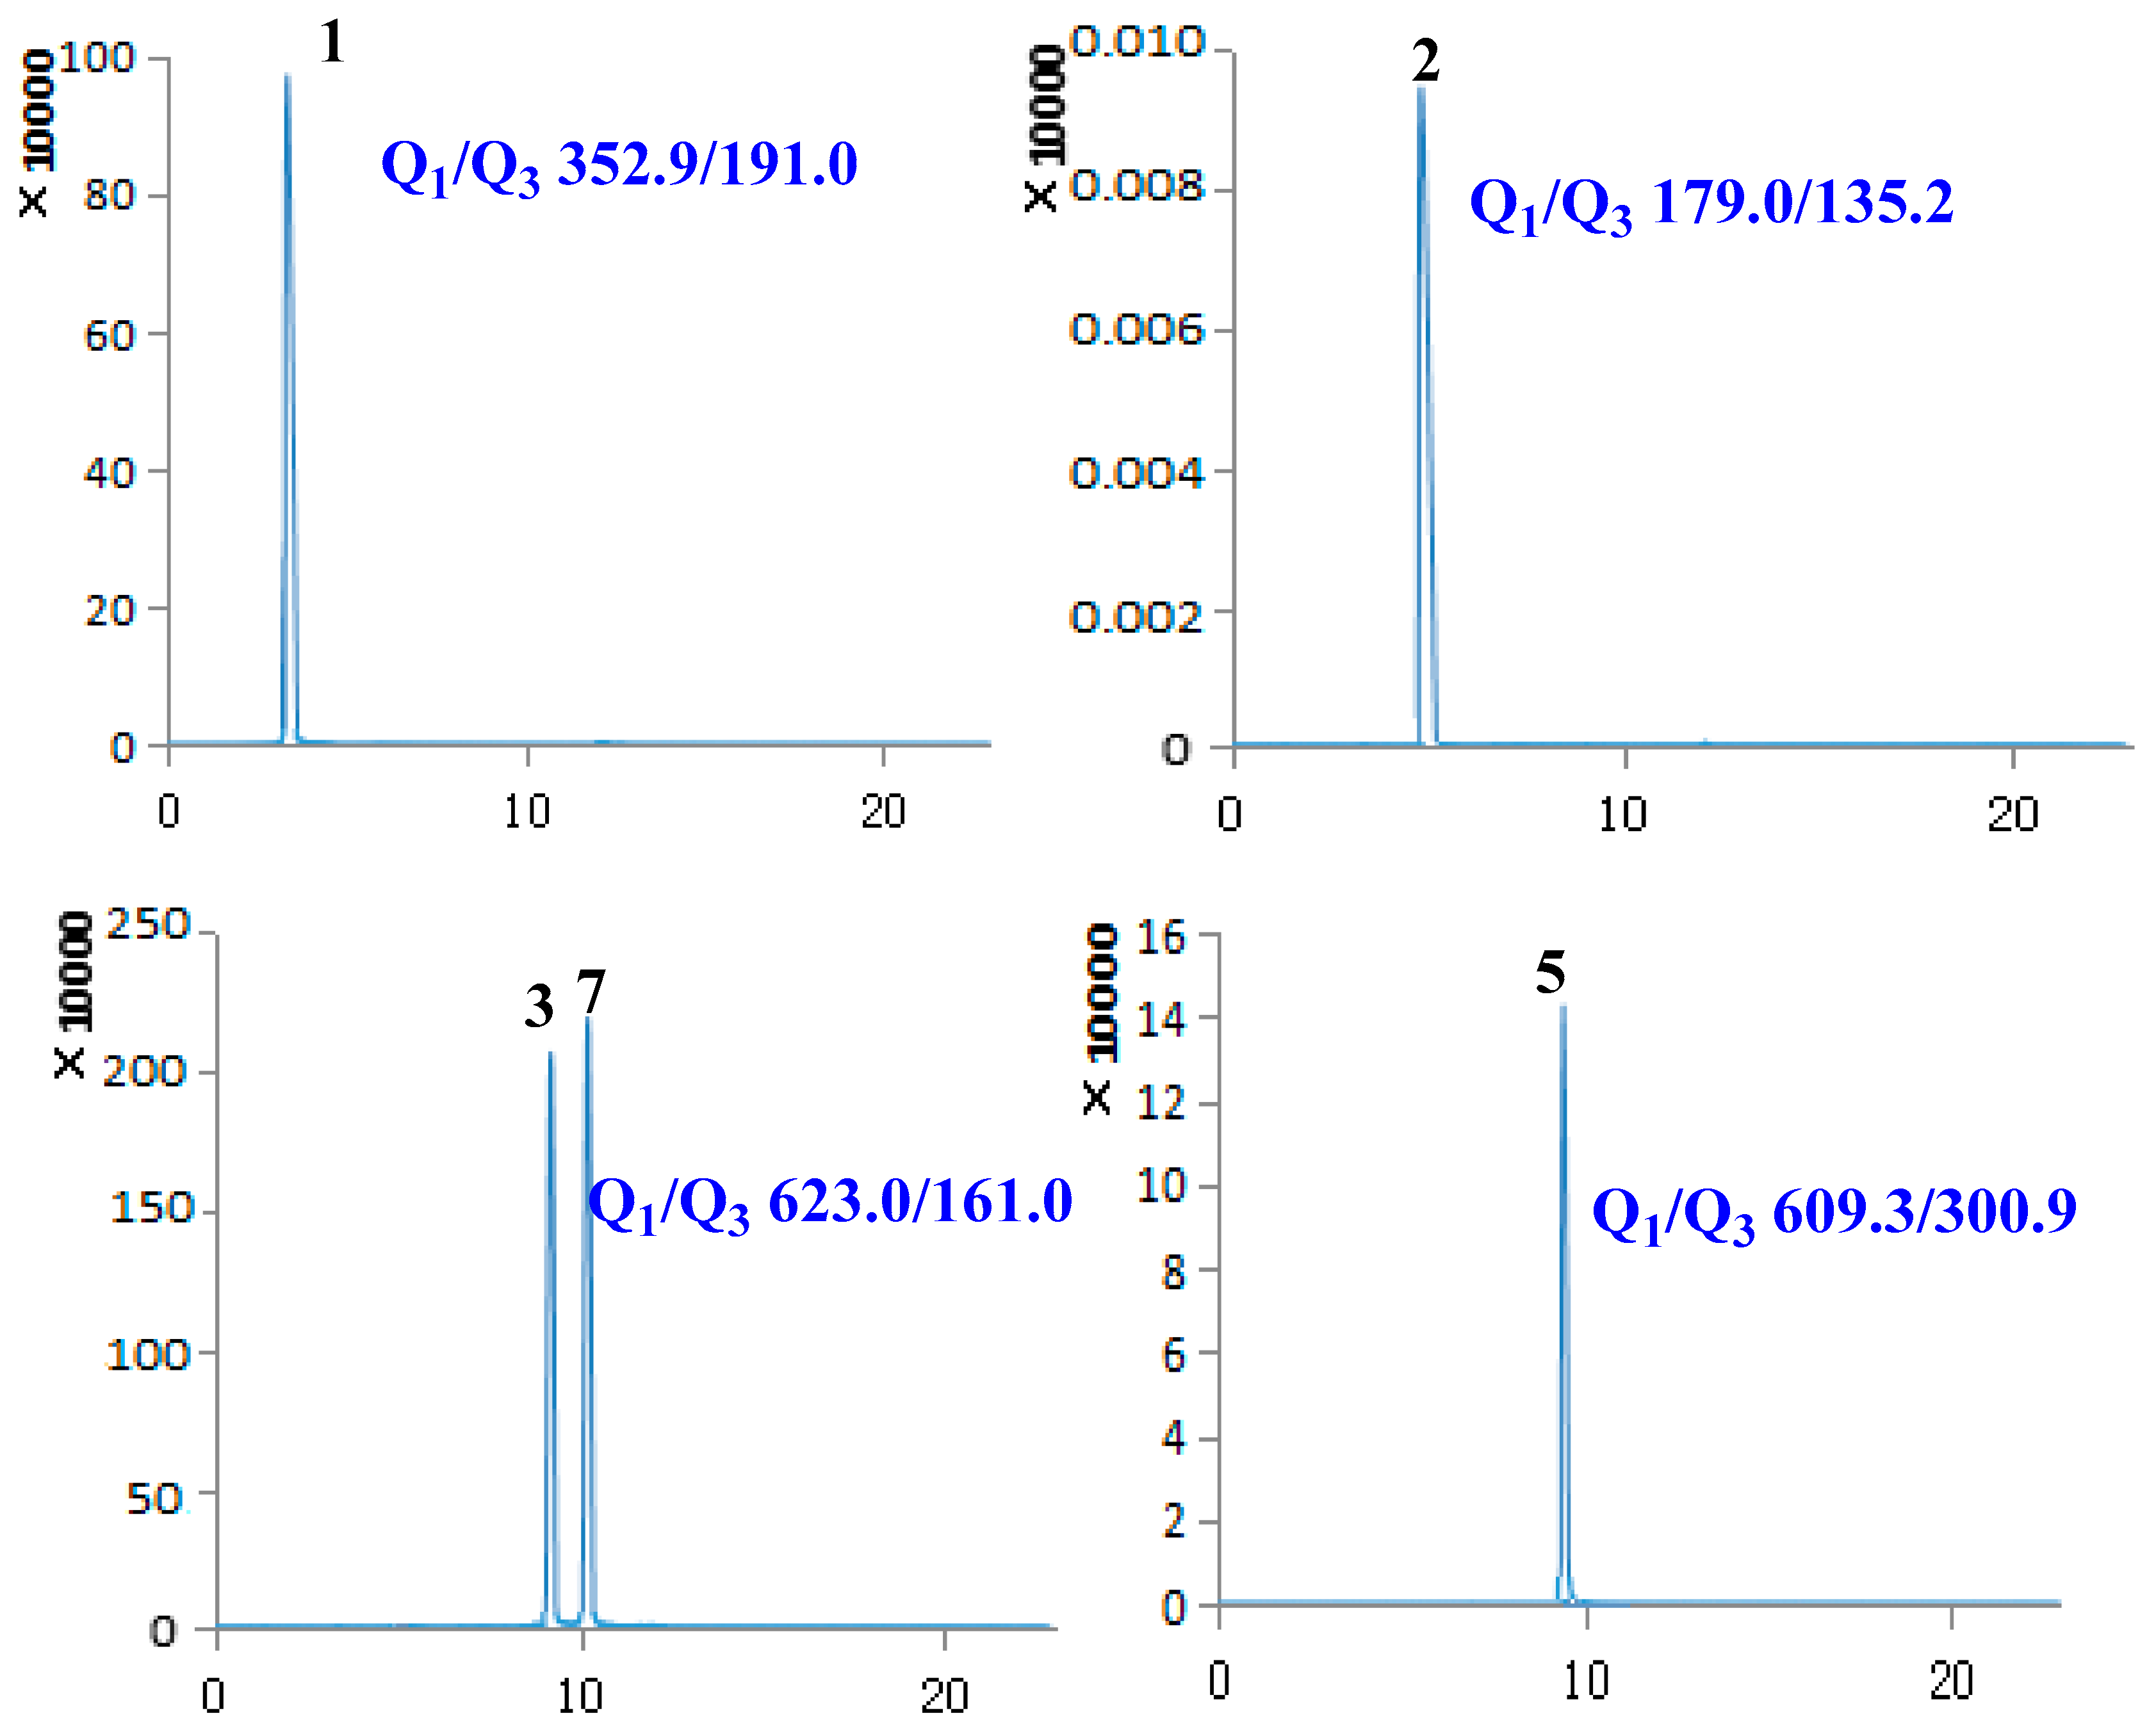
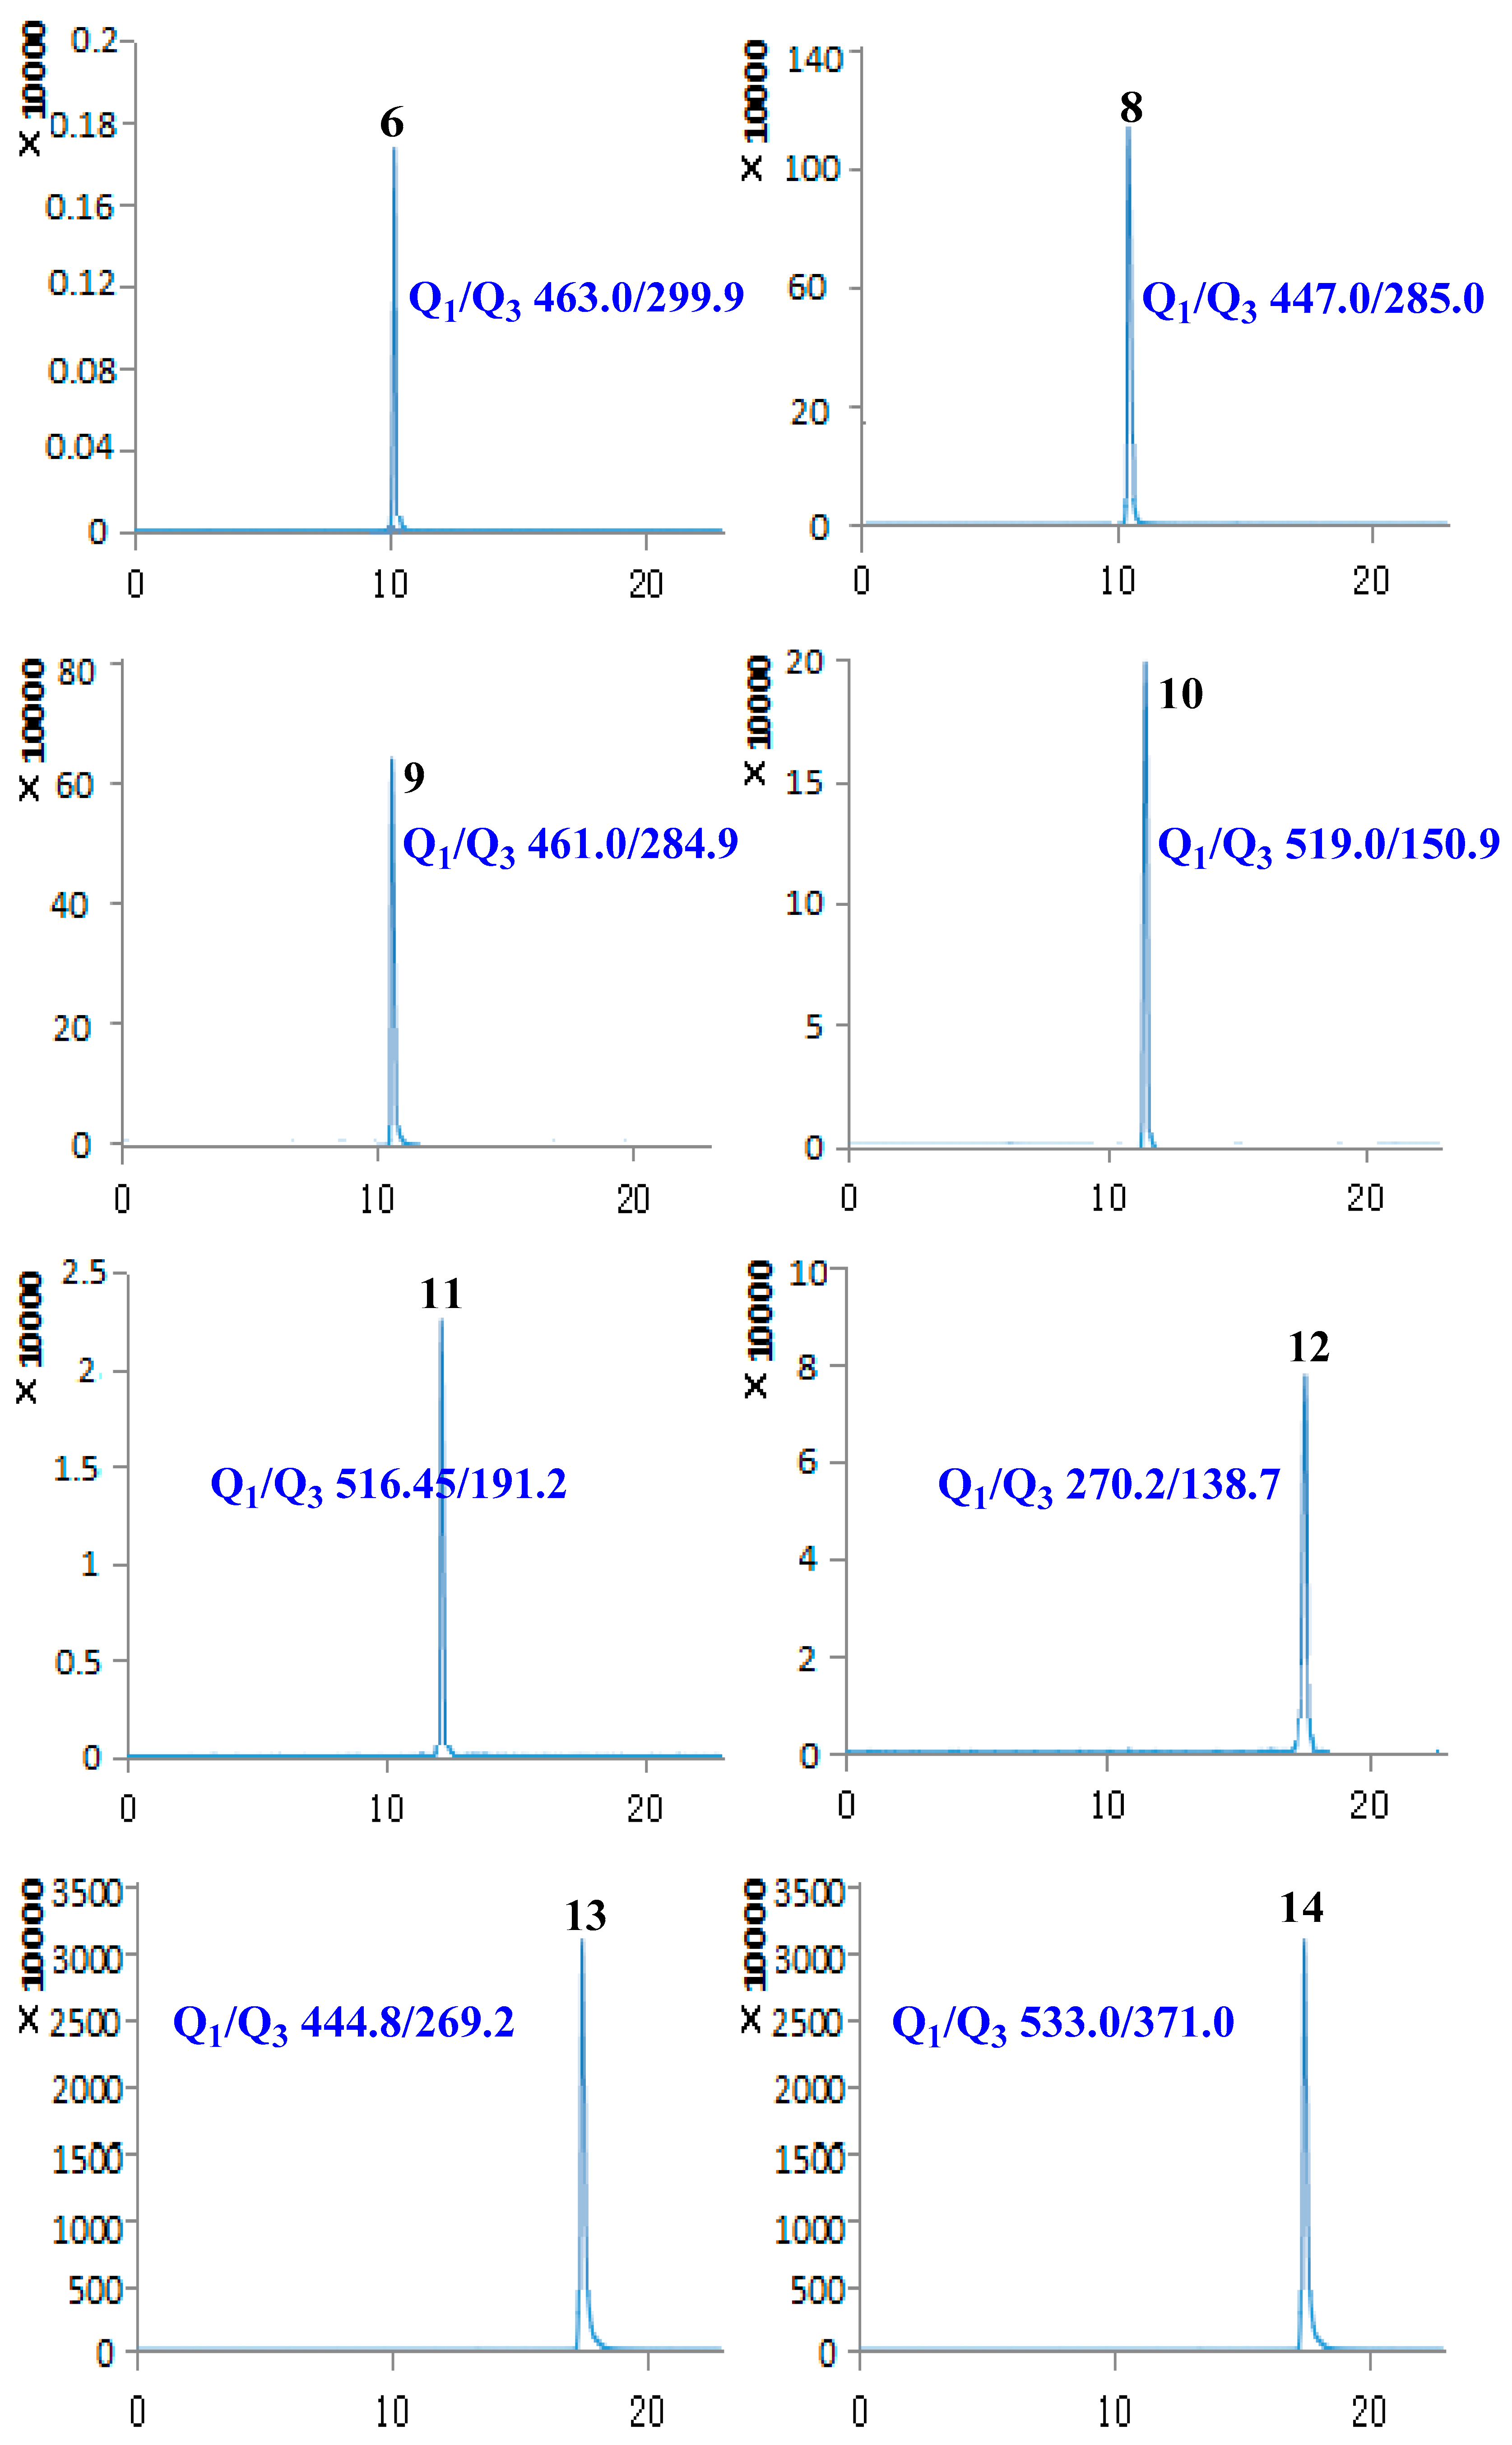
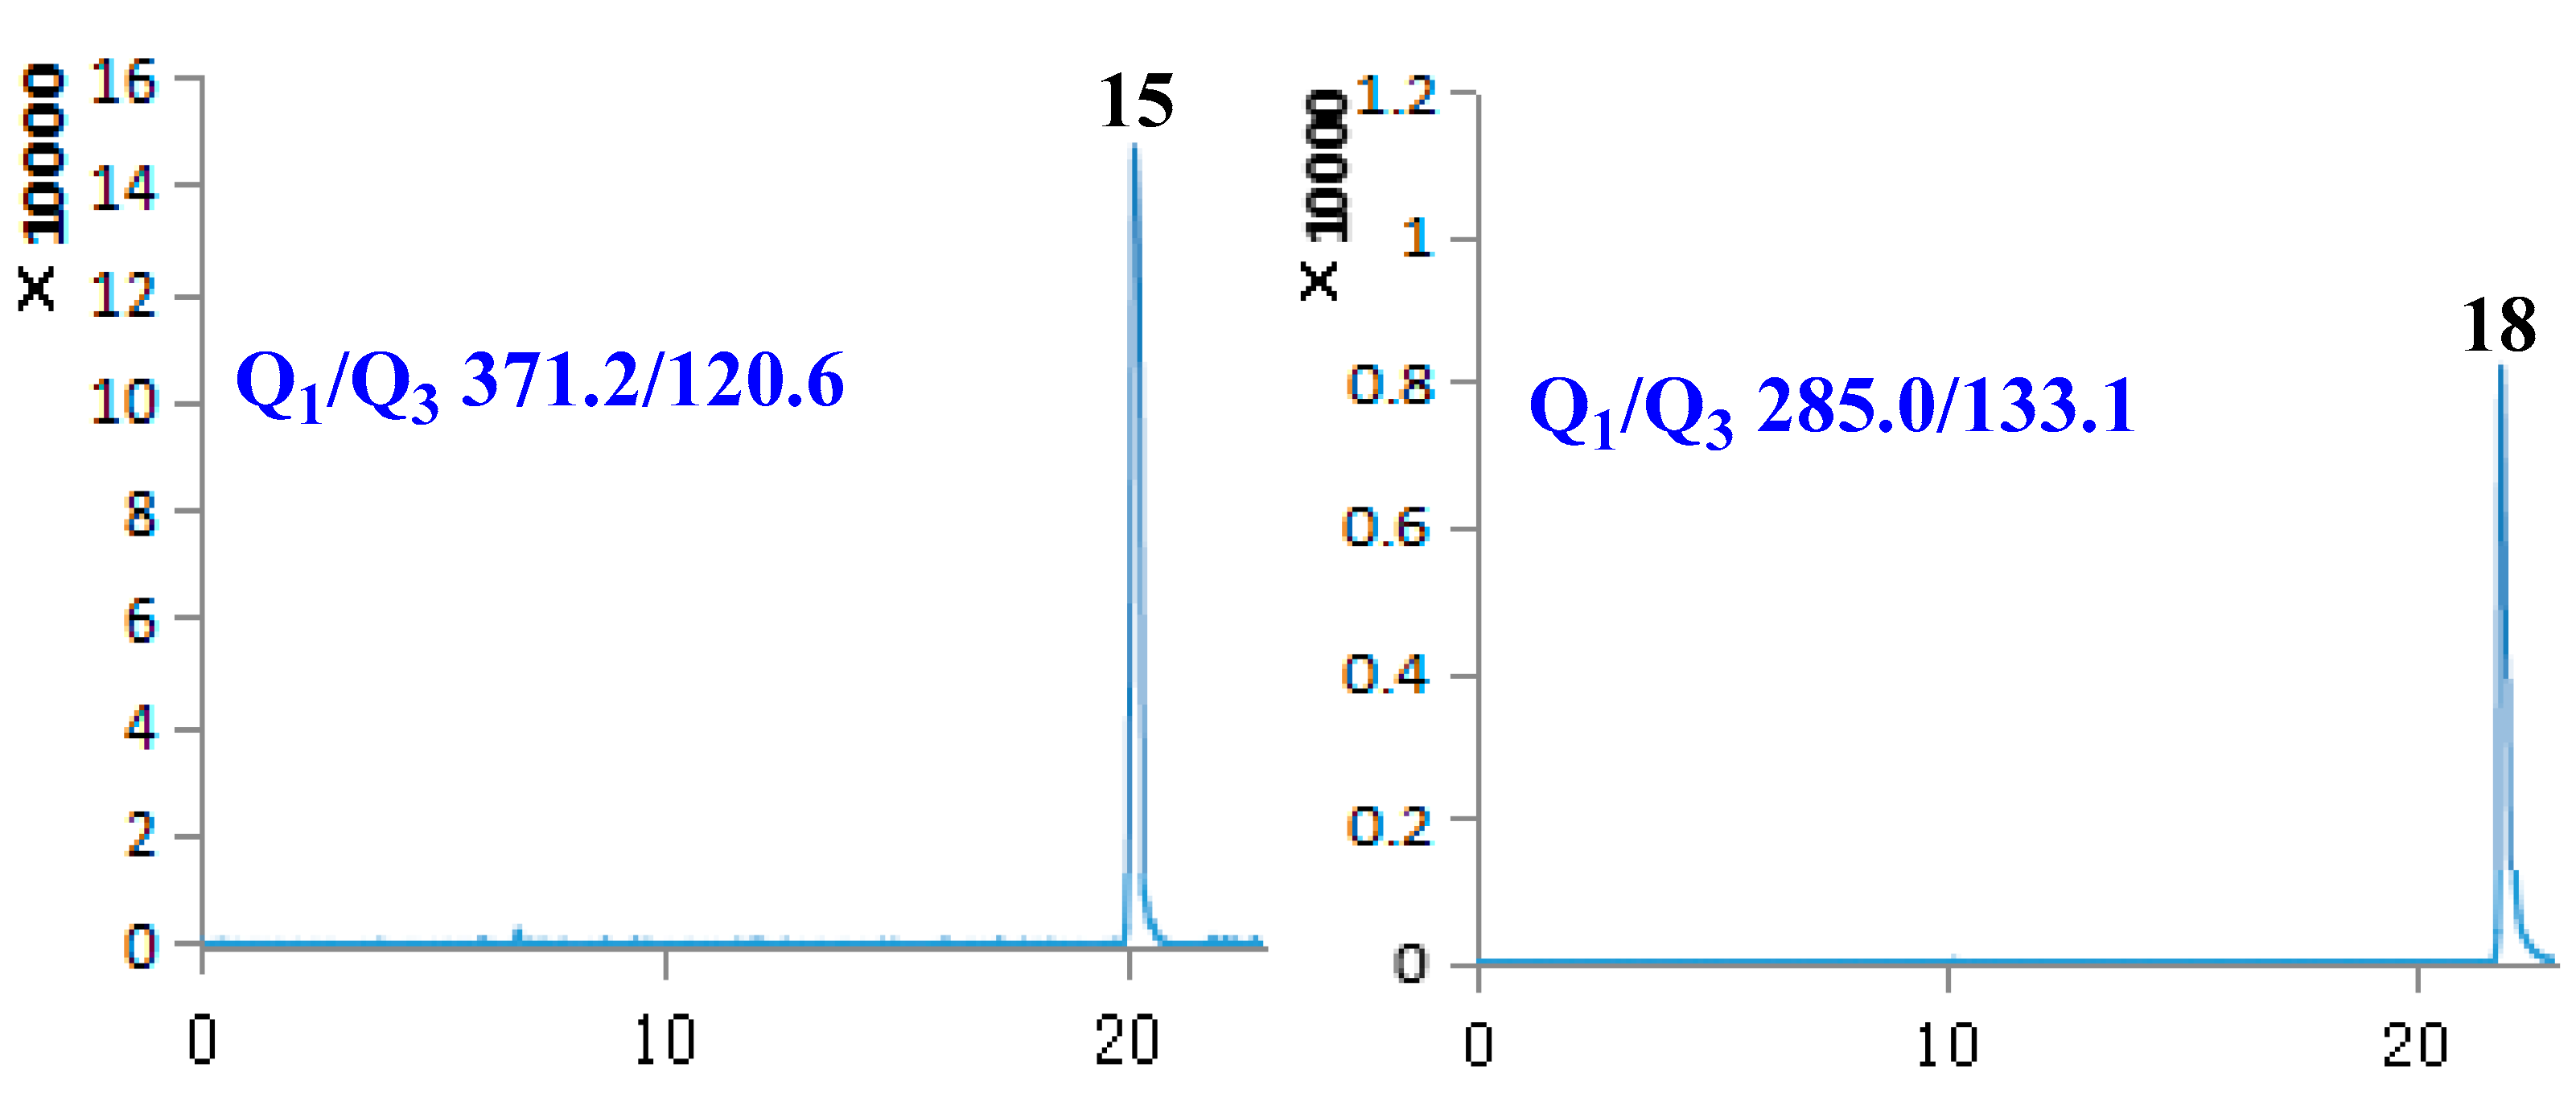
| No. | Compound Name | Retention Time (min) | Molecular Weight | Selected Ion (m/z) | Q1 | Q3 | DP | CE |
|---|---|---|---|---|---|---|---|---|
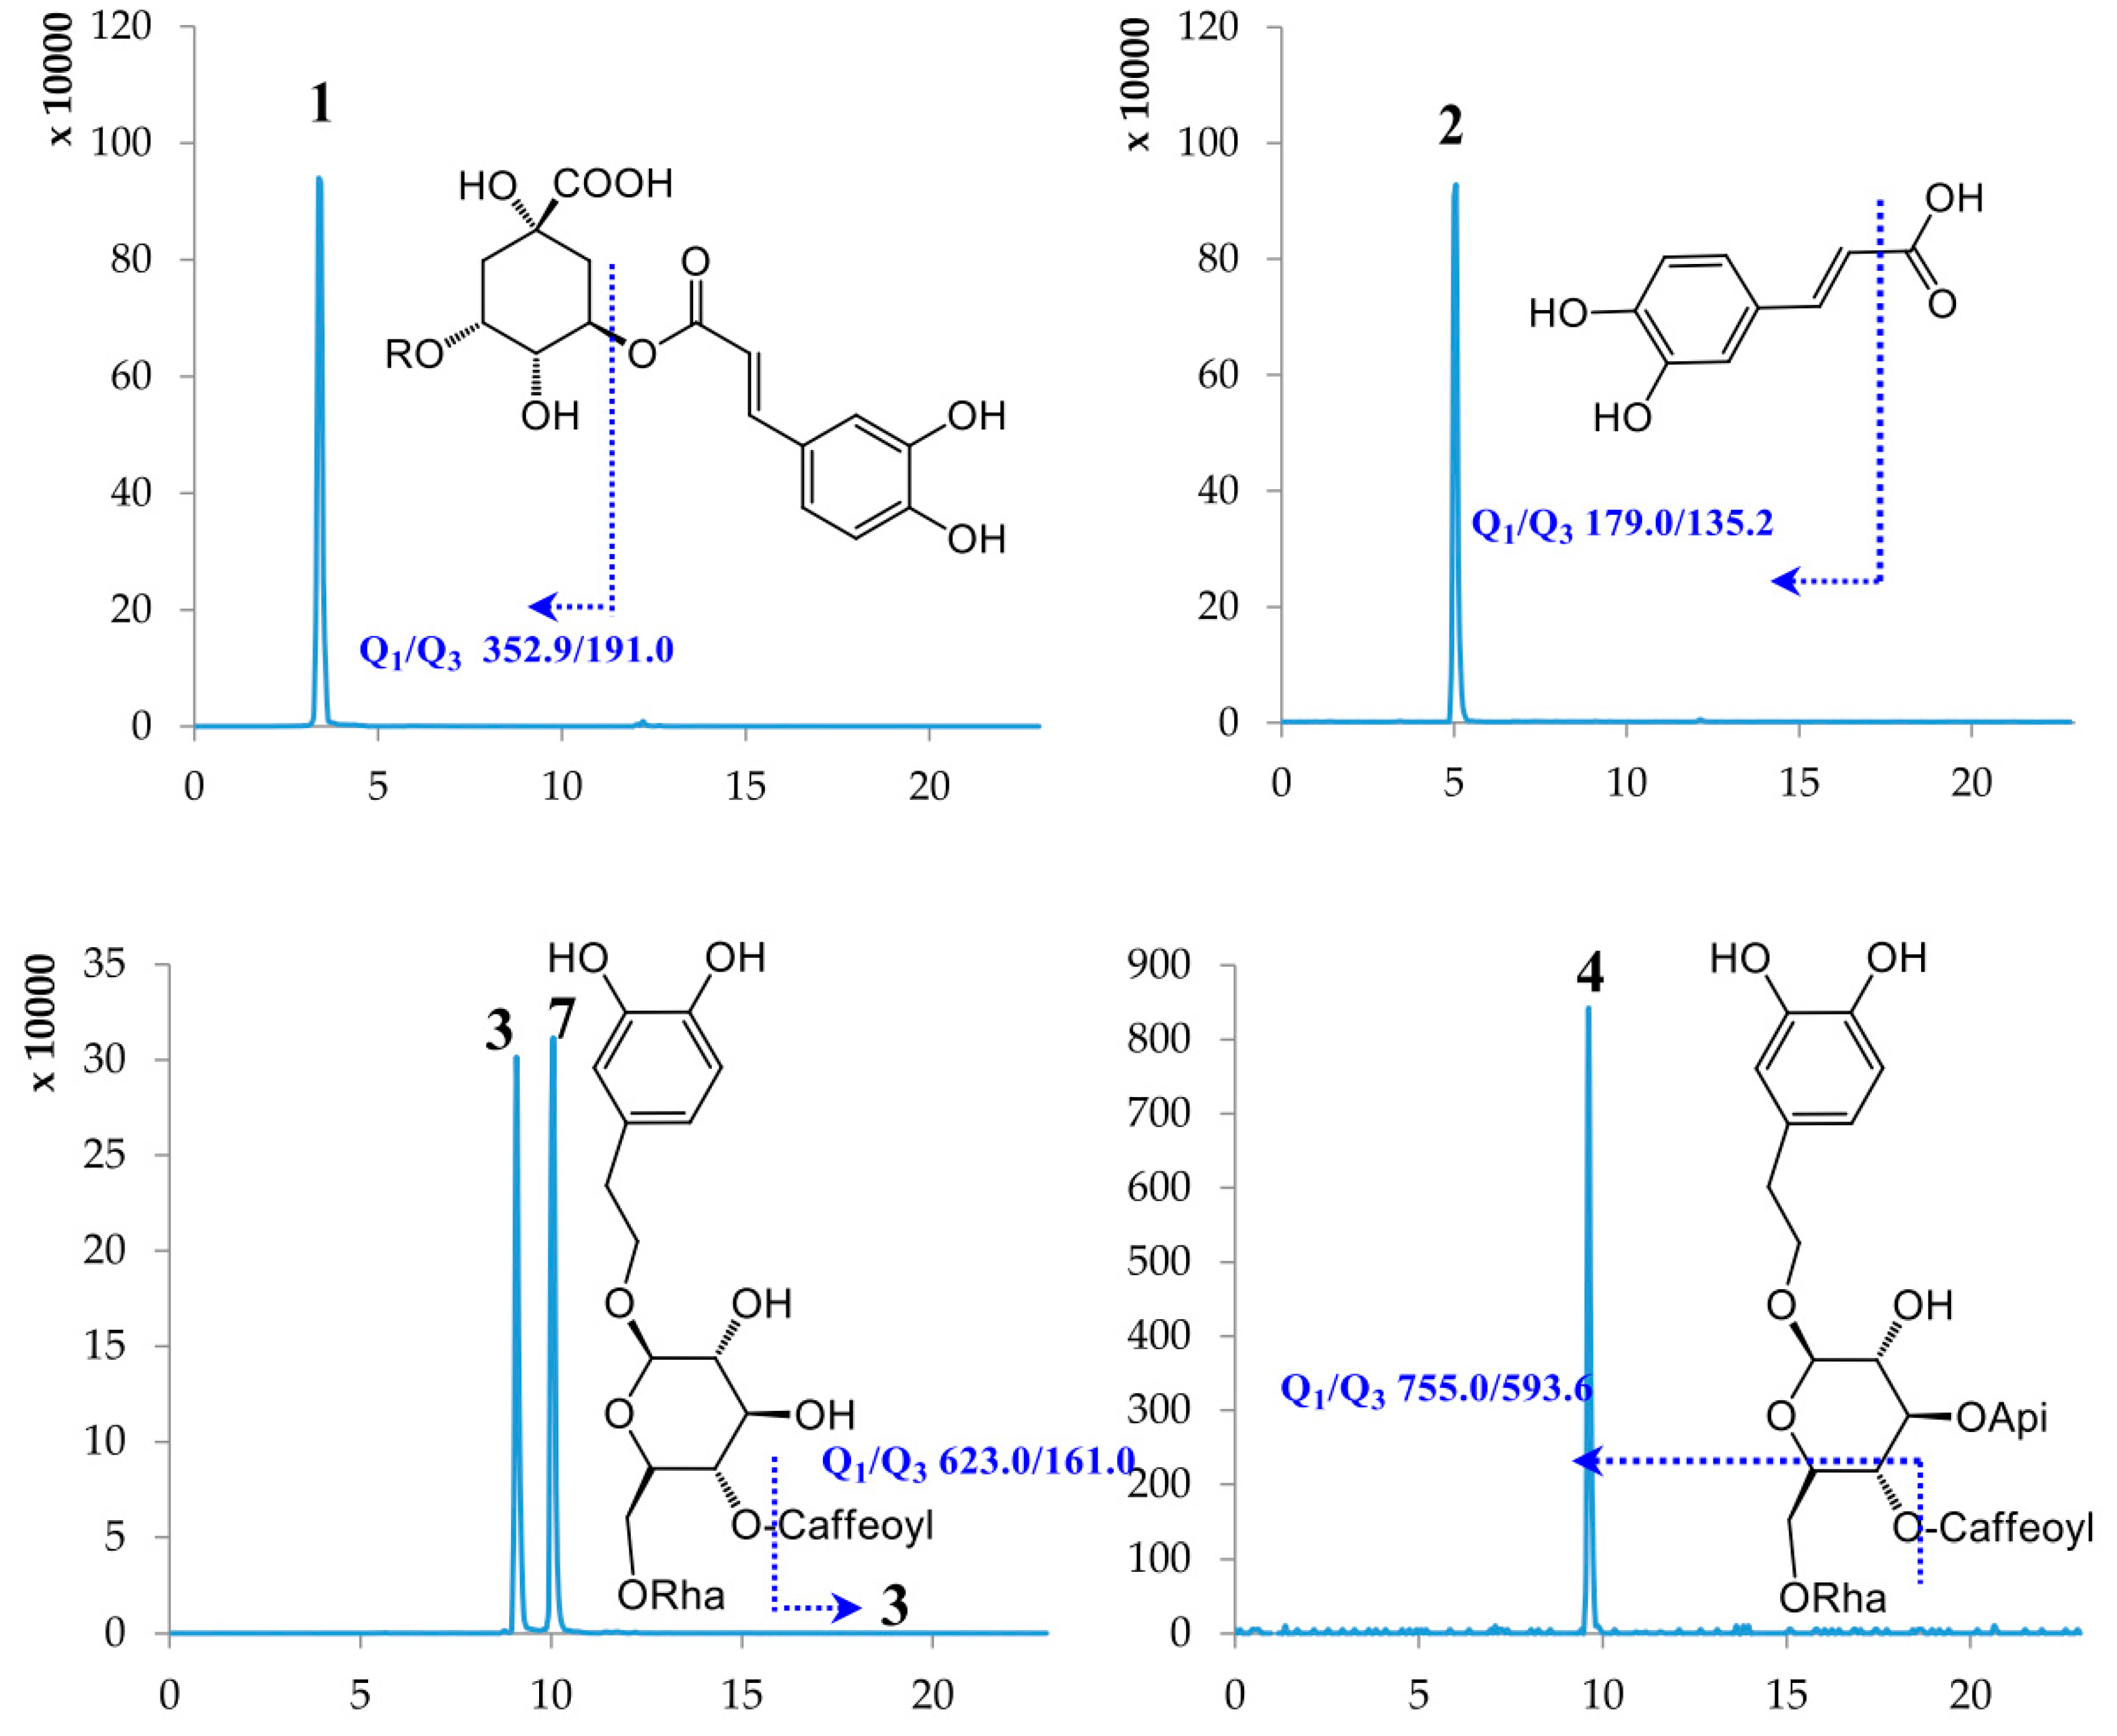
| 1 | Chlorogenic acid | 3.40 | 354.31 | [M − H]− | 352.90 | 191.00 | −59.56 | −19.70 |
| 2 | Caffeic acid | 5.02 | 180.15 | [M − H]− | 179.00 | 135.20 | −60.54 | −20.09 |
| 3 | Lianqiaoxinside A | 9.09 | 624.59 | [M − H]− | 623.00 | 161.00 | −157.08 | −57.85 |
| 4 | Forsythiaside B | 9.49 | 756.70 | [M − H]− | 755.00 | 593.60 | −160.00 | −50.93 |
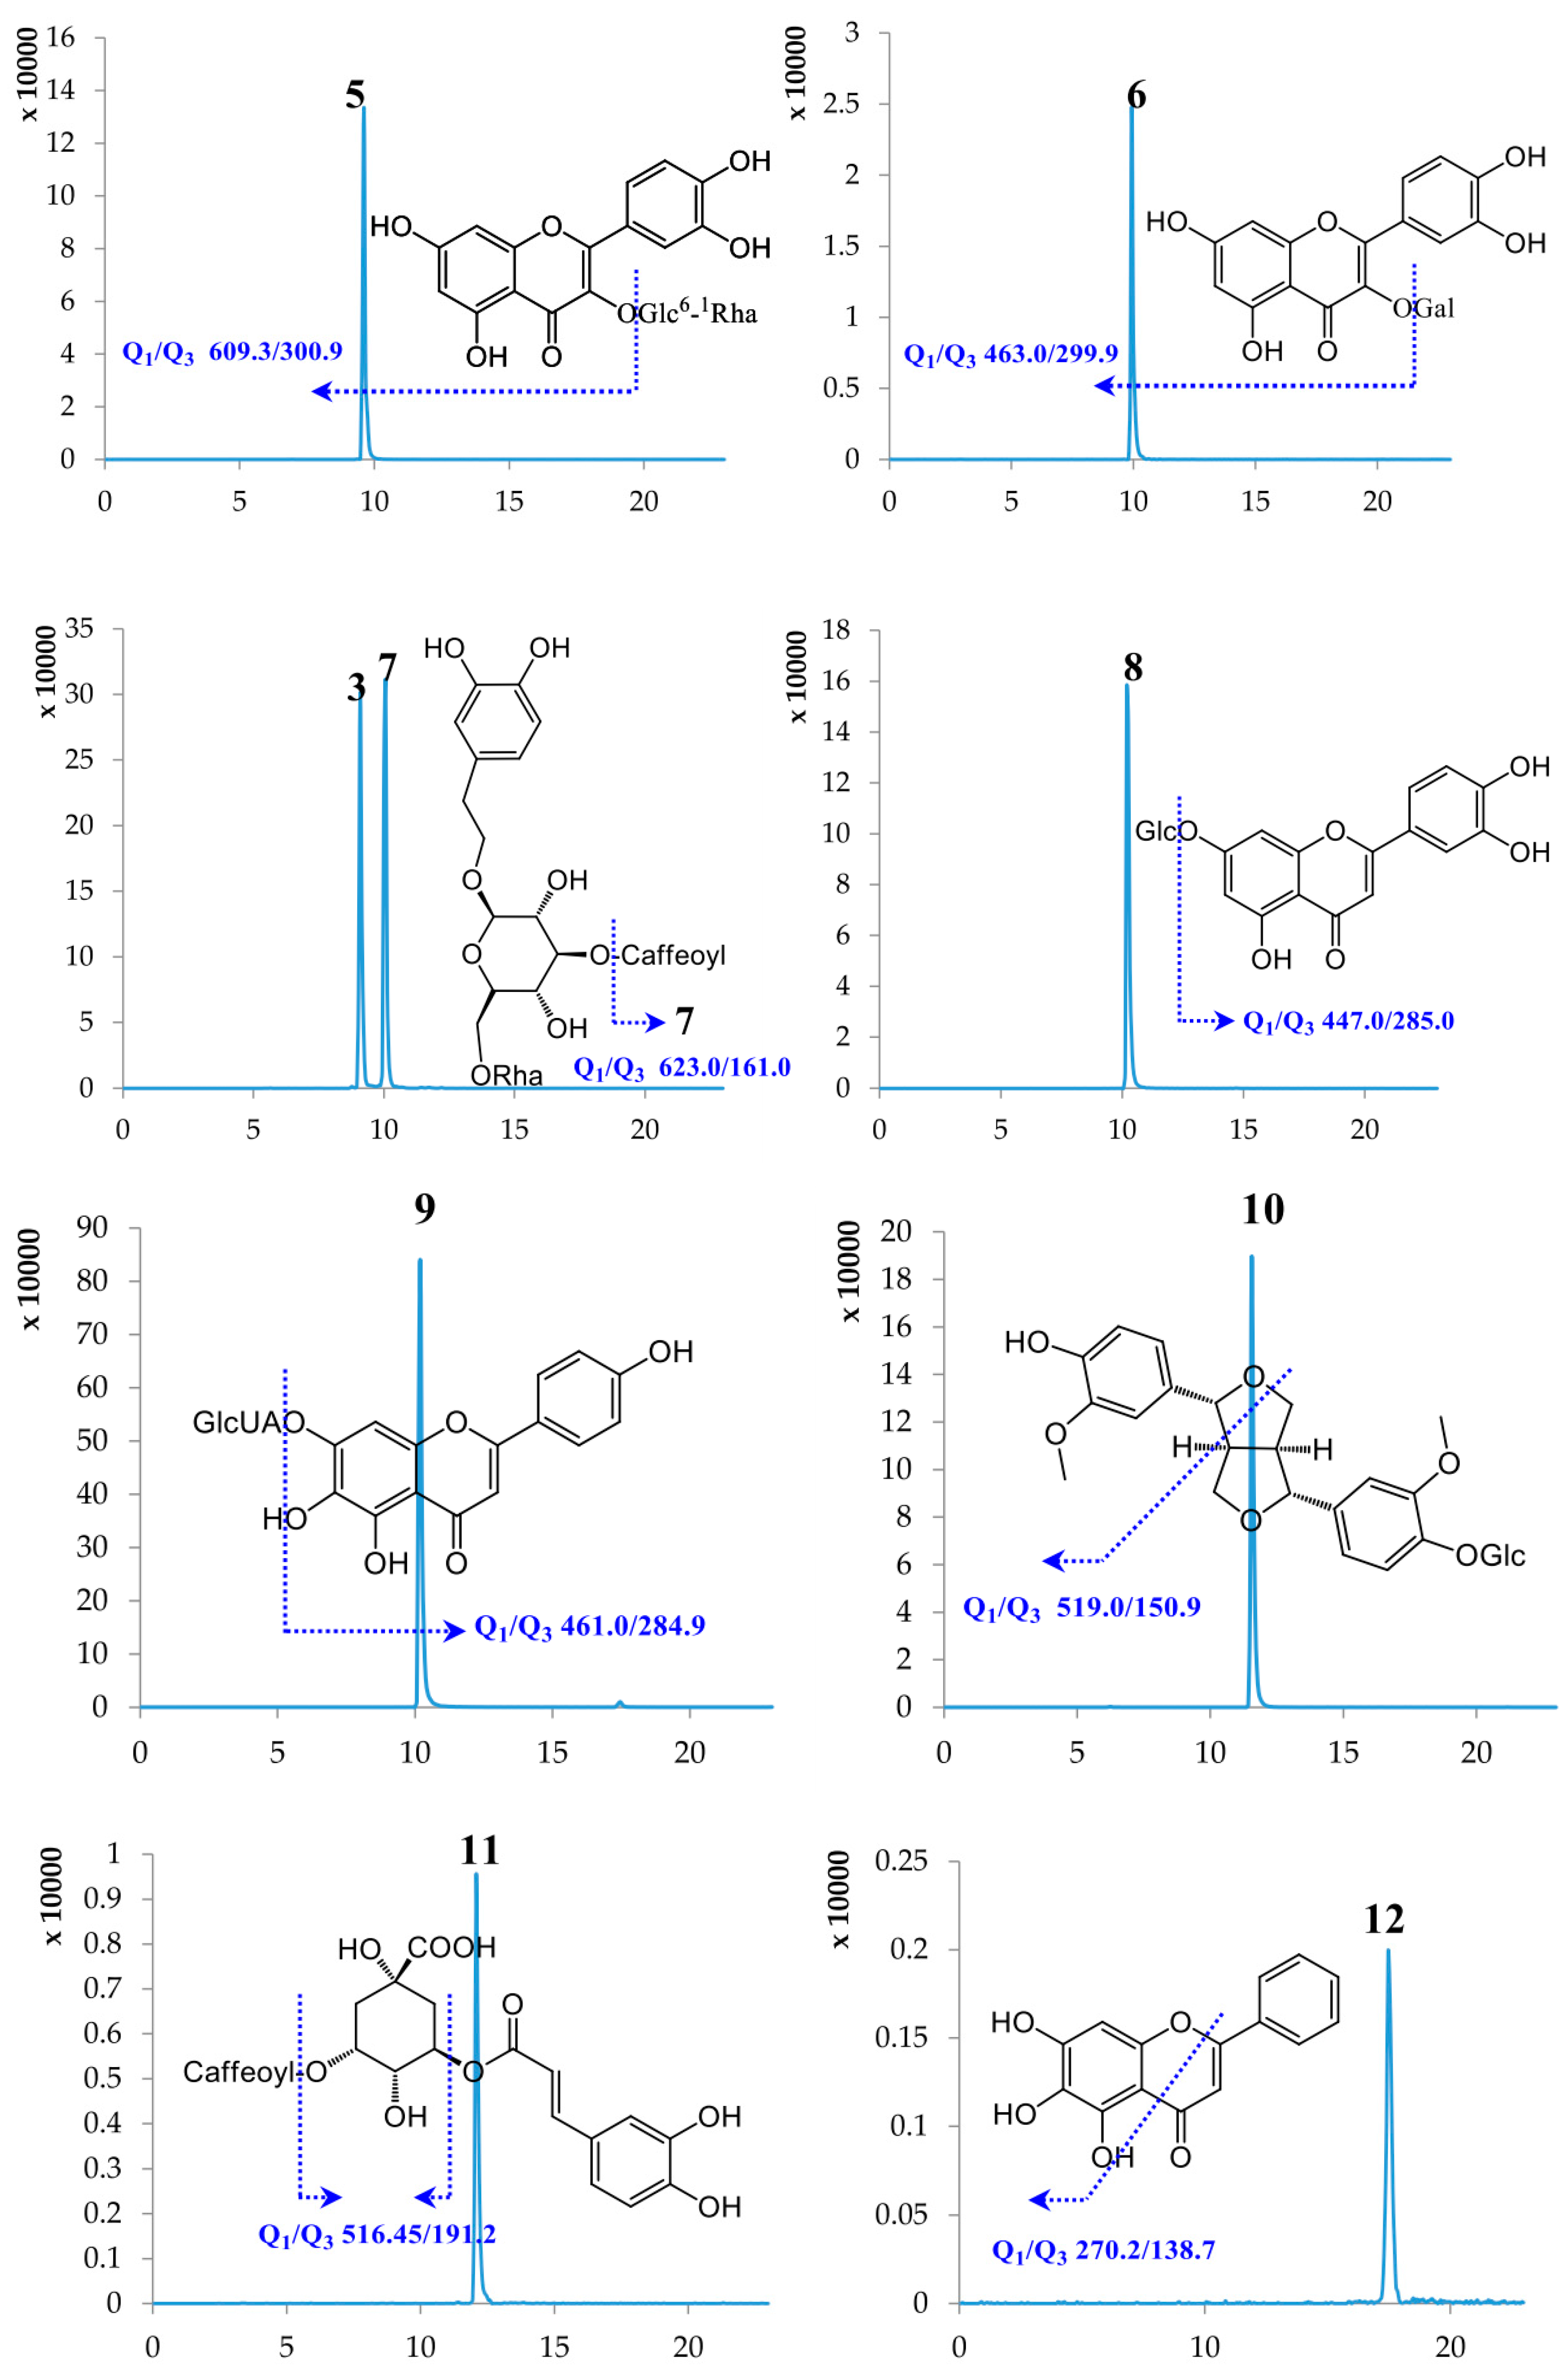
| 5 | Rutin | 9.61 | 610.51 | [M − H]− | 609.30 | 300.90 | −163.89 | −47.96 |
| 6 | Hyperoside | 9.94 | 464.38 | [M − H]− | 463.00 | 299.90 | −114.35 | −36.97 |
| 7 | Forsythiaside A | 10.05 | 624.59 | [M − H]− | 623.00 | 161.00 | −157.08 | −57.85 |
| 8 | Cynaroside | 10.14 | 448.38 | [M − H]− | 447.00 | 285.00 | −138.97 | −39.83 |
| 9 | Scutellarin | 10.19 | 462.37 | [M − H]− | 461.00 | 284.90 | −78.92 | −26.24 |
| 10 | (+)-Pinoresinol-β-d-glucoside | 11.57 | 520.53 | [M − H]− | 519.00 | 150.90 | −84.64 | −44.99 |
| 11 | Isochlorogenic acid A | 12.09 | 516.45 | [M − H]− | 515.00 | 191.20 | −75.30 | −44.90 |
| 12 | Baicalein | 17.47 | 270.24 | [M − H]− | 269.00 | 138.70 | −100.31 | −42.71 |
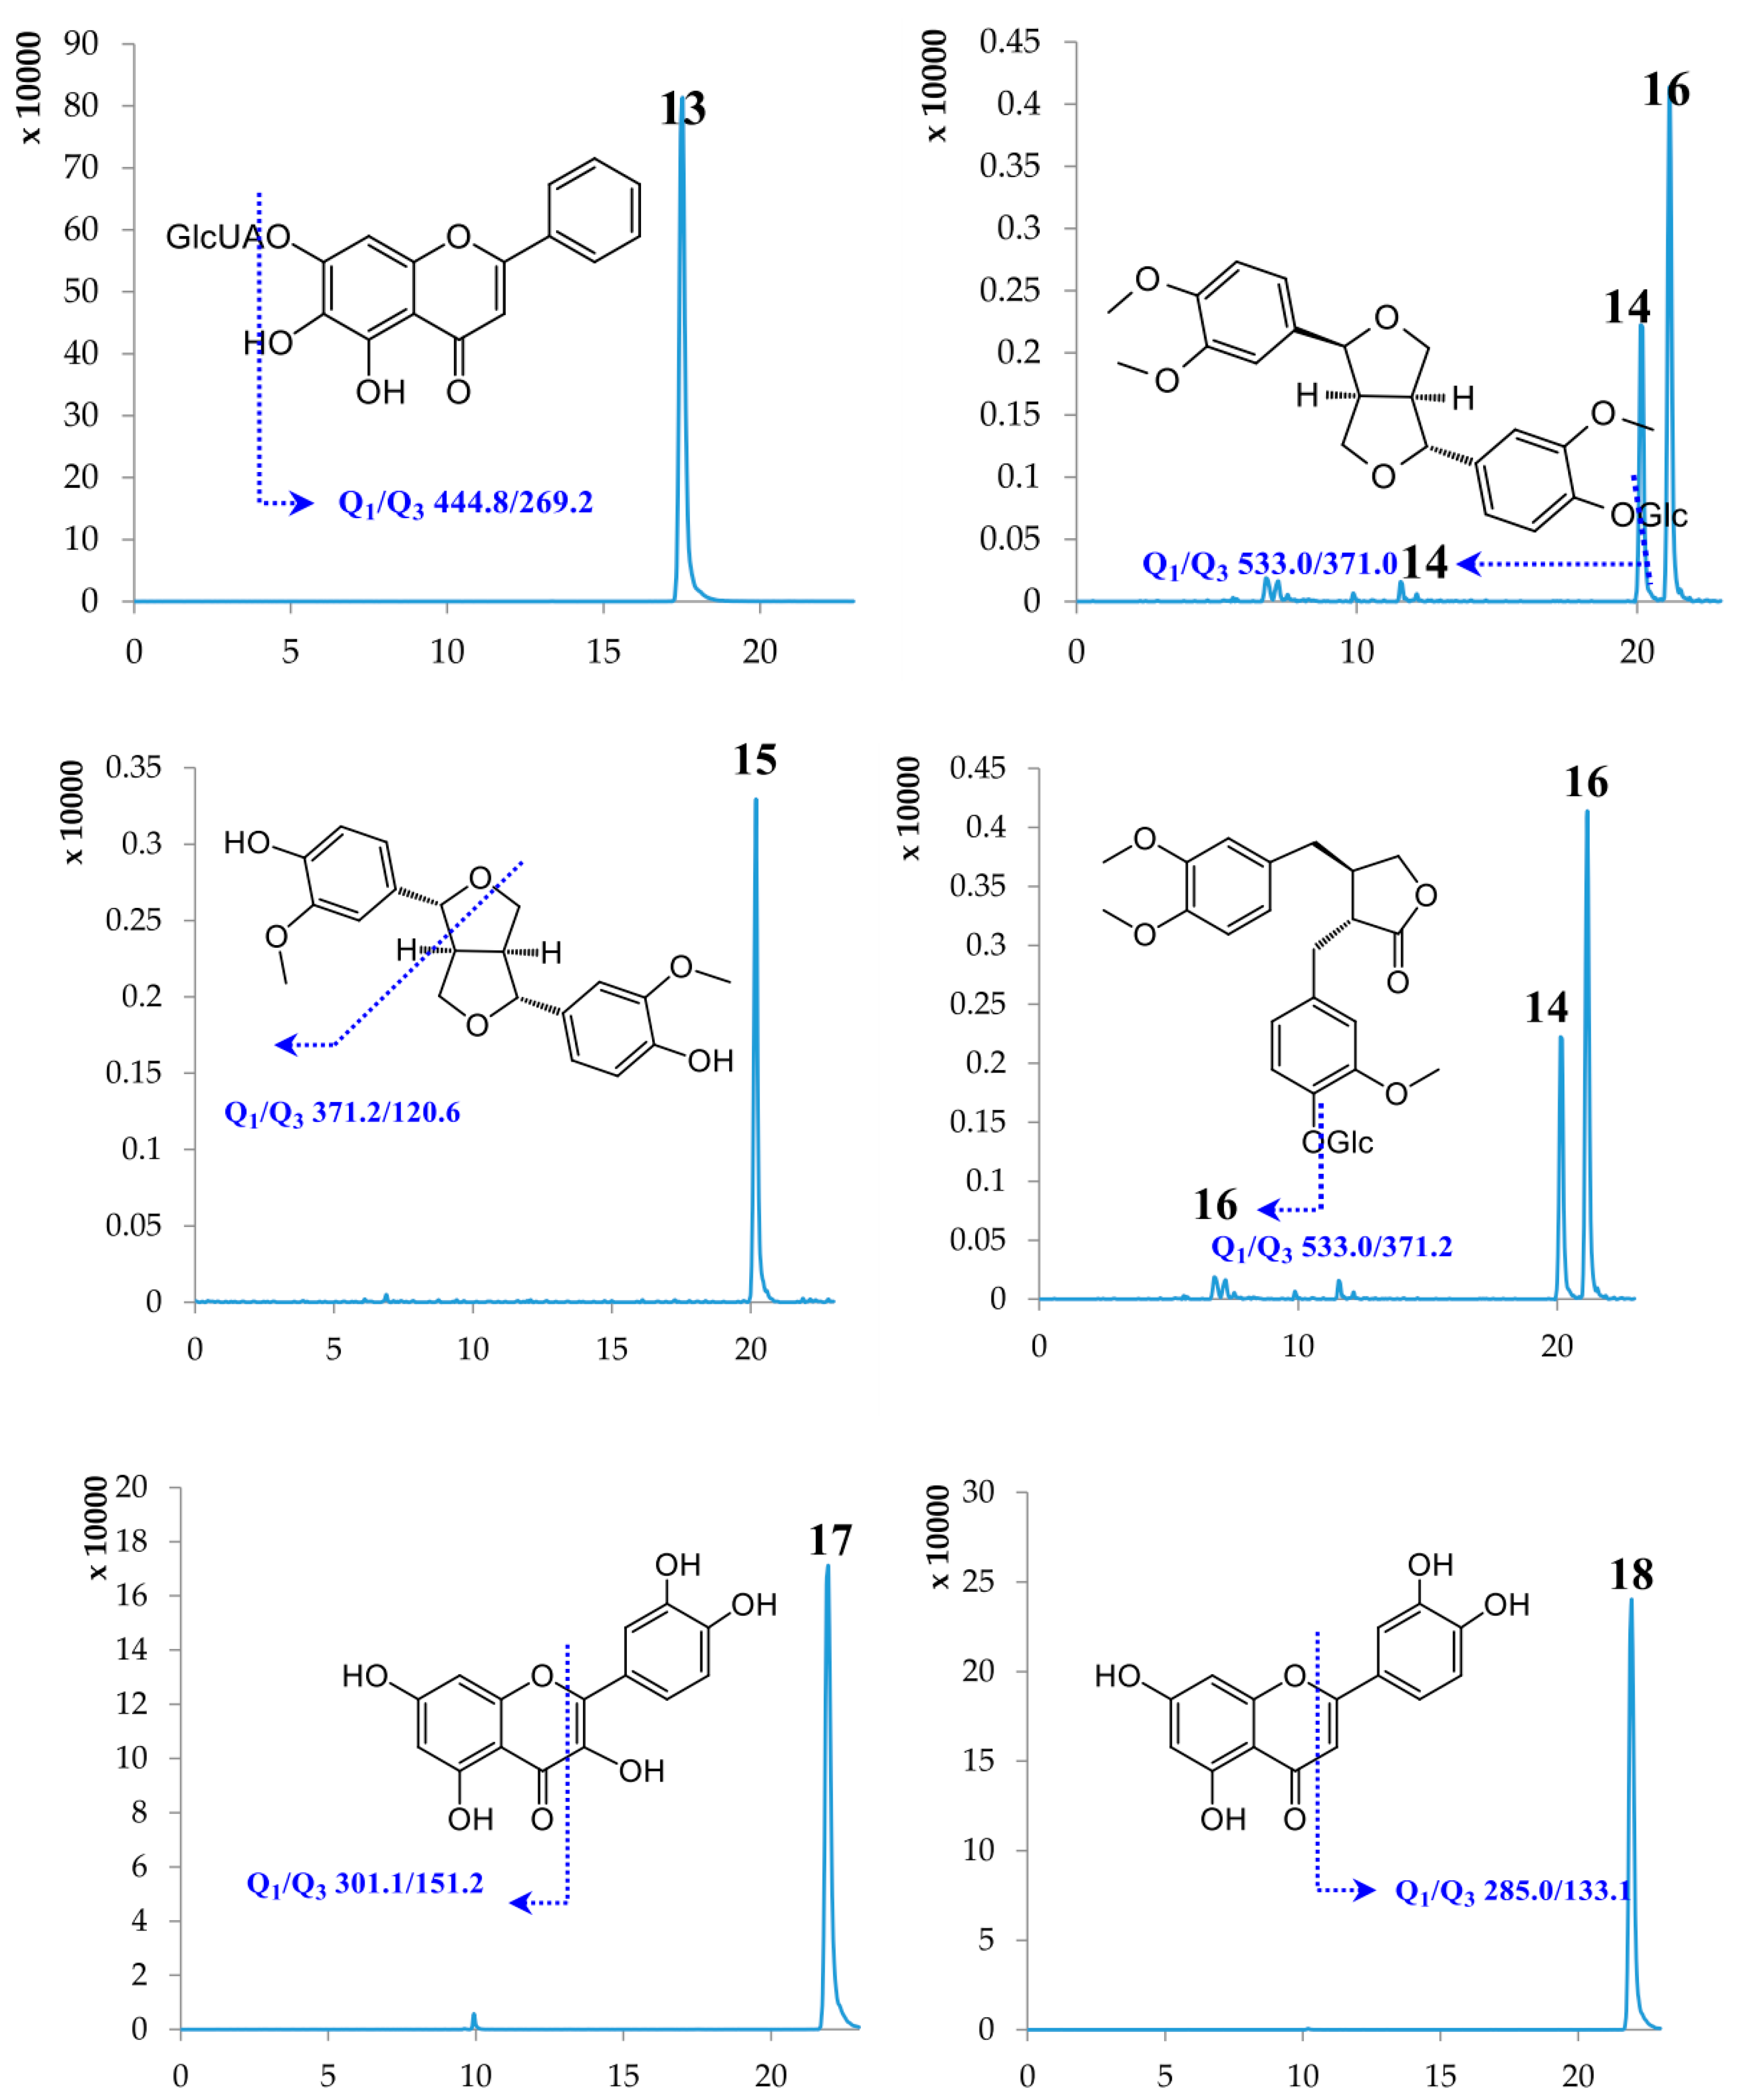
| 13 | Baicalin | 17.50 | 446.37 | [M − H]− | 444.80 | 269.20 | −89.57 | −26.28 |
| 14 | Phillyrin | 20.13 | 534.56 | [M − H]− | 533.00 | 371.00 | −65.42 | −18.09 |
| 15 | Phillygenin | 20.14 | 372.41 | [M − H]− | 371.20 | 120.60 | −94.80 | −43.28 |
| 16 | Arctiin | 21.14 | 534.55 | [M − H]− | 533.00 | 371.20 | −69.52 | −20.93 |
| 17 | Quercetin | 21.89 | 302.24 | [M − H]− | 301.10 | 151.20 | −88.89 | −30.26 |
| 18 | Luteolin | 21.91 | 286.24 | [M − H]− | 285.00 | 133.10 | −106.49 | −47.79 |
| No. | Regression Equation | Linear Range (μg/mL) | R2 | LODs (ng/mL) | LOQs (ng/mL) |
|---|---|---|---|---|---|
| 1 | y = 4 × 10⁶x – 32,641 | 0.02–5.00 | 0.9993 | 4.88 | 9.76 |
| 2 | y = 4 × 10⁶x + 52,653 | 0.02–5.00 | 0.9990 | 4.88 | 9.76 |
| 3 | y = 1 × 10⁶x – 63,209 | 0.02–5.00 | 0.9992 | 4.88 | 9.76 |
| 4 | y = 2482.3x − 626.91 | 0.31–10.00 | 0.9997 | 78.13 | 156.25 |
| 5 | y = 375,597x – 14,725 | 0.02–2.50 | 0.9992 | 4.88 | 9.76 |
| 6 | y = 78,413x − 2751.8 | 0.02–5.00 | 0.9999 | 9.76 | 19.53 |
| 7 | y = 1 × 10⁶x – 88,370 | 0.02–10.00 | 0.9992 | 4.88 | 9.76 |
| 8 | y = 604,060x+9178.1 | 0.04–10.00 | 0.9999 | 2.44 | 4.88 |
| 9 | y = 3 × 10⁶x – 38,112 | 0.02–5.00 | 0.9995 | 4.88 | 9.76 |
| 10 | y = 708,705x – 58,709 | 0.02–10.00 | 0.9993 | 2.44 | 4.88 |
| 11 | y = 38,443x − 1932.4 | 0.02–5.00 | 0.9995 | 4.88 | 19.53 |
| 12 | y = 13,450x + 85.951 | 0.08–10.00 | 0.9999 | 4.88 | 19.53 |
| 13 | y = 1 × 10⁶x + 524,990 | 0.63–50.00 | 0.9991 | 19.53 | 78.13 |
| 14 | y = 10,777x − 216.5 | 0.04–10.00 | 0.9997 | 2.44 | 9.77 |
| 15 | y = 13,664x − 918.63 | 0.08–10.00 | 0.9998 | 9.77 | 39.06 |
| 16 | y = 21,338x − 1861.1 | 0.04–10.00 | 0.9995 | 9.77 | 39.06 |
| 17 | y = 1 × 10⁶x + 5883.7 | 0.02–10.00 | 0.9993 | 2.44 | 9.77 |
| 18 | y = 1 × 10⁶x − 3265.6 | 0.02–10.00 | 0.9997 | 2.44 | 9.77 |
| Samples | Manufacturers | Batches | 1 | 2 | 3 | 4 | 5 | 6 | 7 | 8 | 9 | 10 | 11 | 12 | 13 | 14 | 15 | 16 | 17 | 18 |
|---|---|---|---|---|---|---|---|---|---|---|---|---|---|---|---|---|---|---|---|---|
| Sample 1 | Sanjing, Harbin | 13112121 | 1.11 | 0.14 | 0.31 | 0 | 0.23 | 0.03 | 1.16 | 1.07 | 0.09 | 0.19 | 0.16 | 2.85 | 13.16 | 0.51 | 0.63 | 0 | 0 | 0.002 |
| Sample 2 | Sanjing, Harbin | 13050633 | 0.91 | 0.17 | 0.51 | 0 | 0.15 | 0.02 | 2.04 | 1.51 | 0.12 | 0.34 | 0.14 | 2.98 | 12.63 | 0.43 | 0.65 | 0 | 0 | 0.002 |
| Sample 3 | Sanjing, Harbin | 13050643 | 1.12 | 0.19 | 0.61 | 0 | 0.17 | 0.02 | 2.46 | 1.68 | 0.13 | 0.39 | 0.15 | 3.51 | 15.90 | 0.62 | 0.75 | 0 | 0 | 0.003 |
| Sample 4 | Sanjing, Harbin | 13050653 | 1.14 | 0.22 | 0.56 | 0 | 0.16 | 0.02 | 2.14 | 1.62 | 0.13 | 0.37 | 0.13 | 2.91 | 14.63 | 0.58 | 0.71 | 0 | 0 | 0.002 |
| Sample 5 | Sanjing, Harbin | 13031716 | 1.05 | 0.16 | 0.37 | 0 | 0.23 | 0.03 | 1.52 | 0.26 | 0.10 | 0.23 | 0.11 | 2.56 | 12.85 | 0.57 | 0.69 | 0 | 0 | 0.001 |
| Sample 6 | Sanjing, Harbin | 13031816 | 1.23 | 0.18 | 0.36 | 0 | 0.24 | 0.03 | 1.42 | 0.27 | 0.12 | 0.23 | 0.13 | 2.99 | 14.39 | 0.60 | 0.67 | 0 | 0 | 0.001 |
| Sample 7 | Tailong, Henan | 131221042 | 1.28 | 0.32 | 0.88 | 0 | 0.13 | 0.02 | 3.28 | 0.03 | 0.12 | 0.49 | 0.28 | 2.95 | 13.59 | 0.61 | 0.81 | 0 | 0 | 0.001 |
| Sample 8 | Tailong, Henan | 140111102 | 1.41 | 0.36 | 0.83 | 0 | 0.11 | 0.02 | 3.21 | 0.03 | 0.15 | 0.50 | 0.35 | 2.96 | 14.07 | 0.58 | 0.84 | 0 | 0 | 0.001 |
| Sample 9 | Zhenbaodao, Harbin | B20130323 | 1.15 | 0.44 | 0.30 | 0 | 0.12 | 0.02 | 1.30 | 0.02 | 0.12 | 0.27 | 0.27 | 3.03 | 14.41 | 0.50 | 0.63 | 0 | 0 | 0.001 |
| Sample 10 | Zhenbaodao, Harbin | B20130108 | 1.18 | 0.38 | 0.10 | 0 | 0.09 | 0.02 | 0.41 | 0.04 | 0.12 | 0.22 | 0.46 | 3.34 | 13.76 | 0.44 | 0.59 | 0 | 0 | 0.001 |
| Sample 11 | Zhenbaodao, Harbin | B20130415 | 1.16 | 0.41 | 0.36 | 0 | 0.12 | 0.02 | 1.45 | 0.02 | 0.14 | 0.29 | 0.28 | 3.32 | 15.00 | 0.52 | 0.63 | 0 | 0 | 0.001 |
| Sample 12 | Baitianer, Harbin | 130510 | 0.89 | 0.004 | 0.04 | 0 | 0.16 | 0.02 | 0.08 | 1.14 | 0.13 | 0.22 | 0.05 | 2.65 | 12.29 | 0.77 | 0.95 | 0 | 0 | 0.002 |
| Sample 13 | Baitianer, Harbin | 130615 | 0.86 | 0.002 | 0.03 | 0 | 0.14 | 0.02 | 0.06 | 1.11 | 0.14 | 0.22 | 0.03 | 2.67 | 12.27 | 0.74 | 0.93 | 0 | 0 | 0.002 |
| Sample 14 | Baitianer, Harbin | 130311 | 0.88 | 0.004 | 0.02 | 0 | 0.15 | 0.02 | 0.07 | 1.13 | 0.12 | 0.23 | 0.06 | 2.64 | 12.30 | 0.77 | 0.96 | 0 | 0 | 0.002 |
© 2017 by the authors. Licensee MDPI, Basel, Switzerland. This article is an open access article distributed under the terms and conditions of the Creative Commons Attribution (CC BY) license (http://creativecommons.org/licenses/by/4.0/).
Share and Cite
Liang, J.; Sun, H.-M.; Wang, T.-L. Simultaneous Determination of Multiple Classes of Hydrophilic and Lipophilic Components in Shuang-Huang-Lian Oral Liquid Formulations by UPLC-Triple Quadrupole Linear Ion Trap Mass Spectrometry. Molecules 2017, 22, 2057. https://doi.org/10.3390/molecules22122057
Liang J, Sun H-M, Wang T-L. Simultaneous Determination of Multiple Classes of Hydrophilic and Lipophilic Components in Shuang-Huang-Lian Oral Liquid Formulations by UPLC-Triple Quadrupole Linear Ion Trap Mass Spectrometry. Molecules. 2017; 22(12):2057. https://doi.org/10.3390/molecules22122057
Chicago/Turabian StyleLiang, Jun, Hui-Min Sun, and Tian-Long Wang. 2017. "Simultaneous Determination of Multiple Classes of Hydrophilic and Lipophilic Components in Shuang-Huang-Lian Oral Liquid Formulations by UPLC-Triple Quadrupole Linear Ion Trap Mass Spectrometry" Molecules 22, no. 12: 2057. https://doi.org/10.3390/molecules22122057