
Accumulation of Carotenoids and Metabolic Profiling in Different Cultivars of Tagetes Flowers

 and
and 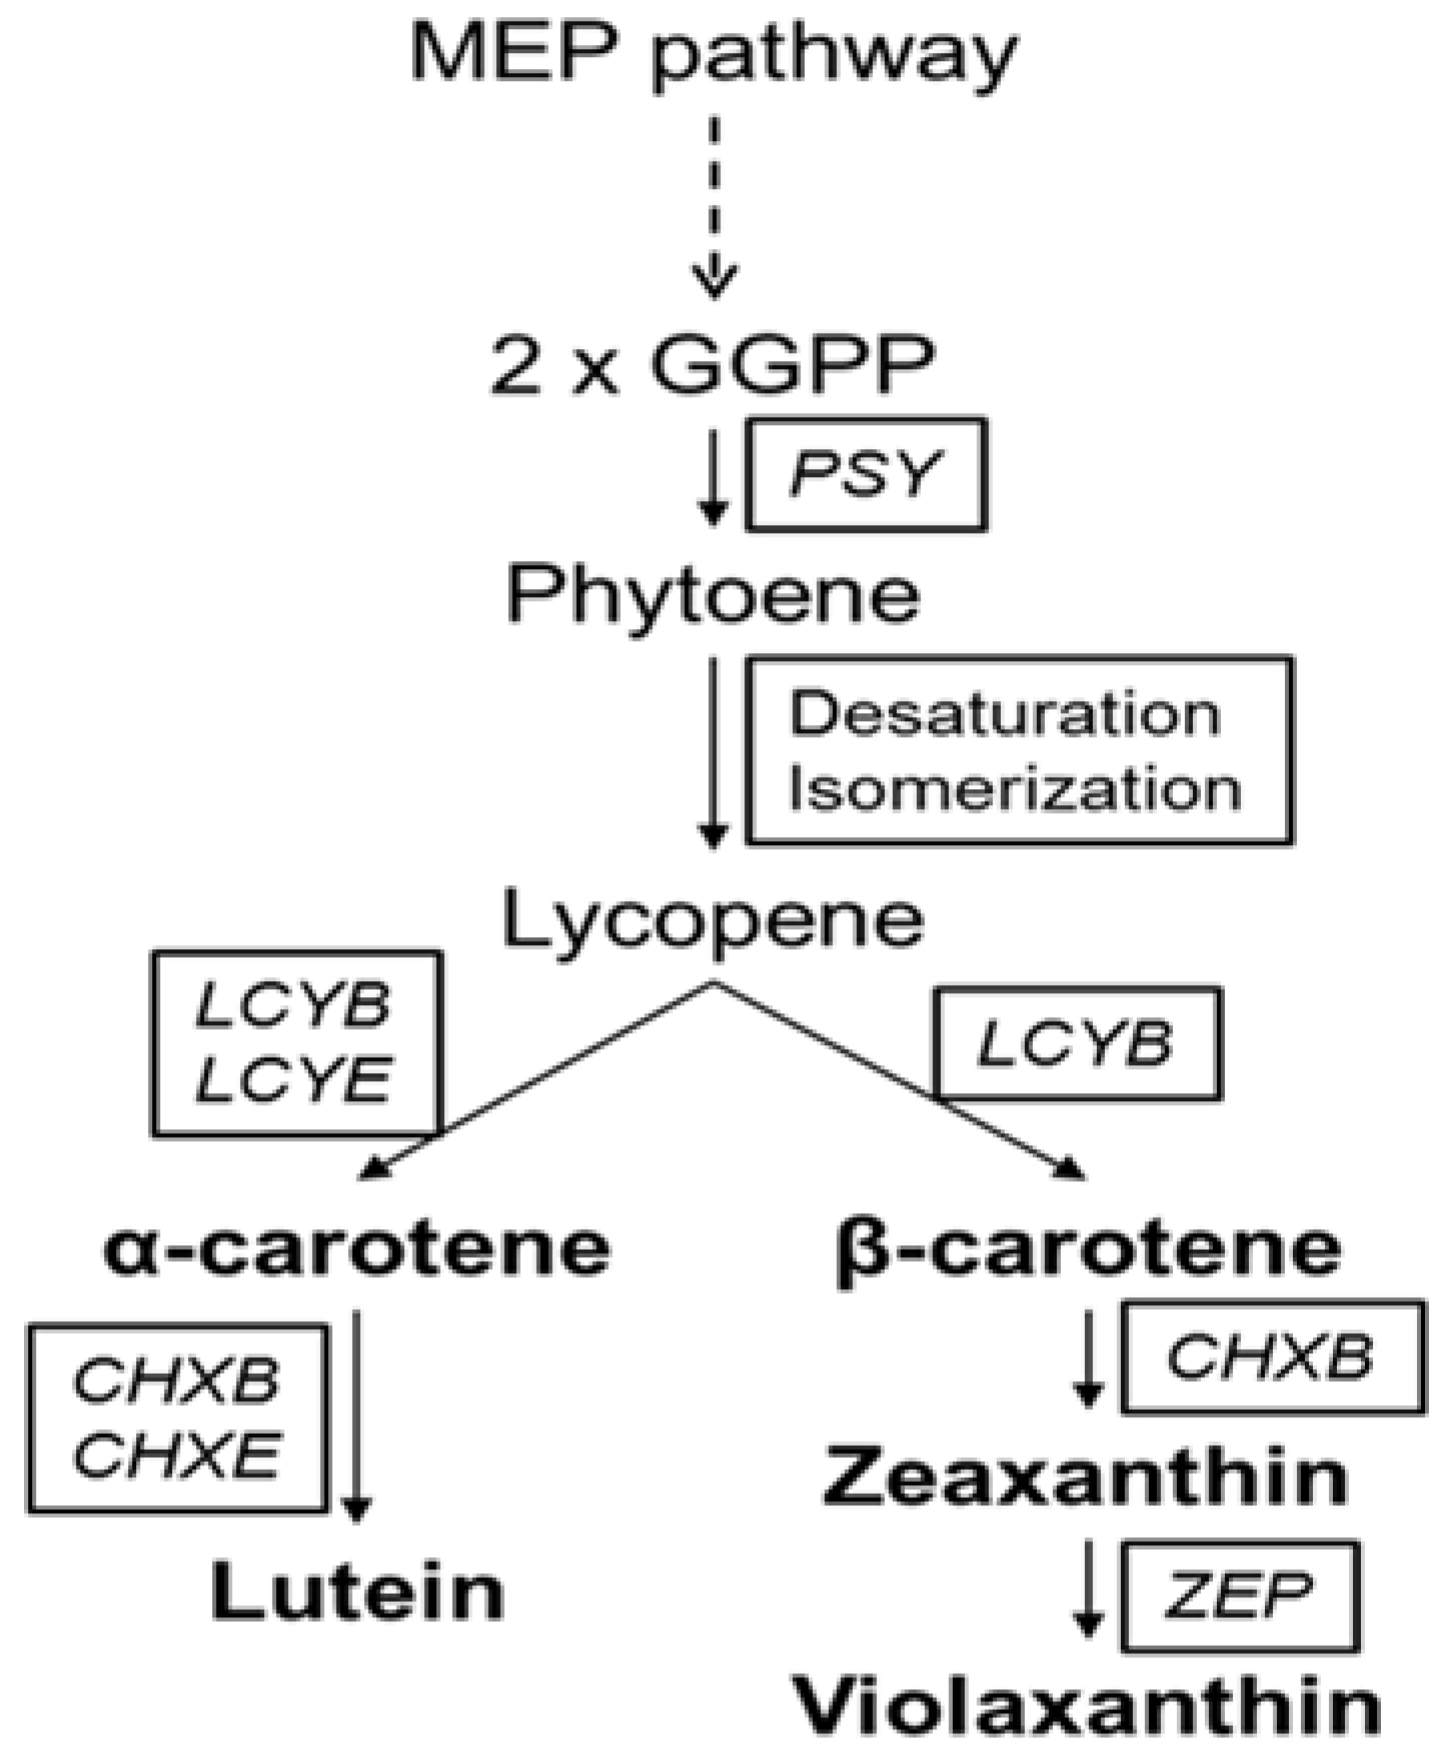
Abstract
:1. Introduction
2. Results and Discussion
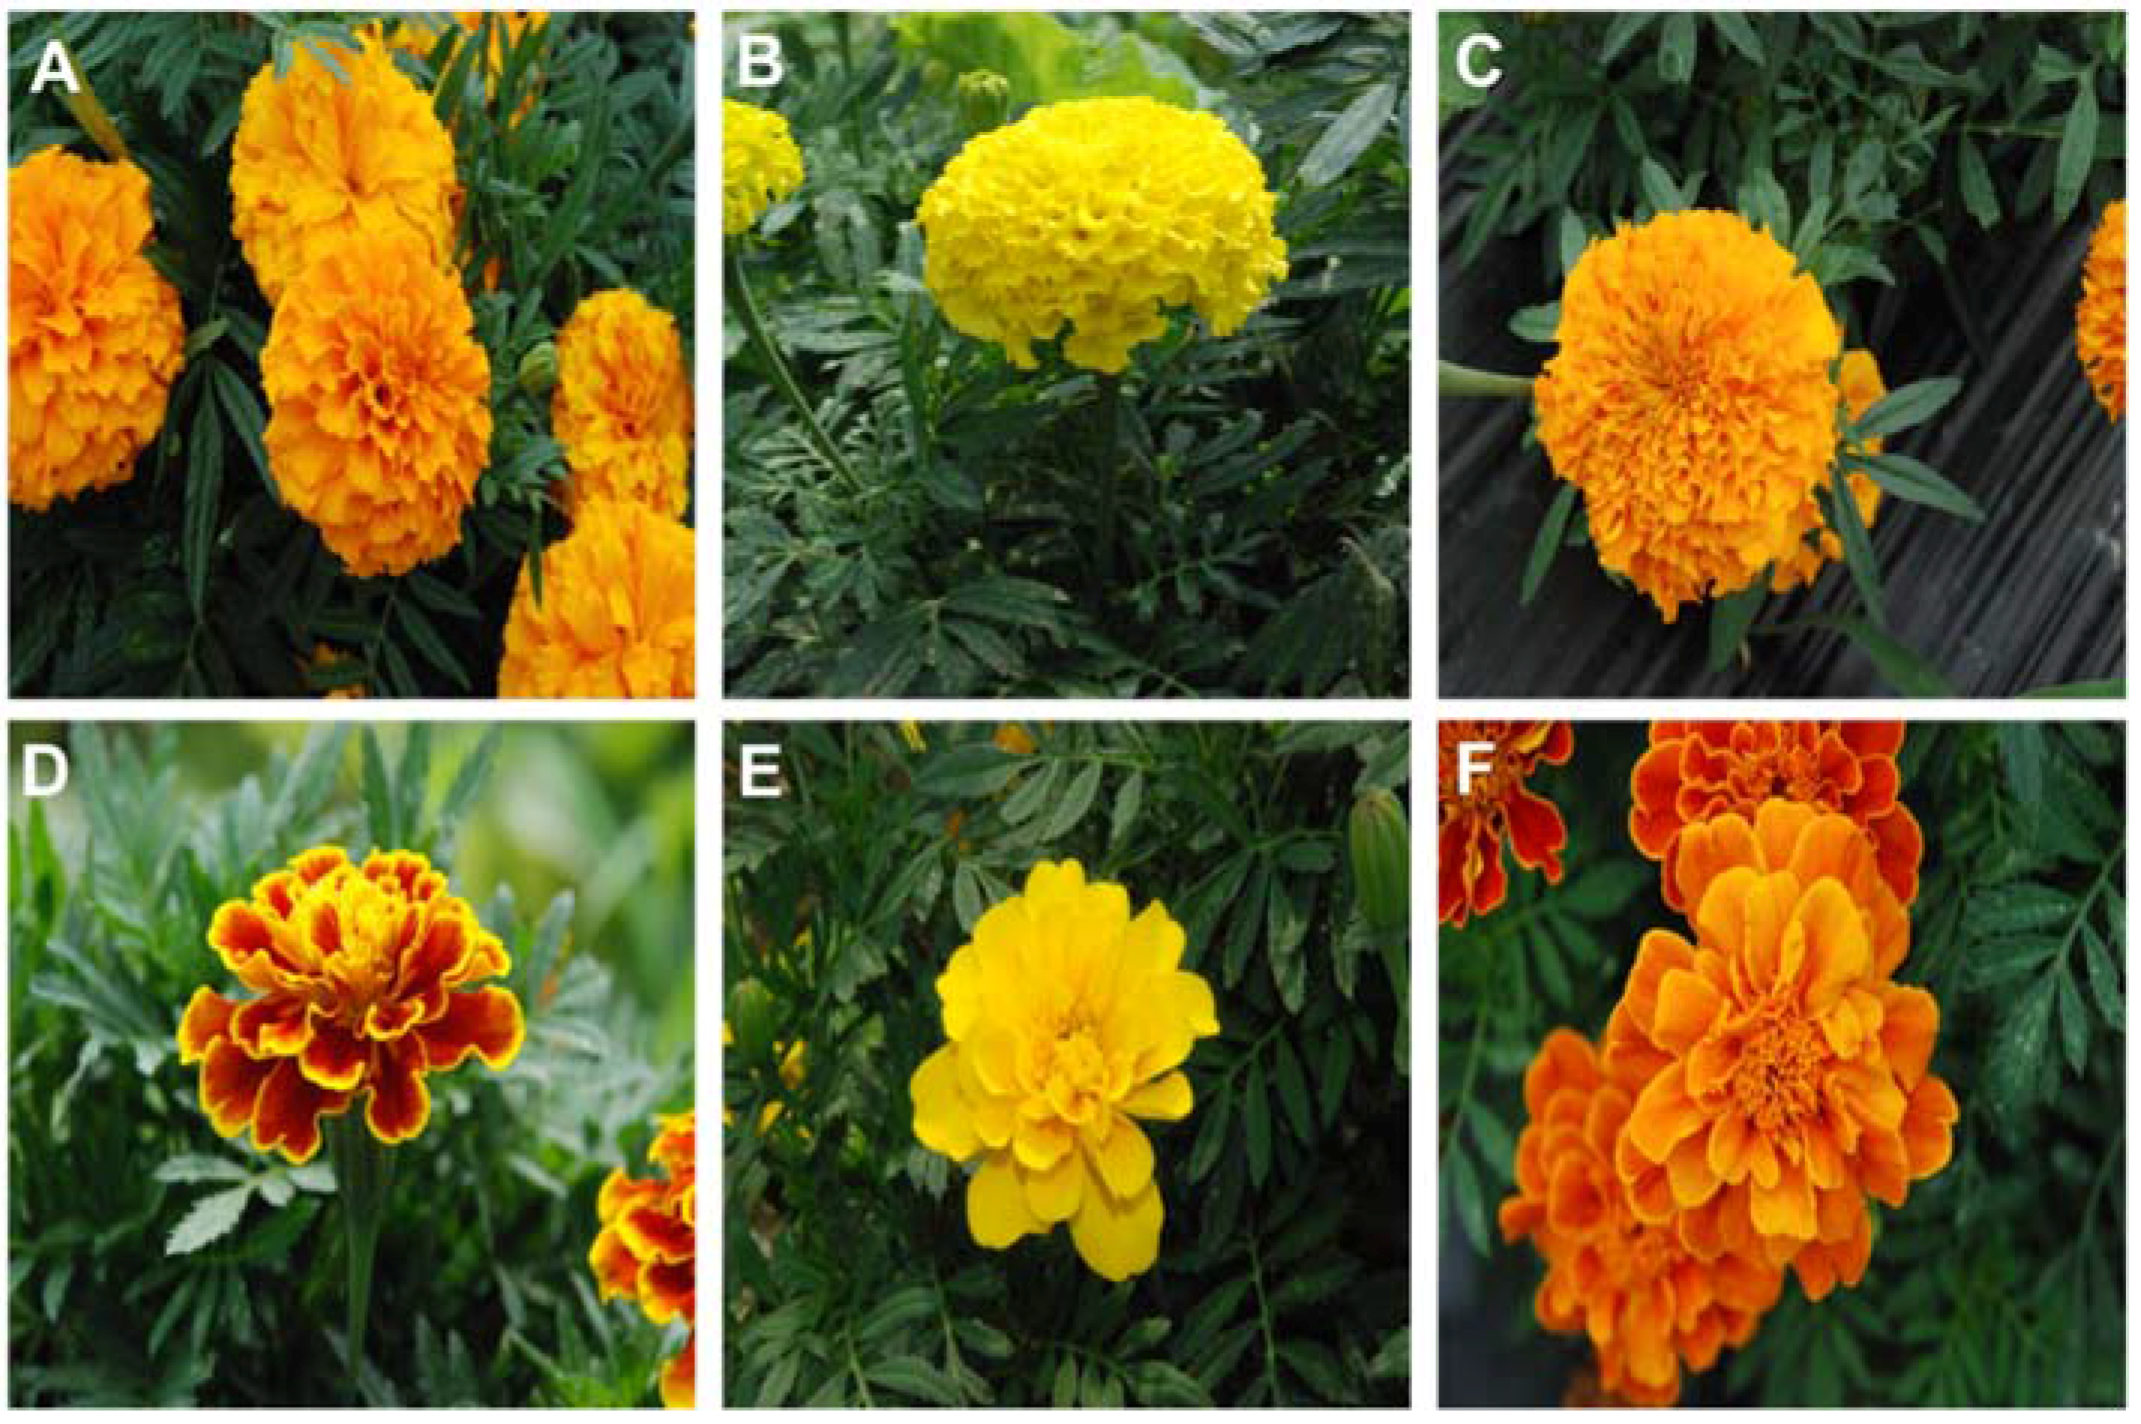
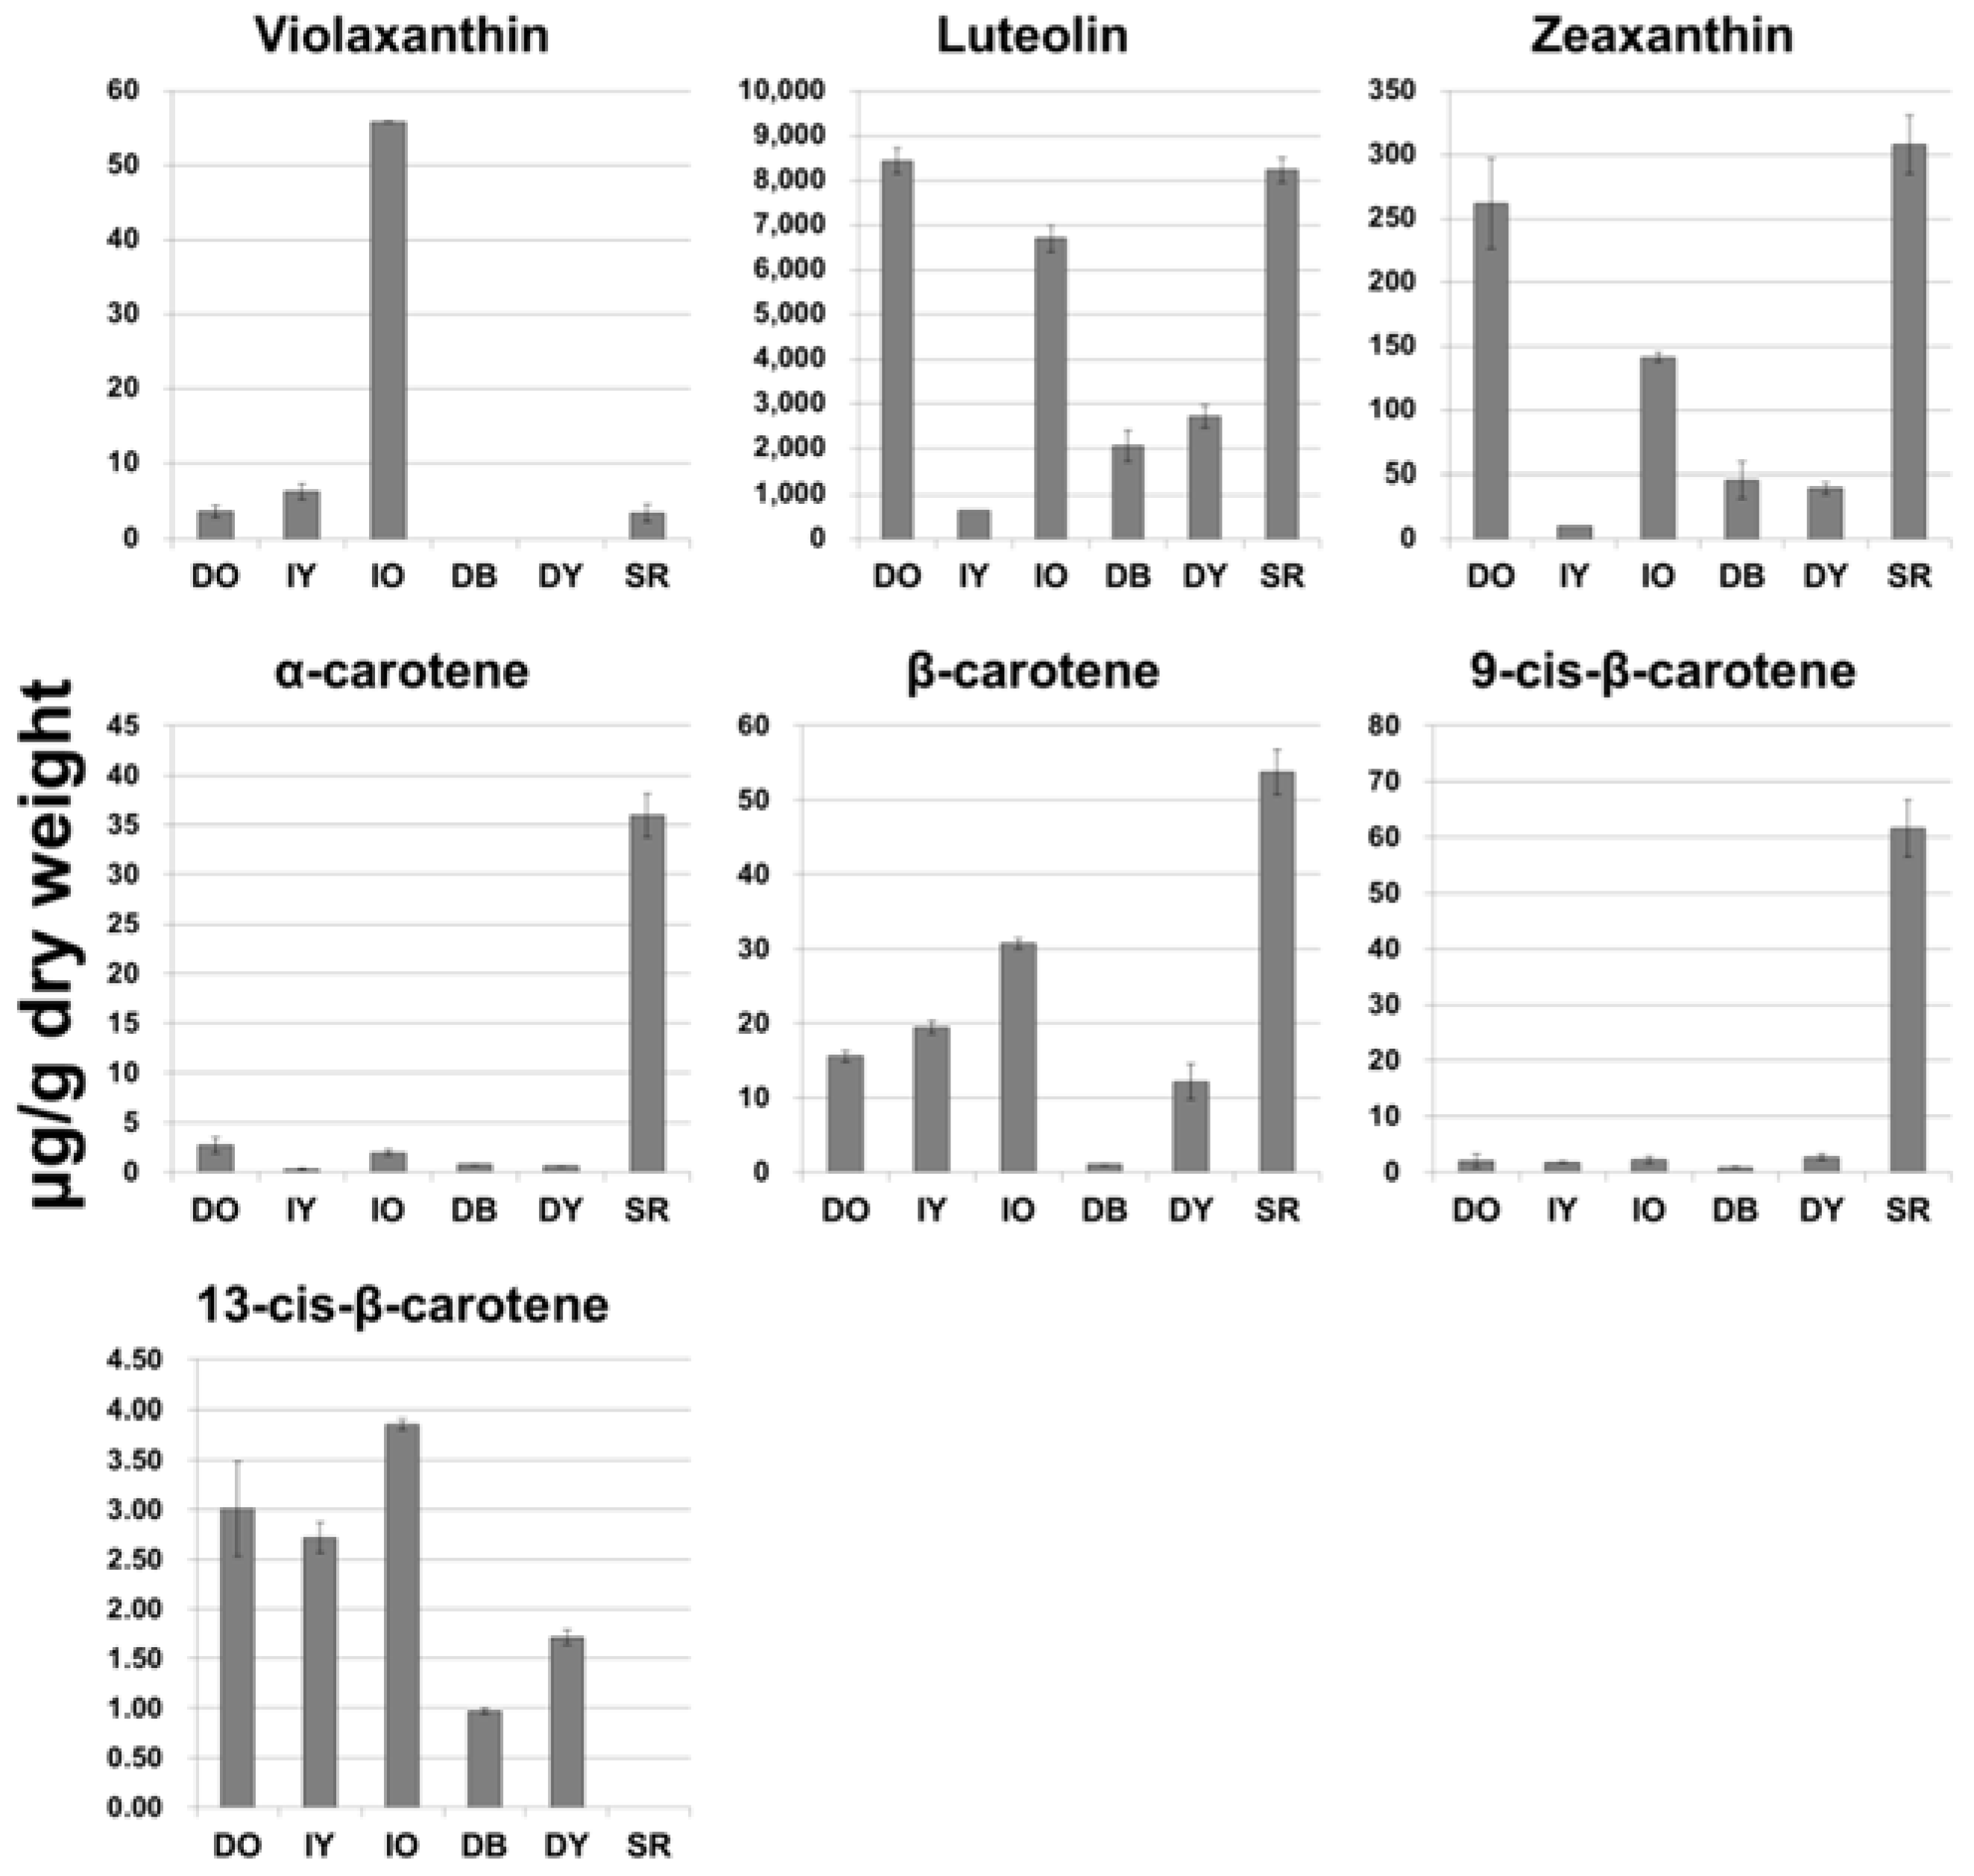
2.1. Analysis of Carotenoid Content
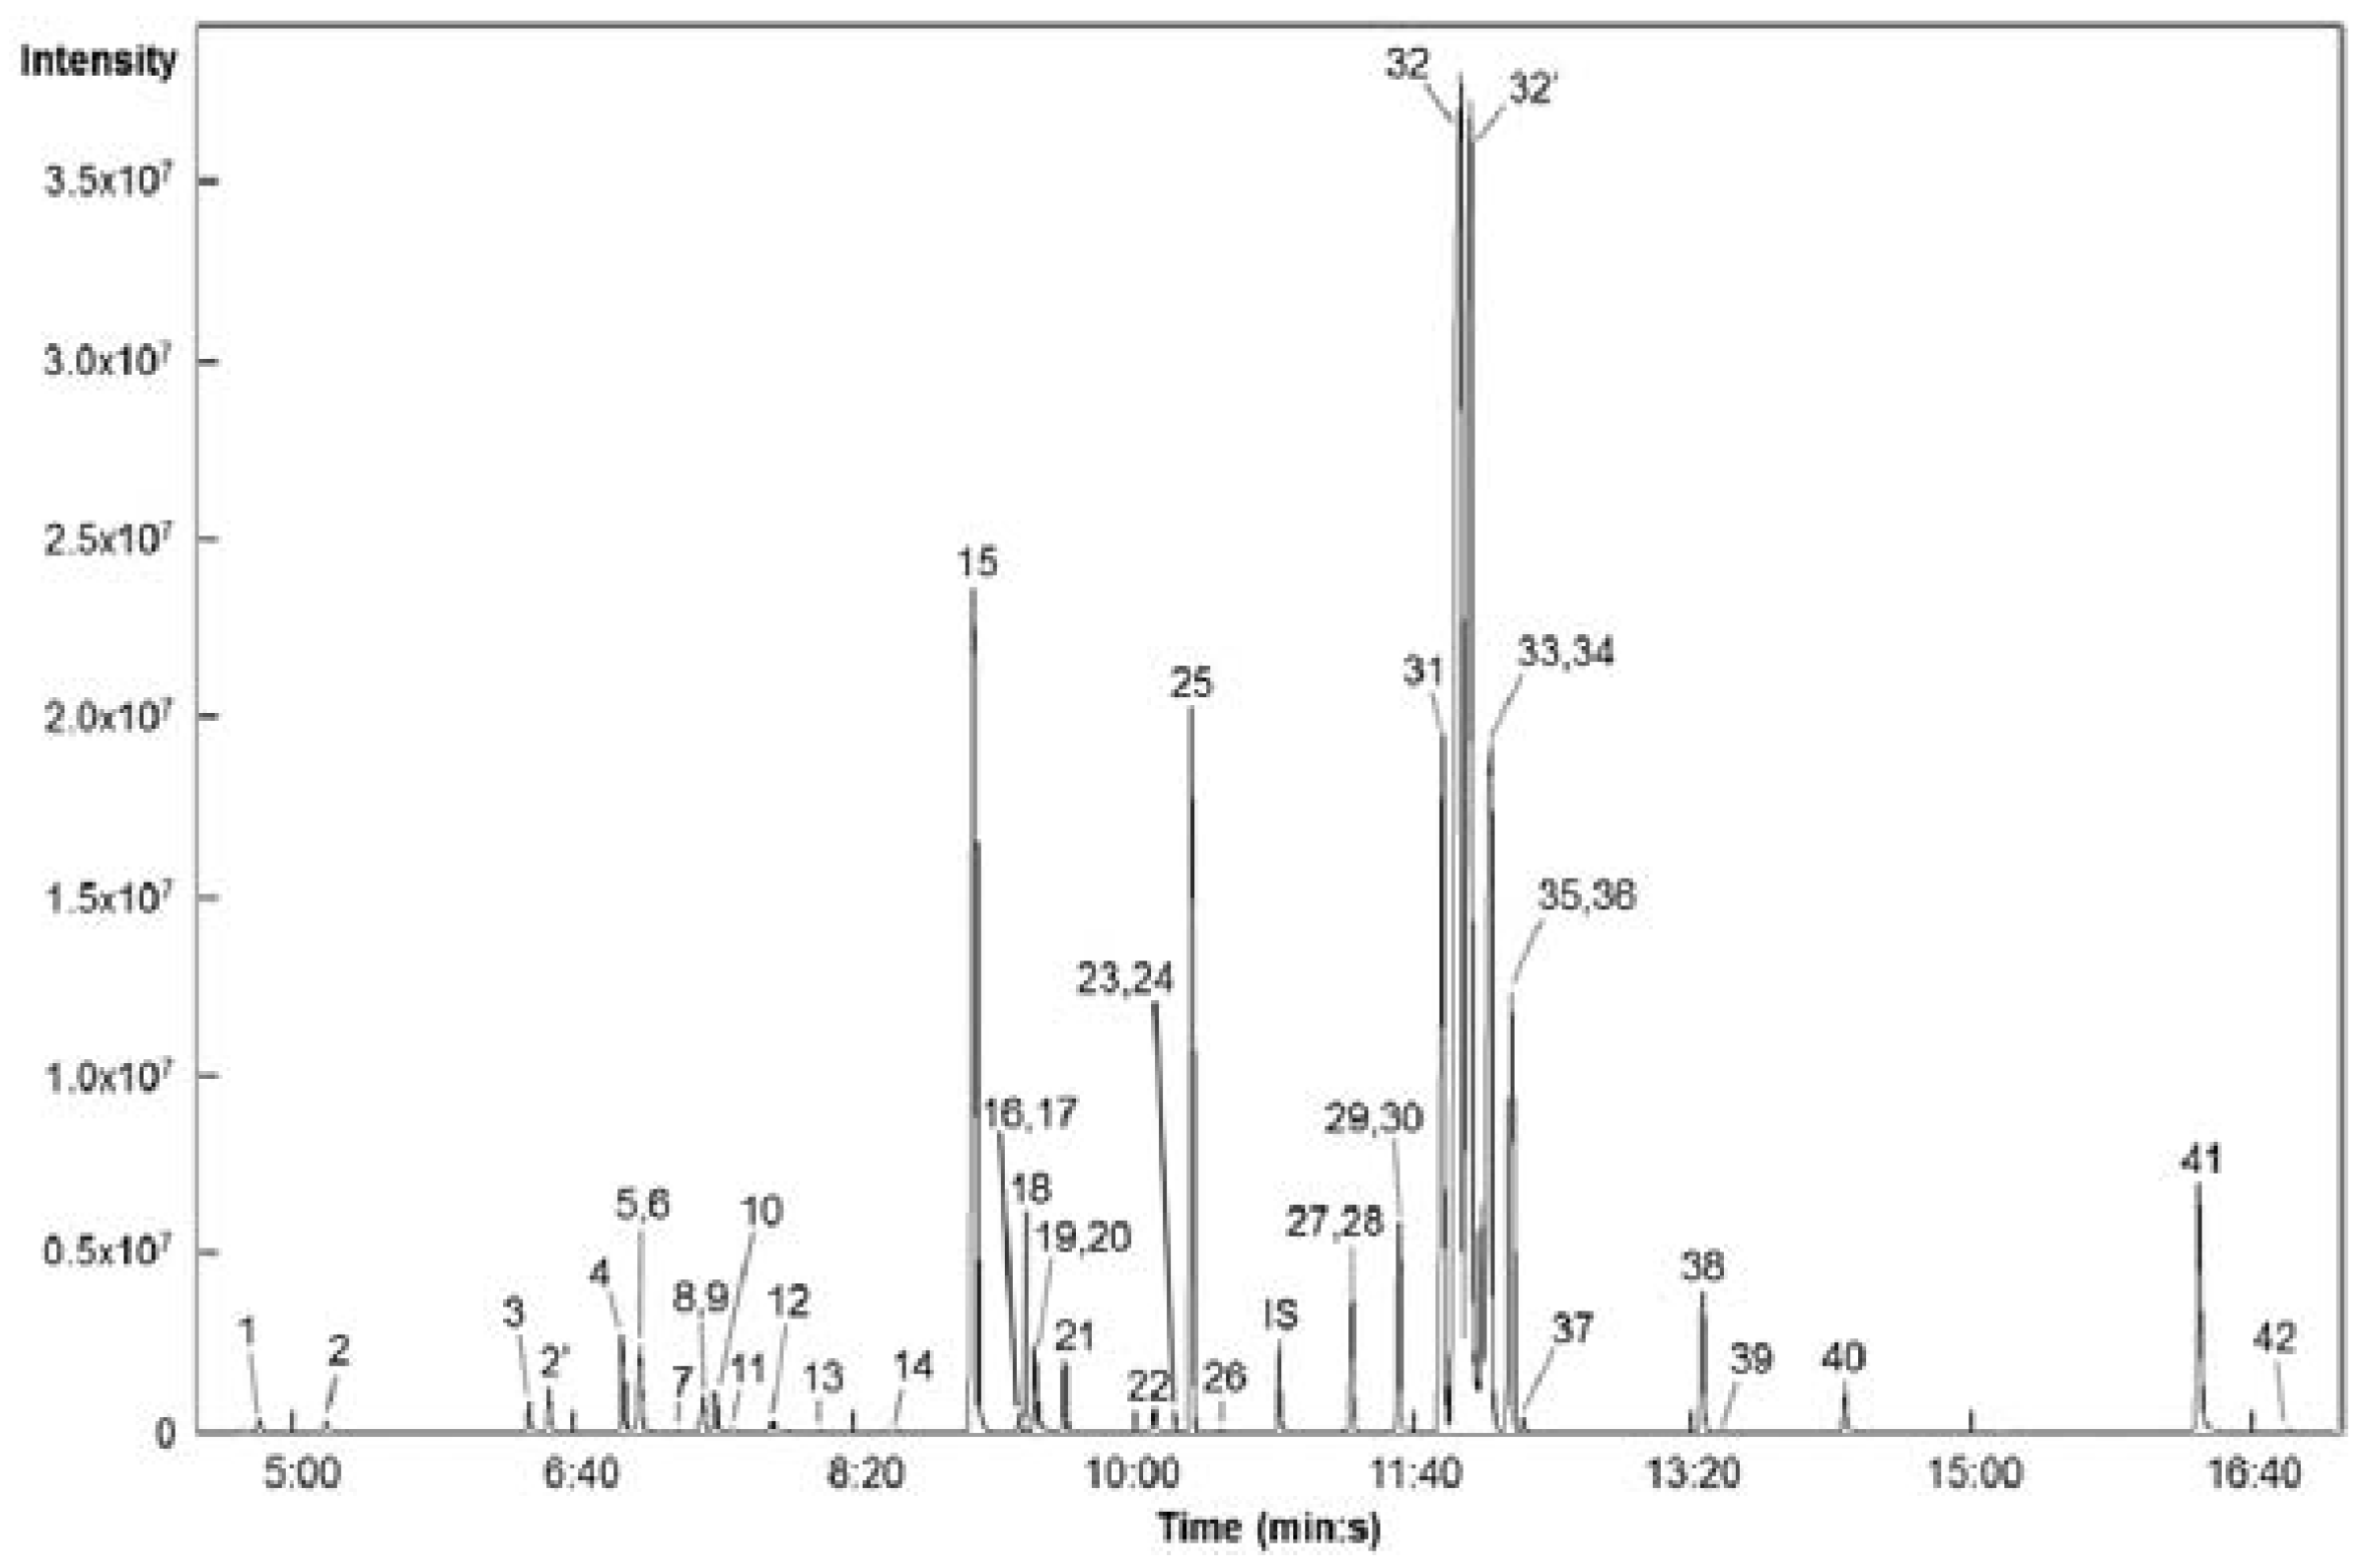
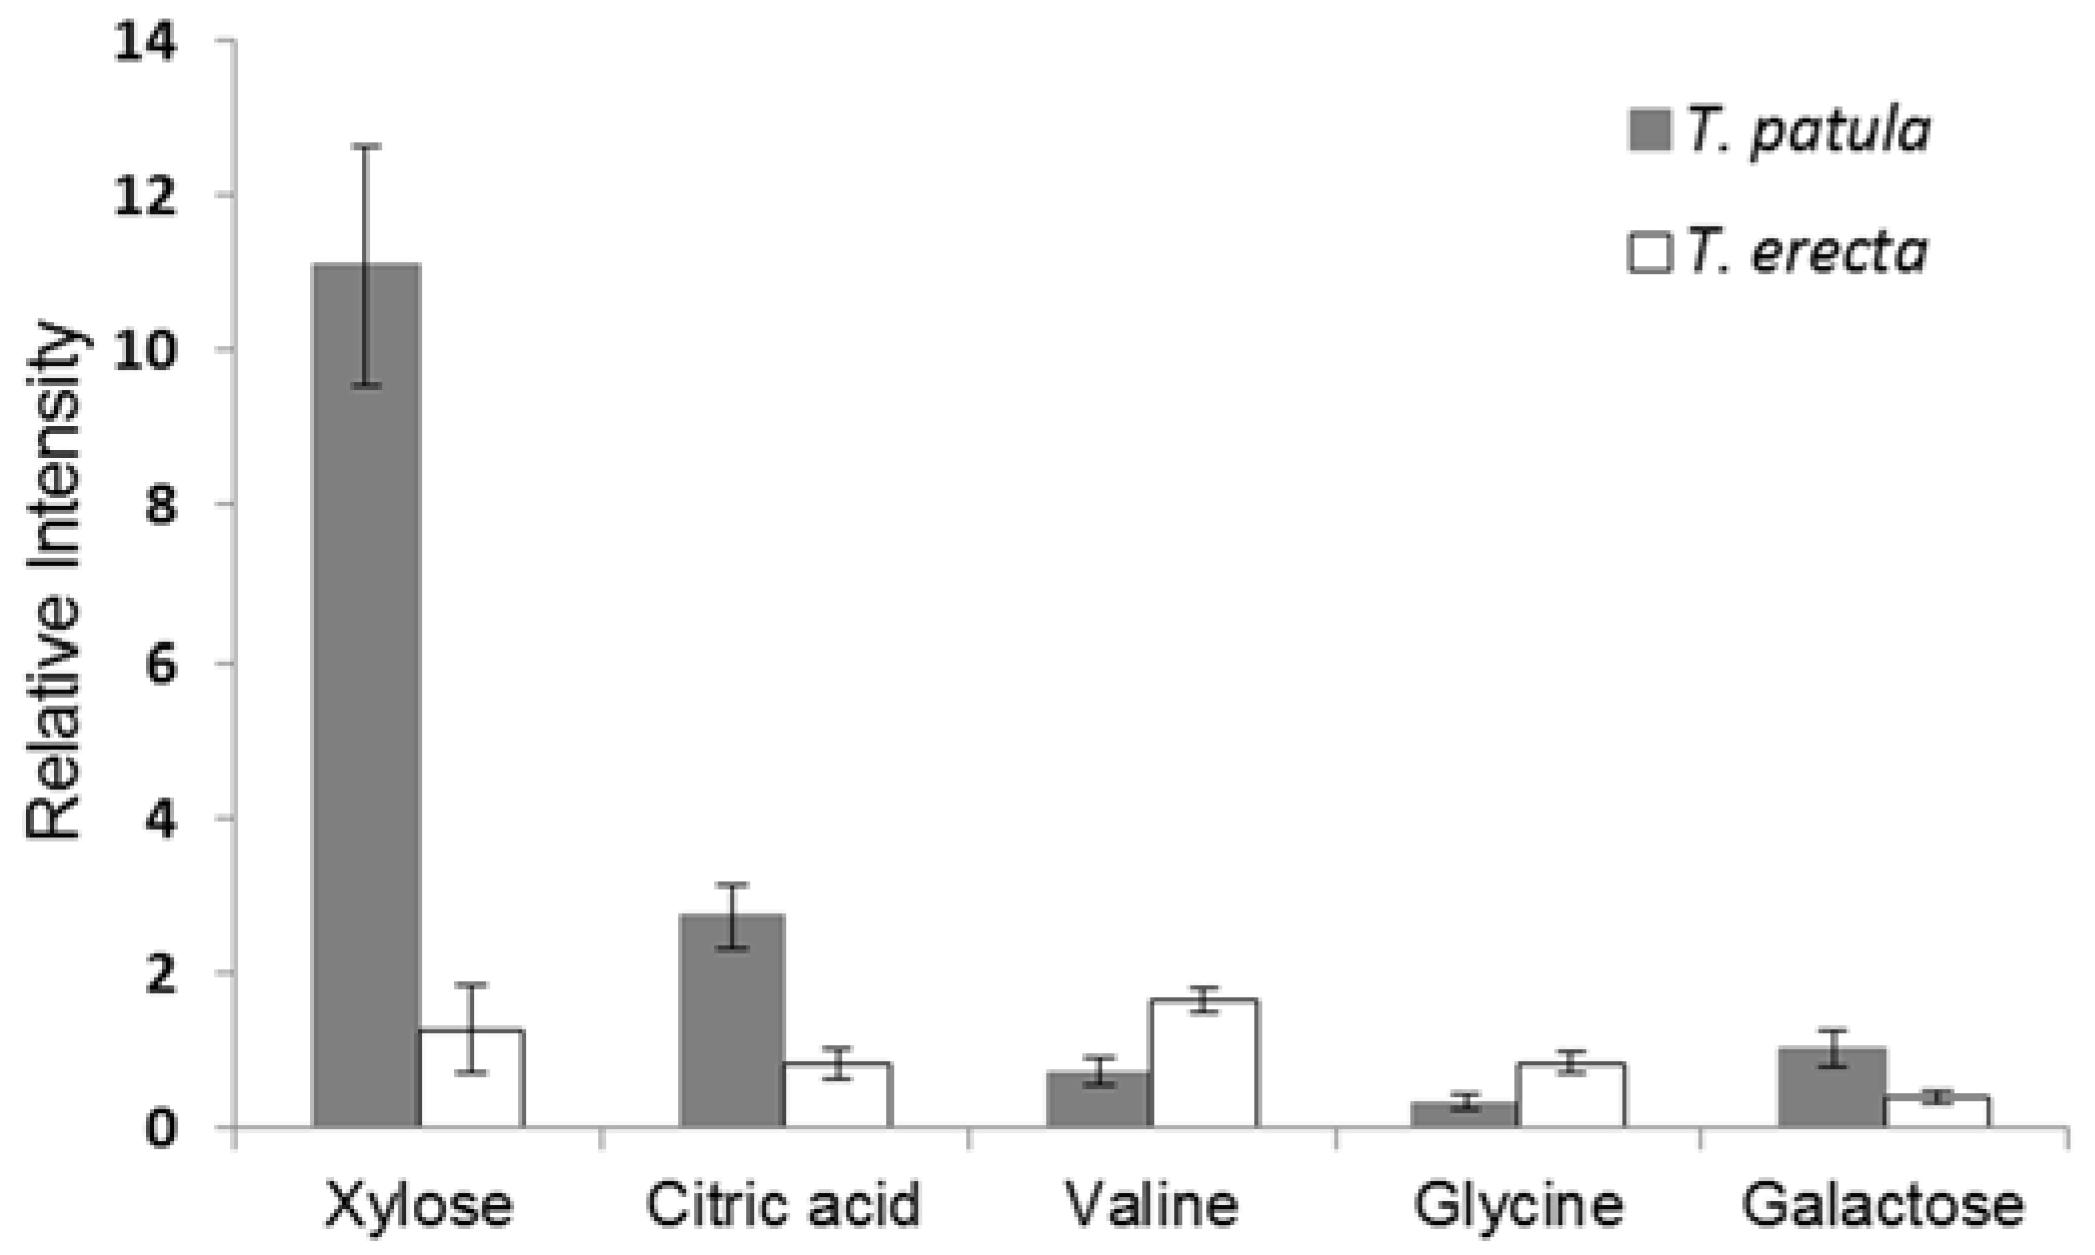
2.2. Chromatographic Data from GC-TOFMS
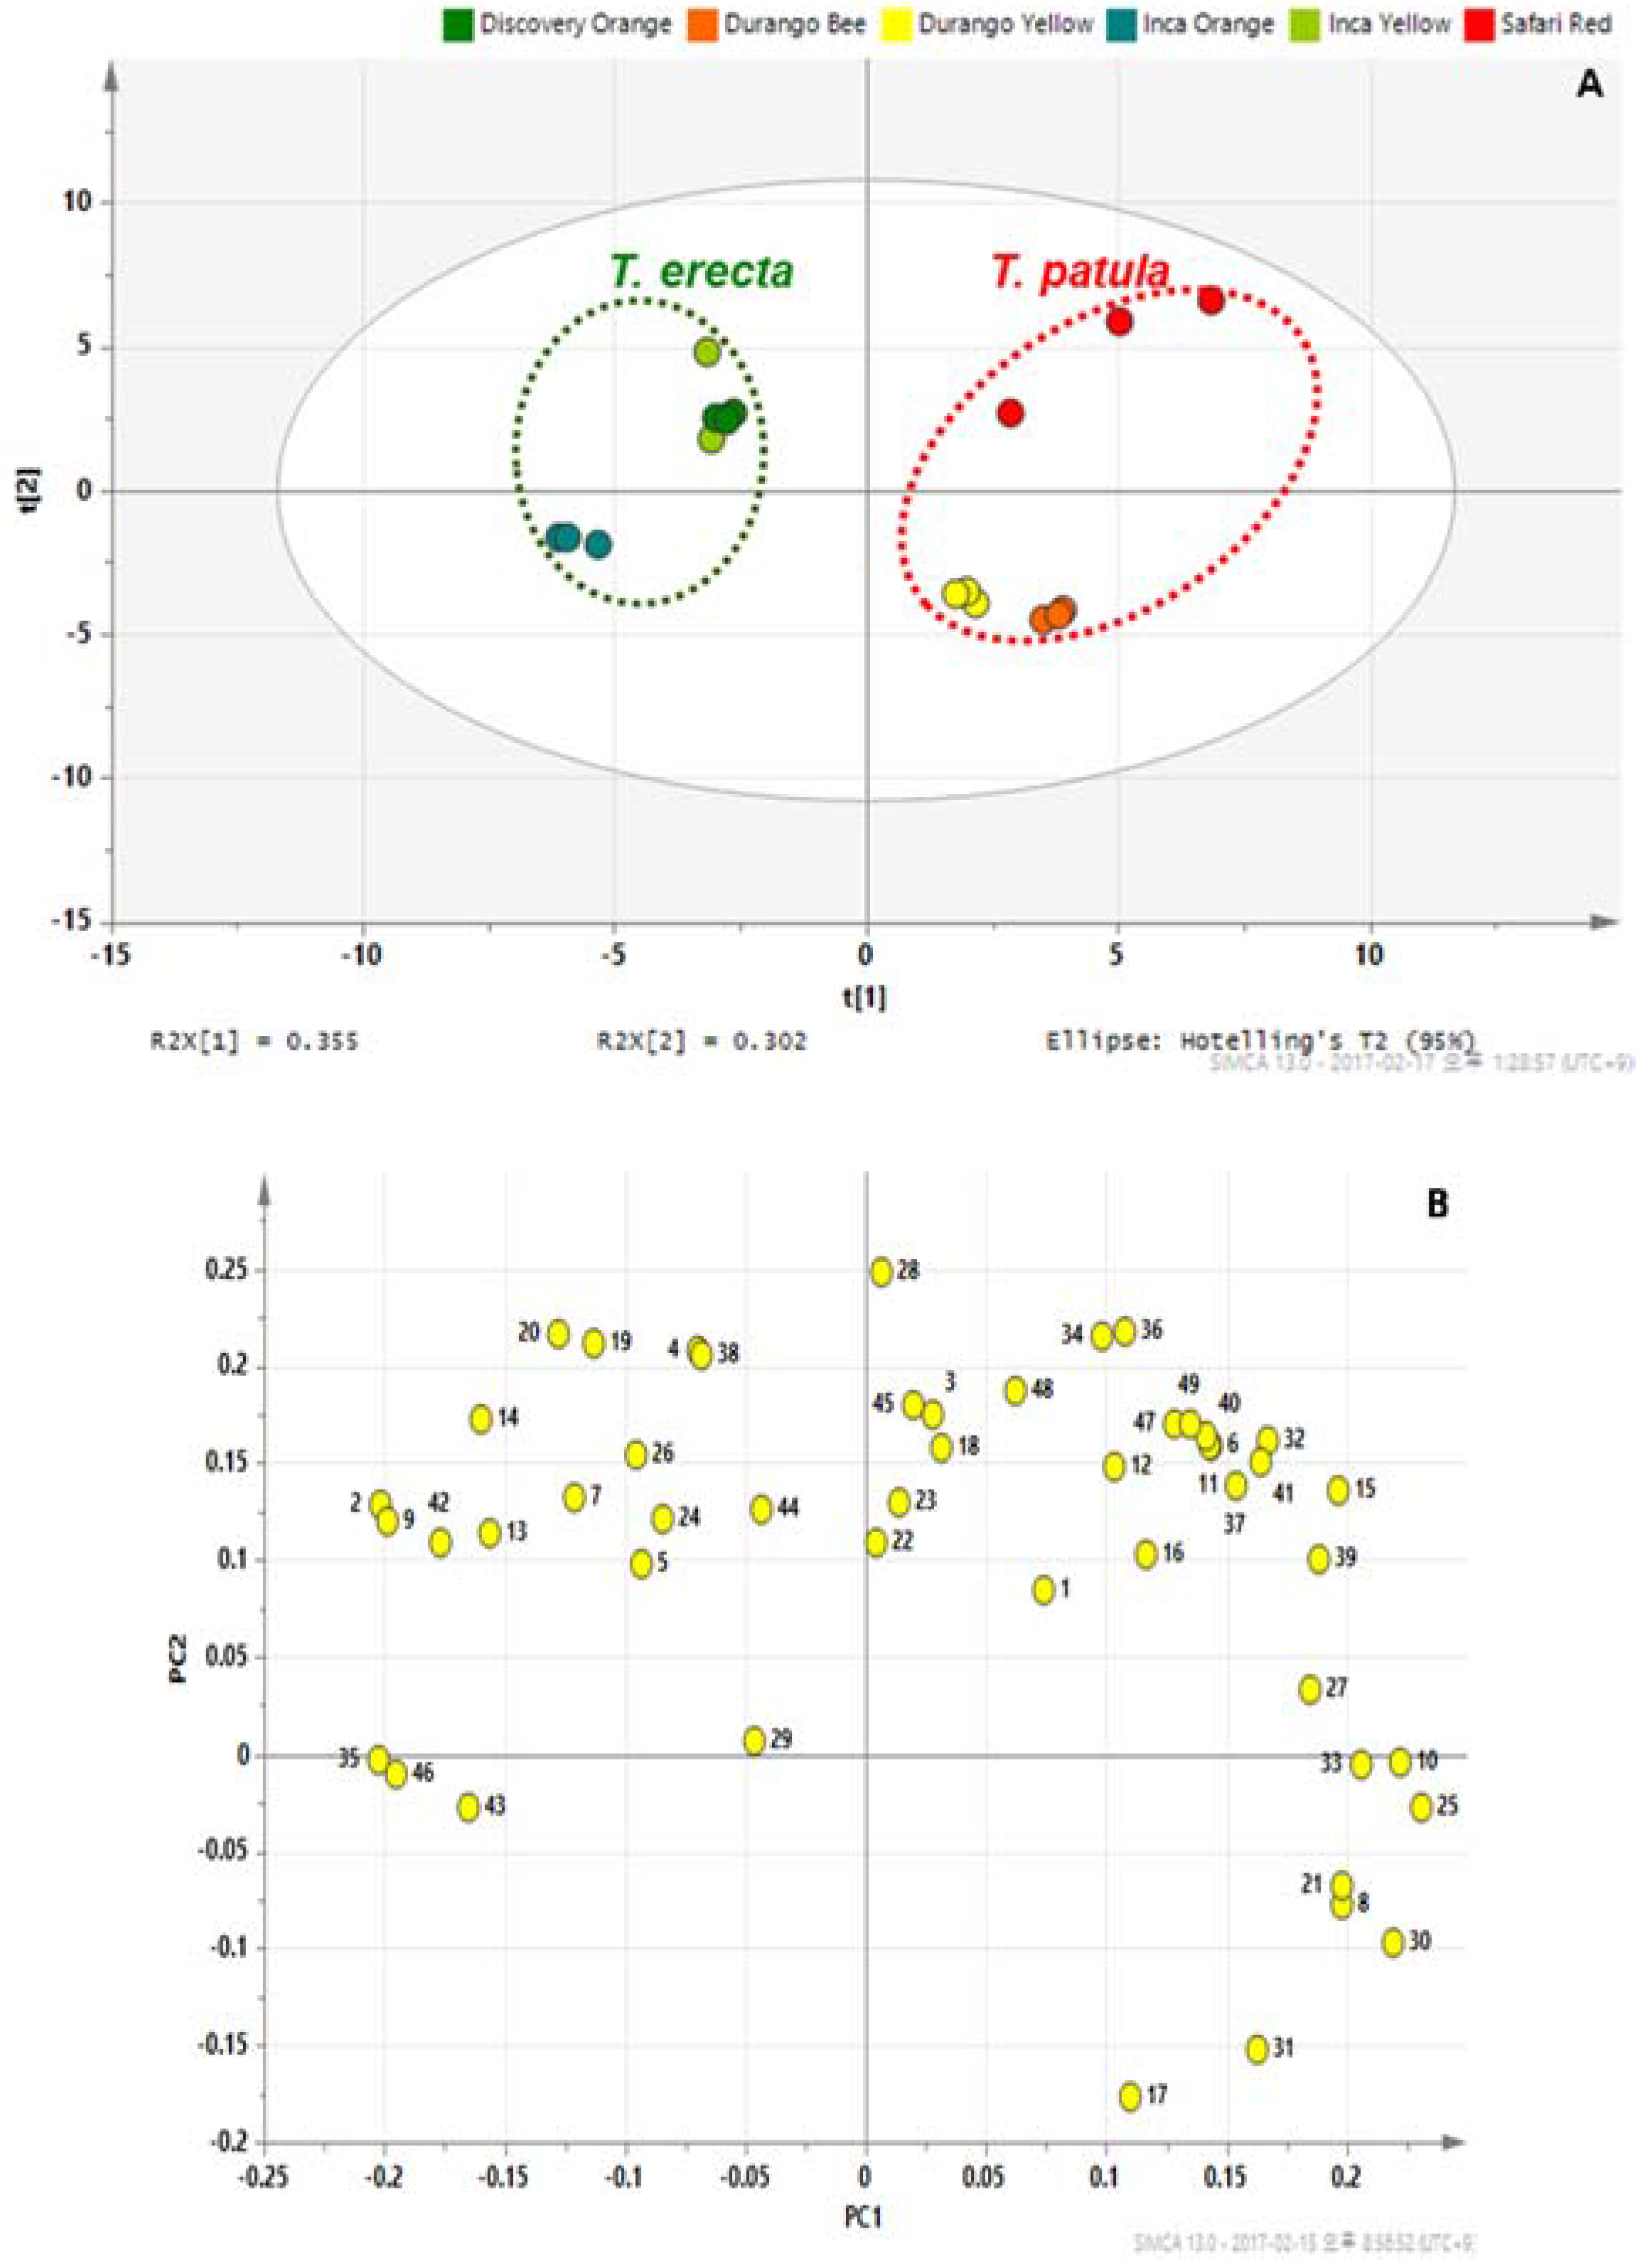
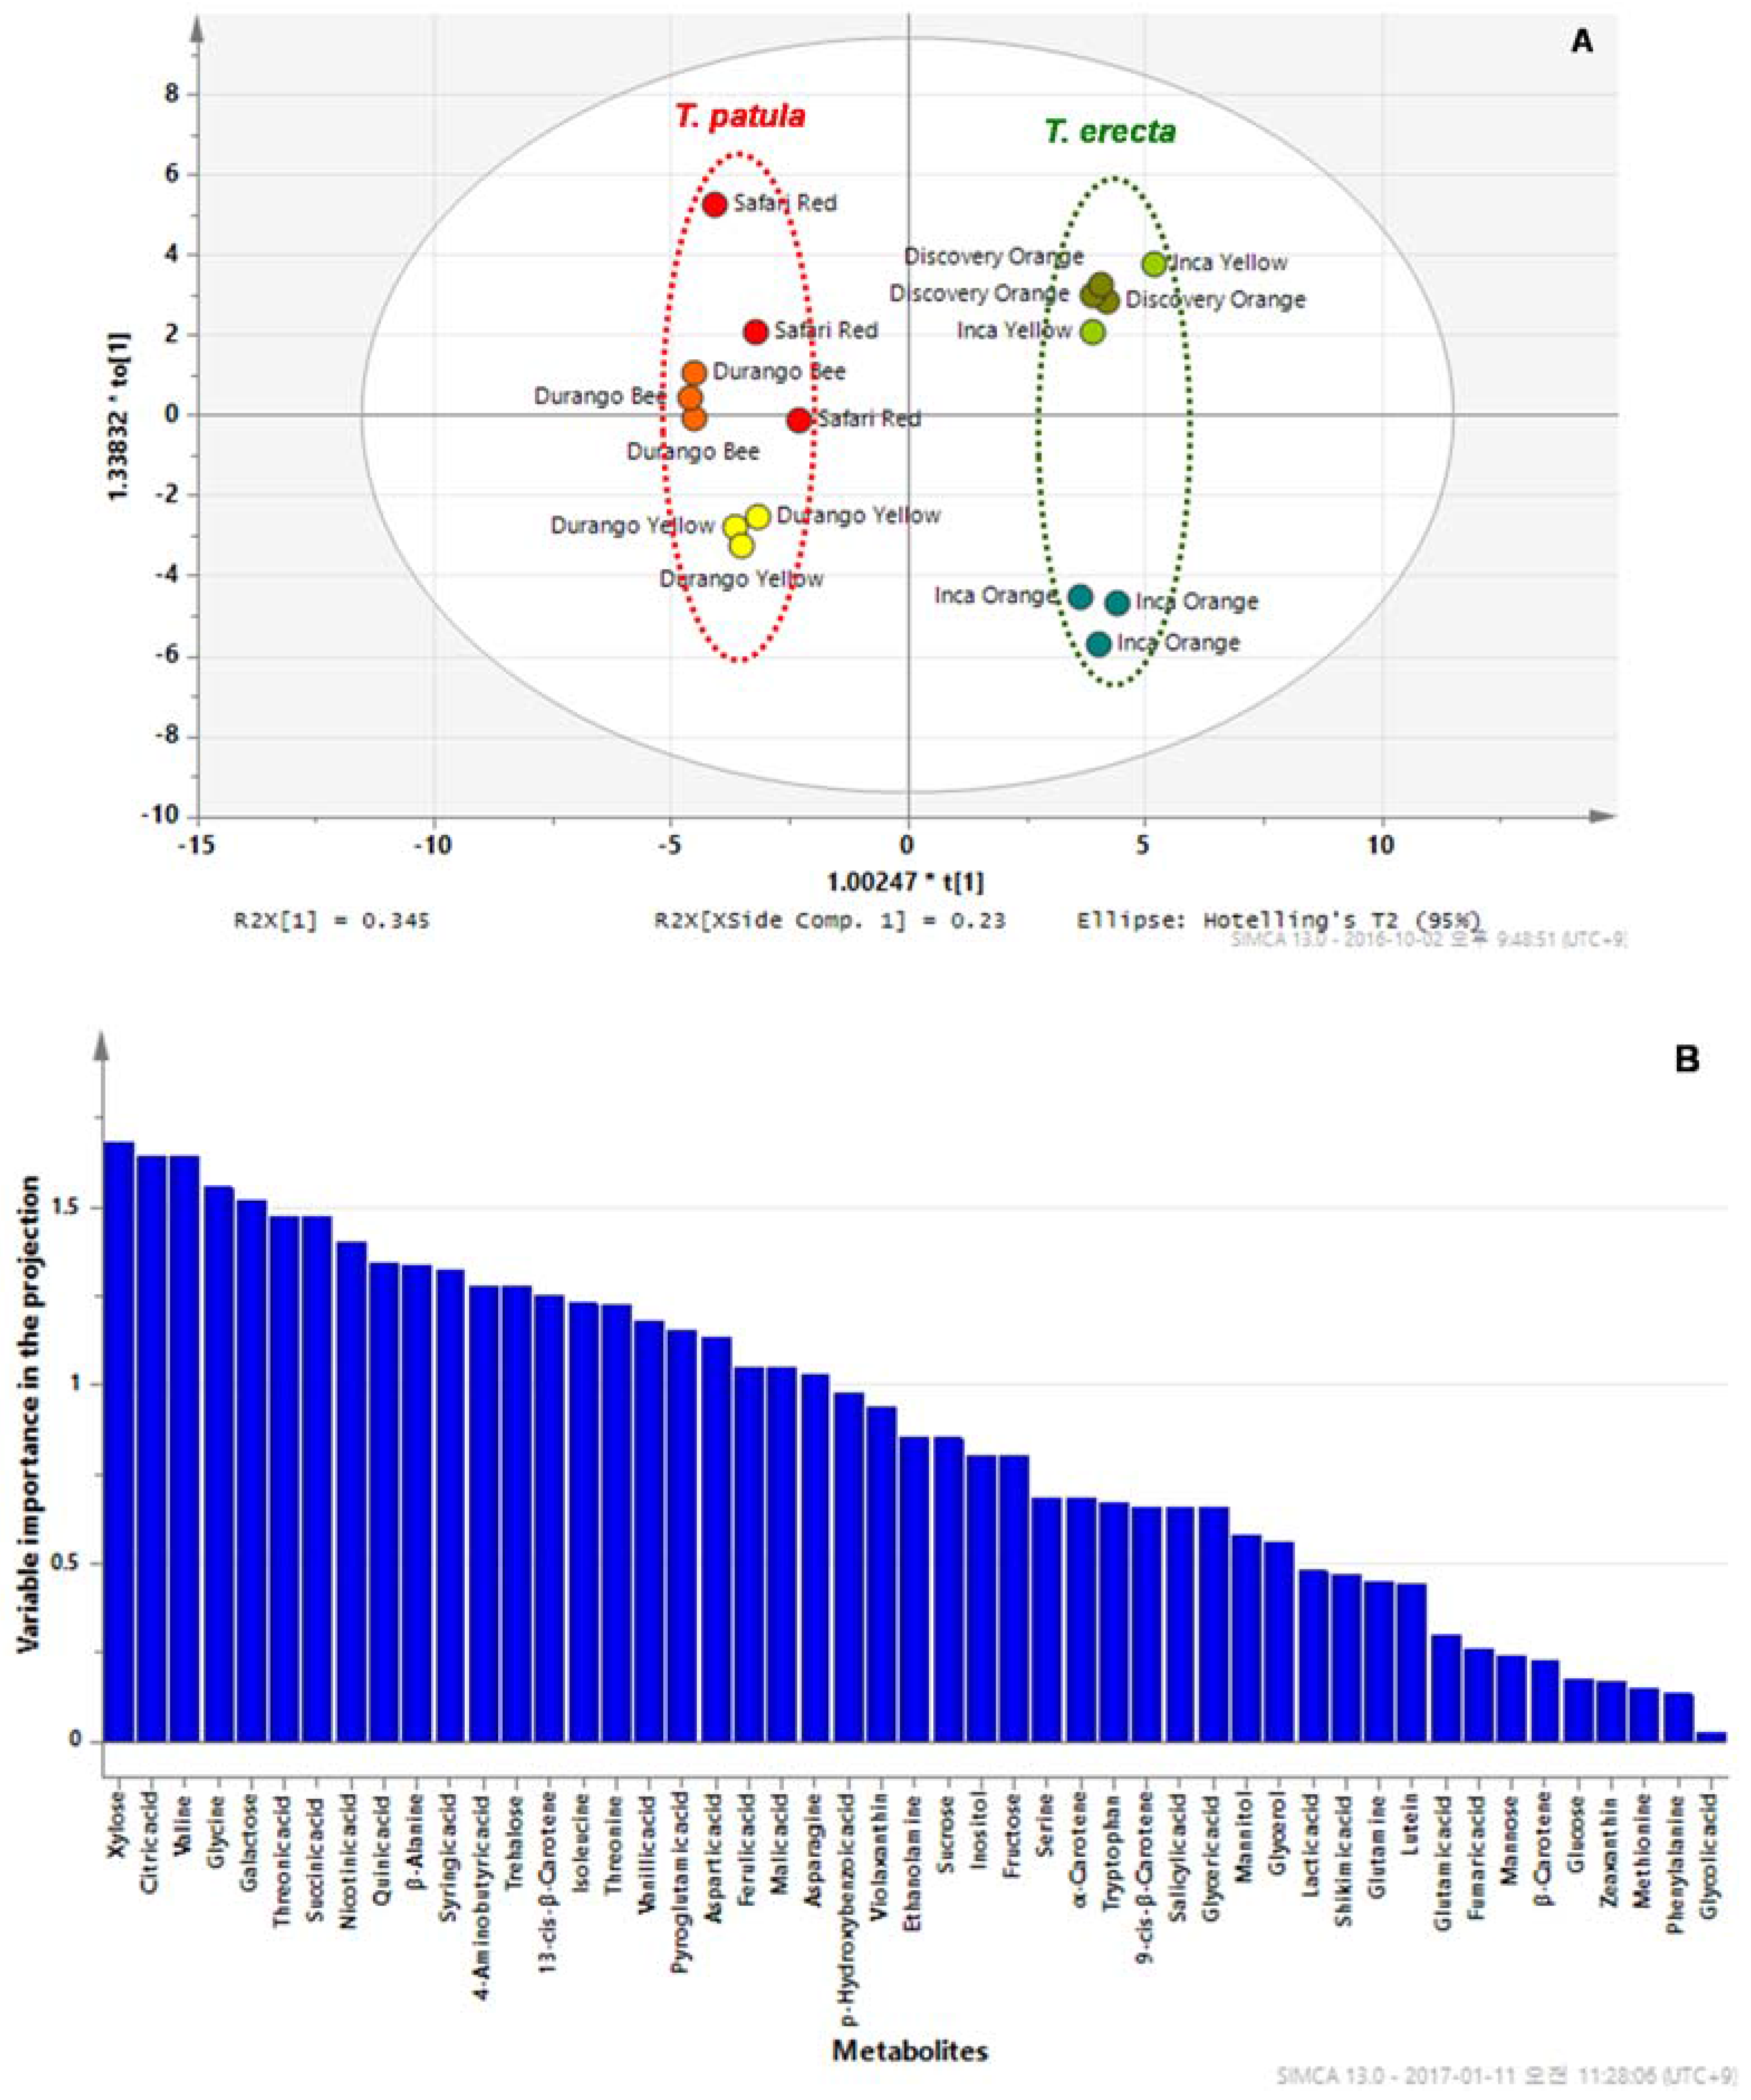
2.3. PCA and OPLS-DA
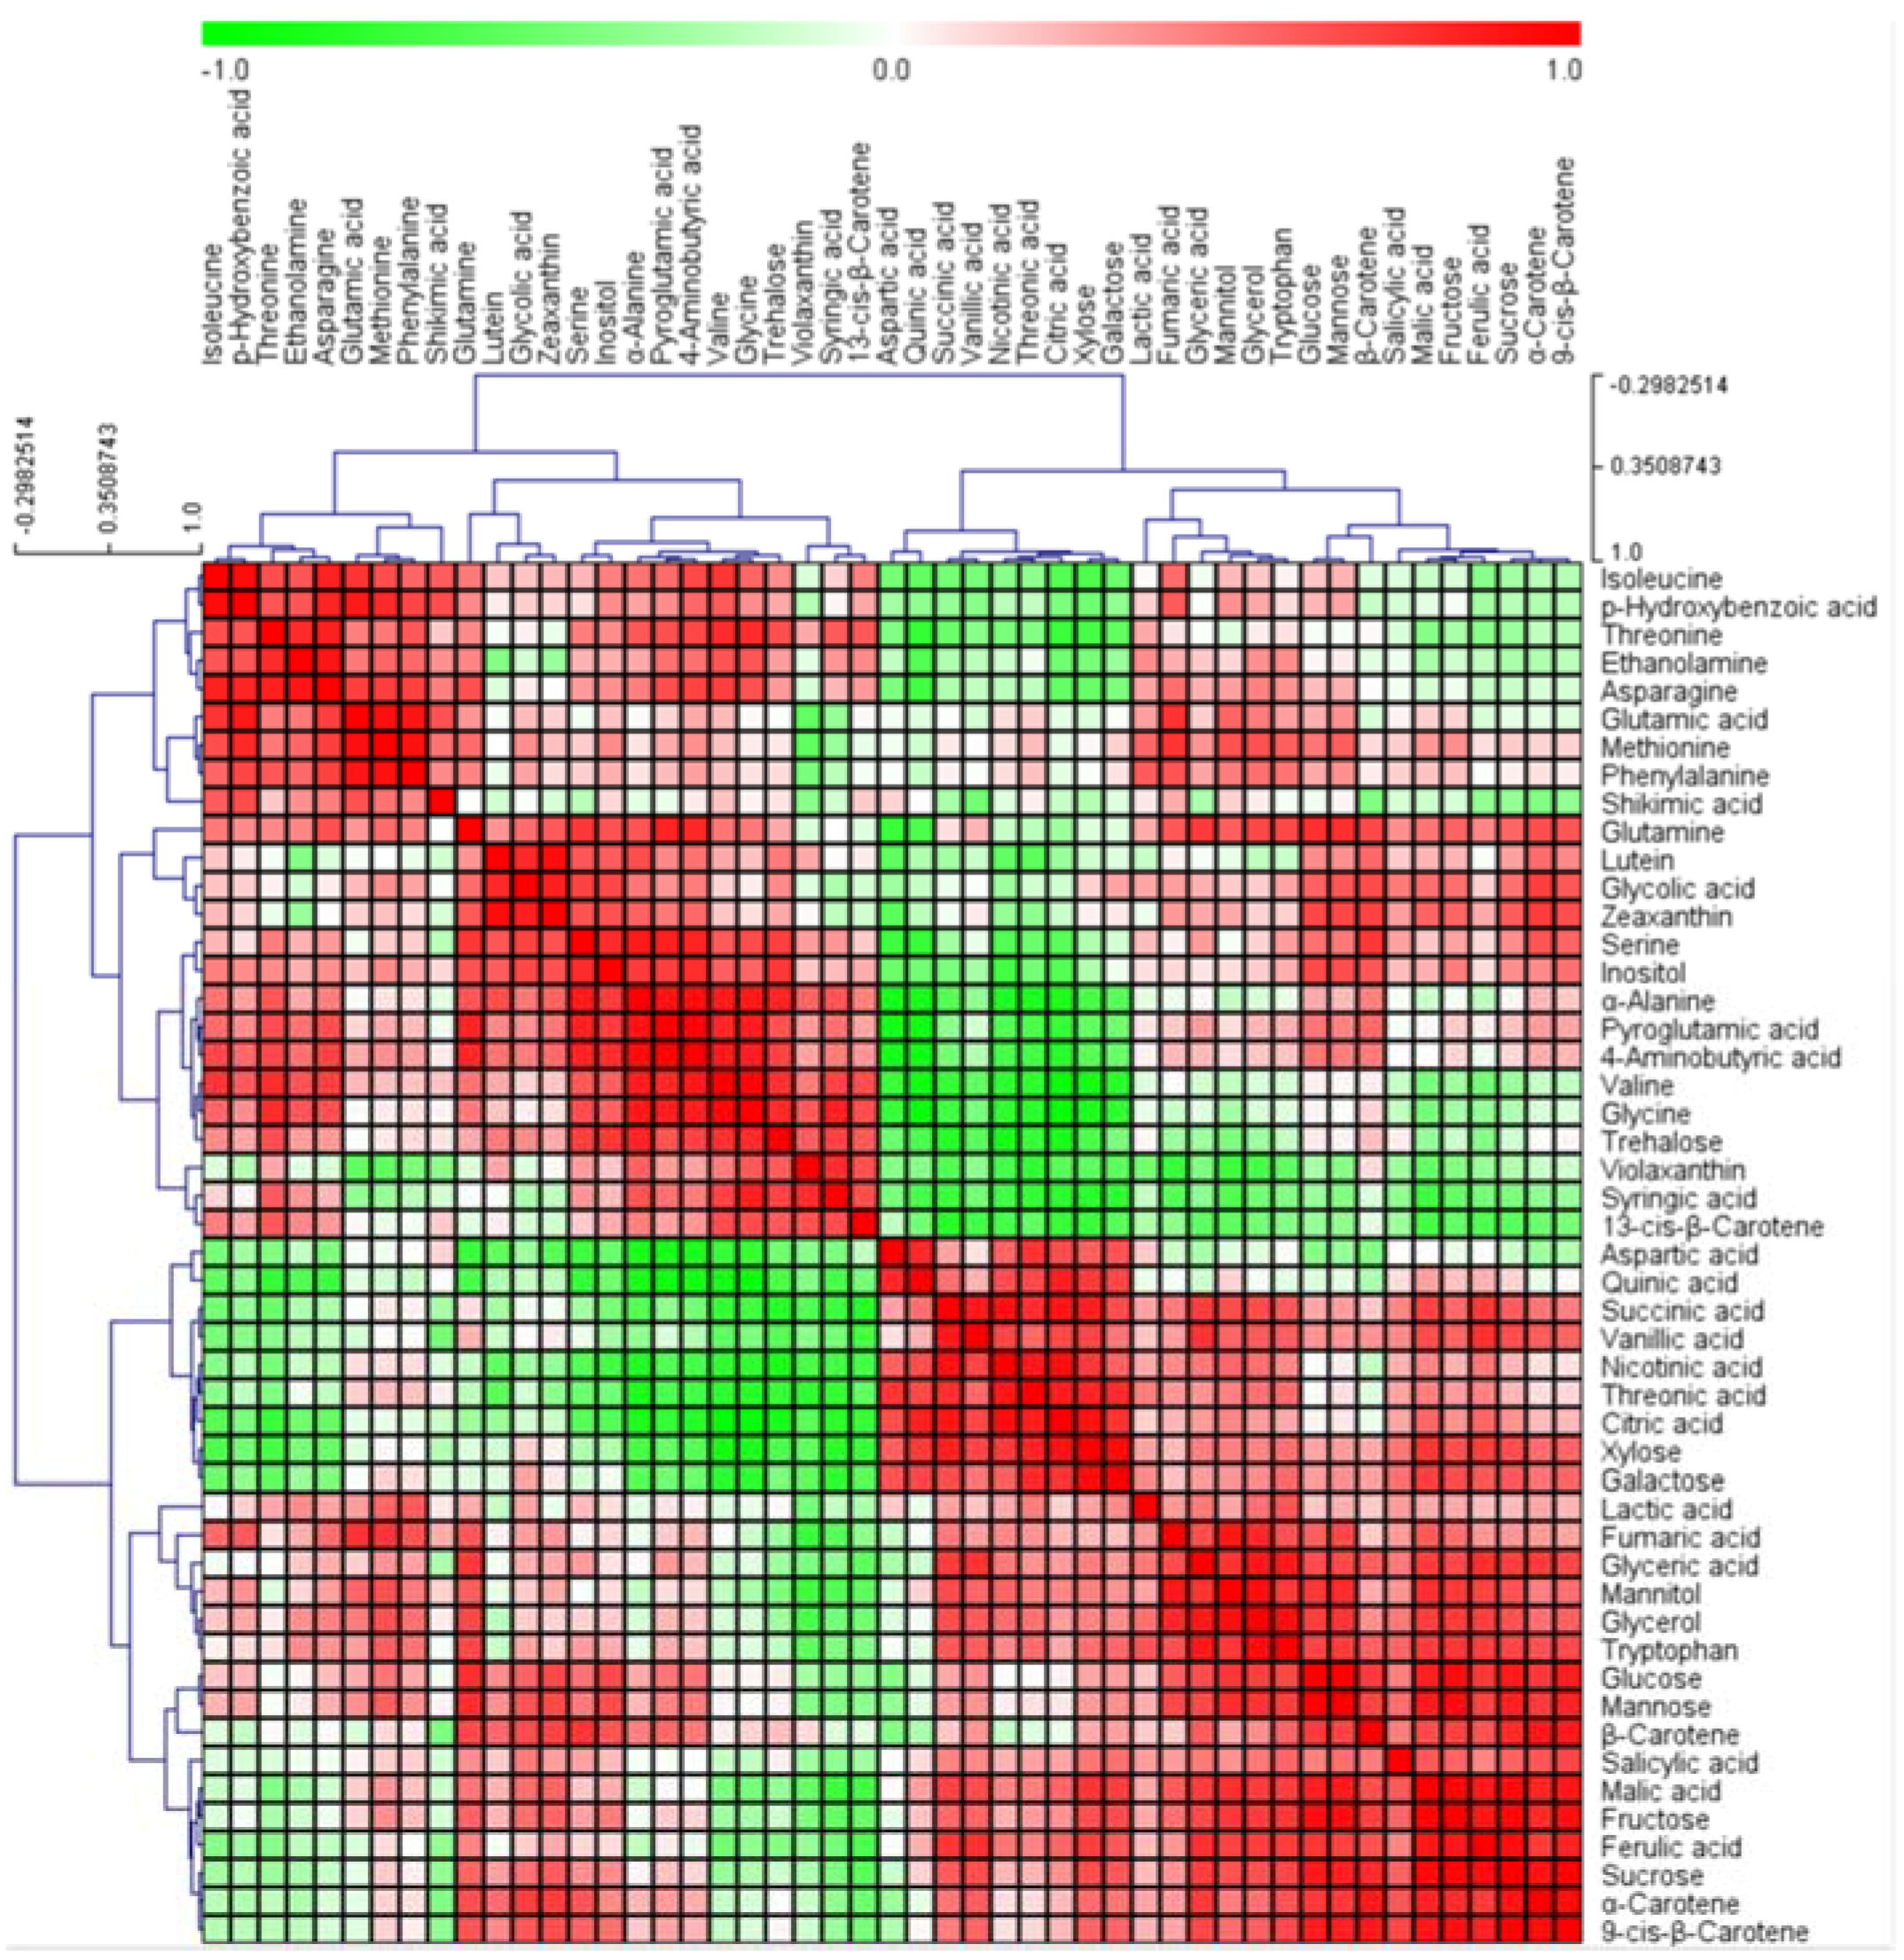
2.4. Hierarchical clustering analysis (HCA)
3. Materials and Methods
3.1. Plant Materials and Sample Preparation
3.2. Carotenoid Extraction and Quantification
3.3. Metabolic Profiling
3.4. Statistical Analysis
Supplementary Materials
Acknowledgements
Author Contributions
Conflicts of Interest
Abbereviations
| CHXB | β-ring hydroxylase |
| CHXE | α-ring hydroxylase |
| DO | Discovery Orange |
| DB | Durango Bee |
| DY | Durango Yellow |
| GABA | γ-Aminobutyric acid |
| GC-MS | Gas-chromatography-mass-spectrometry |
| GC-TOFMS | Gas-chromatography-time-of-flight-mass-spectrometry |
| GGPP | Geranylgeranyldiphosphate |
| HCA | Hierarchical clustering analysis |
| HPLC | High-performance liquid chromatography |
| IO | Inca Orange |
| IS | Internal standard |
| IY | Inca Yellow |
| LC-MS | Liquid-chromatography-mass-spectrometry |
| LCYB | Lycopene β-clcylase |
| LCYE | Lycopene ε-cyclase |
| MEP | Methylerythritol |
| MS | Mass spectrometry |
| NIST | National Institute of Standards and Technology |
| NMR | Nuclear magnetic resonance |
| OPLS-DA | Orthogonal projection to latent structure-discriminant analysis |
| PC1 | Principal component 1 |
| PC2 | Principal component 2 |
| PCA | Principal component analysis |
| PSY | Phytoene synthase |
| SR | Safari Red |
| VIP | Variable importance in the projection |
| ZEP | Zeaxanthin epoxidase |
References
- Cazzonelli, C.I. Carotenoids in nature: Insights from plants and beyond. Funct. Plant Biol. 2011, 38, 833–847. [Google Scholar] [CrossRef]
- Shumskaya, M.; Wurtzel, E.T. The carotenoid biosynthetic pathway: Thinking in all dimensions. Plant Sci. 2013, 208, 58–63. [Google Scholar] [CrossRef] [PubMed]
- Howitt, C.A.; Pogson, B.J. Carotenoid accumulation and function in seeds and non-green tissues. Plant Cell Environ. 2006, 29, 435–445. [Google Scholar] [CrossRef] [PubMed]
- Botella-Pavía, P.; Rodríguez-Concepción, M. Carotenoid biotechnology in plants for nutritionally improved foods. Physiol. Plant. 2006, 126, 369–381. [Google Scholar] [CrossRef]
- Clotault, J.; Peltier, D.; Berruyer, R.; Thomas, M.; Briard, M.; Geoffriau, E. Expression of carotenoid biosynthesis genes during carrot root development. J. Exp. Bot. 2008, 59, 3563–3573. [Google Scholar] [CrossRef] [PubMed] [Green Version]
- Tuan, P.A.; Kim, J.K.; Kim, H.H.; Lee, S.Y.; Park, N.I.; Park, S.U. Carotenoid accumulation and characterization of cDNAs encoding phytoene synthase and phytoene desaturase in garlic (Allium sativum). J. Agric. Food Chem. 2011, 59, 5412–5417. [Google Scholar] [CrossRef] [PubMed]
- Cunningham, F., Jr.; Gantt, E. Genes and enzymes of carotenoid biosynthesis in plants. Annu. Rev. Plant Biol. 1998, 49, 557–583. [Google Scholar] [CrossRef] [PubMed]
- Giuliano, G. Plant carotenoids: Genomics meets multi-gene engineering. Curr. Opin. Plant Biol. 2014, 19, 111–117. [Google Scholar] [CrossRef] [PubMed]
- Jing, C.; Qun, X.; Rohrer, J. HPLC separation of all-trans-β-carotene and its iodine-induced isomers using a C30 column. Thermo Scientific. 2012. Available online: https://static.thermoscientific.com/images/D21011~.pdf (accessed on 1 December 2016).
- Pasikanti, K.K.; Ho, P.; Chan, E. Gas chromatography/mass spectrometry in metabolic profiling of biological fluids. J. Chromatogr. B 2008, 871, 202–211. [Google Scholar] [CrossRef] [PubMed]
- Breitling, R.; Ceniceros, A.; Jankevics, A.; Takano, E. Metabolomics for secondary metabolite research. Metabolites 2013, 3, 1076–1083. [Google Scholar] [CrossRef] [PubMed]
- Weston, L.A.; Skoneczny, D.; Weston, P.A.; Weidenhamer, J.D. Metabolic profiling: An overview—New approaches for the detection and functional analysis of biologically active secondary plant products. J. Allelochem. Interact. 2015, 1, 15–27. [Google Scholar]
- Davies, H.V.; Shepherd, L.V.; Stewart, D.; Frank, T.; Röhlig, R.M.; Engel, K.-H. Metabolome variability in crop plant species–when, where, how much and so what? Regul. Toxicol. Pharmacol. 2010, 58, S54–S61. [Google Scholar] [CrossRef] [PubMed]
- Frank, T.; Meuleye, B.S.; Miller, A.; Shu, Q.-Y.; Engel, K.-H. Metabolite profiling of two low phytic acid (LPA) rice mutants. J. Agric. Food Chem. 2007, 55, 11011–11019. [Google Scholar] [CrossRef] [PubMed]
- Lee, S.; Do, S.-G.; Kim, S.Y.; Kim, J.; Jin, Y.; Lee, C.H. Mass spectrometry-based metabolite profiling and antioxidant activity of aloe vera (Aloe barbadensis Miller) in different growth stages. J. Agric. Food Chem. 2012, 60, 11222–11228. [Google Scholar] [CrossRef] [PubMed]
- Jung, E.S.; Lee, S.; Lim, S.-H.; Ha, S.-H.; Liu, K.-H.; Lee, C.H. Metabolite profiling of the short-term responses of rice leaves (Oryza sativa cv. Ilmi) cultivated under different led lights and its correlations with antioxidant activities. Plant Sci. 2013, 210, 61–69. [Google Scholar] [CrossRef] [PubMed]
- Shyur, L.-F.; Yang, N.-S. Metabolomics for phytomedicine research and drug development. Curr. Opin. Chem. Biol. 2008, 12, 66–71. [Google Scholar] [CrossRef] [PubMed]
- Trethewey, R.N. Metabolite profiling as an aid to metabolic engineering in plants. Curr. Opin. Chem. Biol. 2004, 7, 196–201. [Google Scholar] [CrossRef] [PubMed]
- Beckonert, O.; Keun, H.C.; Ebbels, T.M.; Bundy, J.; Holmes, E.; Lindon, J.C.; Nicholson, J.K. Metabolic profiling, metabolomic and metabonomic procedures for NMR spectroscopy of urine, plasma, serum and tissue extracts. Nat. Protoc. 2007, 2, 2692–2703. [Google Scholar] [CrossRef] [PubMed]
- Fernie, A.R.; Schauer, N. Metabolomics-assisted breeding: A viable option for crop improvement? Trends Genet. 2009, 25, 39–48. [Google Scholar] [CrossRef] [PubMed]
- Vasudevan, P.; Kashyap, S.; Sharma, S. Tagetes: A multipurpose plant. Bioresour. Technol. 1997, 62, 29–35. [Google Scholar] [CrossRef]
- Priyanka, D.; Shalini, T.; Navneet, V.K. A brief study on marigold (Tagetes species): A review. Int. Res. J. Pharm. 2013, 4, 43–48. [Google Scholar]
- Rodriguez, E.; Mabry, T.J. Tageteae-chemical review. Biol. Chem. Compos. 1975, 2, 785–797. [Google Scholar]
- Nikkon, F.; Habib, M.R.; Saud, Z.A.; Karim, M.R.; Roy, A.K.; Zaman, S. Toxicological evaluation of chloroform fraction of flower of Tagetes erecta L. On rats. Int. J. Drug Dev. Res. 2009, 1, 161–165. [Google Scholar]
- Jain, R.; Katare, N.; Kumar, V.; Samanta, A.K.; Goswami, S.; Shrotri, C. In vitro antibacterial potential of different extracts of Tagetes erecta and Tagetes patula. J. Nat. Sci. Res. 2012, 2, 84–90. [Google Scholar]
- Ghani, A. Medicinal Plants of Bangladesh. Chemical Constituents and Uses; Asiatic Society of Bangladesh: Dhaka, Bangladesh, 1998; pp. 301–302. [Google Scholar]
- Bartley, G.E.; Scolnik, P.A. Plant carotenoids: Pigments for photoprotection, visual attraction, and human health. Plant Cell 1995, 7, 1027. [Google Scholar] [CrossRef] [PubMed]
- Hornero-Méndez, D.; Minguez-Mosquera, M.I. Xanthophyll esterification accompanying carotenoid overaccumulation in chromoplast of Capsicum annuum ripening fruits is a constitutive process and useful for ripeness index. J. Agric. Food Chem. 2000, 48, 1617–1622. [Google Scholar] [CrossRef] [PubMed]
- Rodriguez-Amaya, D.B.; Kimura, M. Harvestplus Handbook for Carotenoid Analysis; CiteSeer: Washington, DC, USA, 2004; Volume 2, pp. 6–11. [Google Scholar]
- Rodriguez-Amaya, D.B. Carotenoids and Food Preparation: The Retention of Provitamin a Carotenoids in Prepared, Processed and Stored Foods; John Snow Incorporated/OMNI Project: Arlington, VA, USA, 1997. [Google Scholar]
- Khoo, H.-E.; Prasad, K.N.; Kong, K.-W.; Jiang, Y.; Ismail, A. Carotenoids and their isomers: Color pigments in fruits and vegetables. Molecules 2011, 16, 1710–1738. [Google Scholar] [CrossRef] [PubMed] [Green Version]
- Janik, E.; Grudziński, W.; Gruszecki, W.I.; Krupa, Z. The xanthophyll cycle pigments in Secale cereale leaves under combined CD and high light stress conditions. J. Photochem. Photobiol. B 2008, 90, 47–52. [Google Scholar] [CrossRef] [PubMed]
- Tee, E.-S.; Lim, C.-L. Carotenoid composition and content of Malaysian vegetables and fruits by the AOAC and HPLC methods. Food Chem. 1991, 41, 309–339. [Google Scholar] [CrossRef]
- Holden, J.M.; Eldridge, A.L.; Beecher, G.R.; Buzzard, I.M.; Bhagwat, S.; Davis, C.S.; Douglass, L.W.; Gebhardt, S.; Haytowitz, D.; Schakel, S. Carotenoid content of US foods: An update of the database. J. Food Compos. Anal. 1999, 12, 169–196. [Google Scholar] [CrossRef]
- Valadon, L.T.; Mummery, R.S. Carotenoids of certain Compositae flowers. Phytochemistry 1967, 6, 983–988. [Google Scholar] [CrossRef]
- Kasumov, M. Novel yellow food colorings for confectionery. Pishch Promst (Moscow) 1991, 2, 57–60. [Google Scholar]
- Moehs, C.P.; Tian, L.; Osteryoung, K.W.; DellaPenna, D. Analysis of carotenoid biosynthetic gene expression during marigold petal development. Plant Mol. Biol. 2001, 45, 281–293. [Google Scholar] [CrossRef]
- Halket, J.M.; Waterman, D.; Przyborowska, A.M.; Patel, R.K.; Fraser, P.D.; Bramley, P.M. Chemical derivatization and mass spectral libraries in metabolic profiling by GC/MS and LC/MS/MS. J. Exp. Bot. 2005, 56, 219–243. [Google Scholar] [CrossRef] [PubMed]
- Kim, J.K.; Park, S.-Y.; Lim, S.-H.; Yeo, Y.; Cho, H.S.; Ha, S.-H. Comparative metabolic profiling of pigmented rice (Oryza sativa L.) cultivars reveals primary metabolites are correlated with secondary metabolites. J. Cereal Sci. 2013, 57, 14–20. [Google Scholar] [CrossRef]
- Kim, Y.B.; Park, S.-Y.; Park, C.H.; Park, W.T.; Kim, S.-J.; Ha, S.-H.; Arasu, M.V.; Al-Dhabi, N.A.; Kim, J.K.; Park, S.U. Metabolomics of differently colored gladiolus cultivars. Appl. Biol. Chem. 2016, 59, 597–607. [Google Scholar] [CrossRef]
- Tarpley, L.; Duran, A.L.; Kebrom, T.H.; Sumner, L.W. Biomarker metabolites capturing the metabolite variance present in a rice plant developmental period. BMC Plant Boil. 2005, 5, 8. [Google Scholar]
- Jung, Y.; Lee, J.; Kwon, J.; Lee, K.-S.; Ryu, D.H.; Hwang, G.-S. Discrimination of the geographical origin of beef by 1H-NMR-based metabolomics. J. Agric. Food Chem. 2010, 58, 10458–10466. [Google Scholar] [CrossRef] [PubMed]
- Steuer, R.; Kurths, J.; Fiehn, O.; Weckwerth, W. Interpreting correlations in metabolomic networks. Biochem. Soc. Trans. 2003, 31, 1476–1478. [Google Scholar] [CrossRef] [PubMed]
- Fritz, C.; Palacios-Rojas, N.; Feil, R.; Stitt, M. Regulation of secondary metabolism by the carbon–nitrogen status in tobacco: Nitrate inhibits large sectors of phenylpropanoid metabolism. Plant J. 2006, 46, 533–548. [Google Scholar] [CrossRef] [PubMed]
- Stitt, M.; Krapp, A. The interaction between elevated carbon dioxide and nitrogen nutrition: The physiological and molecular background. Plant Cell Environ. 1999, 22, 583–621. [Google Scholar] [CrossRef]
- Ward, J.L.; Baker, J.M.; Llewellyn, A.M.; Hawkins, N.D.; Beale, M.H. Metabolomic analysis of arabidopsis reveals hemiterpenoid glycosides as products of a nitrate ion-regulated, carbon flux overflow. Proc. Natl. Acad. Sci. USA 2011, 108, 10762–10767. [Google Scholar] [CrossRef] [PubMed]
- Tuan, P.A.; Kim, J.K.; Park, N.I.; Lee, S.Y.; Park, S.U. Carotenoid content and expression of phytoene synthase and phytoene desaturase genes in bitter melon (Momordica charantia). Food Chem. 2011, 126, 1686–1692. [Google Scholar] [CrossRef] [PubMed]
- Boggio, S.B.; Palatnik, J.F.; Heldt, H.W.; Valle, E.M. Changes in amino acid composition and nitrogen metabolizing enzymes in ripening fruits of Lycopersicon esculentum Mill. Plant Sci. 2000, 159, 125–133. [Google Scholar] [CrossRef]
- Pan, Z.; Raftery, D. Comparing and combining NMR spectroscopy and mass spectrometry in metabolomics. Anal. Bioanal. Chem. 2007, 387, 525–527. [Google Scholar] [CrossRef] [PubMed]
- Park, S.-Y.; Choi, S.R.; Lim, S.-H.; Yeo, Y.; Kweon, S.J.; Bae, Y.-S.; Kim, K.W.; Im, K.-H.; Ahn, S.K.; Ha, S.-H. Identification and quantification of carotenoids in paprika fruits and cabbage, kale, and lettuce leaves. J. Korean Soc. Appl. Biol. Chem. 2014, 57, 355–358. [Google Scholar] [CrossRef]
- Sample Availability: Not available.


© 2017 by the authors. Licensee MDPI, Basel, Switzerland. This article is an open access article distributed under the terms and conditions of the Creative Commons Attribution (CC BY) license ( http://creativecommons.org/licenses/by/4.0/).
Share and Cite
Park, Y.J.; Park, S.-Y.; Valan Arasu, M.; Al-Dhabi, N.A.; Ahn, H.-g.; Kim, J.K.; Park, S.U. Accumulation of Carotenoids and Metabolic Profiling in Different Cultivars of Tagetes Flowers. Molecules 2017, 22, 313. https://doi.org/10.3390/molecules22020313
Park YJ, Park S-Y, Valan Arasu M, Al-Dhabi NA, Ahn H-g, Kim JK, Park SU. Accumulation of Carotenoids and Metabolic Profiling in Different Cultivars of Tagetes Flowers. Molecules. 2017; 22(2):313. https://doi.org/10.3390/molecules22020313
Chicago/Turabian StylePark, Yun Ji, Soo-Yun Park, Mariadhas Valan Arasu, Naif Abdullah Al-Dhabi, Hyung-geun Ahn, Jae Kwang Kim, and Sang Un Park. 2017. "Accumulation of Carotenoids and Metabolic Profiling in Different Cultivars of Tagetes Flowers" Molecules 22, no. 2: 313. https://doi.org/10.3390/molecules22020313