
An Investigation on the Quantitative Structure-Activity Relationships of the Anti-Inflammatory Activity of Diterpenoid Alkaloids

Abstract
:1. Introduction
2. Results and Discussion
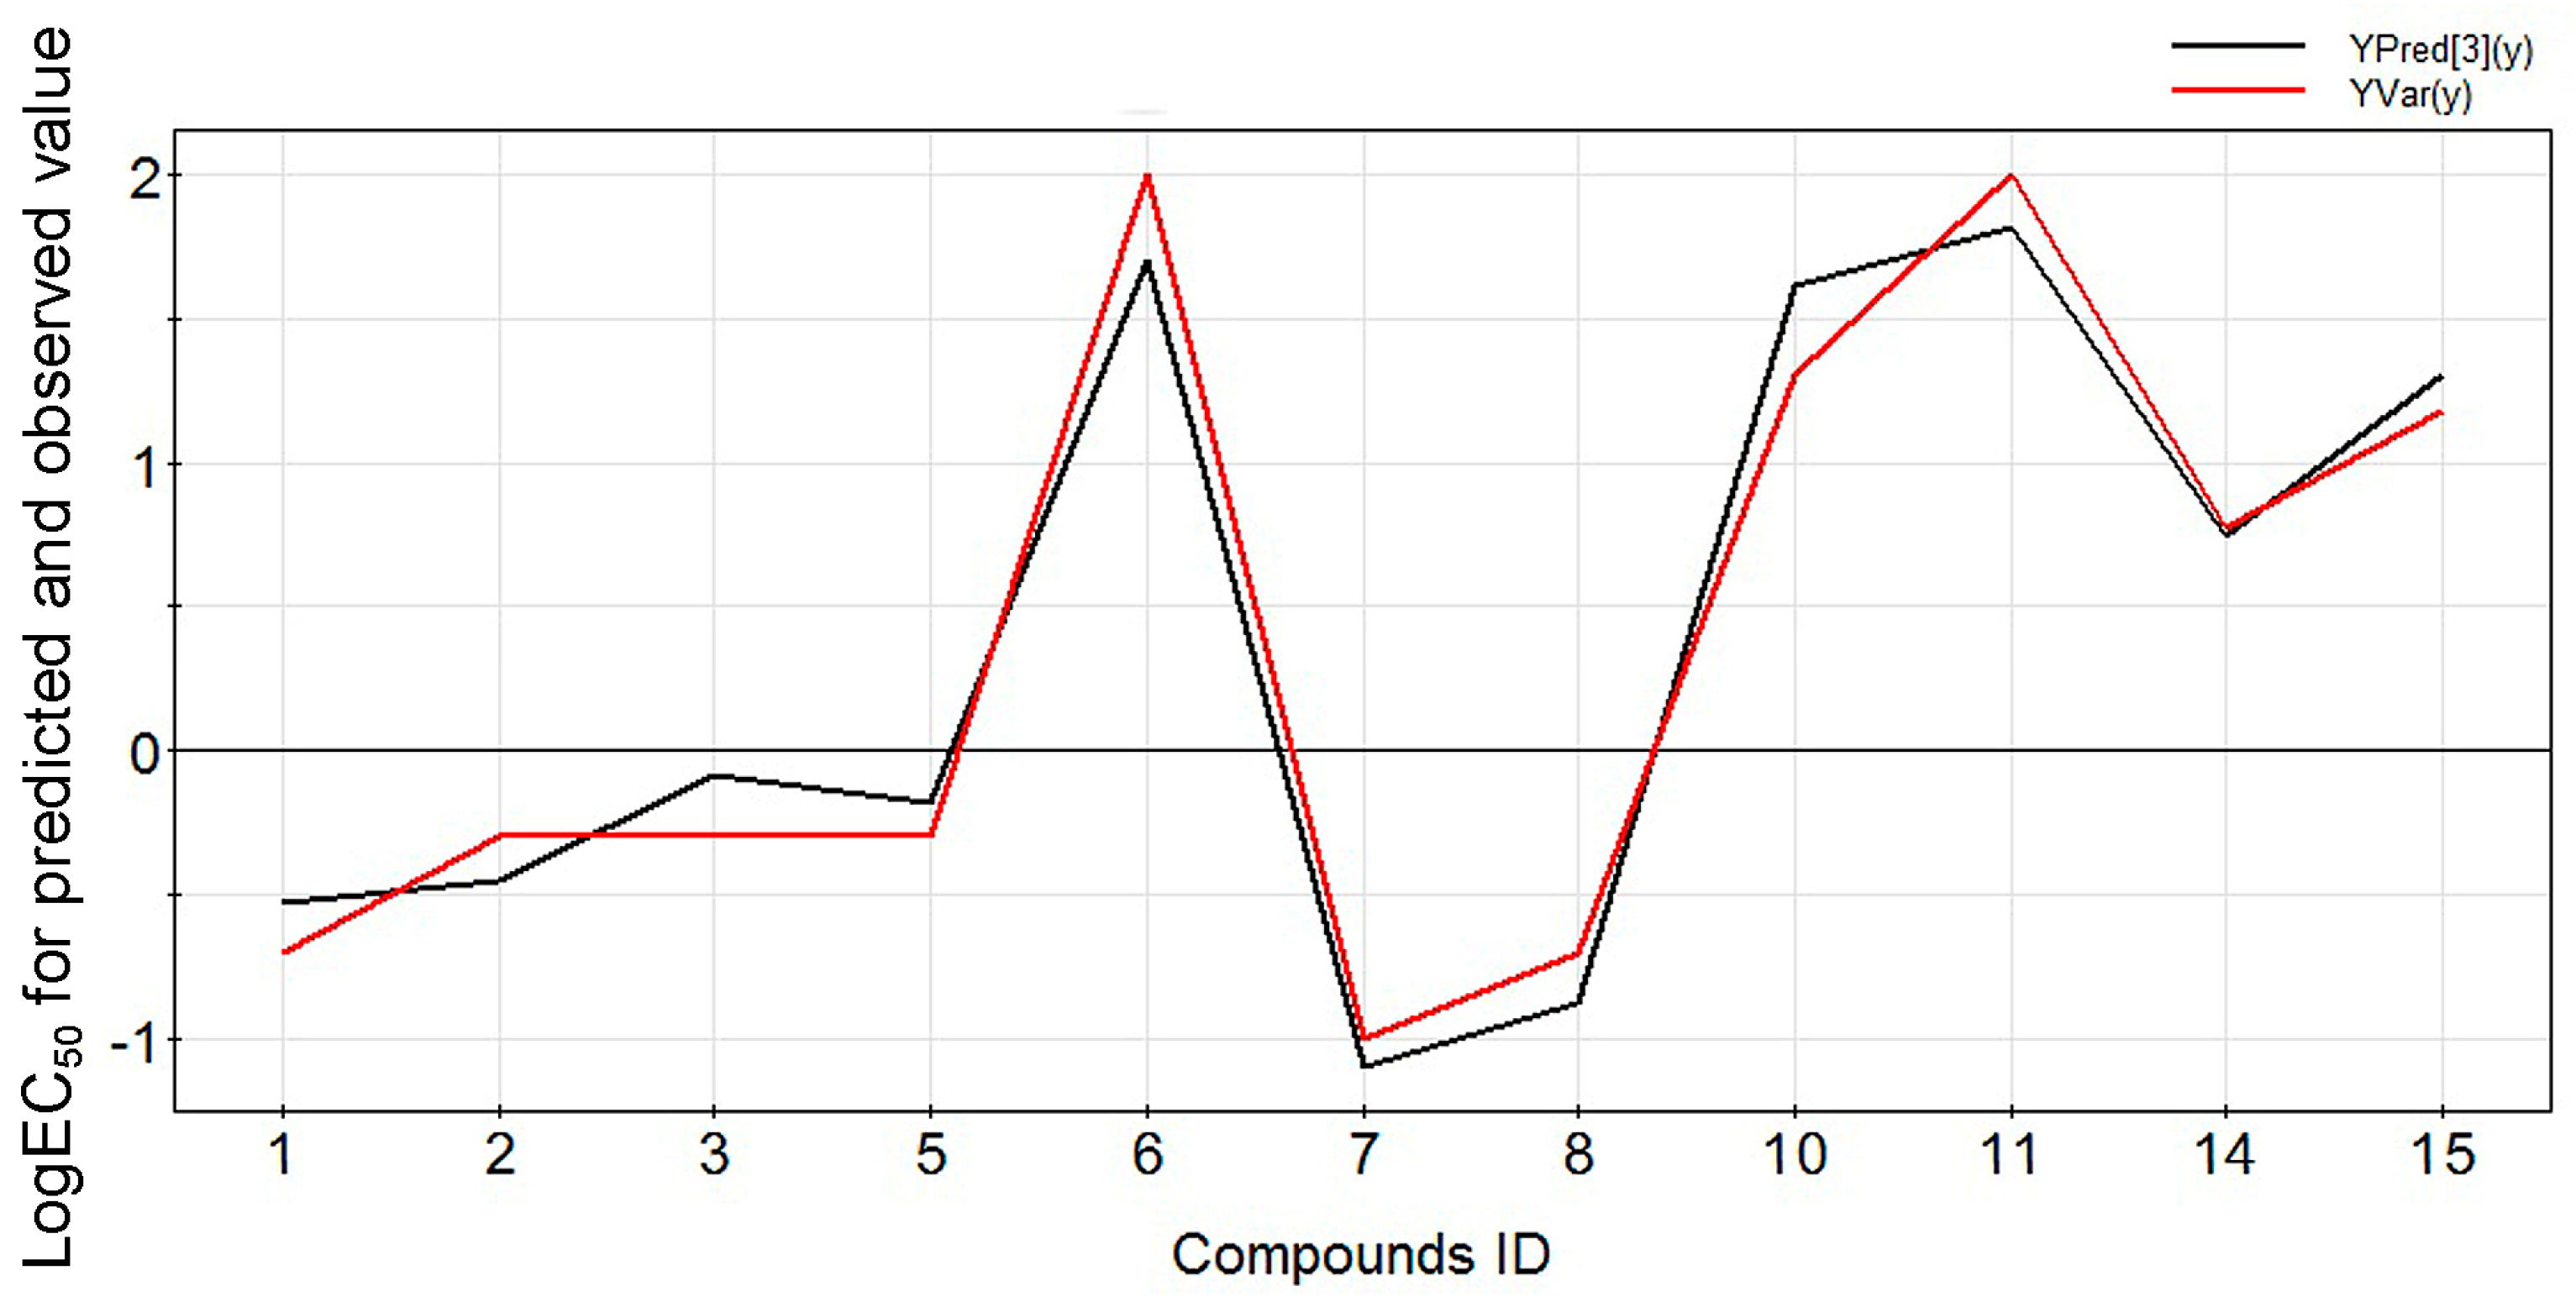
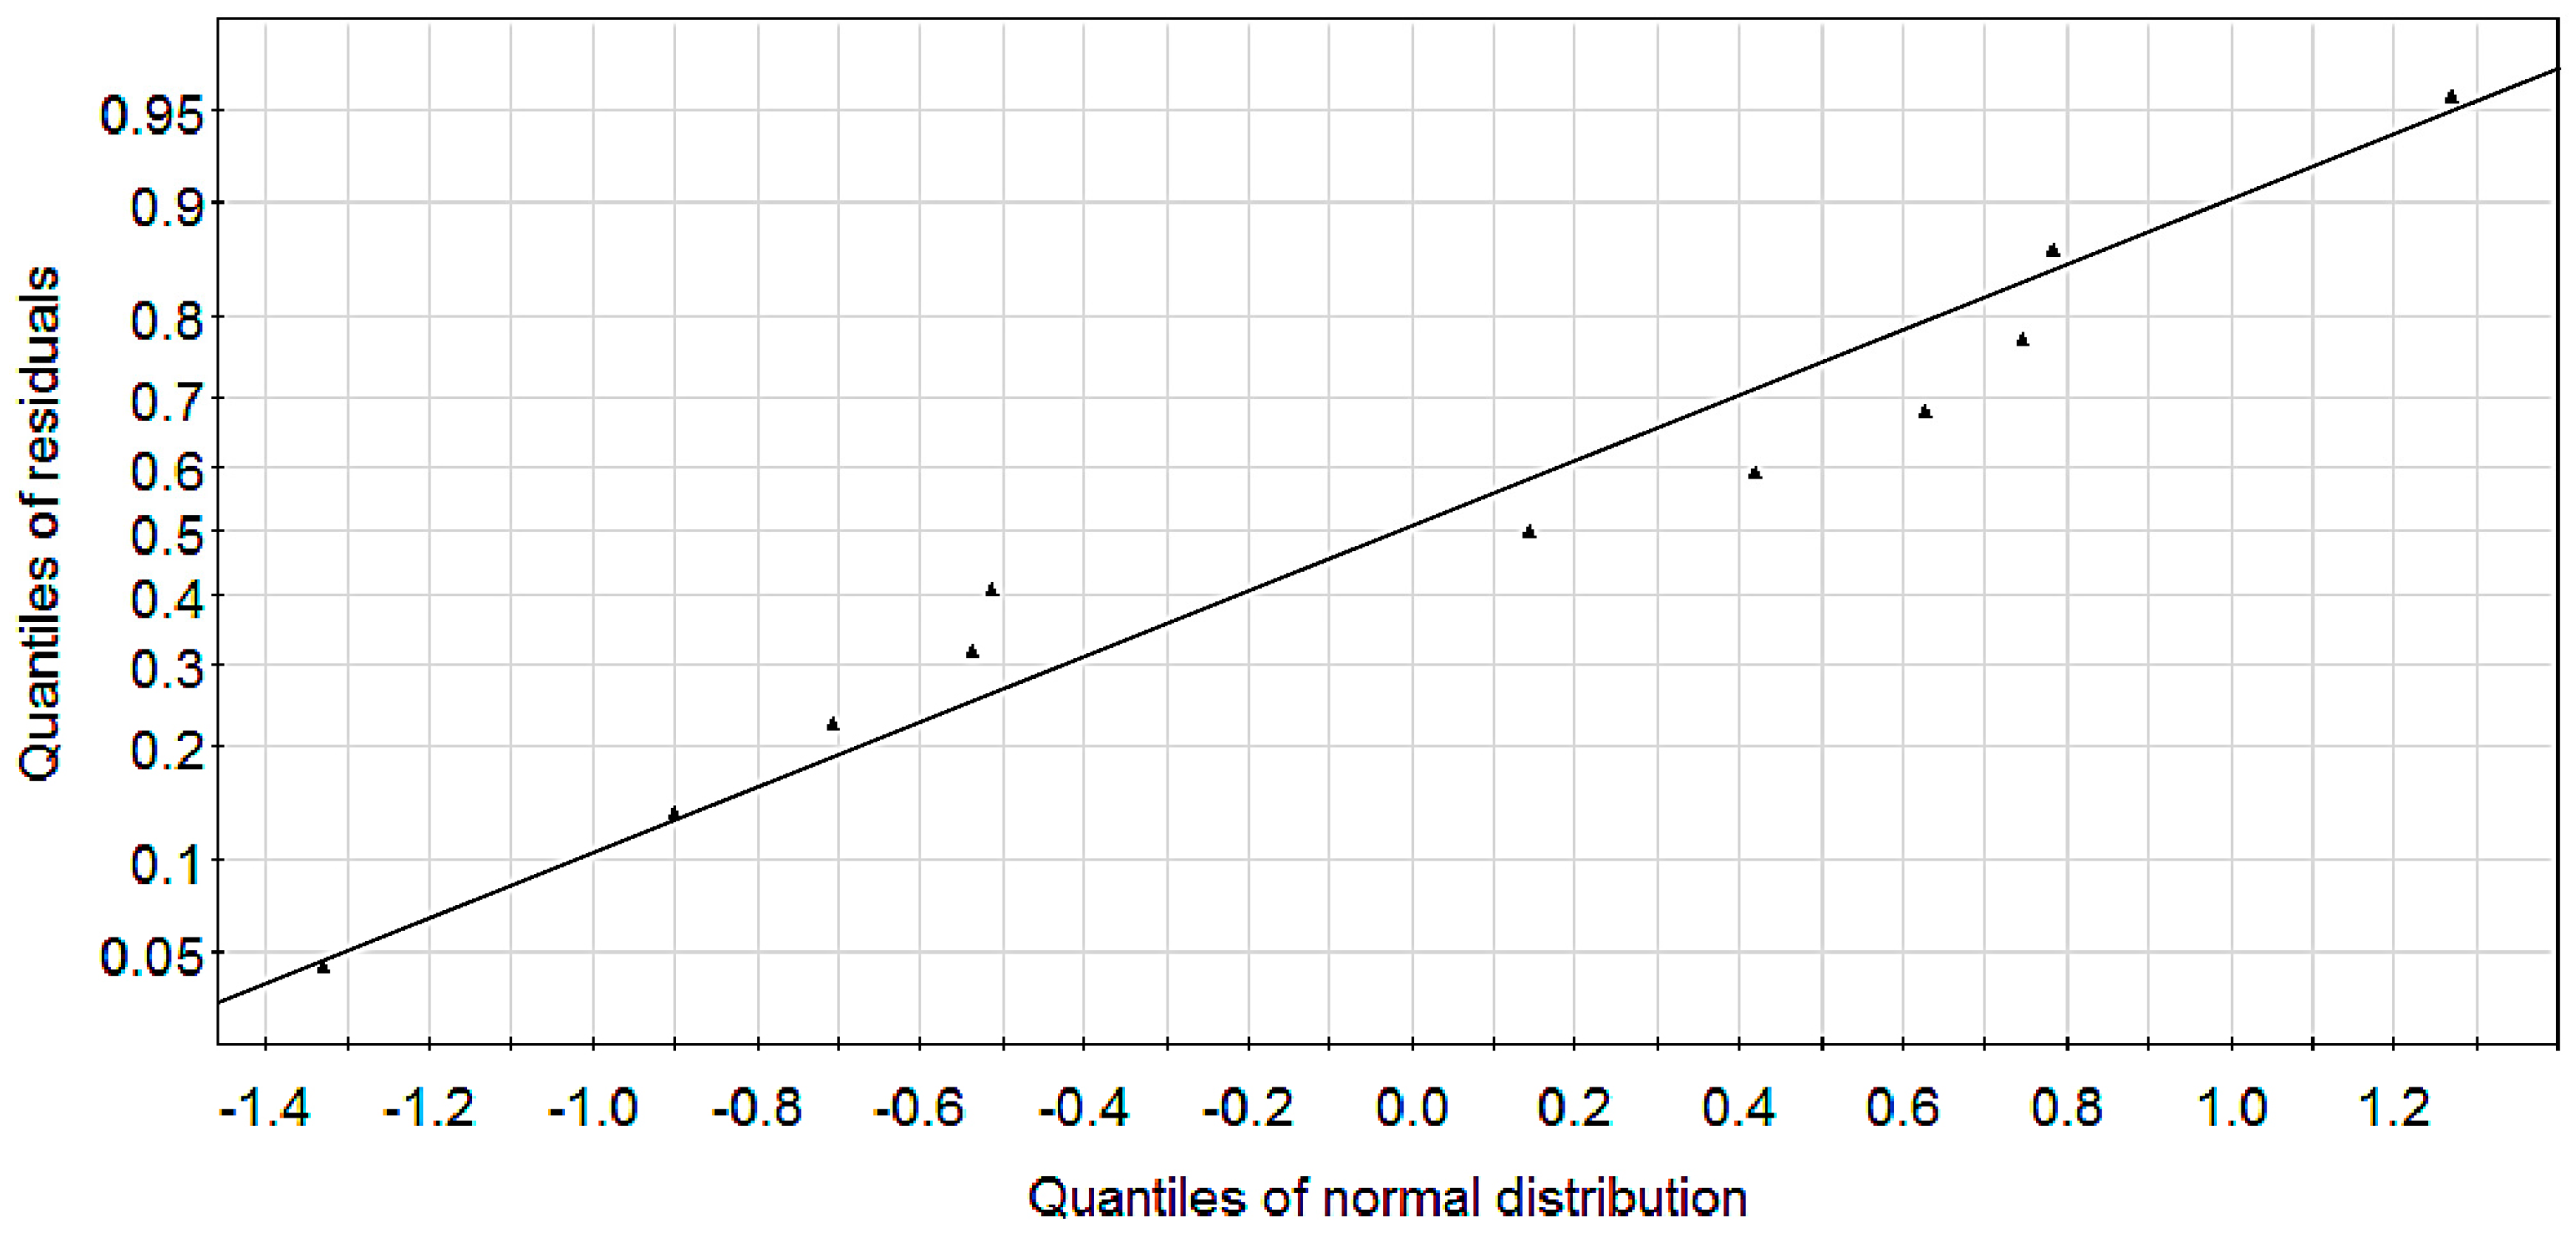
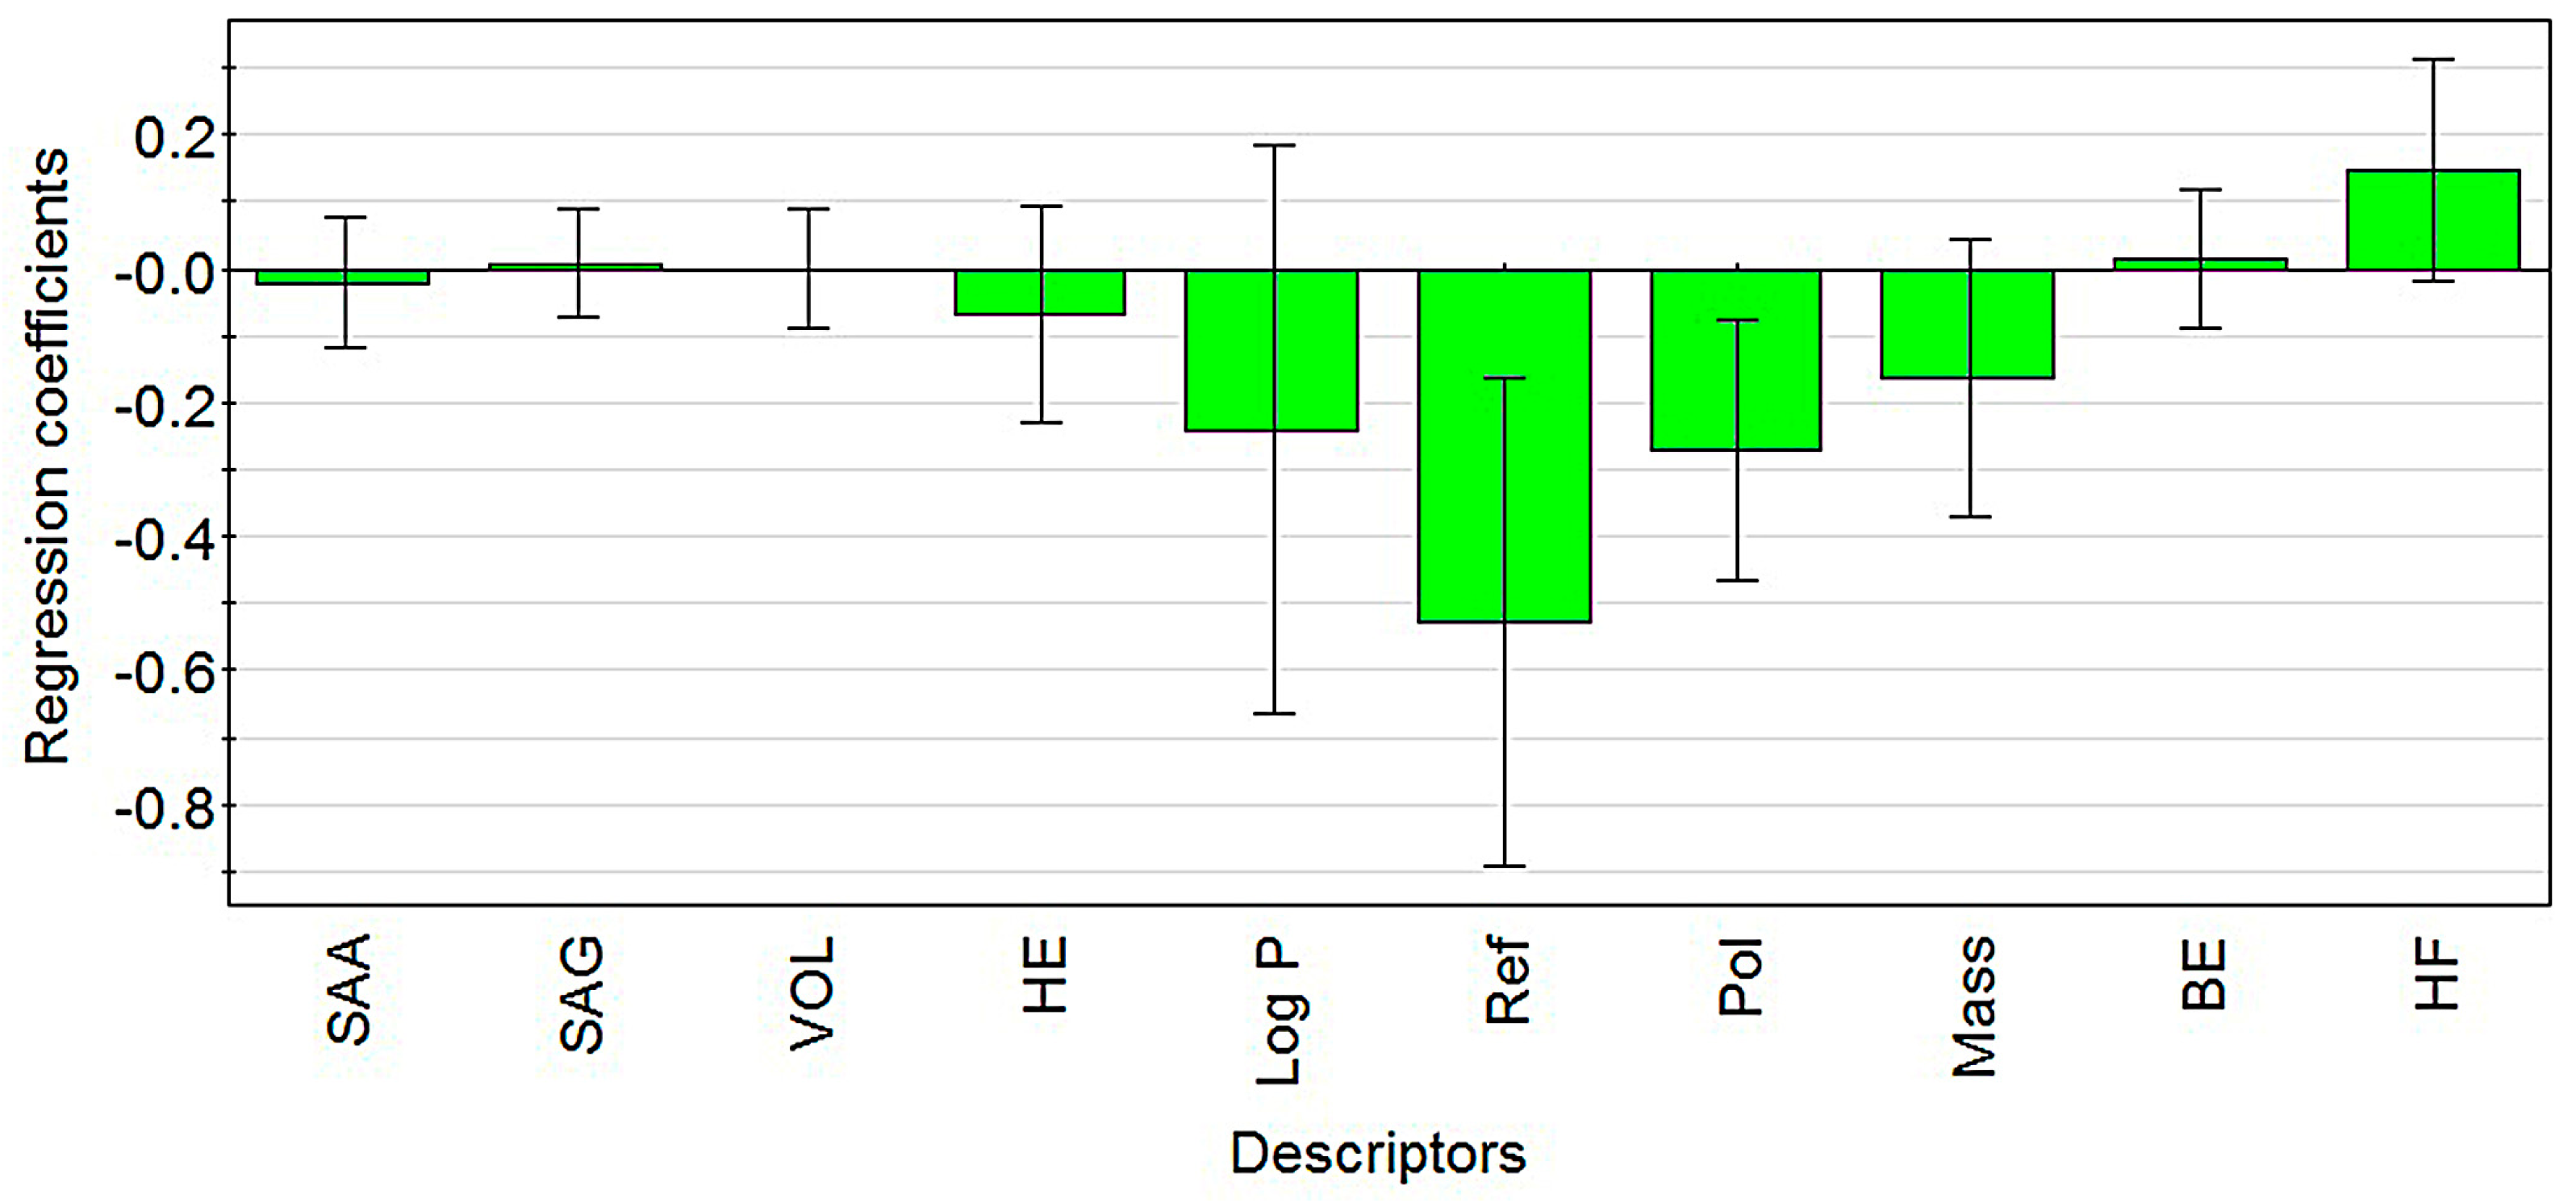
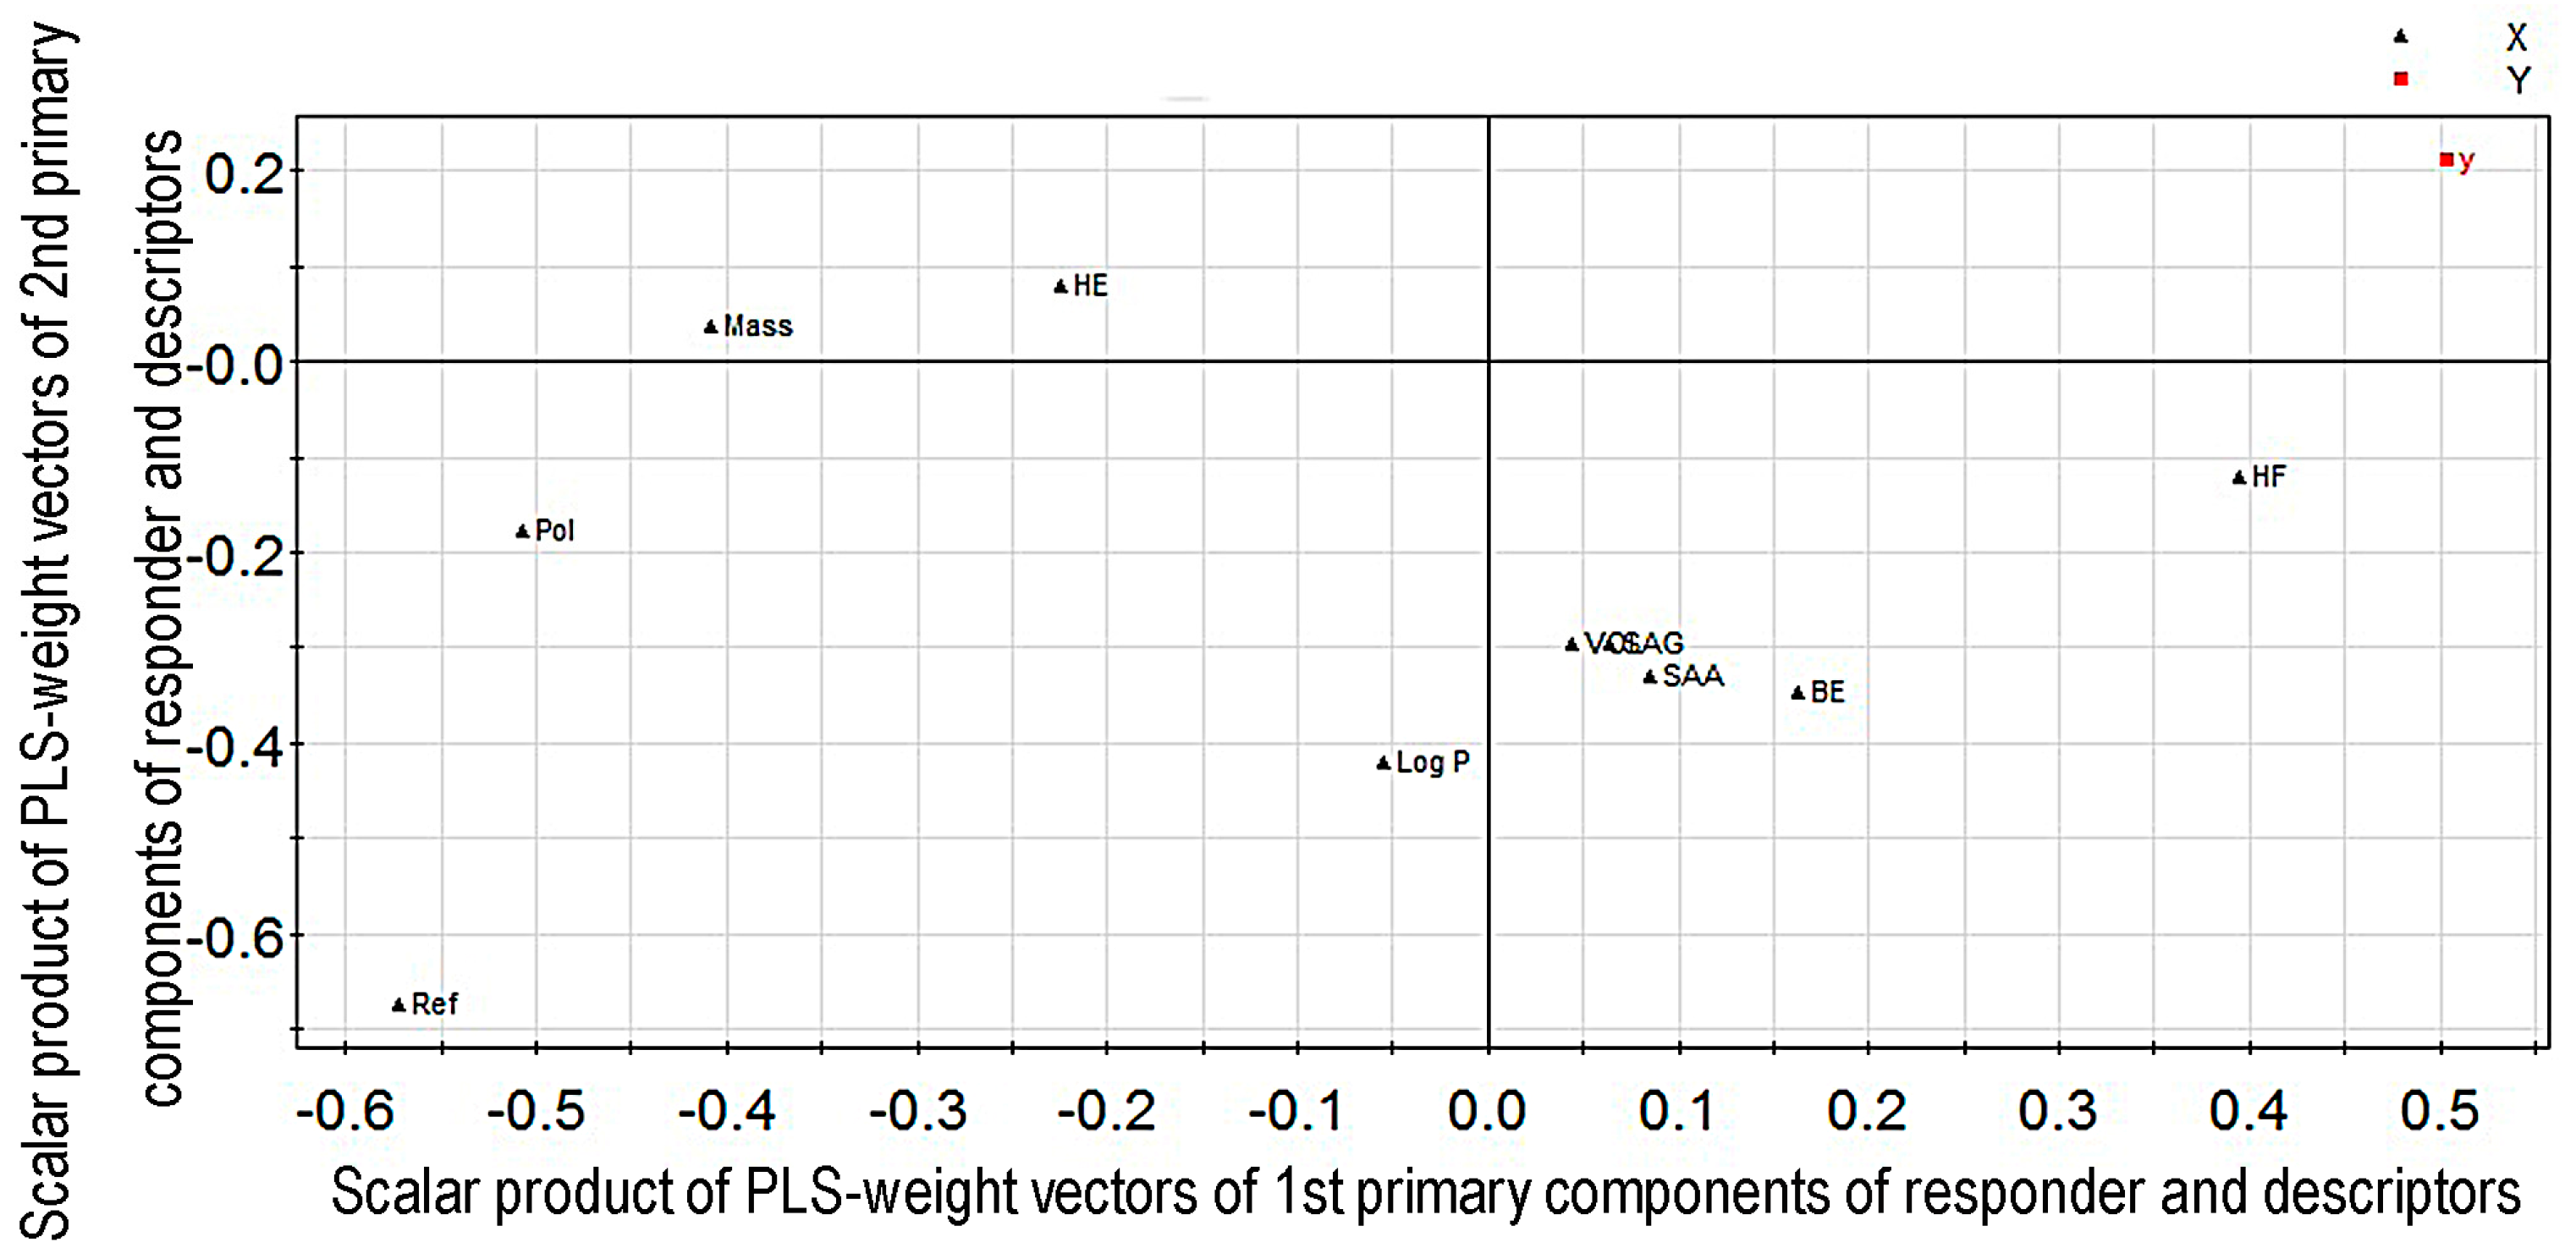
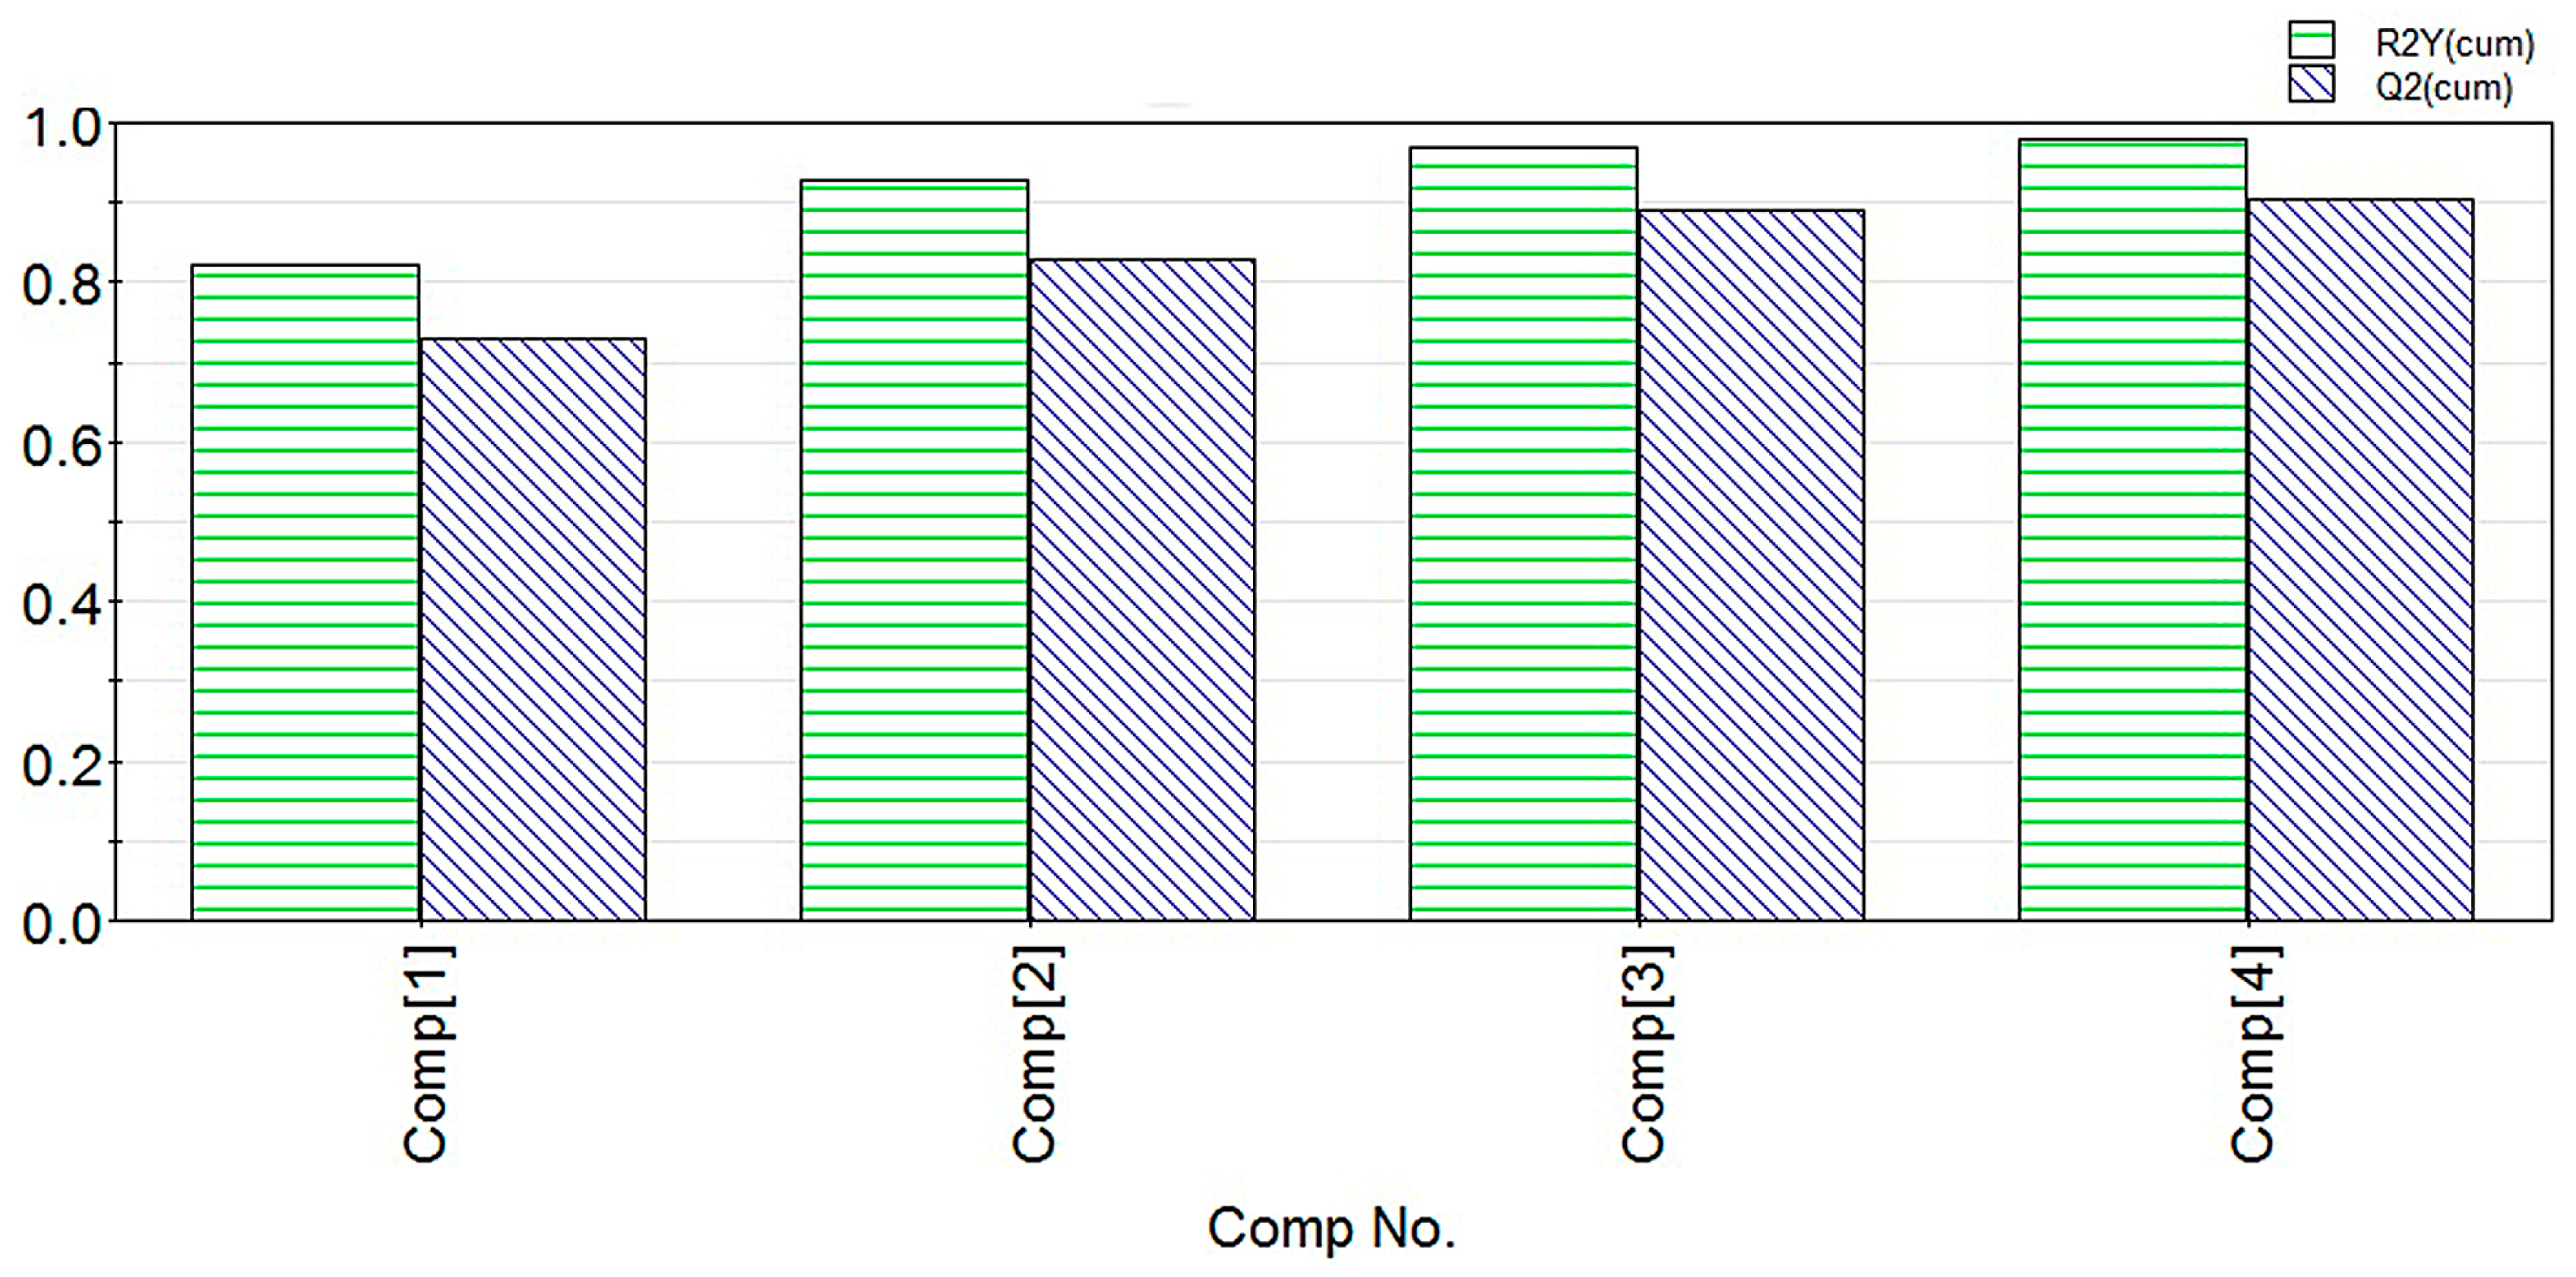
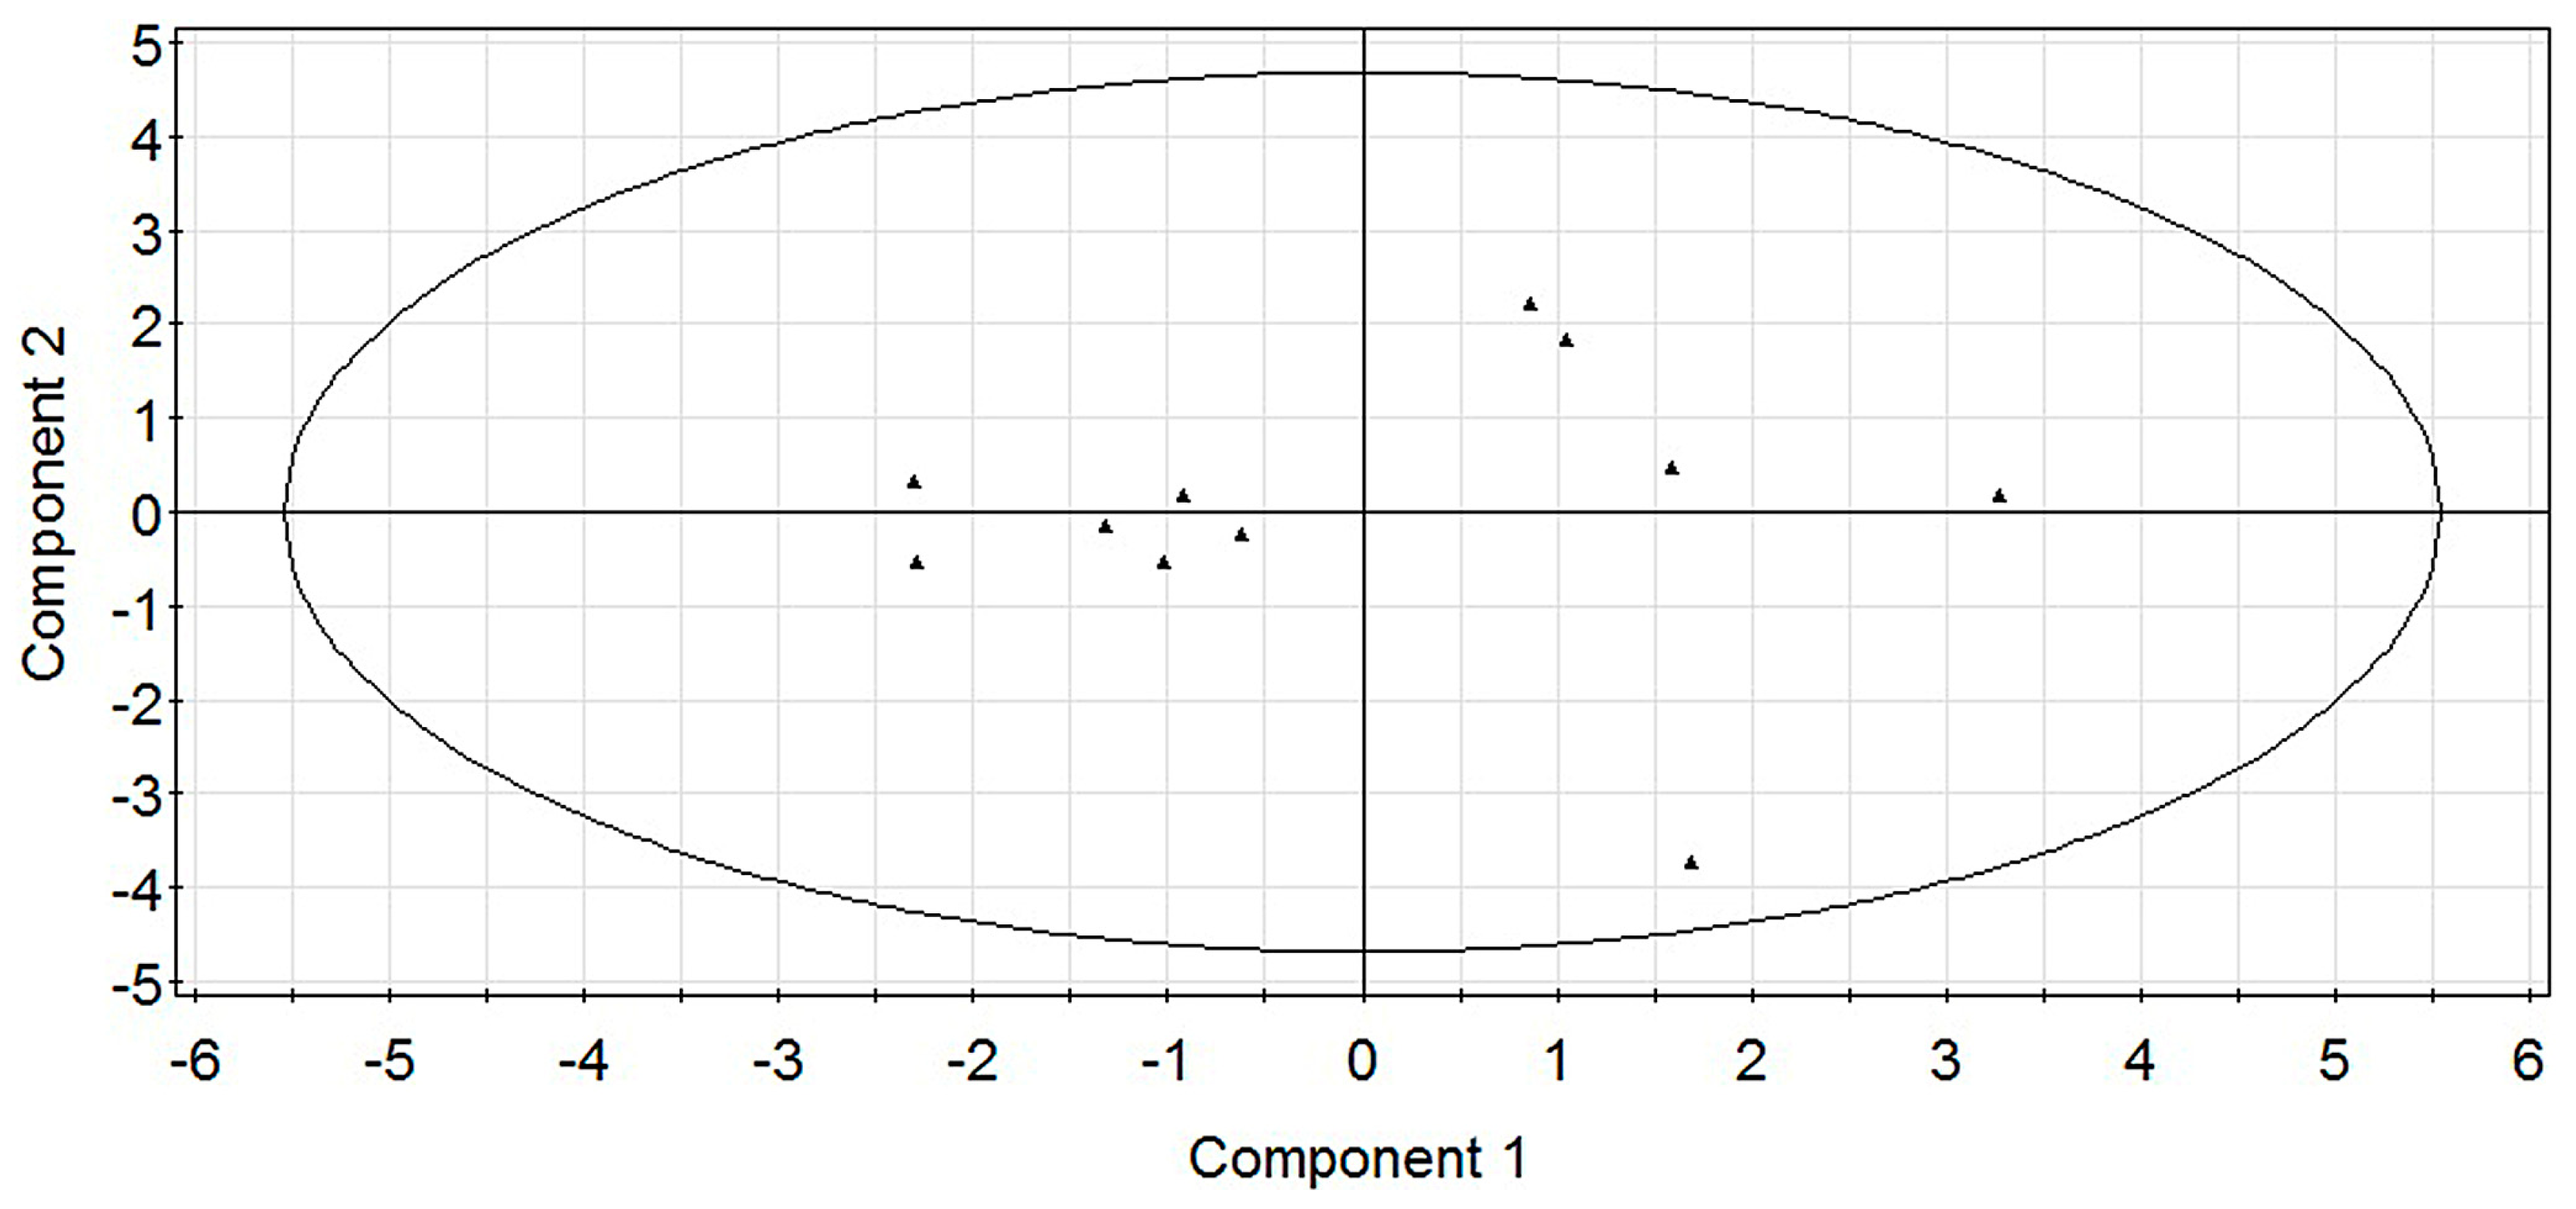
2.1. Modeling
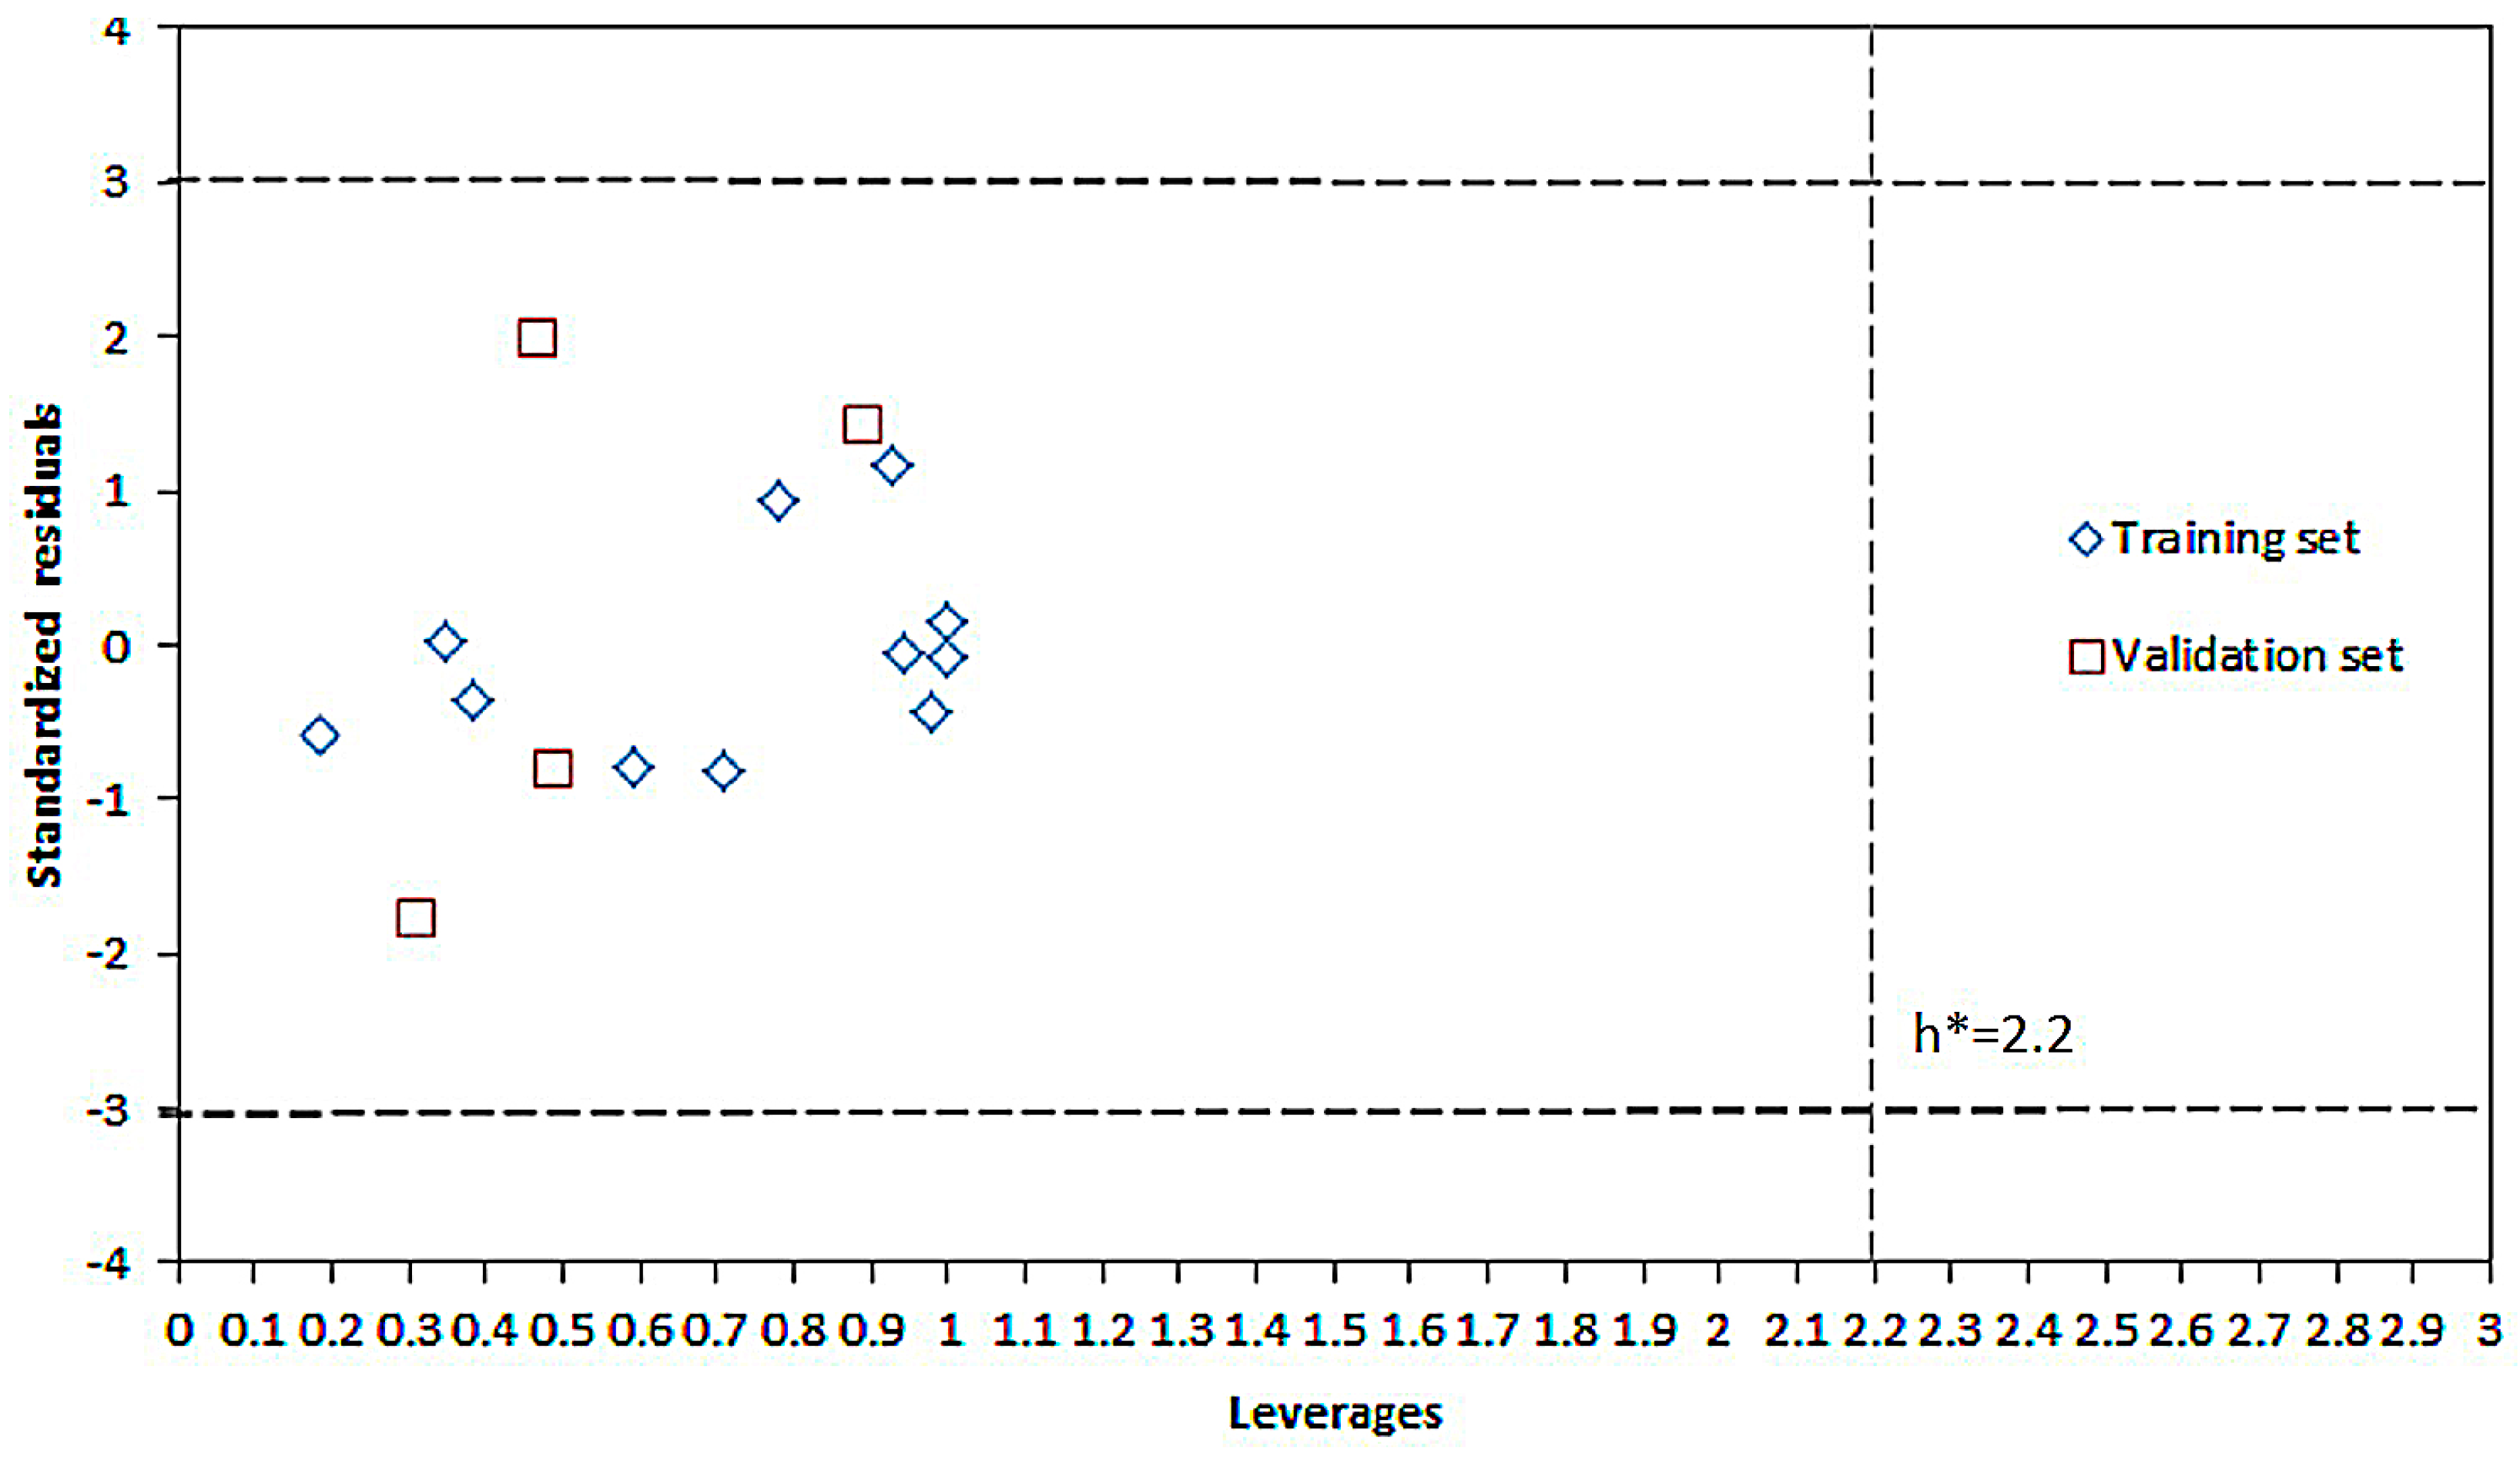
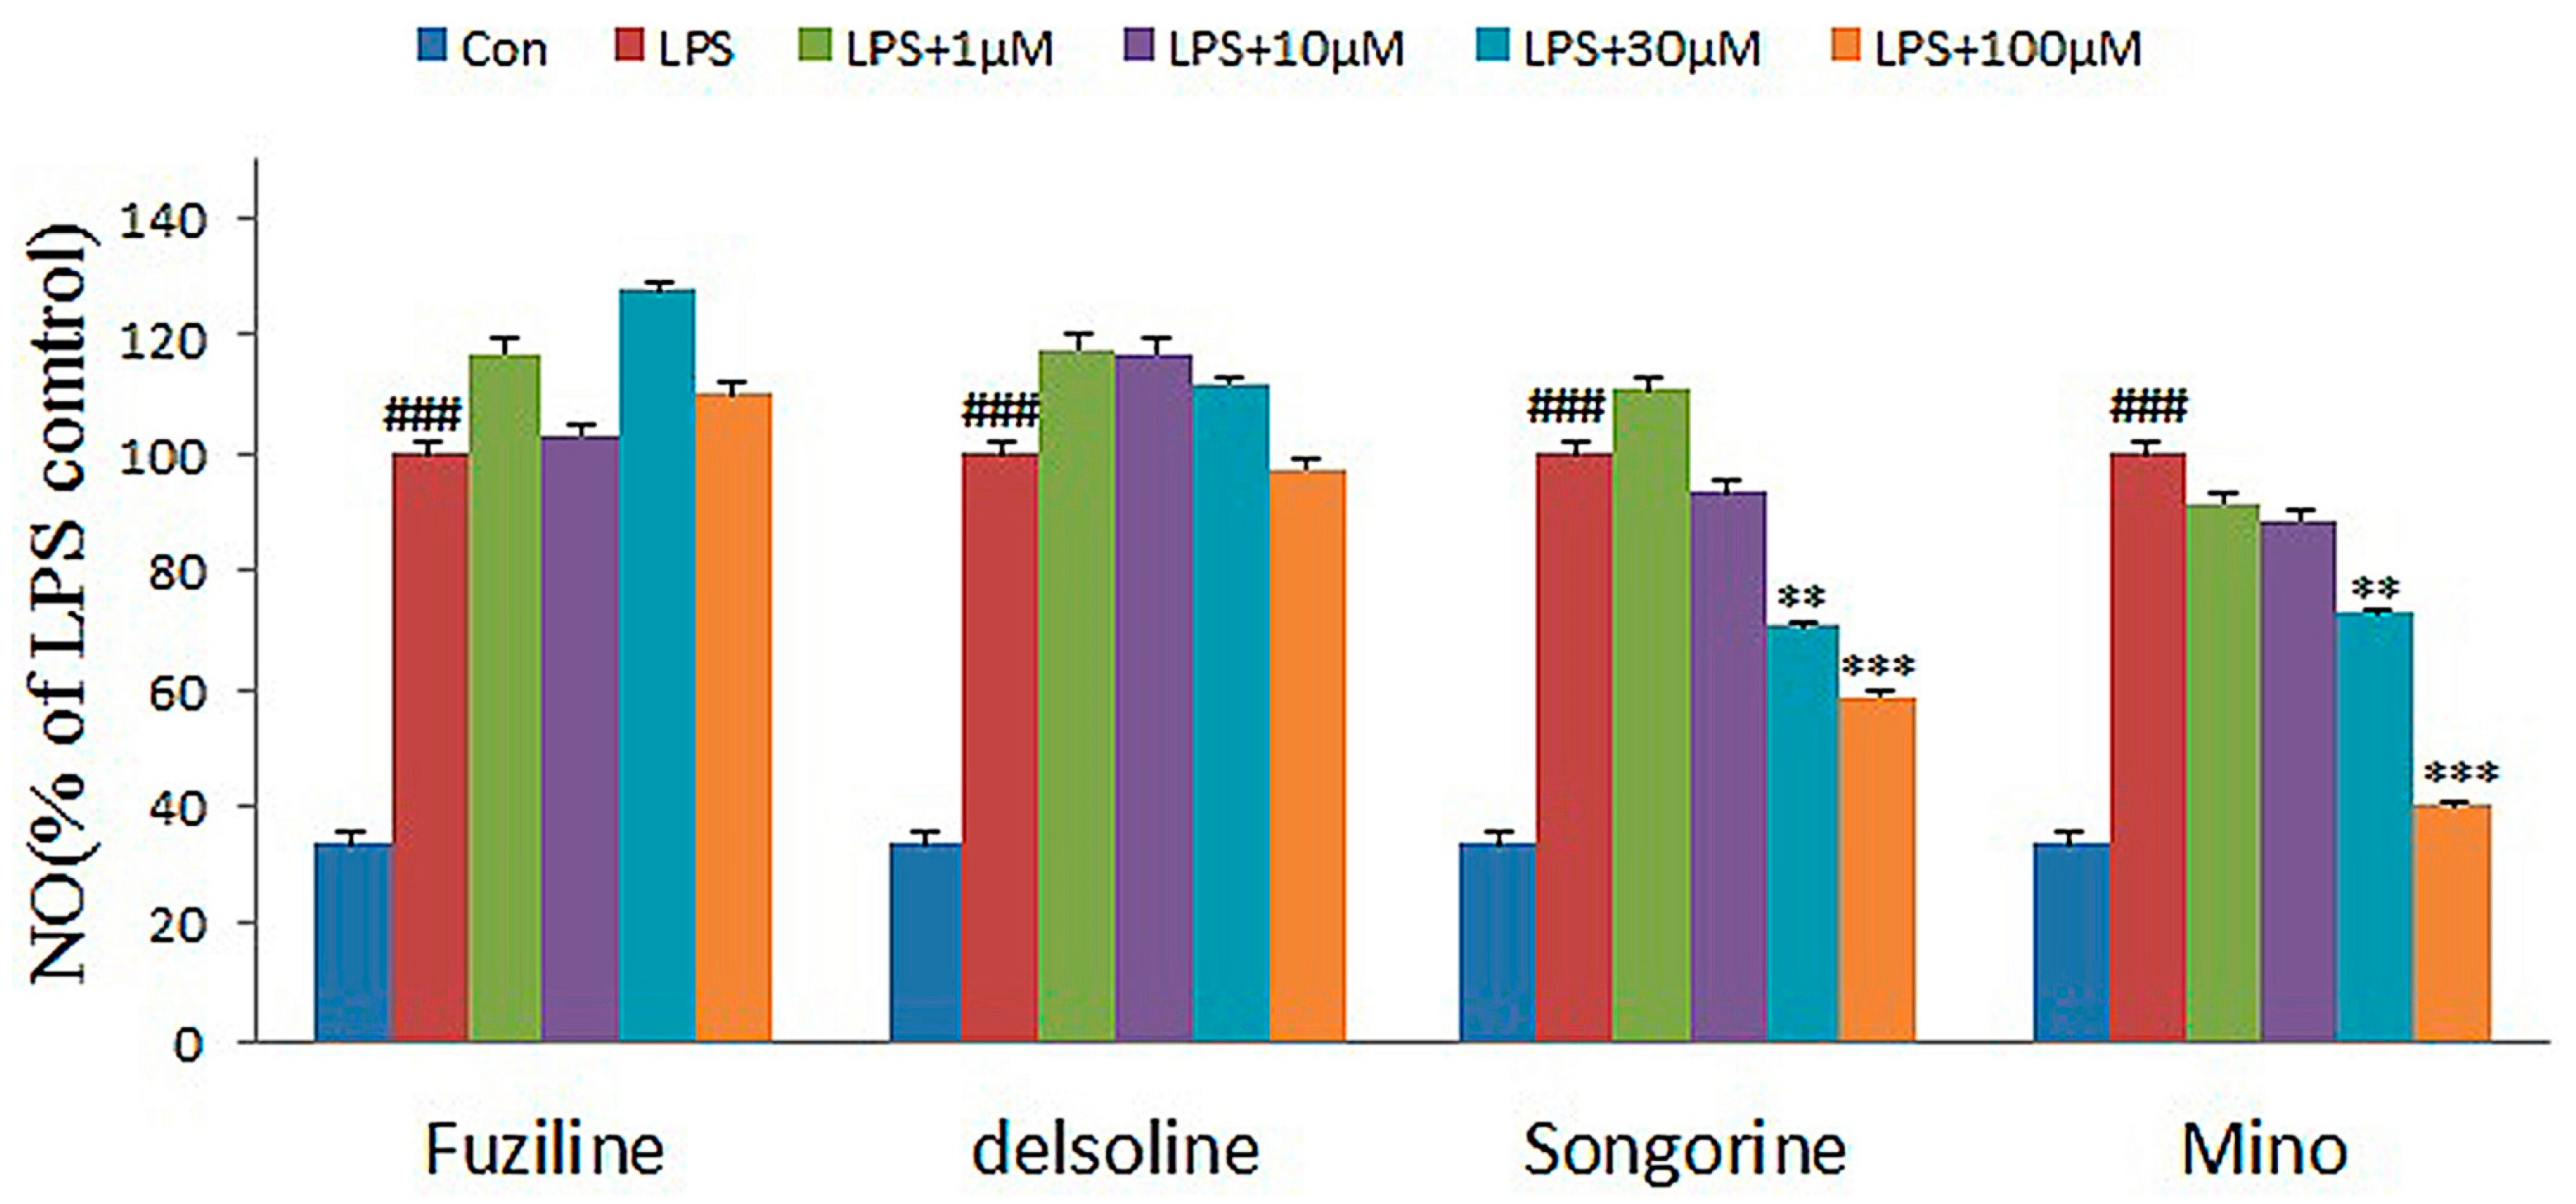
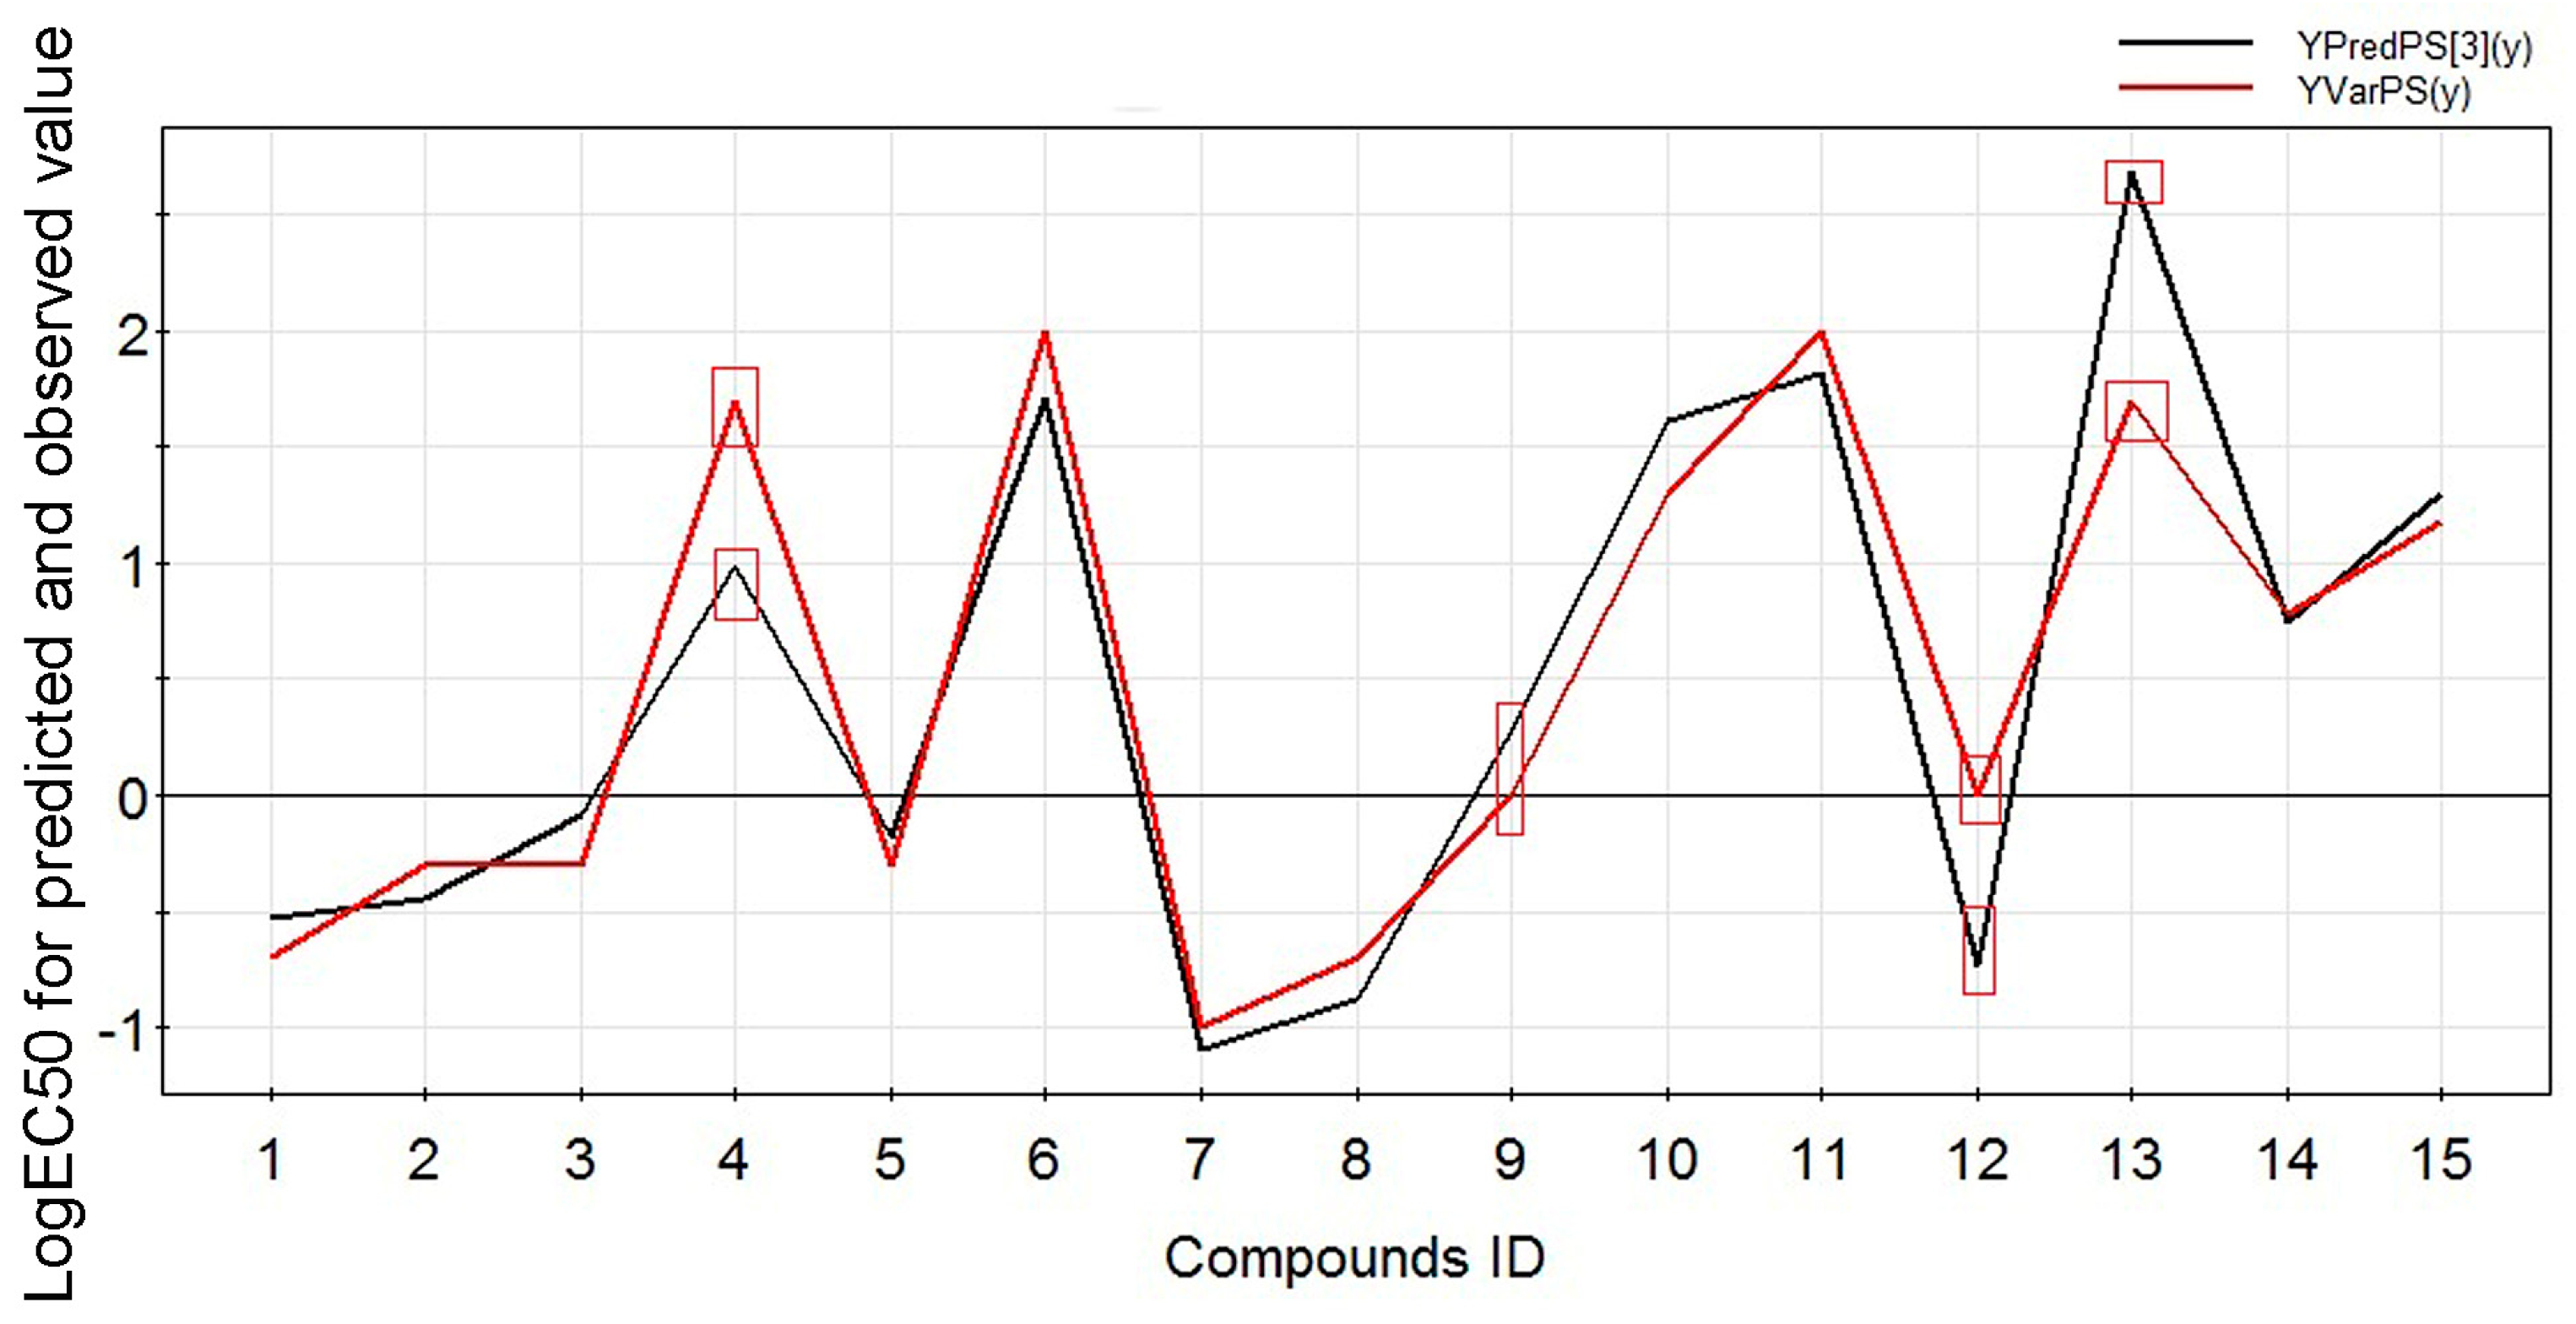
2.2. Experimental Verification for Model Accuracy
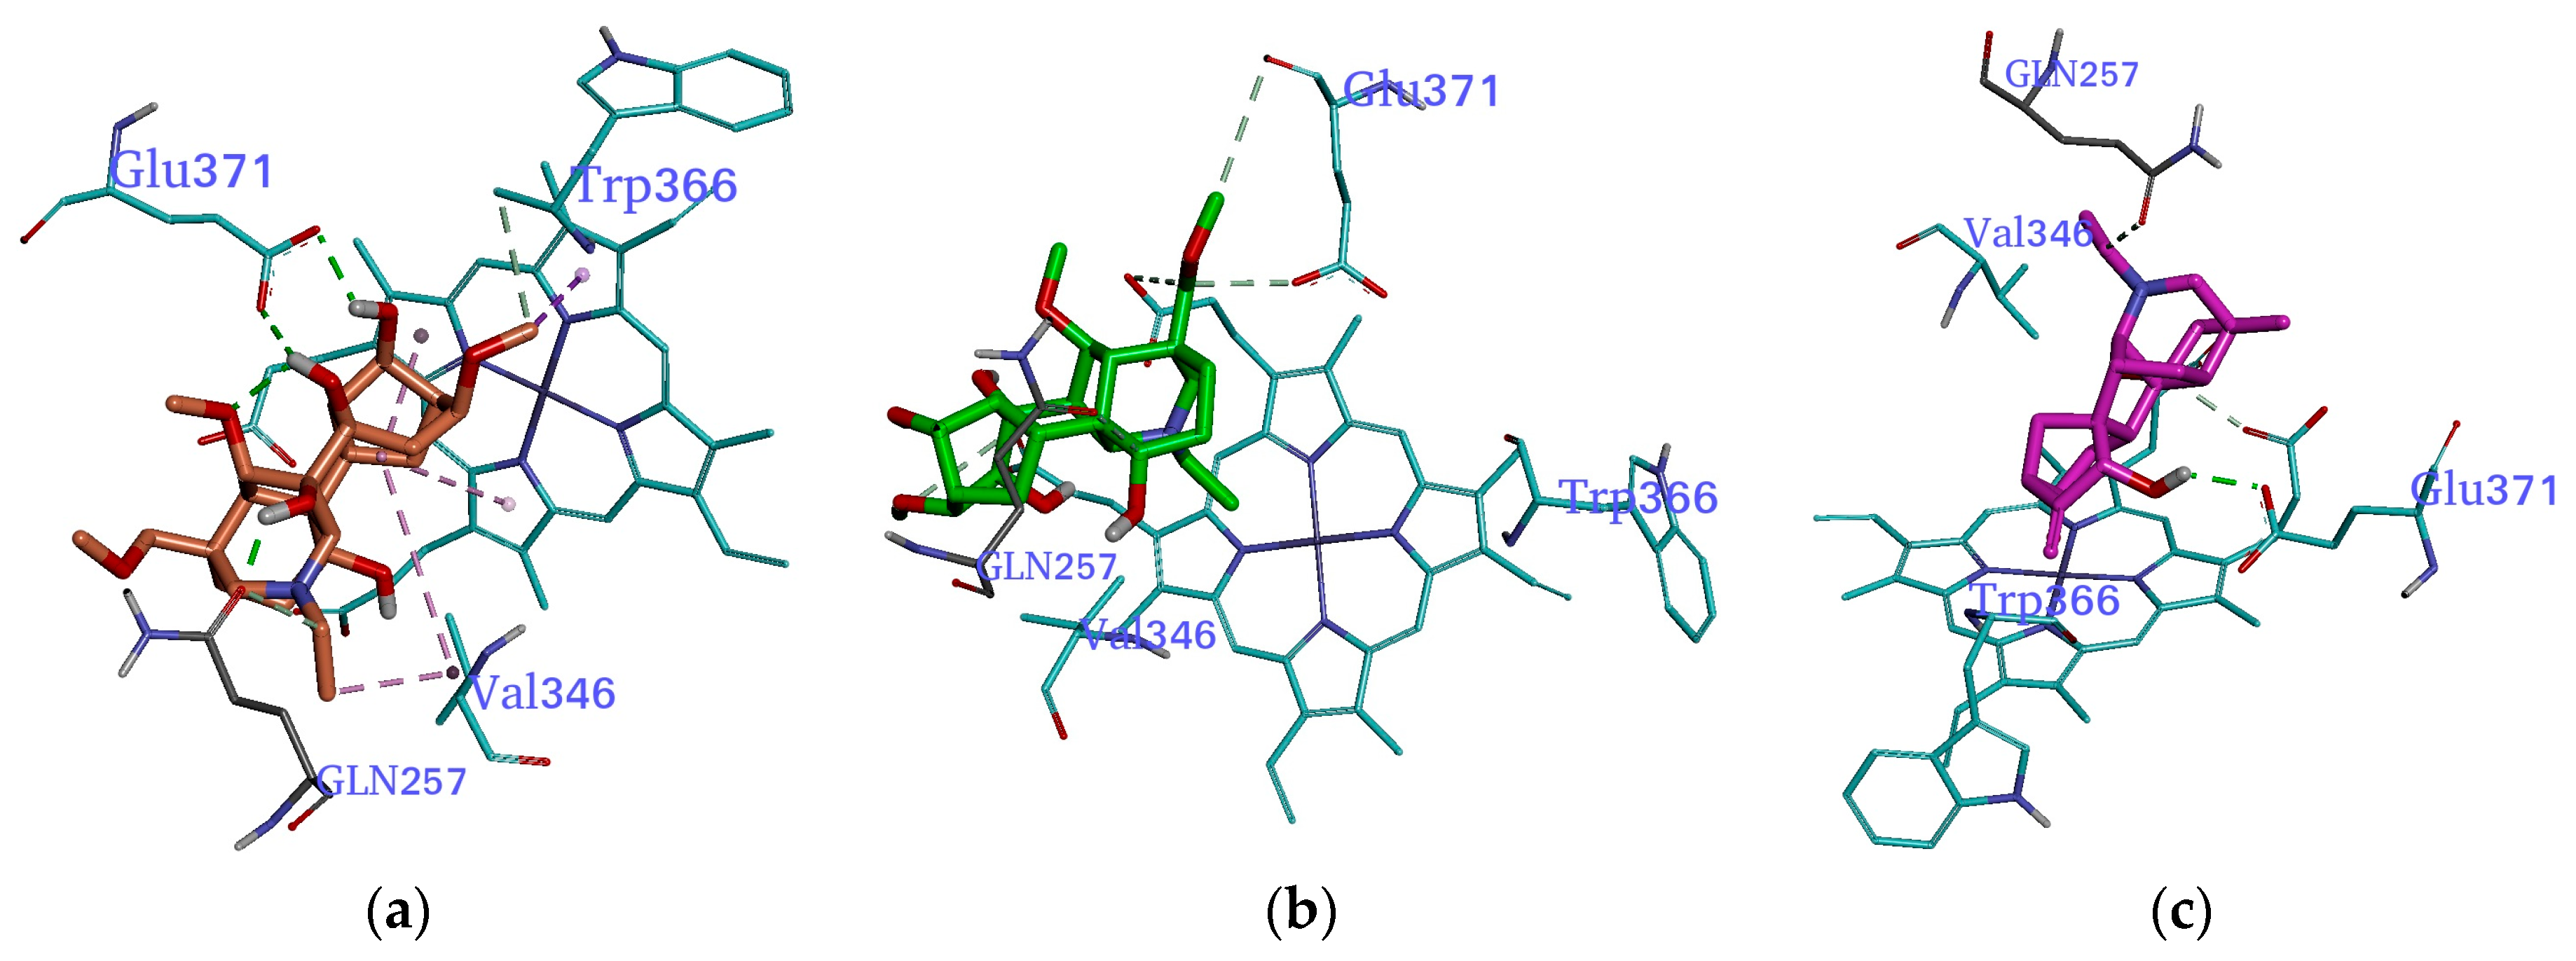
2.3. Molecular Docking
3. Materials and Methods
3.1. Data Description
3.2. Experiments Methods
3.2.1. Cell Culture
3.3.2. Sample Preparation
3.2.3. Measurement of Cell Viability
3.2.4. Nitrite Assay
3.2.5. Anti-Inflammatory Assay in N9 Microglial Cells
- Griess assay inhibitory effects of compounds using N9 microglial cells
- Measurement of cell viability
3.2.6. Molecular Docking
4. Conclusions
Supplementary Materials
Acknowledgments
Author Contributions
Conflicts of Interest
References
- Faridi, B.; Zello, A.; Touati, D.; Alaoui, K.; Cherrah, Y. Toxicite aigue et activite anti-inflammatoire des grains de Delphinium staphysagria. Phytotherapie 2014, 12, 175–180. [Google Scholar] [CrossRef]
- Xu, T.F.; Liu, S.; Meng, L.L.; Pi, Z.F.; Liu, Z.Q. Bioactive heterocyclic alkaloids with diterpene structure isolated from traditional Chinese medicines. J. Chromatogr. B 2016, 1026, 56–66. [Google Scholar] [CrossRef] [PubMed]
- Wang, J.L.; Shen, X.L.; Chen, Q.H.; Wang, W.; Wang, F.P. Structure-nalgesic Activity Relationship Studies on the C18-and C19-Diterpenoid Alkaloids. Chem. Pharm. Bull. 2009, 57, 801–807. [Google Scholar] [CrossRef] [PubMed]
- Liu, F.; Yang, C.H.; Liang, J.Y.; Liu, J.H. Advances in the studies on the pharmacological activities and toxicities of C19 diterpenoid alkaloids. Strait Pharm. J. 2012, 24, 1–5. [Google Scholar] [CrossRef]
- Wu, Z.J.; Yang, C.H.; Ye, W.C.; Liu, J.H. Advances in the studies on the pharmacological activities and toxicities of C20 diterpenoid alkaloids. Prog. Pharm. Sci. 2011, 35, 241–249. [Google Scholar]
- Seema, B.; Mumtaz, A.; Abdul, L.; Waqar, A.; Sultan, A.; Muhammad, N.; Muhammad, Z.; Hassan, K.M.T.; Farzana, S.; Manzoor, A. A Pharmacologically Active C-19 Diterpenoid Alkaloids from the Aerial parts of Aconitum leave Royle. Rec. Nat. Prod. 2014, 8, 83–92. [Google Scholar]
- Hao, D.; Gu, X.J.; Xiao, P.; Xu, L. Recent advances in the chemical and biological studies of Acontium pharmaceutical resources. J. Chin. Pharm. Sci. 2013, 22, 209–221. [Google Scholar] [CrossRef]
- Yu, T.; Lee, Y.J.; Jang, H.J. Anti-inflammatory activity of Sorbus commixta water extract and its molecular inhibitory mechanism. J. Ethnopharmacol. 2011, 134, 493–500. [Google Scholar] [CrossRef] [PubMed]
- Zhou, G.H.; Tang, L.Y.; Zhou, X.D.; Wang, T.; Kou, Z.Z.; Wang, Z.J. A review on phytochemistry and pharmacological activities of the processed lateral root of Aconitum carmichaelli Debeaux. J. Ethnopharmacol. 2015, 160, 173–193. [Google Scholar] [CrossRef] [PubMed]
- Ghasemi, G.; Nirouei, M.; Shariati, S.; Parviz, A.; Zinab, R. A quantitative structure-activity relationship study on HIV-1 integrase inhibitors using genetic algorithm, artificial neural networks and different statistical methods. Arab. J. Chem. 2016, 9, 185–190. [Google Scholar] [CrossRef]
- Zhou, H.; Wong, Y.F. Suppressive Effects of JCICM-6, the Extract of an Anti-arthritic Herbal Formula, on the Experimental In-flammatory and Nociceptive Models in Rodents. Biol. Pharm. Bull. 2006, 29, 253–360. [Google Scholar] [CrossRef] [PubMed]
- Tropsha, A. Best practices for QSAR model development, validation, and exploitation. Mol. Inf. 2010, 29, 476–488. [Google Scholar] [CrossRef] [PubMed]
- Turabekova, M.A.; Rasulev, B.F. A QSAR Toxicity Study of a Series of Alkaloids with the Lycoctonine Skeleton. Molecules 2004, 9, 1194–1207. [Google Scholar] [CrossRef] [PubMed]
- Tropsha, A.; Gramatica, P.; Gombar, V.K. The importance of being earnest: Validation is the absolute essential for successful application and interpretation of QSPR models. QSAR Comb. Sci. 2003, 22, 69–77. [Google Scholar] [CrossRef]
- Abdi, H. Partial least squares regression and projection on latent structure regression (PLS Regression). Wiley Interdiscip Rev. 2010, 2, 97–106. [Google Scholar] [CrossRef]
- Bertrand, M.; Duflo, E.; Mullainathan, S. How much should we trust differences-in-differences estimates. Q. J. Econ. 2004, 119, 249–275. [Google Scholar] [CrossRef]
- Agrawal, R.; Gehrke, J.; Gunopulos, D. Automatic subspace clustering of high dimensional data for data mining applications. ACM SIGMOD Rec. 1998, 27, 94–105. [Google Scholar] [CrossRef]
- Wold, S.; Sjostrom, M.; Eriksson, L. PLS-regression: A basic tool of chemometrics. Chemometr. Intell. Lab. Syst. 2001, 58, 109–130. [Google Scholar] [CrossRef]
- Khlebnikov, A.I.; Schepetkin, I.A.; Domina, N. Improved quantitative structure-activity relationship models to predict antioxidant activity of flavonoids in chemical, enzymatic, and cellular systems. Bioorg. Med. Chem. 2007, 15, 1749–1770. [Google Scholar] [CrossRef] [PubMed]
- Devillers, J.; Chezeau, A.; Thybaud, E. PLS-QSAR of the adult and developmental toxicity of chemicals to Hydra attenuate. SAR QSAR Environ. Res. 2002, 13, 705–712. [Google Scholar] [CrossRef] [PubMed]
- Gramatica, P. Principles of QSAR models validation: Internal and external. QSAR Comb. Sci. 2007, 26, 694–701. [Google Scholar] [CrossRef]
- Jagiello, K.; Sosnowska, A.; Walker, S.; Haranczyk, M.; Gajewicz, A.; Kawai, T.; Suzuki, N.; Leszezynski, J.; Puzyn, T. Direct QSPR: The most efficient way of predicting organic carbon/water partition coefficient (log Koc) for polyhalogenated POPs. Struct. Chem. 2014, 25, 997–1004. [Google Scholar] [CrossRef]
- Lu, S.Y.; Jiang, Y.J.; Lv, J.; Wu, T.X.; Yu, Q.S.; Zhu, W.L. Molecular docking and molecular dynamics simulation studies of GPR40 receptor-agonist interactions. J. Mol. Graph. Model. 2010, 28, 766–774. [Google Scholar] [CrossRef] [PubMed]
- Sun, M.; Wu, C.; Fu, Q.; Di, D.; Kuang, X.; Wang, C.; He, Z.; Wang, J.; Sun, J. Solvent-shift strategy to identify suitable polymers to inhibit humidity-induced solid-state crystallization of lacidipine amorphous solid dispersions. Int. J. Pharm. 2016, 503, 238–246. [Google Scholar] [CrossRef] [PubMed]
- Lin, L.Y.; Chen, Q.H.; Wang, F.P. Advances in pharmacological activities of norditerpenoid alkaloids. West China J. Pharm. Sci. 2004, 19, 200–205. [Google Scholar]
- Hikino, H.; Konno, C.; Takata, H.; Yamada, Y.; Ohizuni, Y.; Sugio, K.; Fujimura, H. Anti-inflammatory principles of Aconitum roots. J. Pharmacobioldyn. 1980, 3, 514–525. [Google Scholar] [CrossRef]
- Jagiello, K.; Sosnowska, A.; Kar, S.; Demkowicz, S.; Dasko, M.; Leszczynski, J.; Rachon, J.; Puzyn, T. Geometry optimization of steroid sulfatase inhibitors-the influence on the free binding energy with STS. Struct. Chem. 2017. [CrossRef]
- Li, Z.J.; Sun, Y.Z.; Yan, X.L.; Meng, F.H. Study on QSTR of benzoic acid compounds with MCI. Int. J. Mol. Sci. 2010, 11, 1228–1235. [Google Scholar] [CrossRef] [PubMed]
- Kar, S.; Harding, A.P.; Roy, K. QSAR with quantum topological molecular similarity indices: Toxicity of aromatic aldehydes to Tetrahymena pyriformis. SAR QSAR Environ. Res. 2010, 21, 149–168. [Google Scholar] [CrossRef] [PubMed]
- Yi, Z.S.; Zhang, A.Q. A QSAR Study of Environmental Estrogens Based on a Novel Variable Selection Method. Molecules 2012, 17, 6126–6145. [Google Scholar]
- Eriksson, L.; Jaworska, J.; Worth, A.P.; Cronin, M.T.D.; McDowell, R.M.; Gramatica, P. Methods for reliability and uncertainty assessment and for applicability evaluations of classification-and regression-based QSARs. Environ. Health Perspect. 2003, 111, 1361–1375. [Google Scholar]
- Dearden, J.C.; Cronin, M.T.; Kaiser, K.L. How not to develop a quantitative structure-activity or structure-property relationship (QSAR/QSPR). SAR QSAR Environ. Res. 2009, 20, 241–266. [Google Scholar] [CrossRef] [PubMed]
- Consonni, V.; Ballabio, D.; Todeschini, R. Comments on the definition of the Q2 parameter for QSAR validation. J. Chem. Inf. Comput. Sci. 2009, 49, 1669–1678. [Google Scholar] [CrossRef] [PubMed]
- Mitra, I.; Roy, P.P.; Kar, S.; Ojha, P.K.; Roy, K. On further application of R2 m as a metric for validation of QSAR model. J. Chemometr. 2010, 24, 22–33. [Google Scholar] [CrossRef]
- Li, N.; Wang, Y.; Li, X.Z.; Zhang, H.; Zhou, D.; Wang, W.L.; Zhang, X.G.; Li, X.Y.; Hou, Y.; Meng, D.L. Bioactive phenols as potential neuroinflammation inhibitors from the leaves of Xanthoceras sorbifolia Bunge. Bioorg. Med. Chem. 2016, 26, 5018–5023. [Google Scholar]
- Hou, Y.; Li, N.; Xie, G.B.; Wang, J.; Yuan, Q.; Jia, C.C.; Liu, X.; Li, G.X.; Tang, Y.Z.; Wang, B. Pterostilbene exerts anti-neuro inflammatory effect on lipopolysaccharide-activated microglia via inhibition of MAPK signalling pathways. J. Funct. Foods 2015, 19, 676–687. [Google Scholar]
- Li, N.; Meng, D.; Pan, Y.; Cui, Q.L.; Li, G.X.; Ni, H.; Sun, Y.; Qing, D.G.; Jia, X.G.; Pan, Y.N.; Hou, Y. Anti-neuroinflammatory and NQO1 inducing activity of natural phytochemicals from Coreopsis tinctoria. J. Funct. Foods 2015, 17, 837–846. [Google Scholar]
- Zhou, D.; Li, N.; Zhang, Y.H.; Yan, C.Y.; Jiao, K.; Sun, Y.; Lin, B.; Hou, Y. Biotransformation of neuro-inflammation inhibitor Kellerin by Angelica sinensis (Oliv.) Diels callus. RSC Adv. 2016, 6, 97302–97312. [Google Scholar] [CrossRef]
- Li, N.; Ma, Z.J.; Li, M.J.; Xing, Y.C.; Hou, Y. Natural potential therapeutic agents of neurodegenerative diseases from the traditional herbal medicine Chinese Dragon’s Blood. J. Ethnopharmacol. 2014, 152, 508–521. [Google Scholar]
- Trott, O.; Olson, A.J. AutoDock Vina: Improving the speed and accuracy of docking with a new scoring function, efficient optimization, and multithreading. J. Comput. Chem. 2010, 31, 455–461. [Google Scholar] [CrossRef] [PubMed]
- Santos-Martins, D.; Forli, S.; Ramos, M.J.; Olson, A.J. AutoDock 4 (Zn): An improved AutoDock force field for small-molecule docking to zinc metalloproteins. J. Chem. Inf. Model. 2014, 54, 2371–2379. [Google Scholar] [CrossRef] [PubMed]
- Graedler, U.; Fuchss, T.; Ulrich, W.R.; Boer, R.; Strub, A.; Hesslinger, C.; Anezo, C.; Diederichs, K.; Zaliani, A. Novel nanomolar imidazo[4,5-b]pyridines as selective nitric oxide synthase (iNOS) inhibitors: SAR and structural insights. Bioorg. Med. Chem. Lett. 2011, 21, 4228–4232. [Google Scholar] [CrossRef] [PubMed]
- Dehghanian, F.; Kay, M.; Kahrizi, D. A novel recombinant AzrC protein proposed by molecular docking and in silico analyses to improve azo dye’s binding affinity. Gene 2015, 569, 233–238. [Google Scholar] [CrossRef] [PubMed]
- Queiroz, A.C.; Lira, D.P.; Dias, T.L. The antinociceptive and anti-inflammatory activities of Piptadenia stipulacea Benth. (Fabaceae). J. Ethnopharmacol. 2010, 128, 377–383. [Google Scholar] [CrossRef] [PubMed]
- Sun, H.; Xia, M.; Austin, C.P. Paradigm shift in toxicity testing and modeling. AAPS J. 2012, 14, 473–480. [Google Scholar] [CrossRef] [PubMed]
- Sample Availability: Not available.


| Compound ID | Name | Logarithm of EC50 | Predicted Value | R2pred |
|---|---|---|---|---|
| 4 | Benzoylmesaconine | 1.6989 | 0.9903 | 0.8320 |
| 9 | Benzoyldeoxyaconine | 0 | −0.7386 | |
| 12 | Benzoylaconine | 0 | 0.2778 | |
| 13 | Aconine | 1.6989 | 2.6849 |
| Compounds | 1 μM | 10 μM | 30 μM | 100 μM |
|---|---|---|---|---|
| Delsoline | 118.06 ± 5.91 | 117.42 ± 1.29 | 112.26 ± 1.12 | 97.42 ± 3.10 |
| Fuziling | 117.42 ± 3.42 | 103.23 ± 3.24 | 127.74 ± 3.55 | 110.32 ± 3.52 |
| Songorine | 110.97 ± 3.96 | 93.55 ± 6.35 | 70.97 ± 3.41 | 58.71 ± 0.65 |
| Minocycline a | 91.67 ± 4.27 | 88.73 ± 3.22 | 73.04 ± 2.45 | 40.20 ± 3.07 |
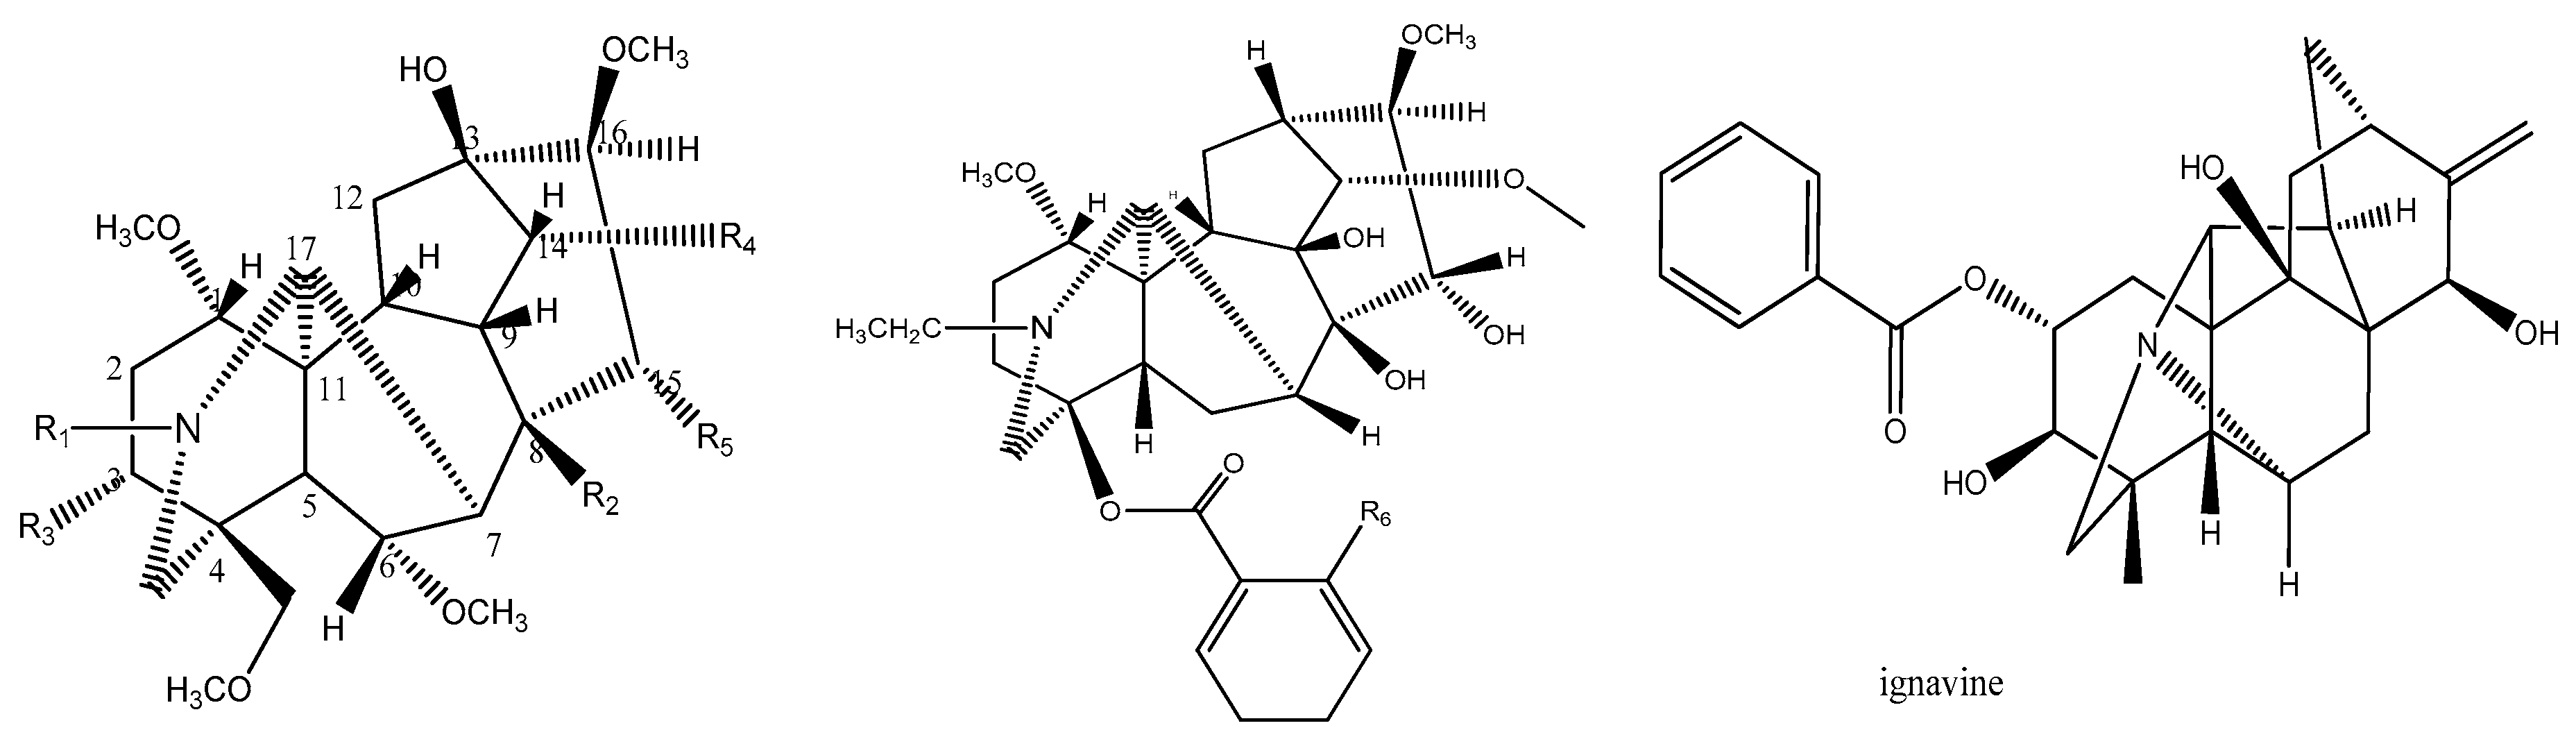
| NO. | Compounds | R1 | R2 | R3 | R4 | R5 | R6 | Log(EC50) |
|---|---|---|---|---|---|---|---|---|
| 1 | Deoxyaconitine | CH3CH2 | CH3COO | H | C6H5COO | OH | −0.699 | |
| 2 | Hypaconitine | CH3 | OH | H | C6H5COO | OH | −0.301 | |
| 3 | Aconitine | CH3CH2 | CH3COO | OH | C6H5COO | OH | −0.301 | |
| 4 * | Benzoylmesaconine | CH3 | OH | OH | C6H5COO | OH | 1.699 | |
| 5 | Mesaconitine | CH3 | CH3COO | OH | C6H5COO | OH | −0.301 | |
| 6 | Benzoylhypaconine | CH3 | OH | H | C6H5COO | OH | 2 | |
| 7 | 3-Acetylaconitine | CH3CH2 | CH3COO | CH3COO | C6H5COO | OH | −1 | |
| 8 | Bulleyaconitine | CH3CH2 | CH3COO | H | OOCC6H4OCH3 | OH | −0.699 | |
| 9 * | Benzoyldeoxyaconine | CH3CH2 | OH | H | C6H5COO | OH | 0 | |
| 10 | Yunaconitine | CH3CH2 | CH3COO | OH | OOCC6H4OCH3 | H | 1.301 | |
| 11 | Ignavine | 2 | ||||||
| 12 * | Benzoylaconine | CH3CH2 | OH | OH | C6H5COO | OH | 0 | |
| 13 * | Aconine | CH3CH2 | OH | OH | OH | OH | 1.699 | |
| 14 | Lappaconine | NHCOCH3 | 0.778 | |||||
| 15 | N-Deacetyllappaconitine | NH2 | 1.176 |
© 2017 by the authors. Licensee MDPI, Basel, Switzerland. This article is an open access article distributed under the terms and conditions of the Creative Commons Attribution (CC BY) license ( http://creativecommons.org/licenses/by/4.0/).
Share and Cite
Li, X.; Li, N.; Sui, Z.; Bi, K.; Li, Z. An Investigation on the Quantitative Structure-Activity Relationships of the Anti-Inflammatory Activity of Diterpenoid Alkaloids. Molecules 2017, 22, 363. https://doi.org/10.3390/molecules22030363
Li X, Li N, Sui Z, Bi K, Li Z. An Investigation on the Quantitative Structure-Activity Relationships of the Anti-Inflammatory Activity of Diterpenoid Alkaloids. Molecules. 2017; 22(3):363. https://doi.org/10.3390/molecules22030363
Chicago/Turabian StyleLi, Xiao, Ning Li, Zhenyu Sui, Kaishun Bi, and Zuojing Li. 2017. "An Investigation on the Quantitative Structure-Activity Relationships of the Anti-Inflammatory Activity of Diterpenoid Alkaloids" Molecules 22, no. 3: 363. https://doi.org/10.3390/molecules22030363